Have a personal or library account? Click to login
Diurnal and inter-annual variability of surface ozone in Baicheng region, China Cover

Diurnal and inter-annual variability of surface ozone in Baicheng region, China

By: ,  ,   and    
Open Access
|Jan 2021

Figures & Tables

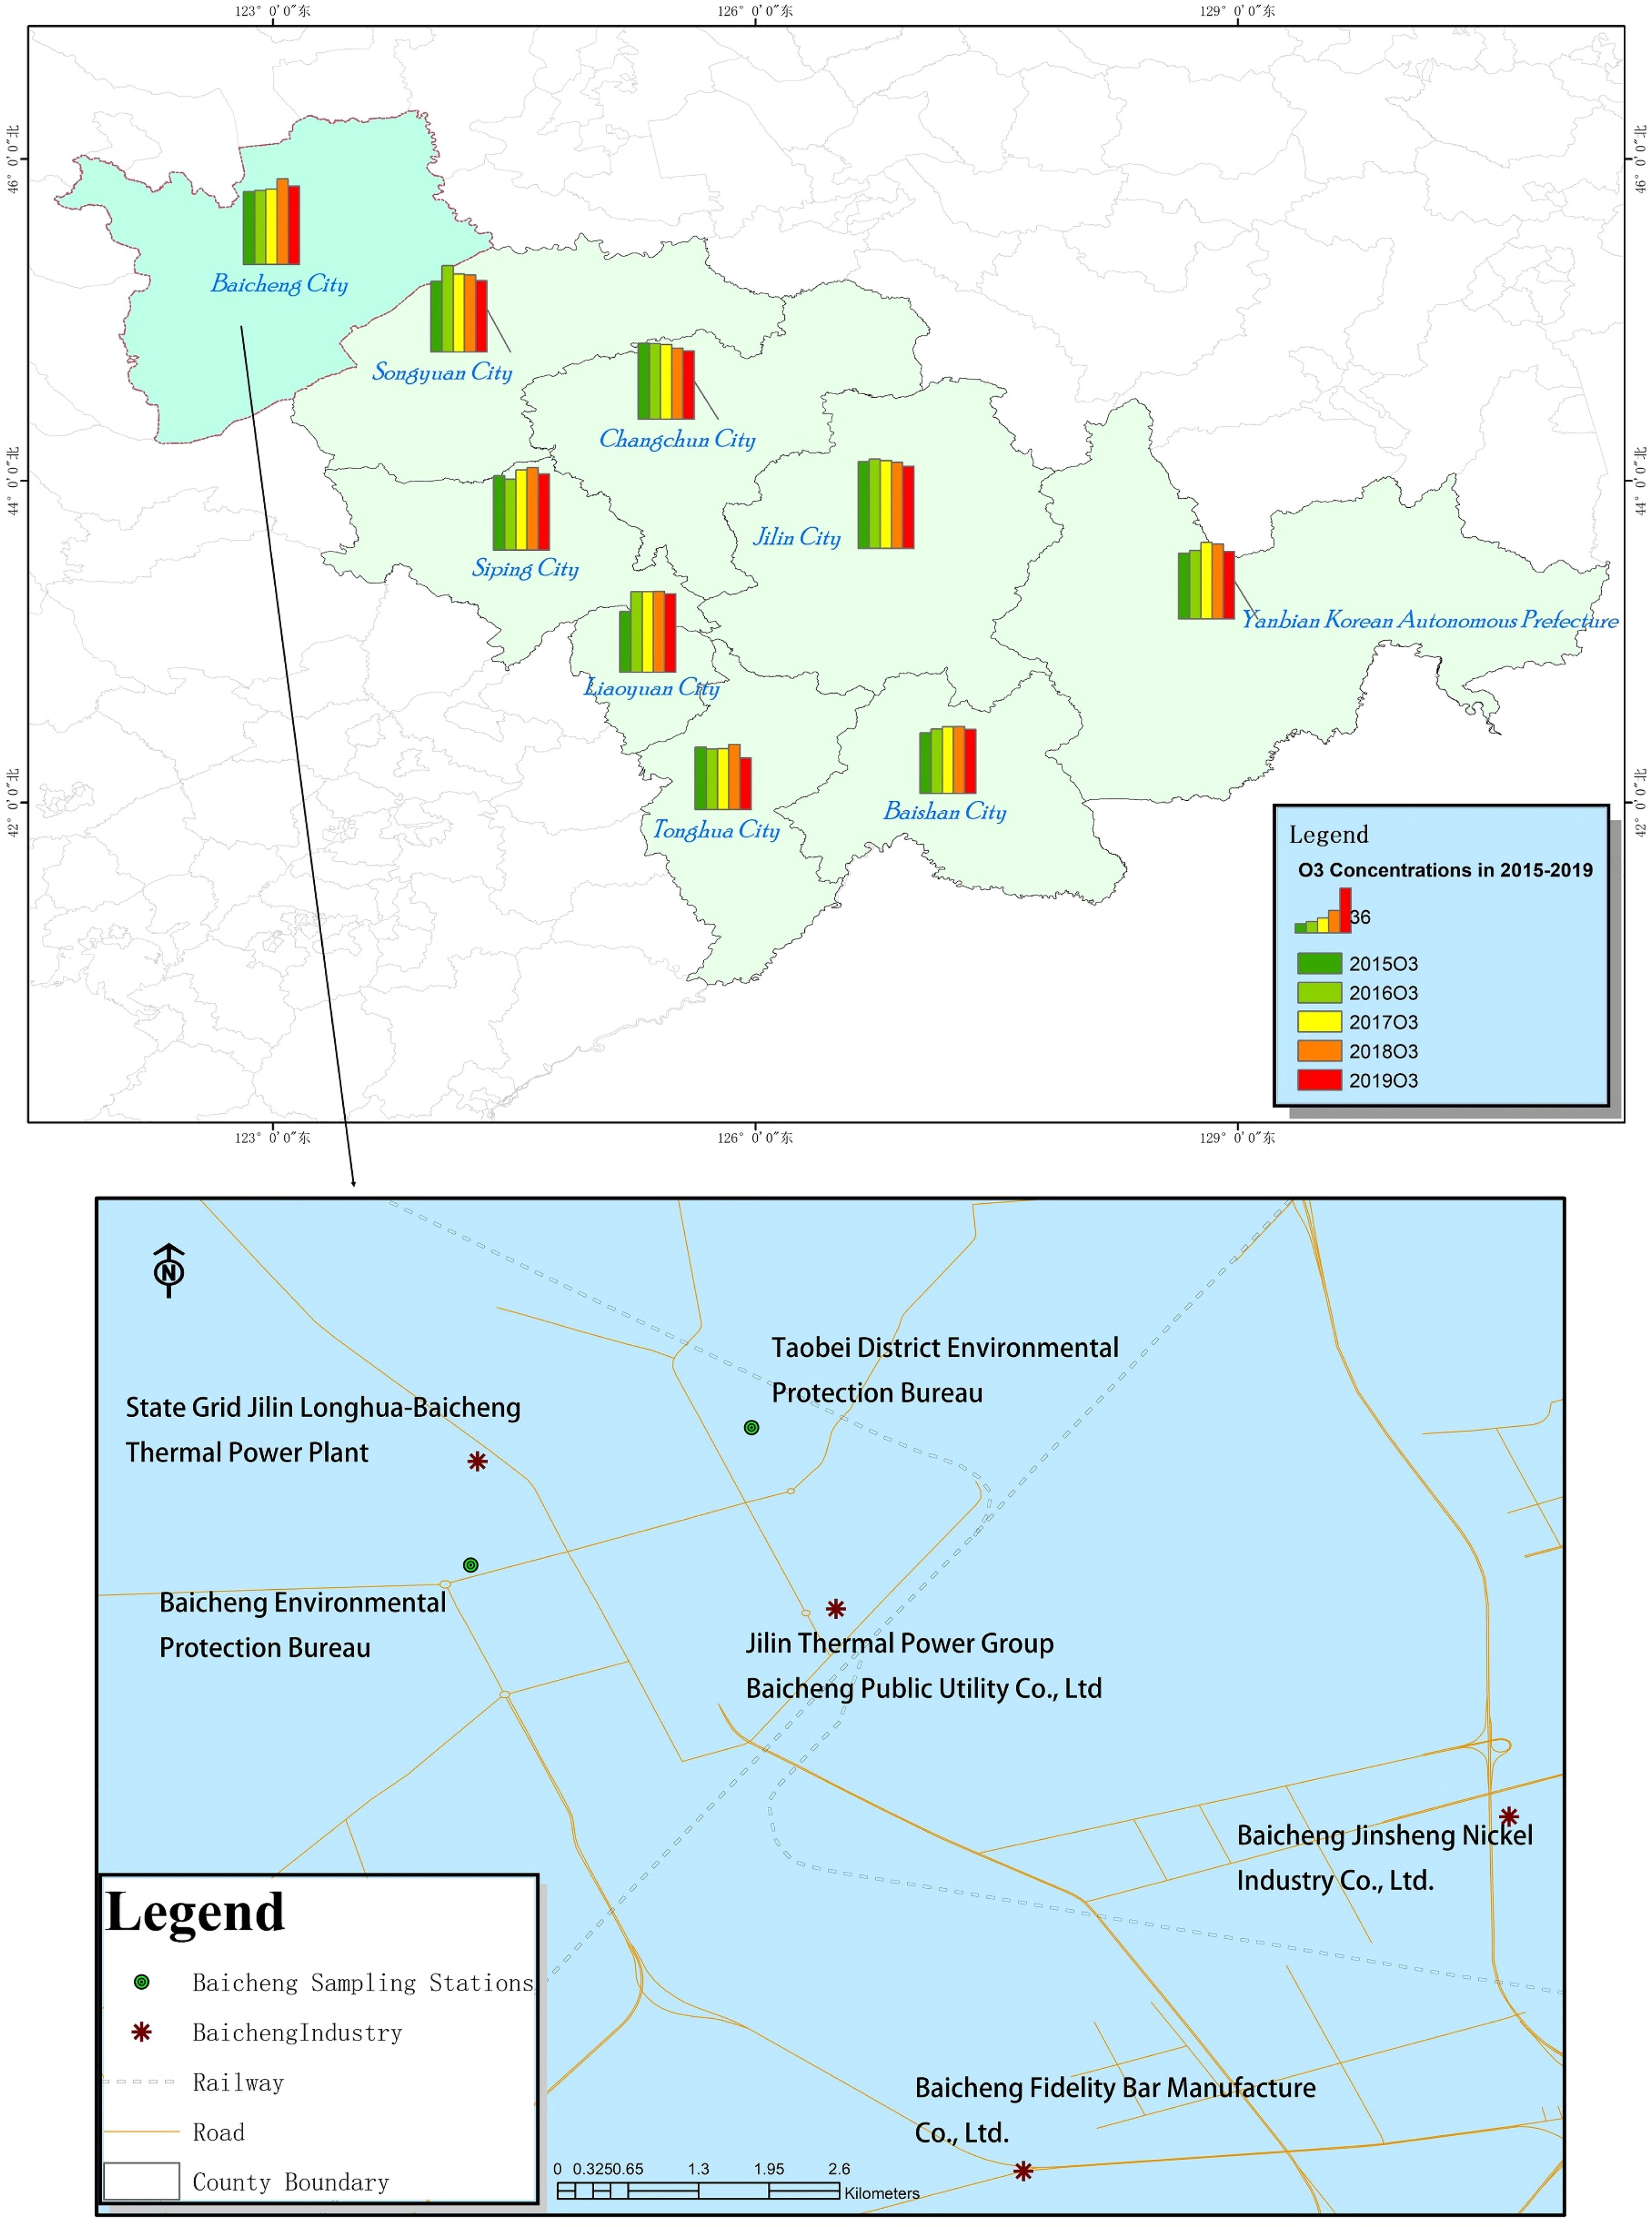
Fig. 1.

Changes in ozone concentration in Jilin province between 2015 and 2019.

Table 1.

Comprehensive indicators of various pollutants in 2015–2019.
PollutantMinMaxMeanSDO3 (μg/m3)172138331SO2 (μg/m3)1691210NO2 (μg/m3)267189CO (mg/m3)0.11.90.60.3PM10 (μg/m3)48736246PM2.5 (μg/m3)23133829
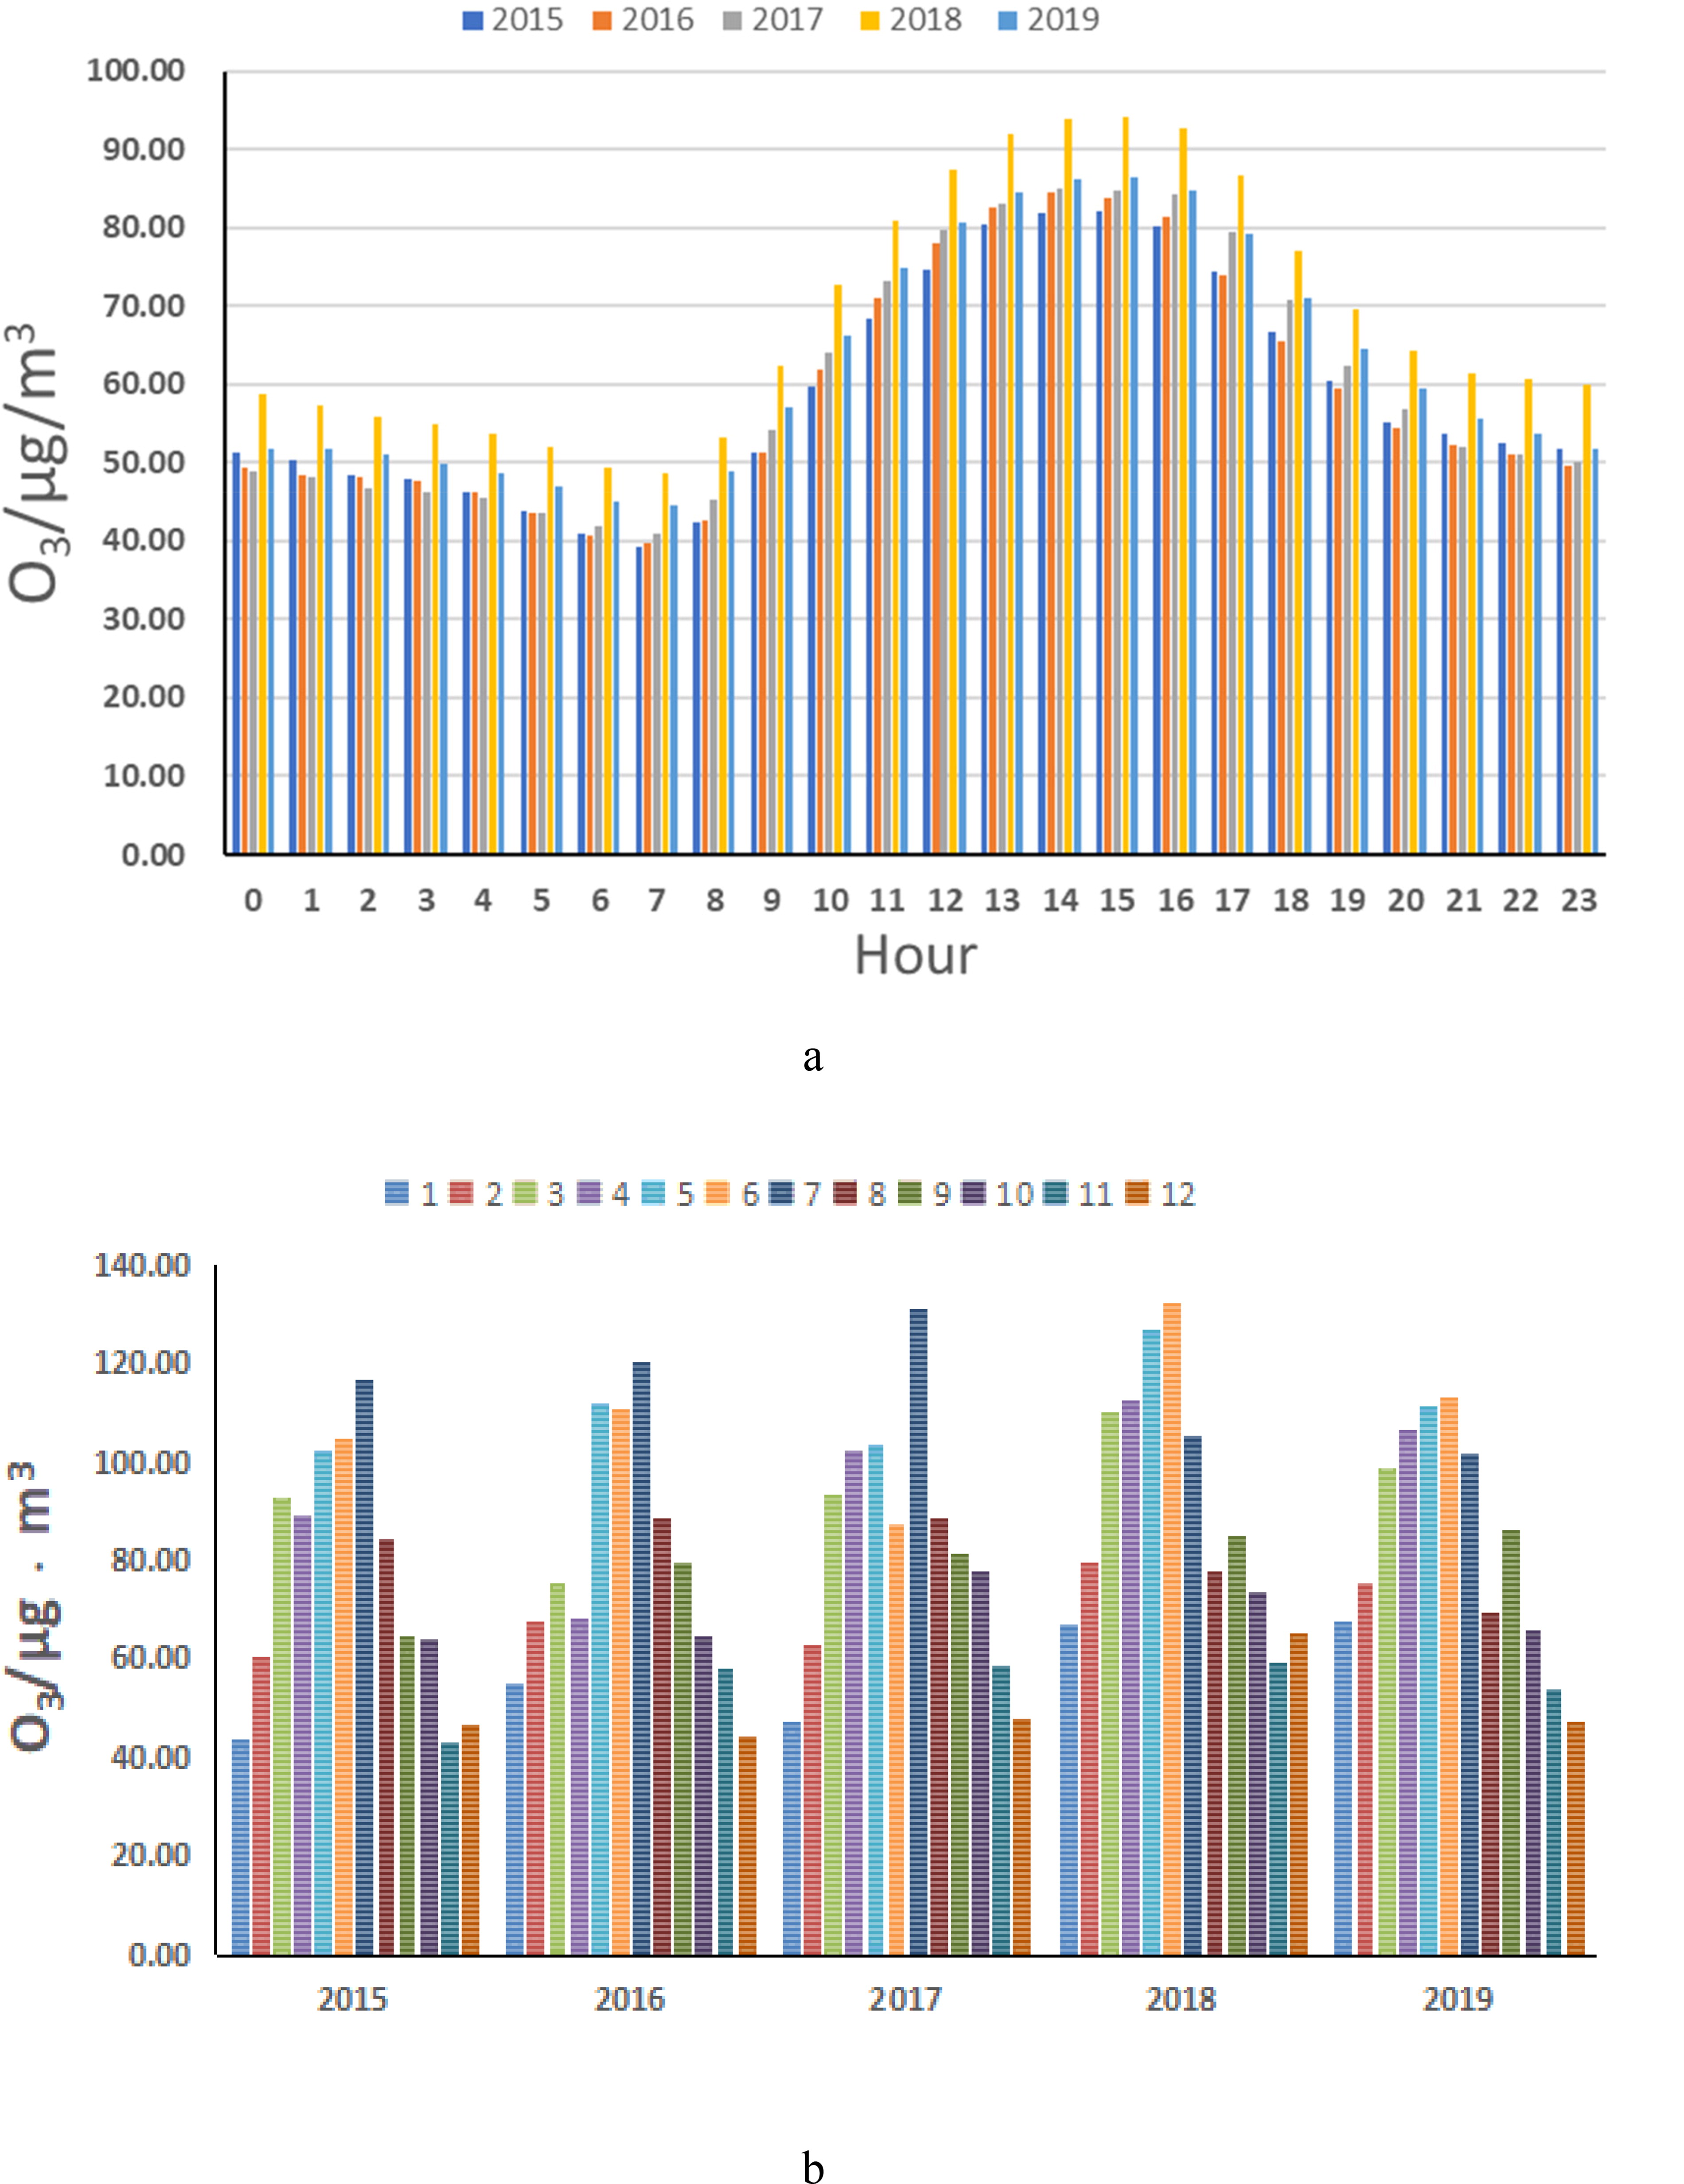
Fig. 2.

Diurnal (a) and monthly (b) mean O3 concentration in five years.
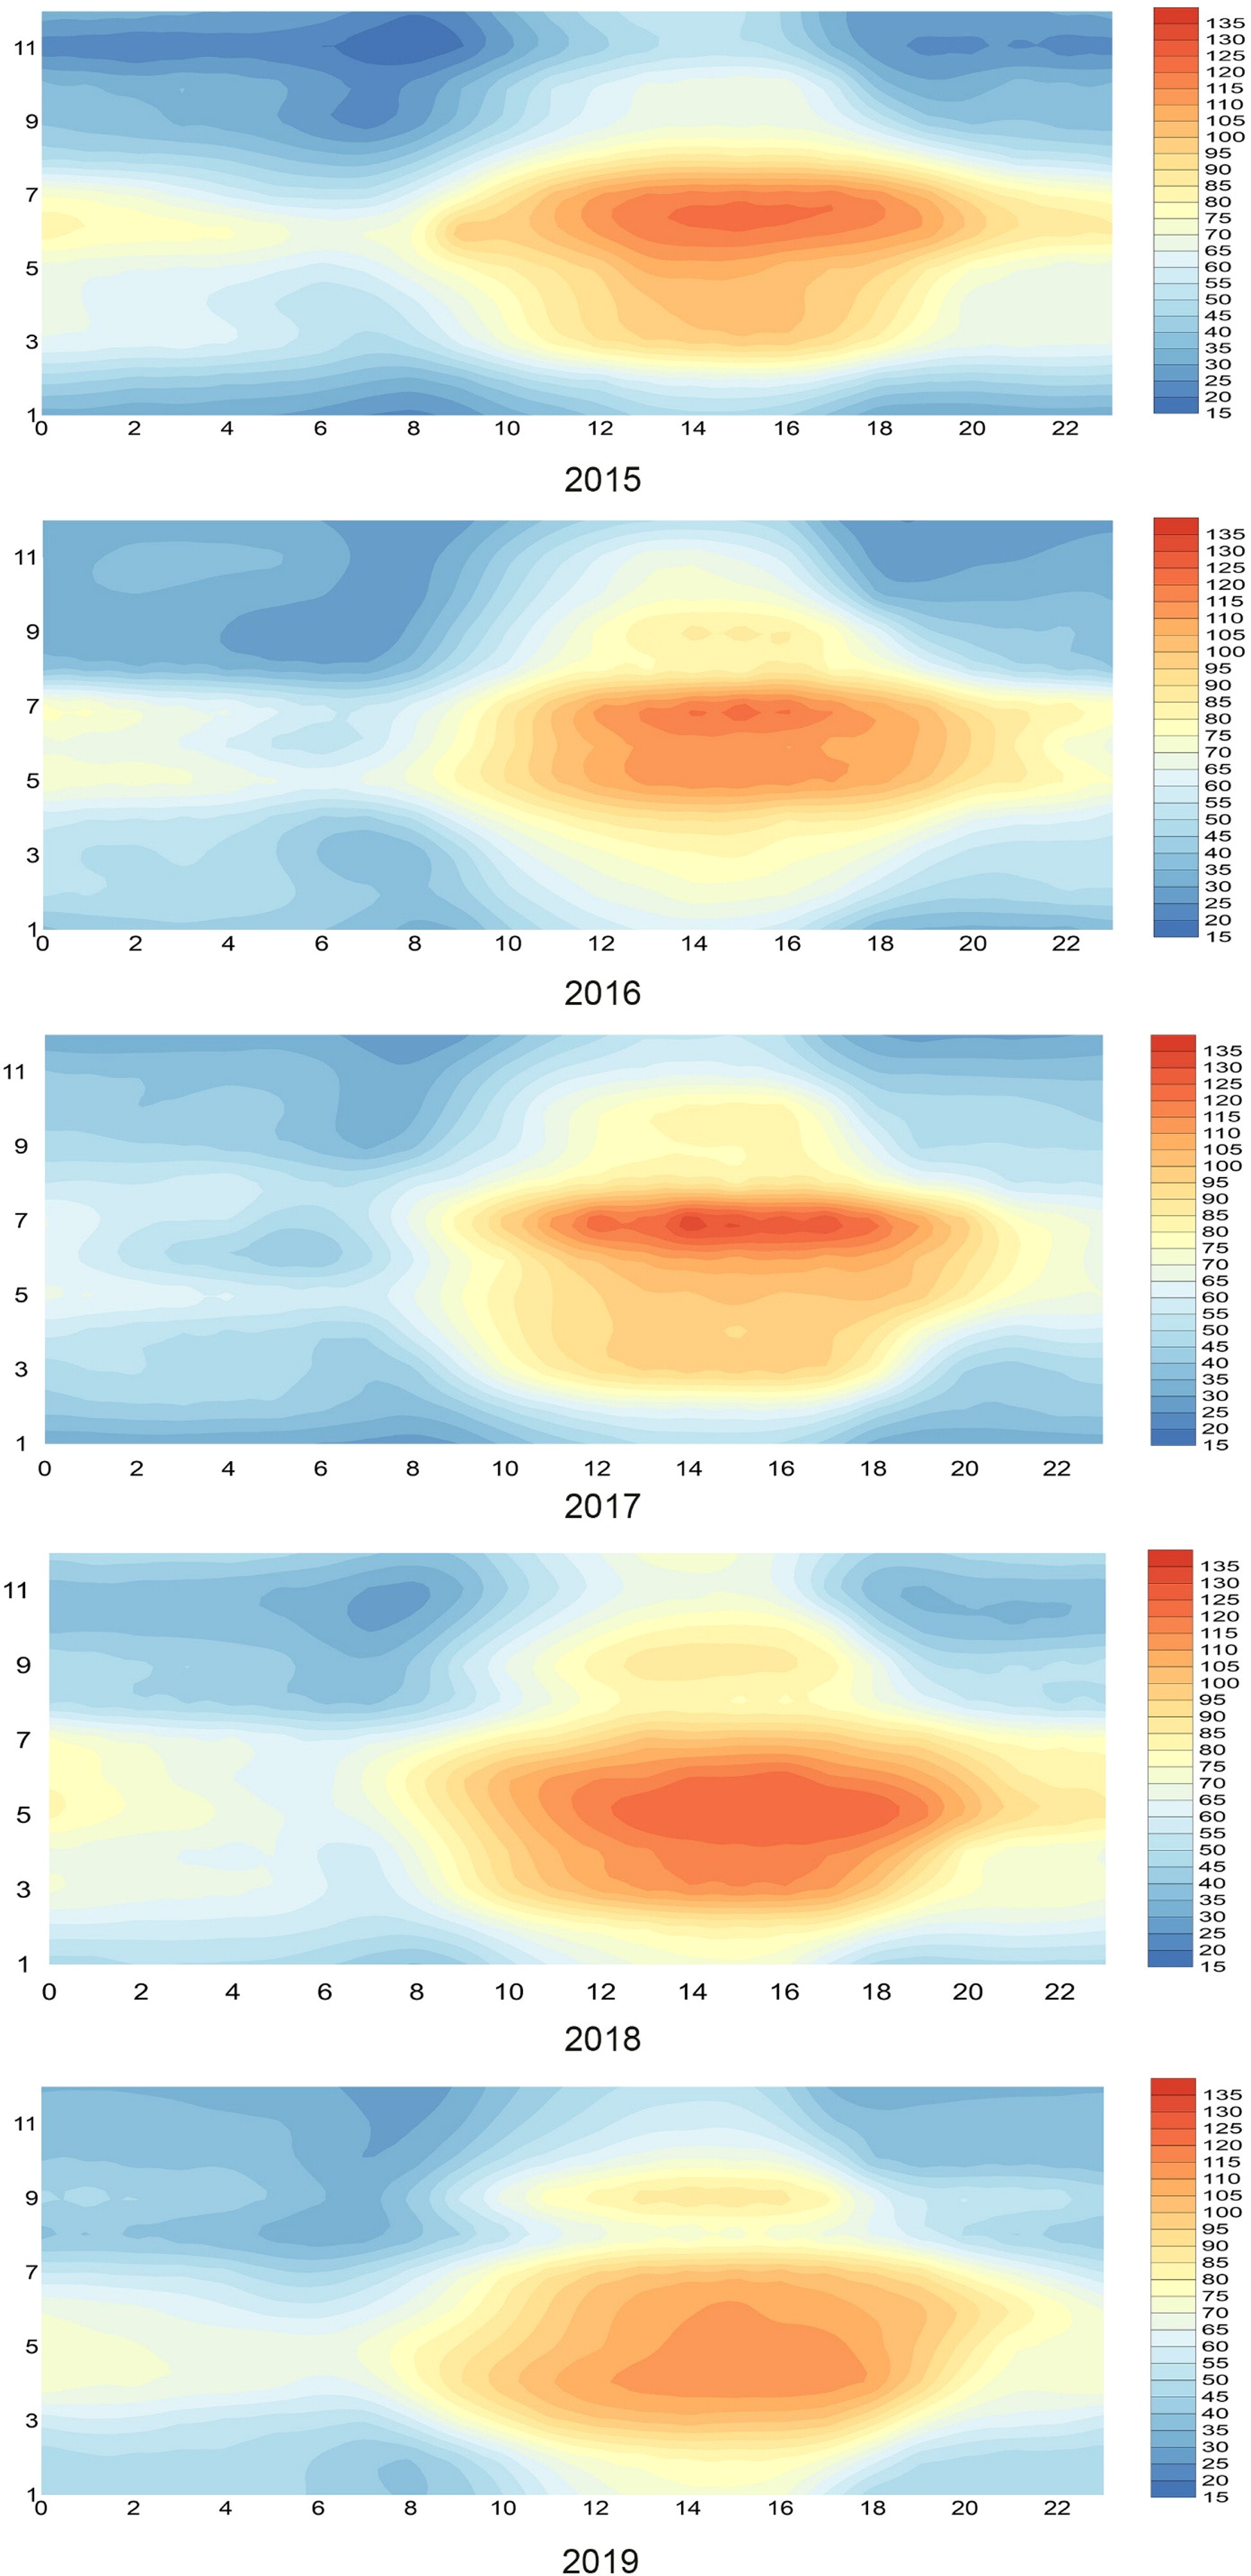
Fig. 3.

24-hour average monthly concentration change chart for 2015–2019. Y axis represents month, X axis represents time.
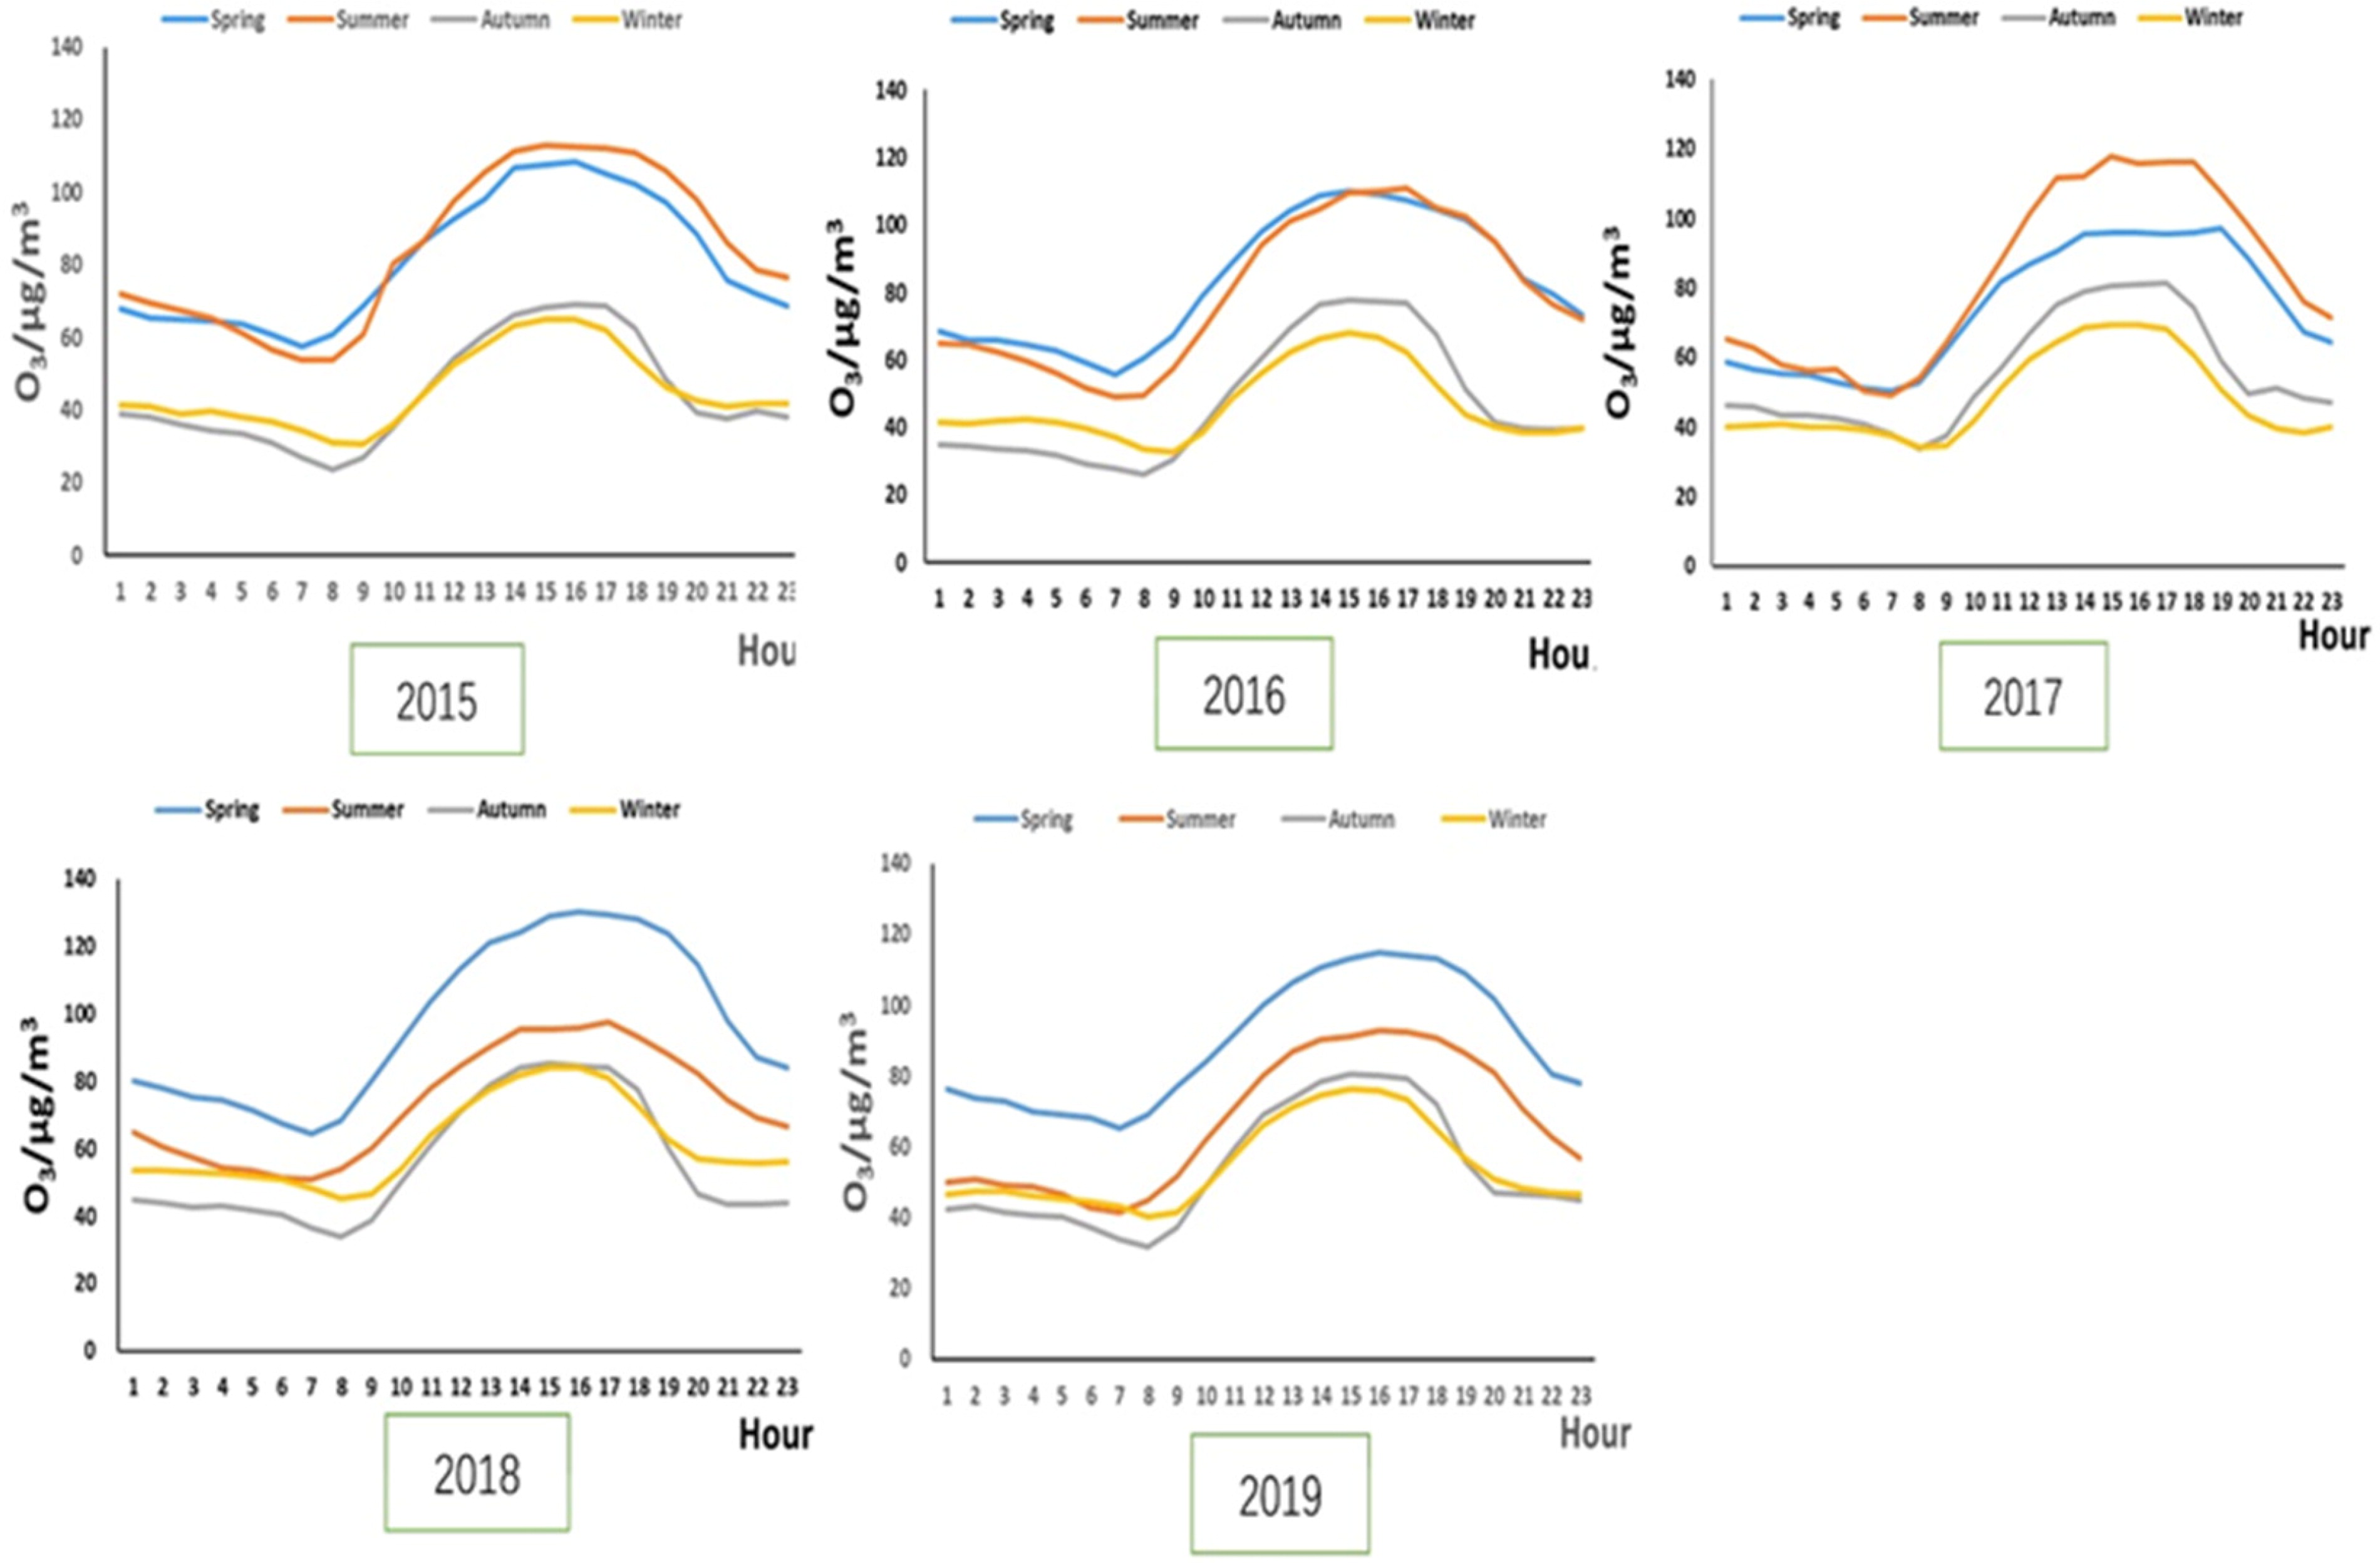
Fig. 4.

Seasonal variation of O3 concentration for 2015–2019.
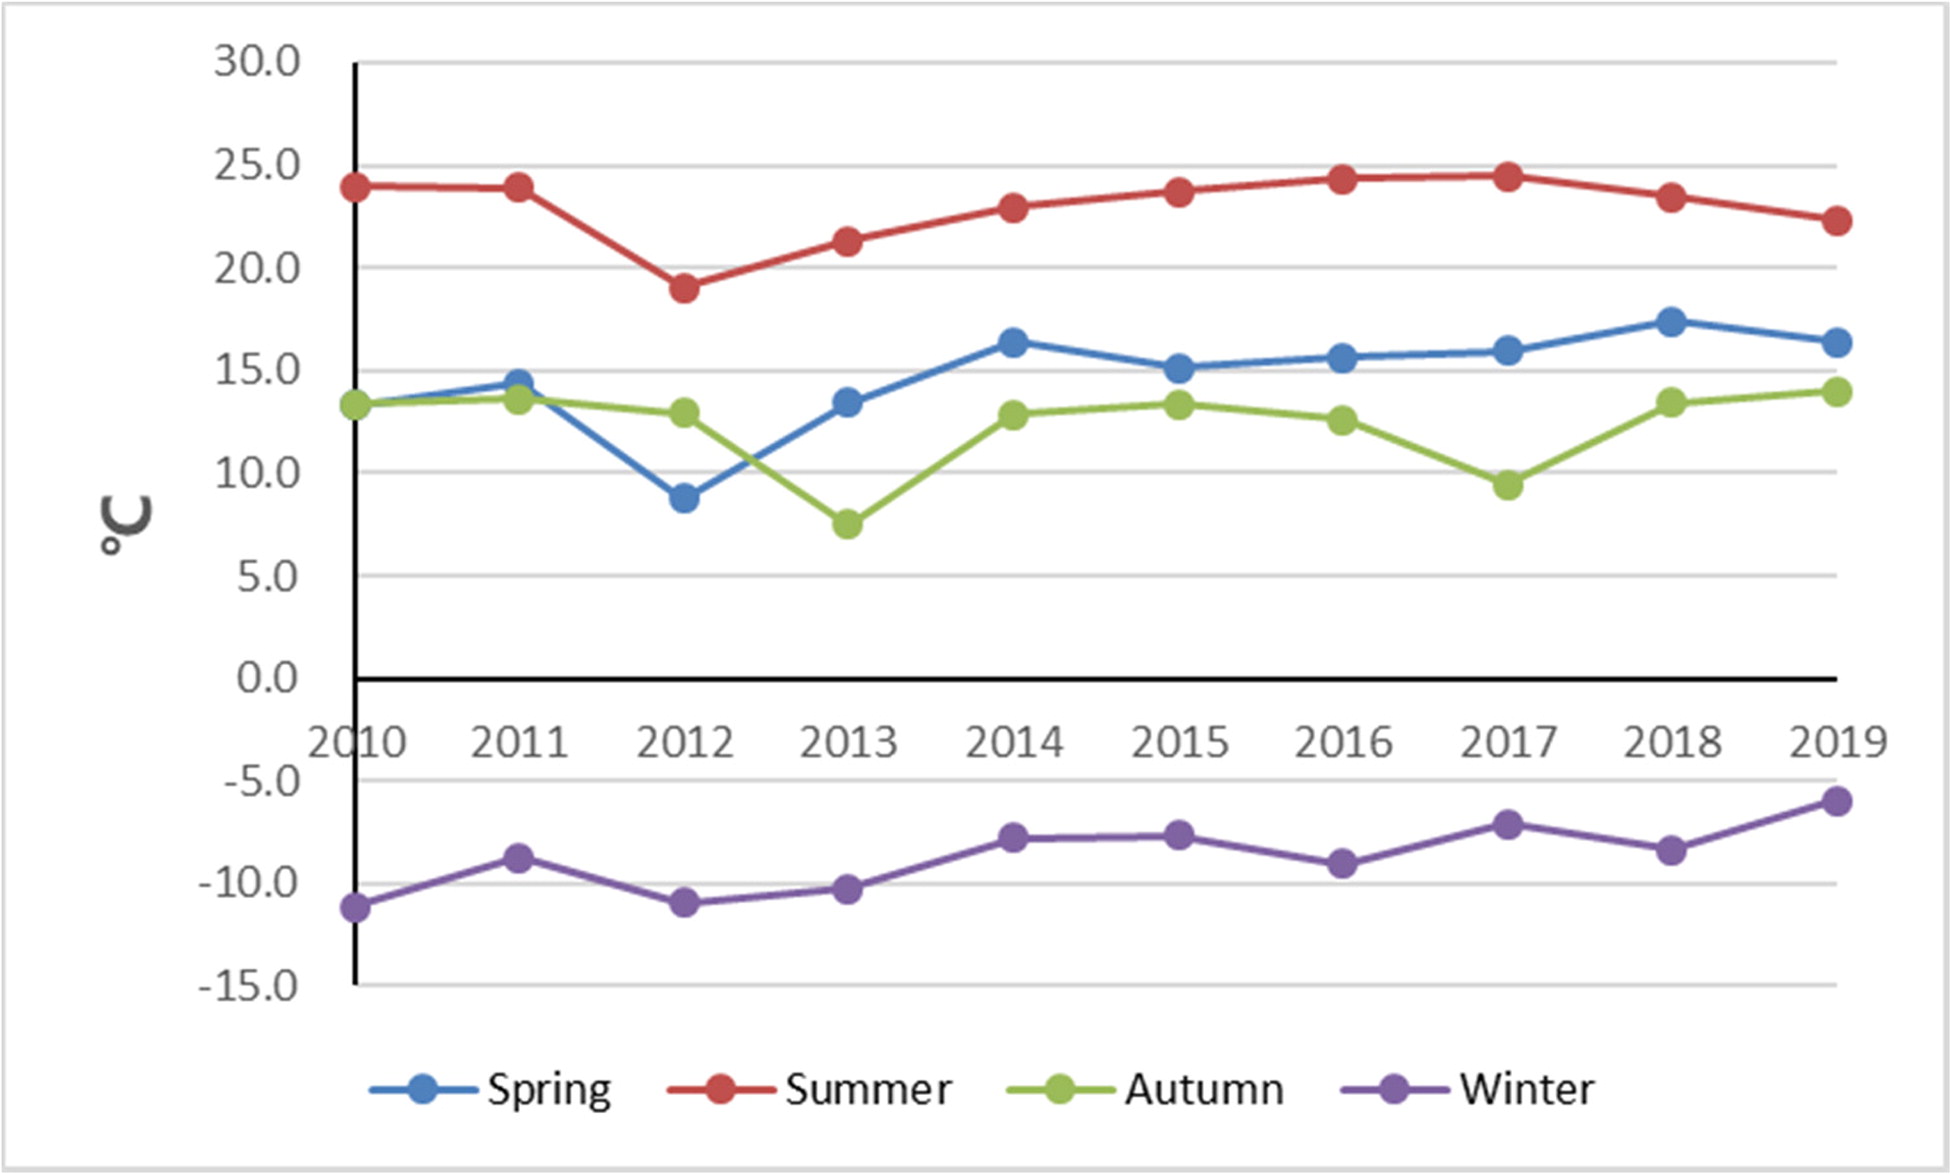
Fig. 5.

Seasonal variation of average temperature for 2010–2019.
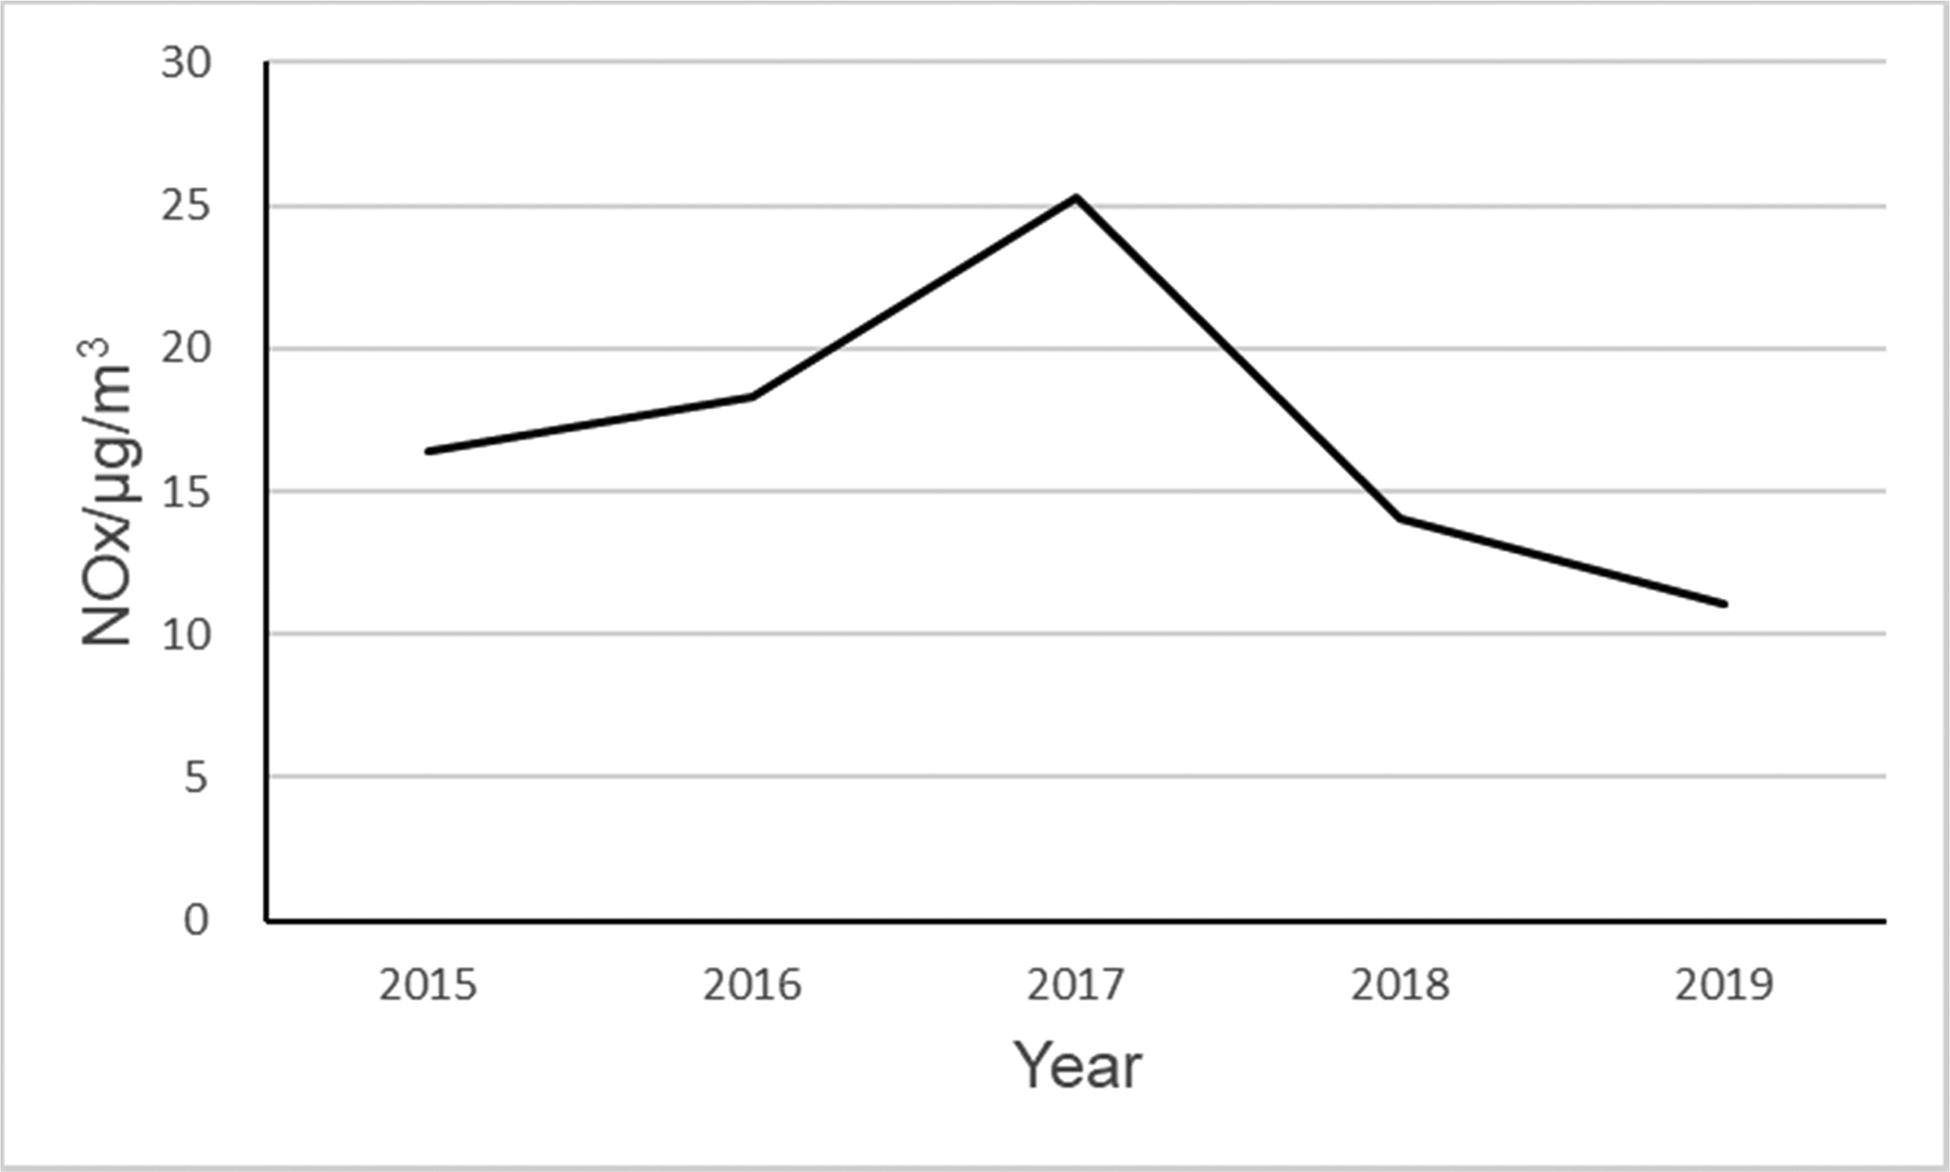
Fig. 6.

Spring variation of NOx for 2015–2019.
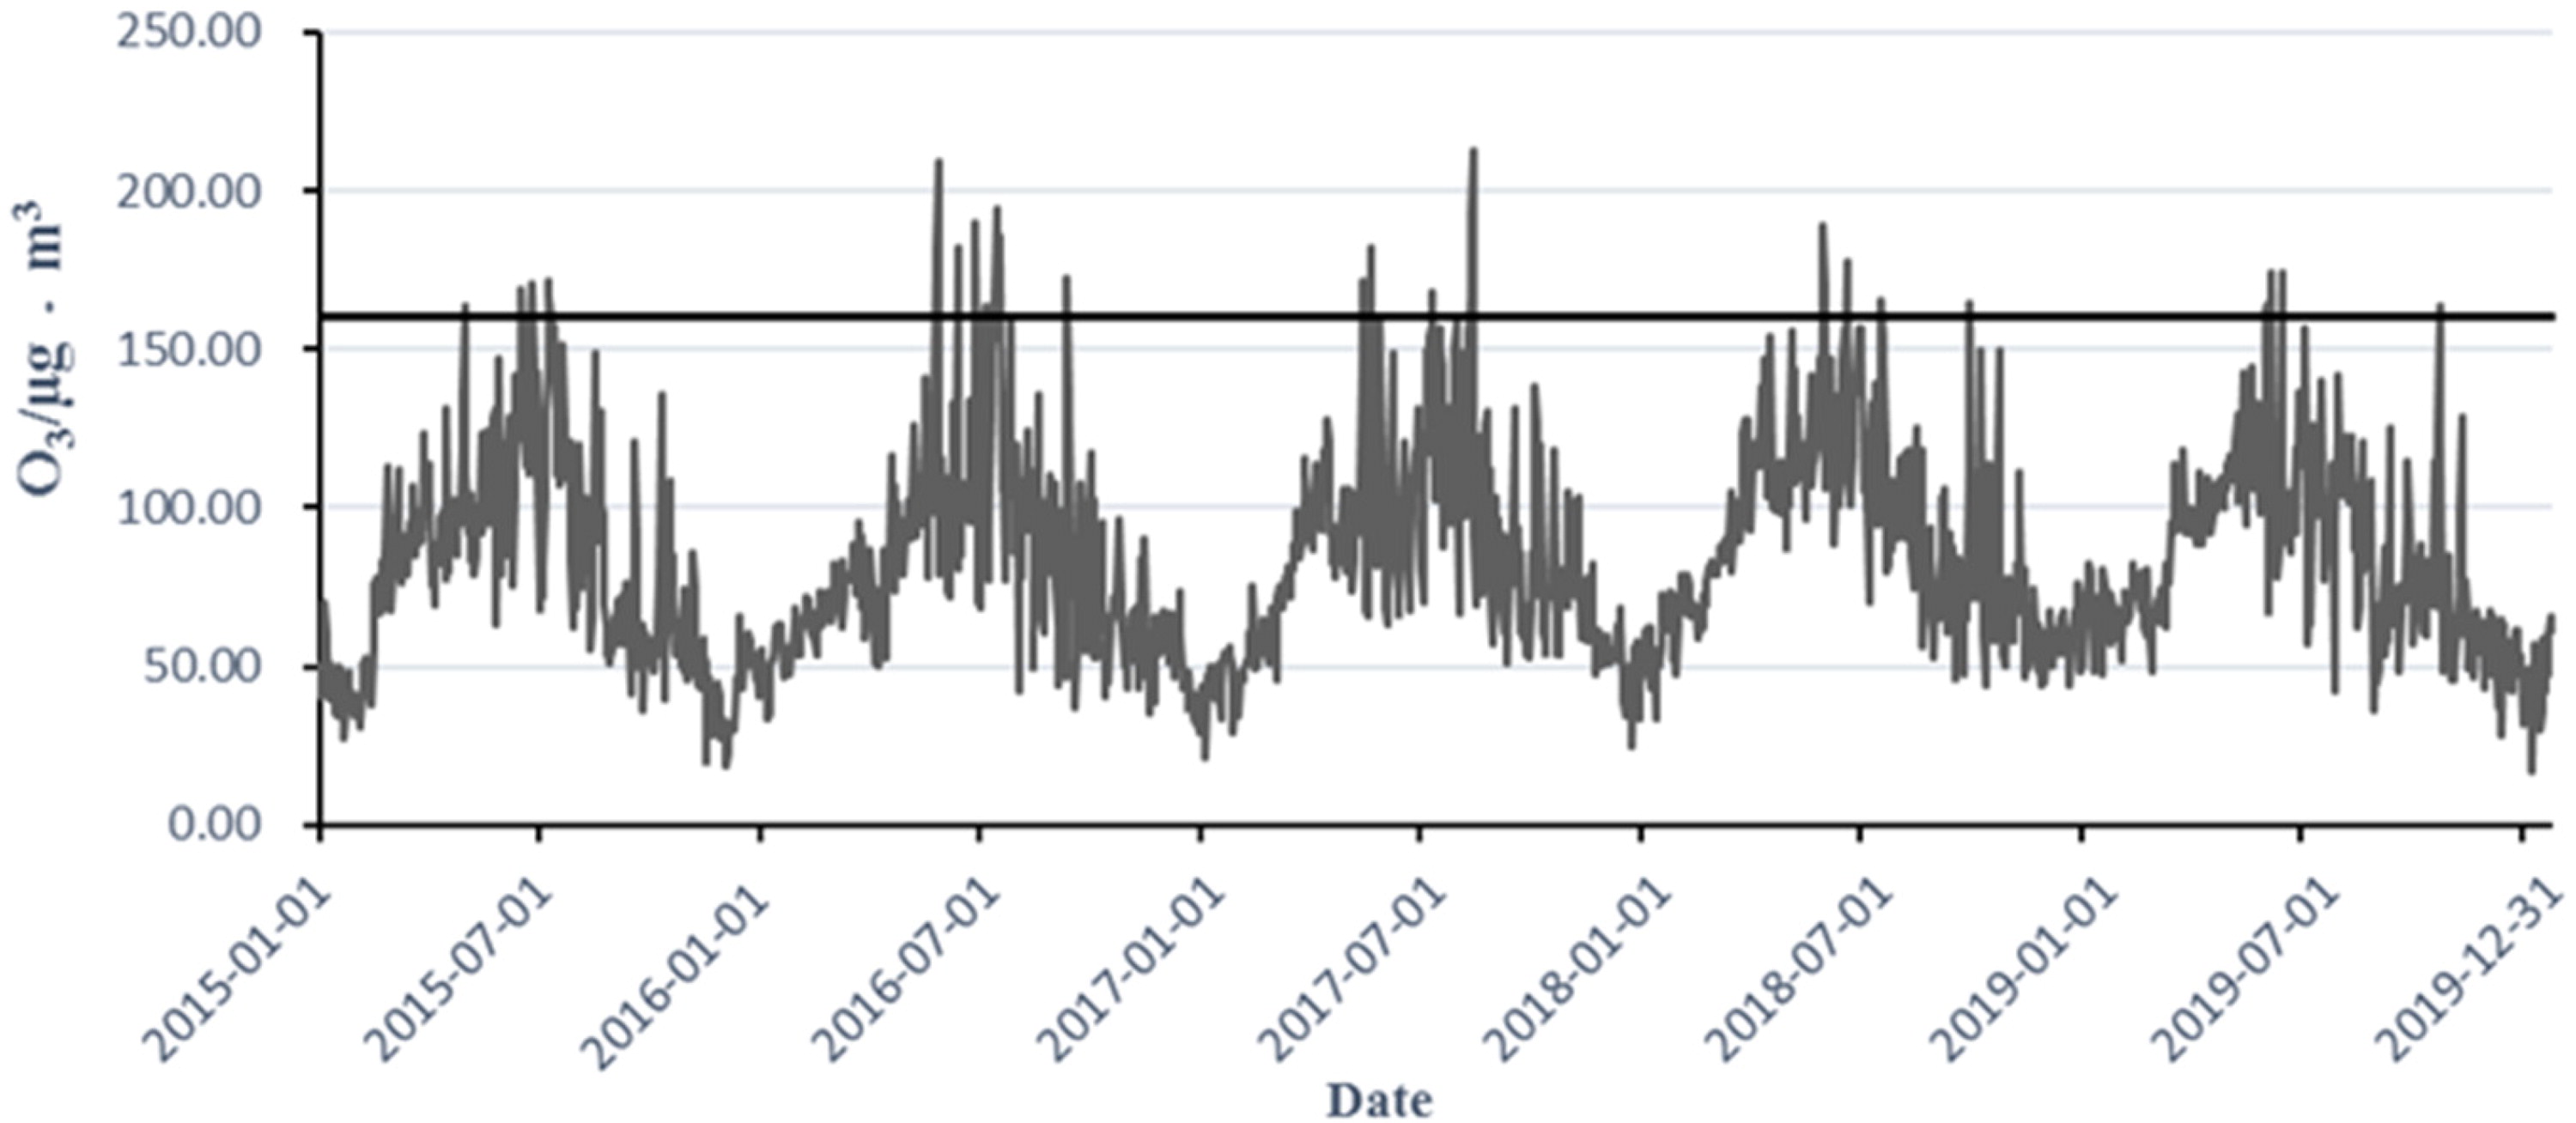
Fig. 7.

2016–2018 ozone eight-hour moving average.
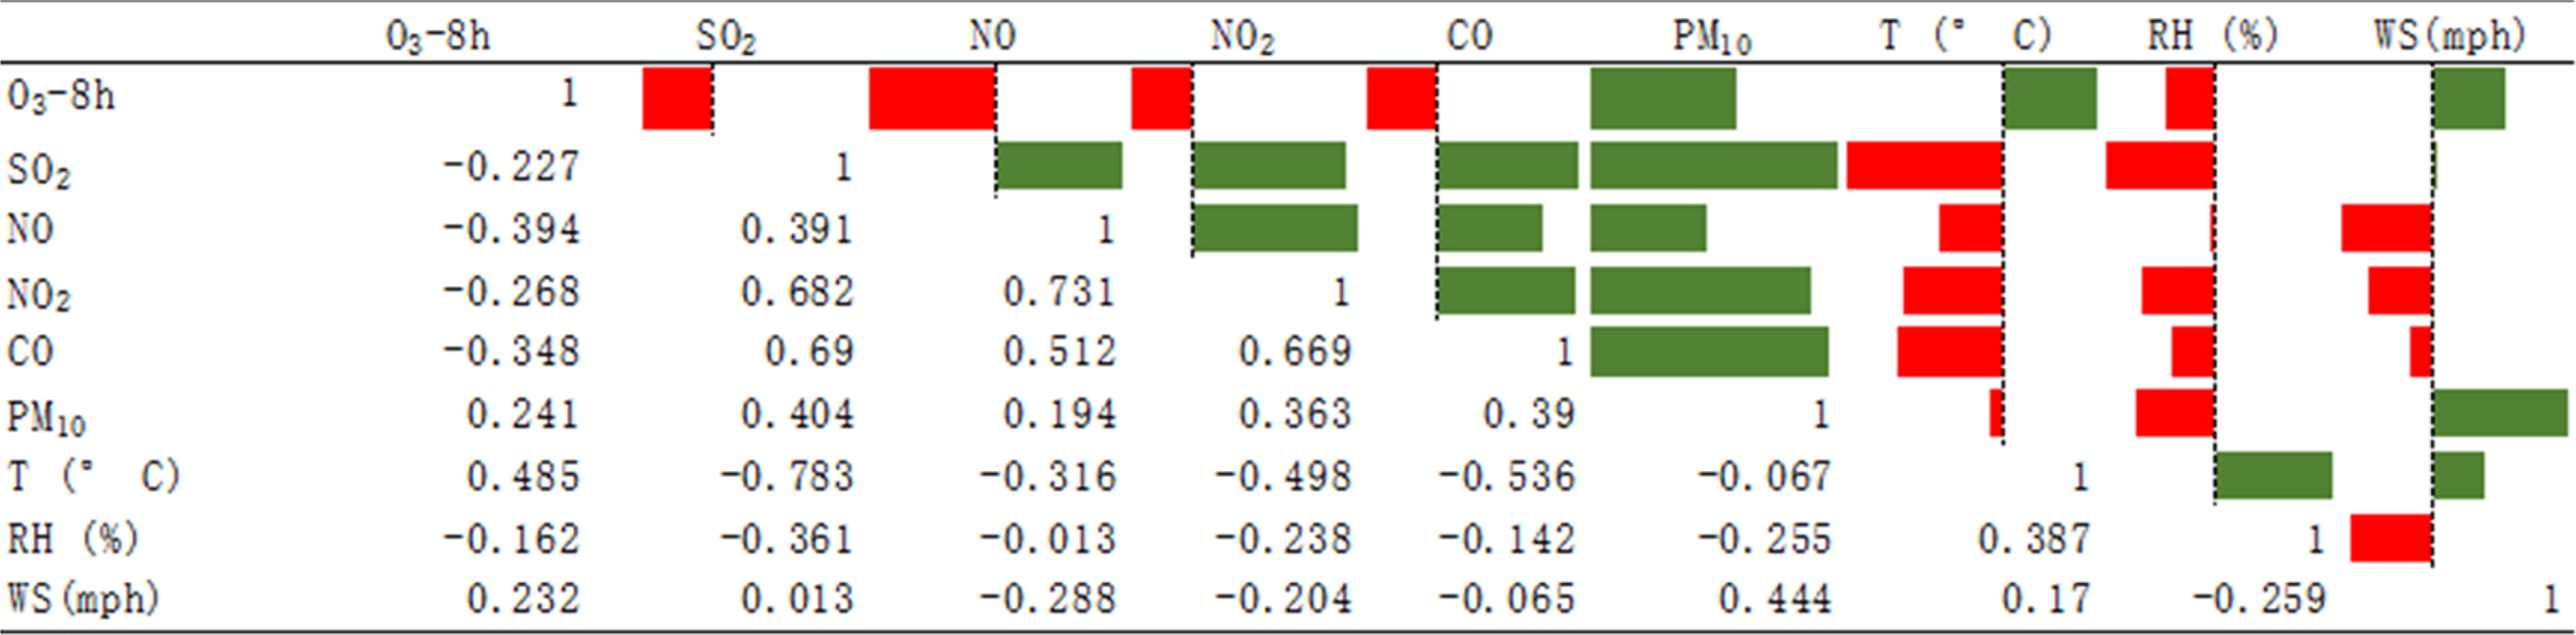
Fig. 8.

Correlation between ozone temperature and other indicators.
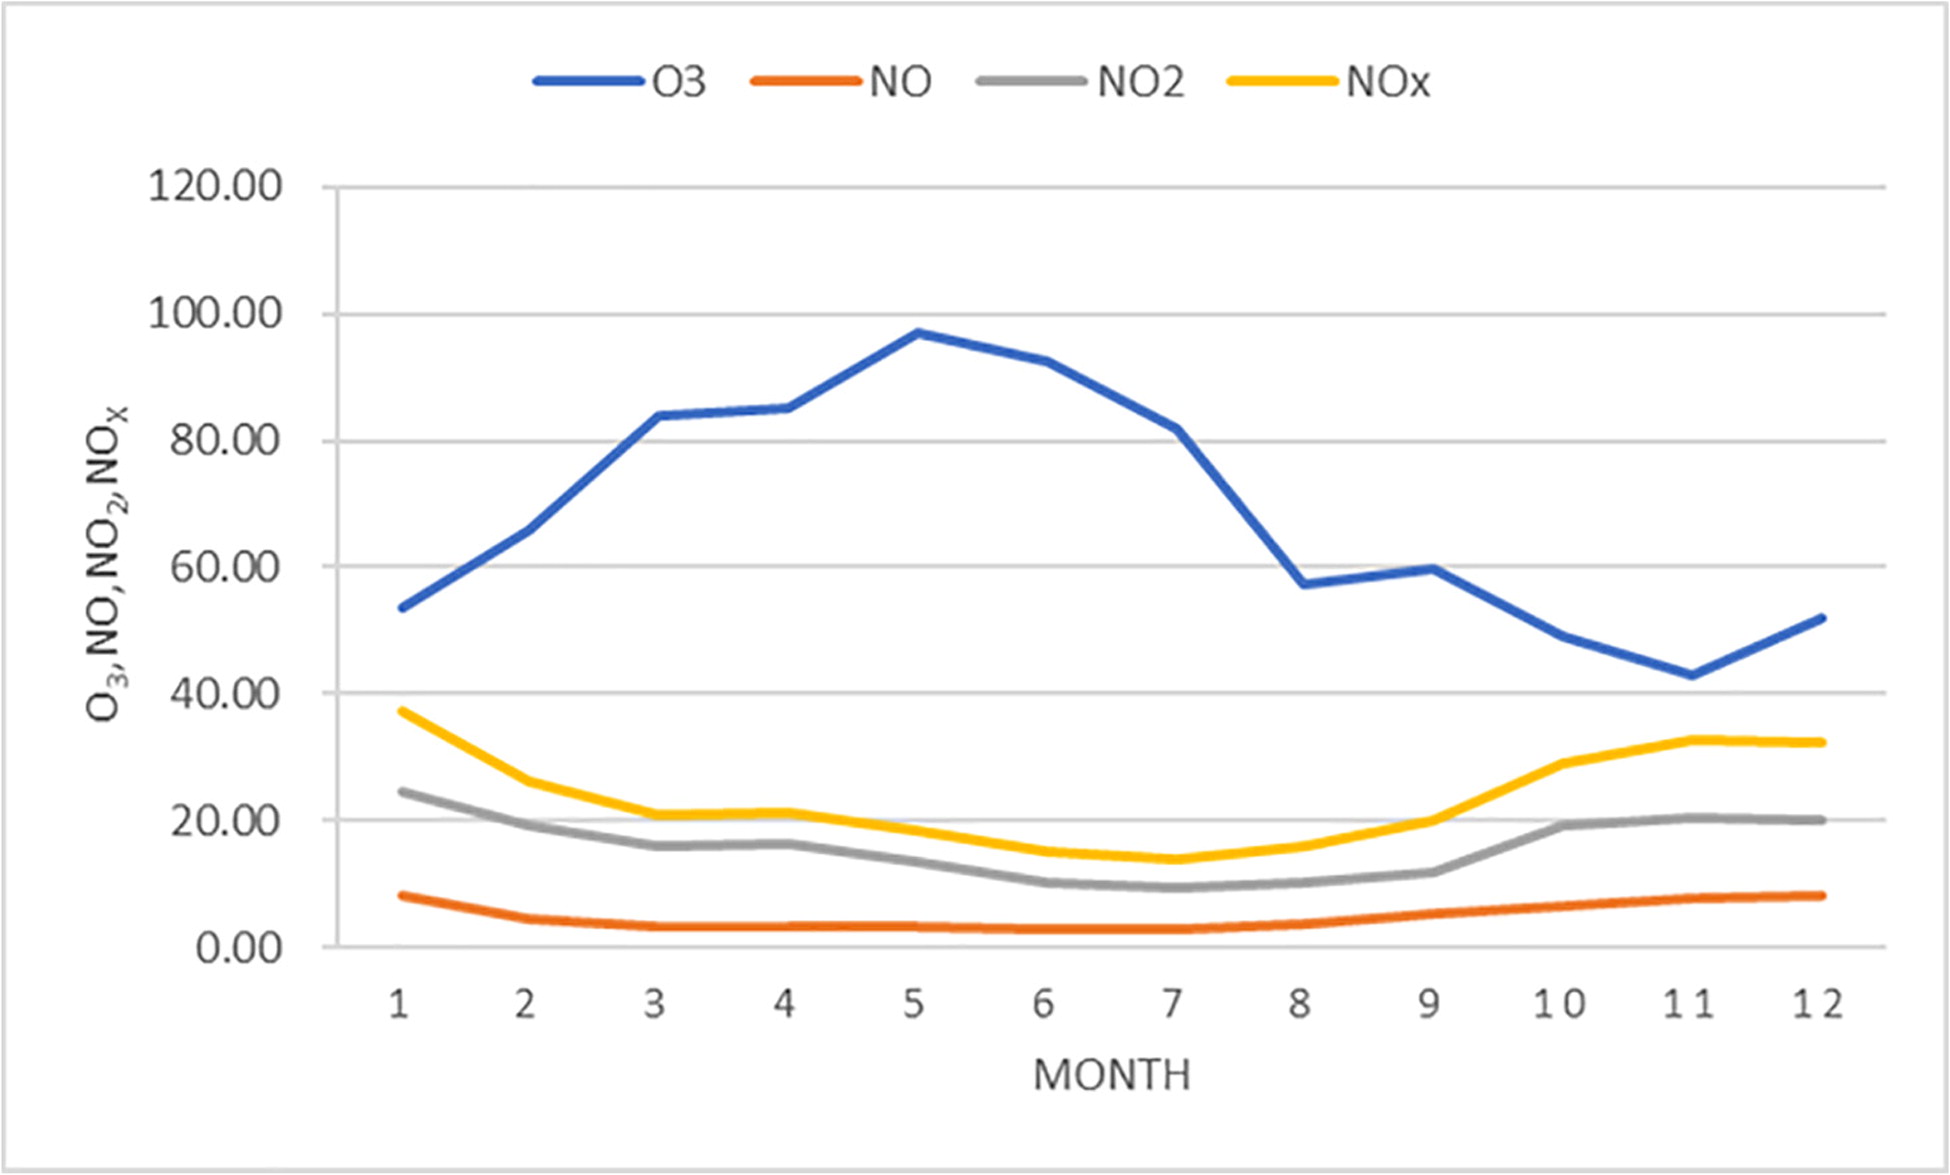
Fig. 9.

Monthly variation values of O3 with NO, NO2, and NOx.

Language: English
Page range: 1894879 - 1894879
Published on: Jan 1, 2021
Published by: Stockholm University Press
In partnership with: Paradigm Publishing Services

© 2021 Tingting Qin, Ju Wang, Ran Li, Chunsheng Fang, published by Stockholm University Press
This work is licensed under the Creative Commons Attribution 4.0 License.