
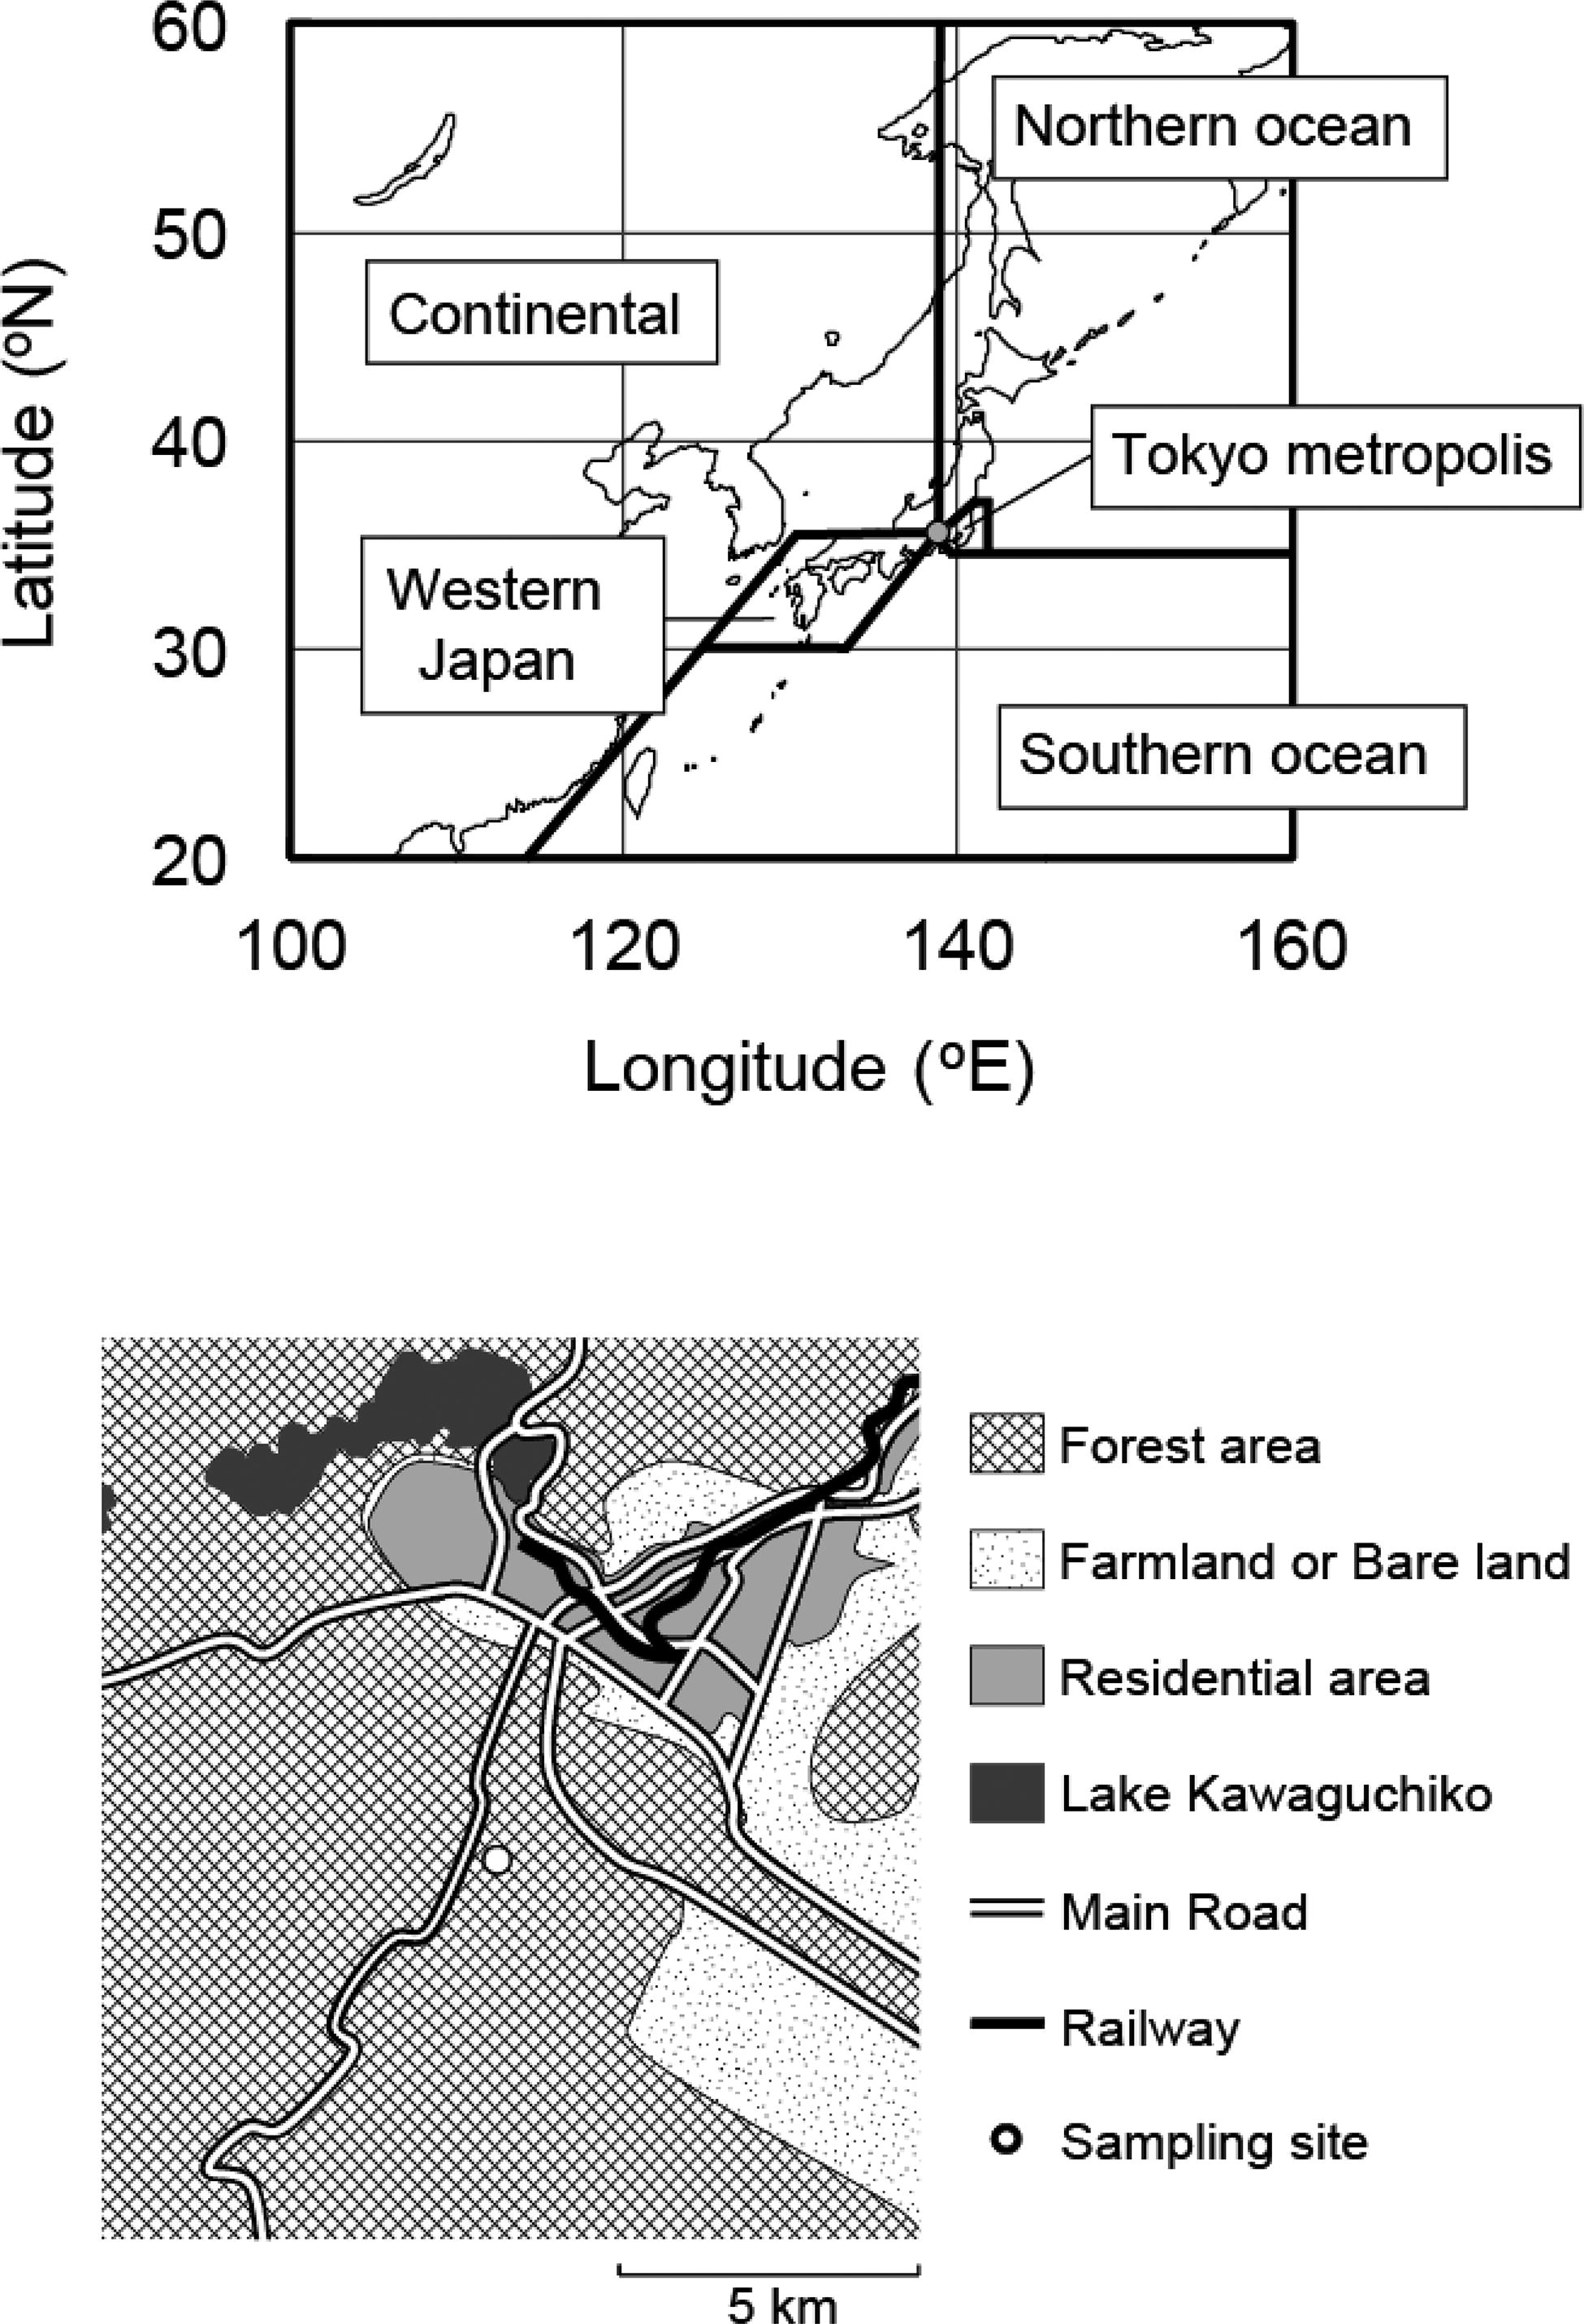
Figure 1.
Location of Fujiyoshida (gray circle) and sections for calculating the passing frequency of air mass trajectories (upper panel), and the map of the surrounding area of the sampling site (lower panel).
Table 1.
Concentrations of the WSON (unit; µg-N m−3), methylamine (MA) (ng-N m−3), and the nitrogen concentration ratios of MA/WSON (%).
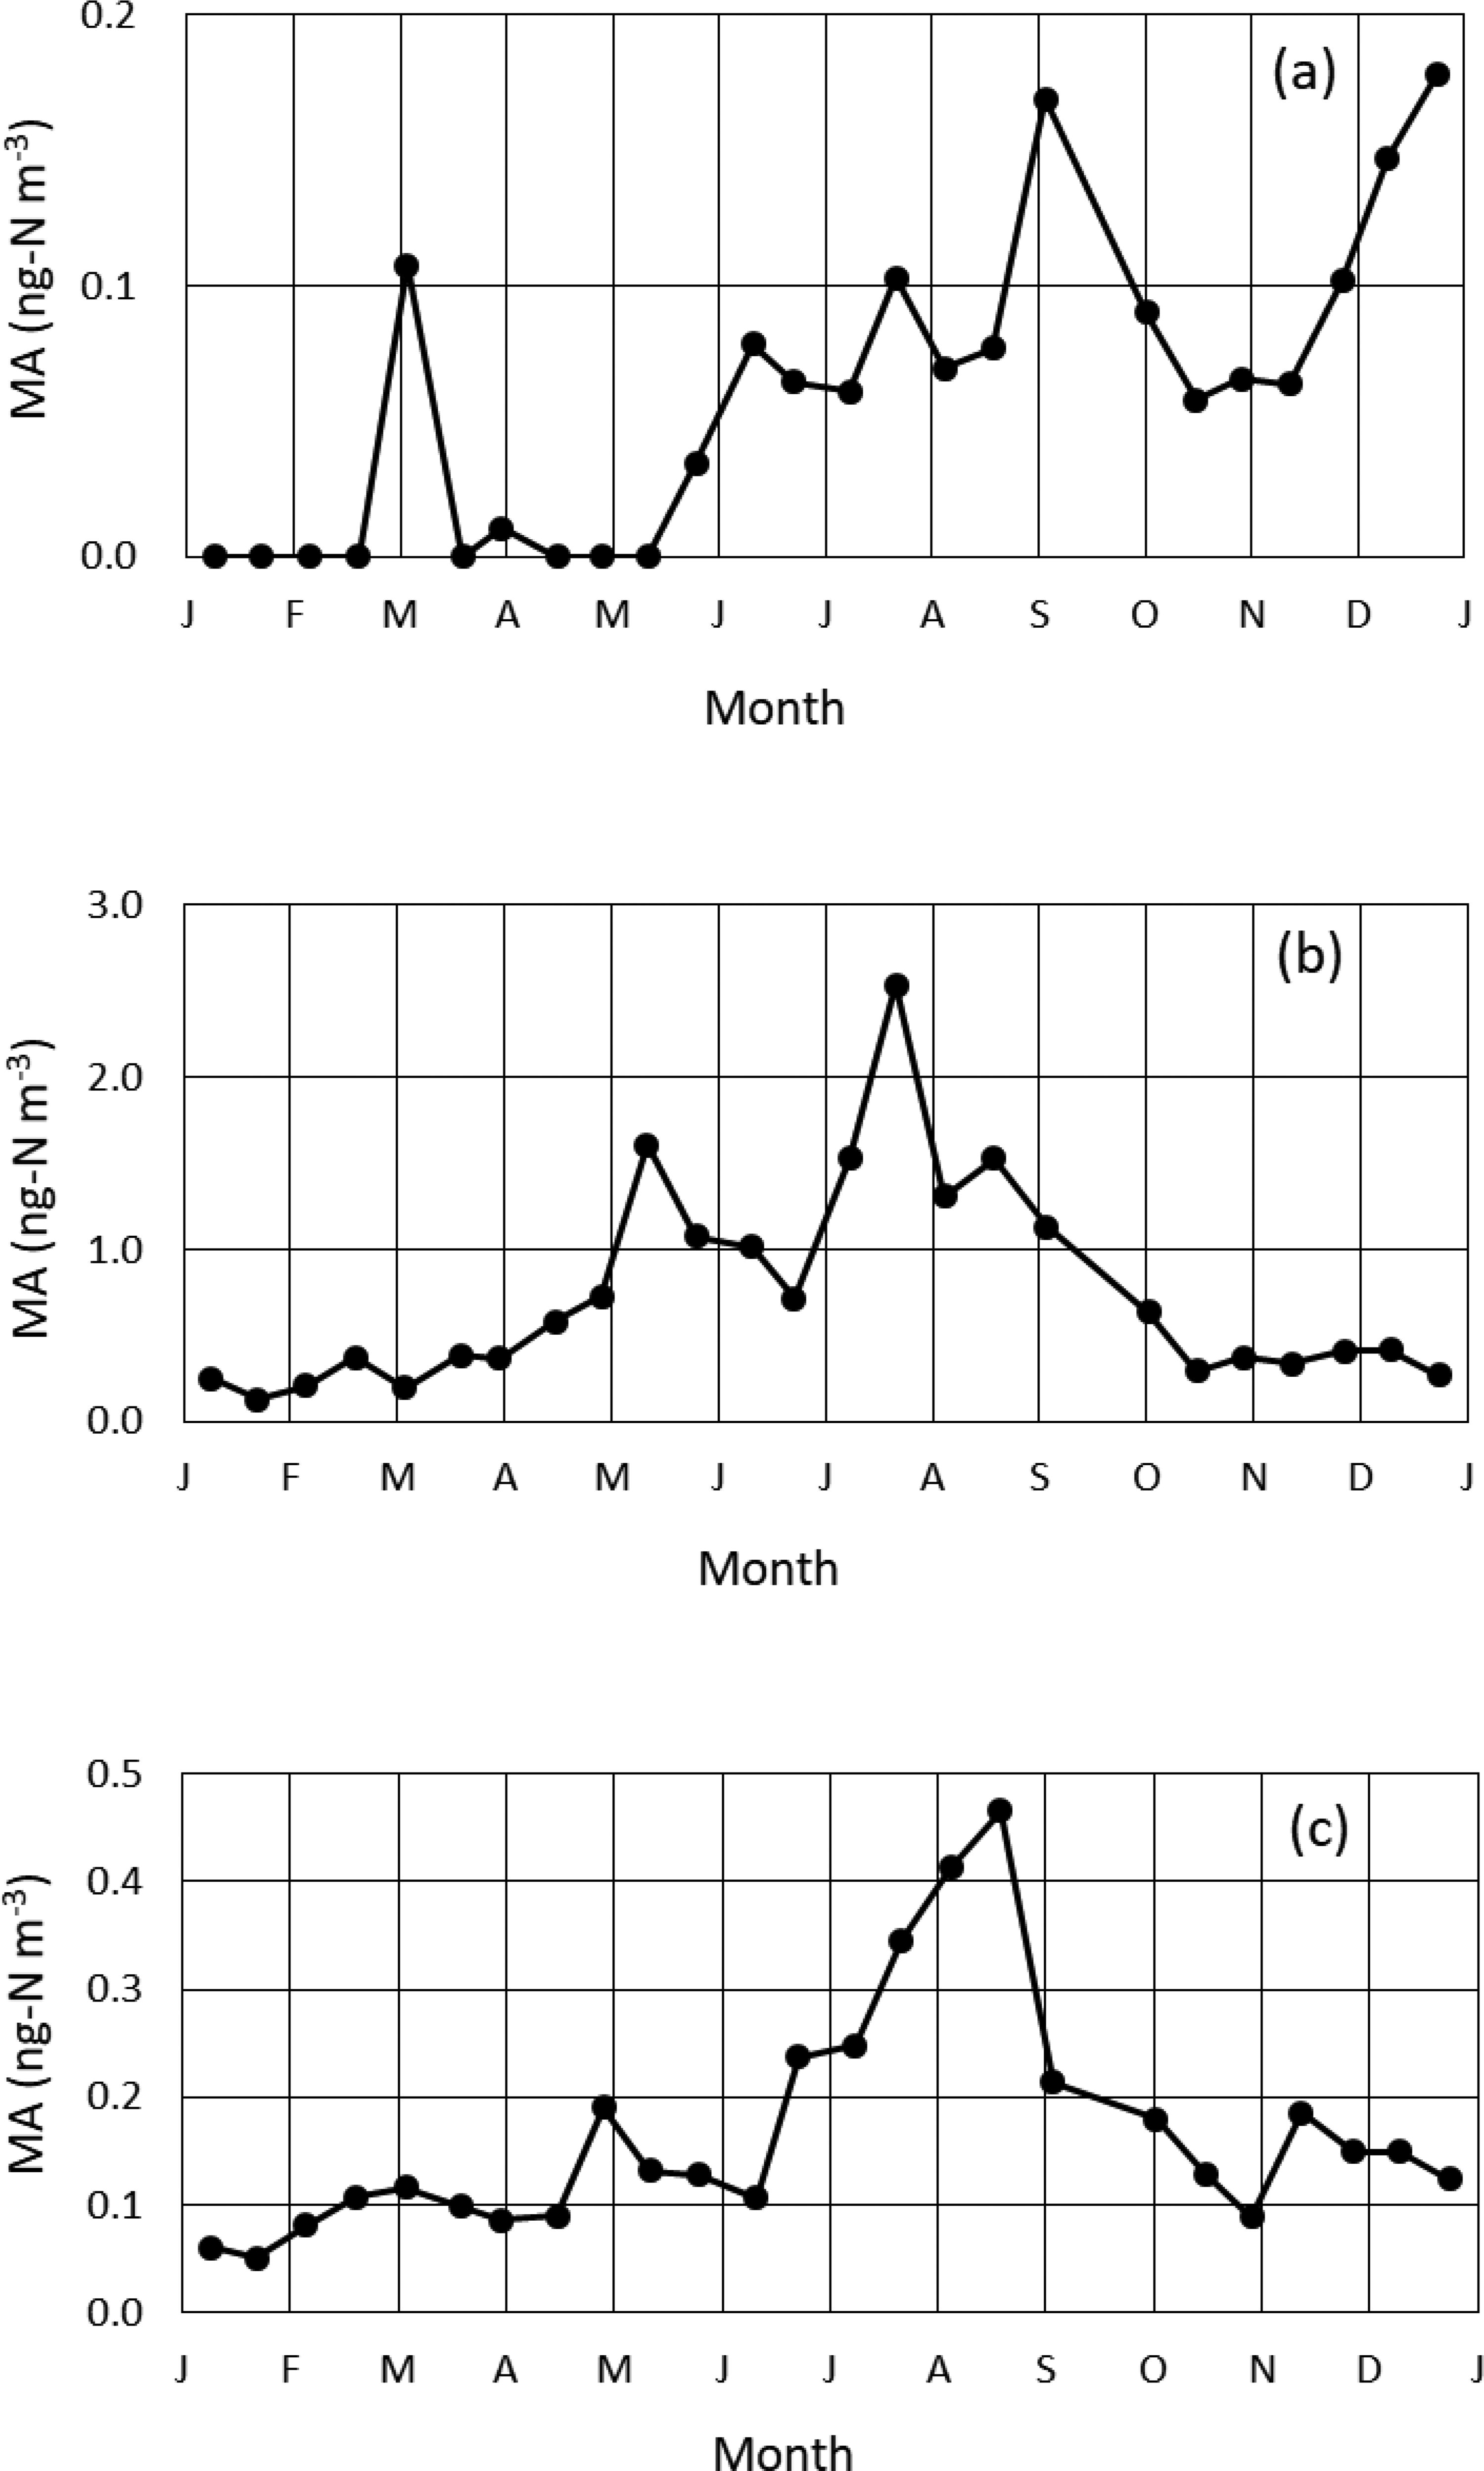
Figure 2.
Temporal variations in the concentrations of the methylamine (MA) in the coarse-mode particles (a), fine-mode particles (b), and gas phase (c).
Table 2.
Correlation coefficient (r) between the concentration of the gaseous methylamine and those of other particulate and gaseous species, meteorological parameters, and passing frequency of the air mass trajectories. Significance (s) is as follows; ***:p < 0.01, **:p < 0.05, *:p < 0.1, and -:p > 0.1.
Table 3.
Correlation coefficient (r) between the concentration ratio of the fine-mode methylamine to the sum of the fine-mode and gaseous methylamine and the concentrations of the fine-mode species and meteorological parameters. Significance (s) is as follows; ***:p < 0.01, **:p < 0.05, *:p < 0.1, and -:p > 0.1.