
Table 1.
Meteorological variables measured at the site.
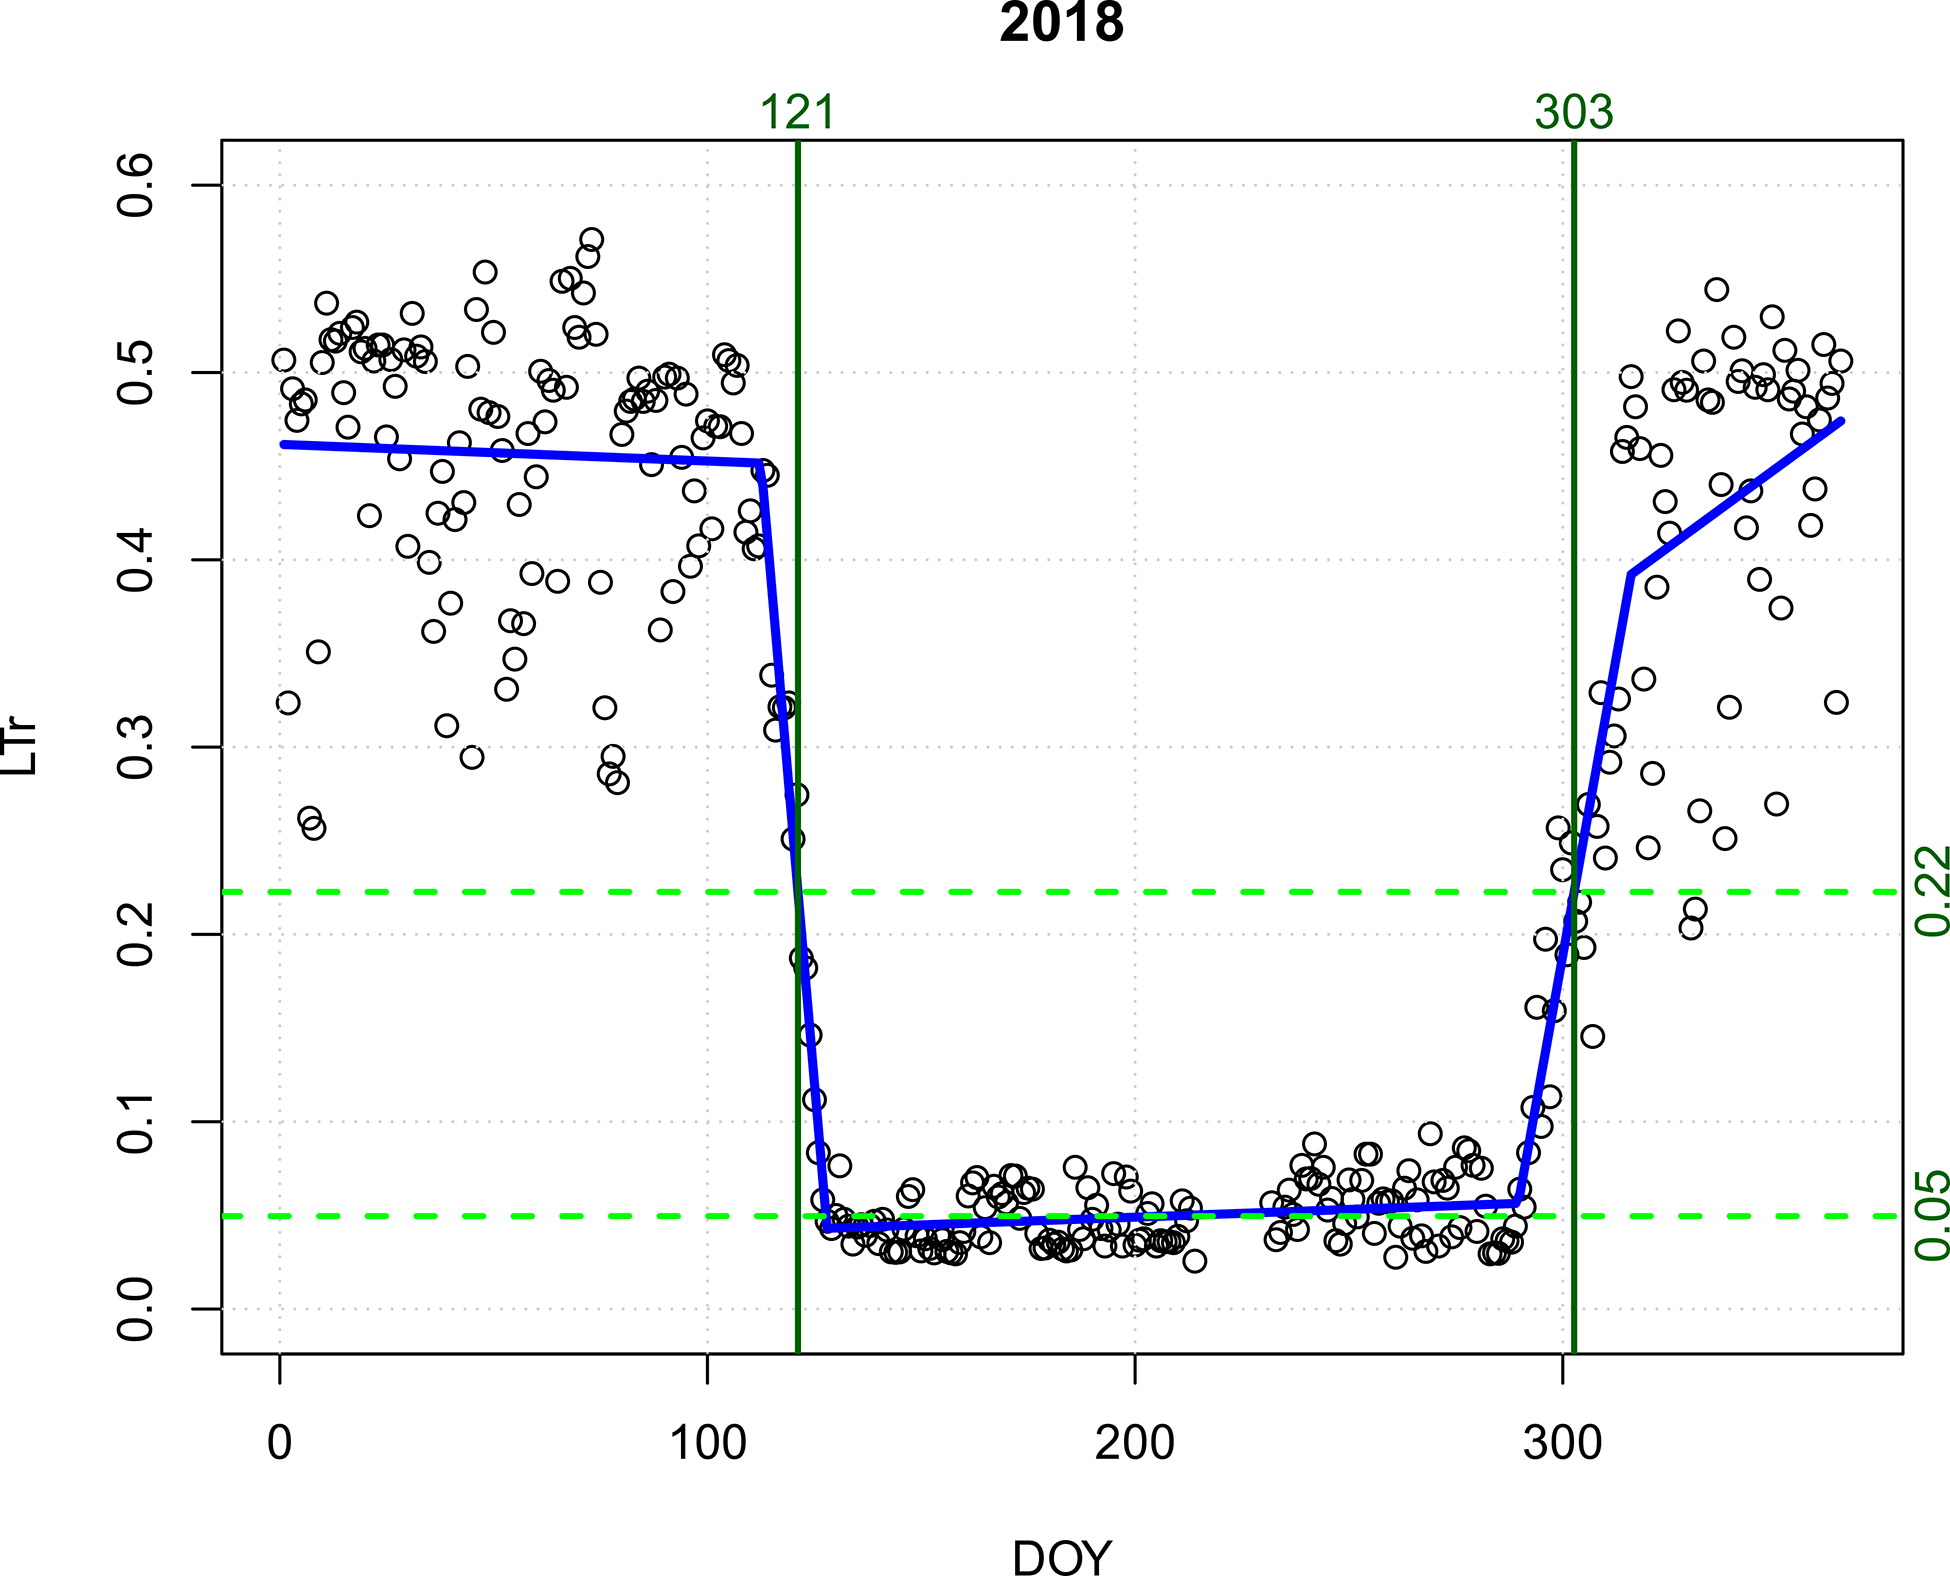
Fig. 1.
Time course of relative light transmission (LTr, dots), with piece-wise regressions (blue lines). The LTr at peak LAI and at 50% of peak LAI is indicated by dashed green lines. The day of year for 50% peak leaf area in the spring and autumn, respectively, are indicated with vertical lines.
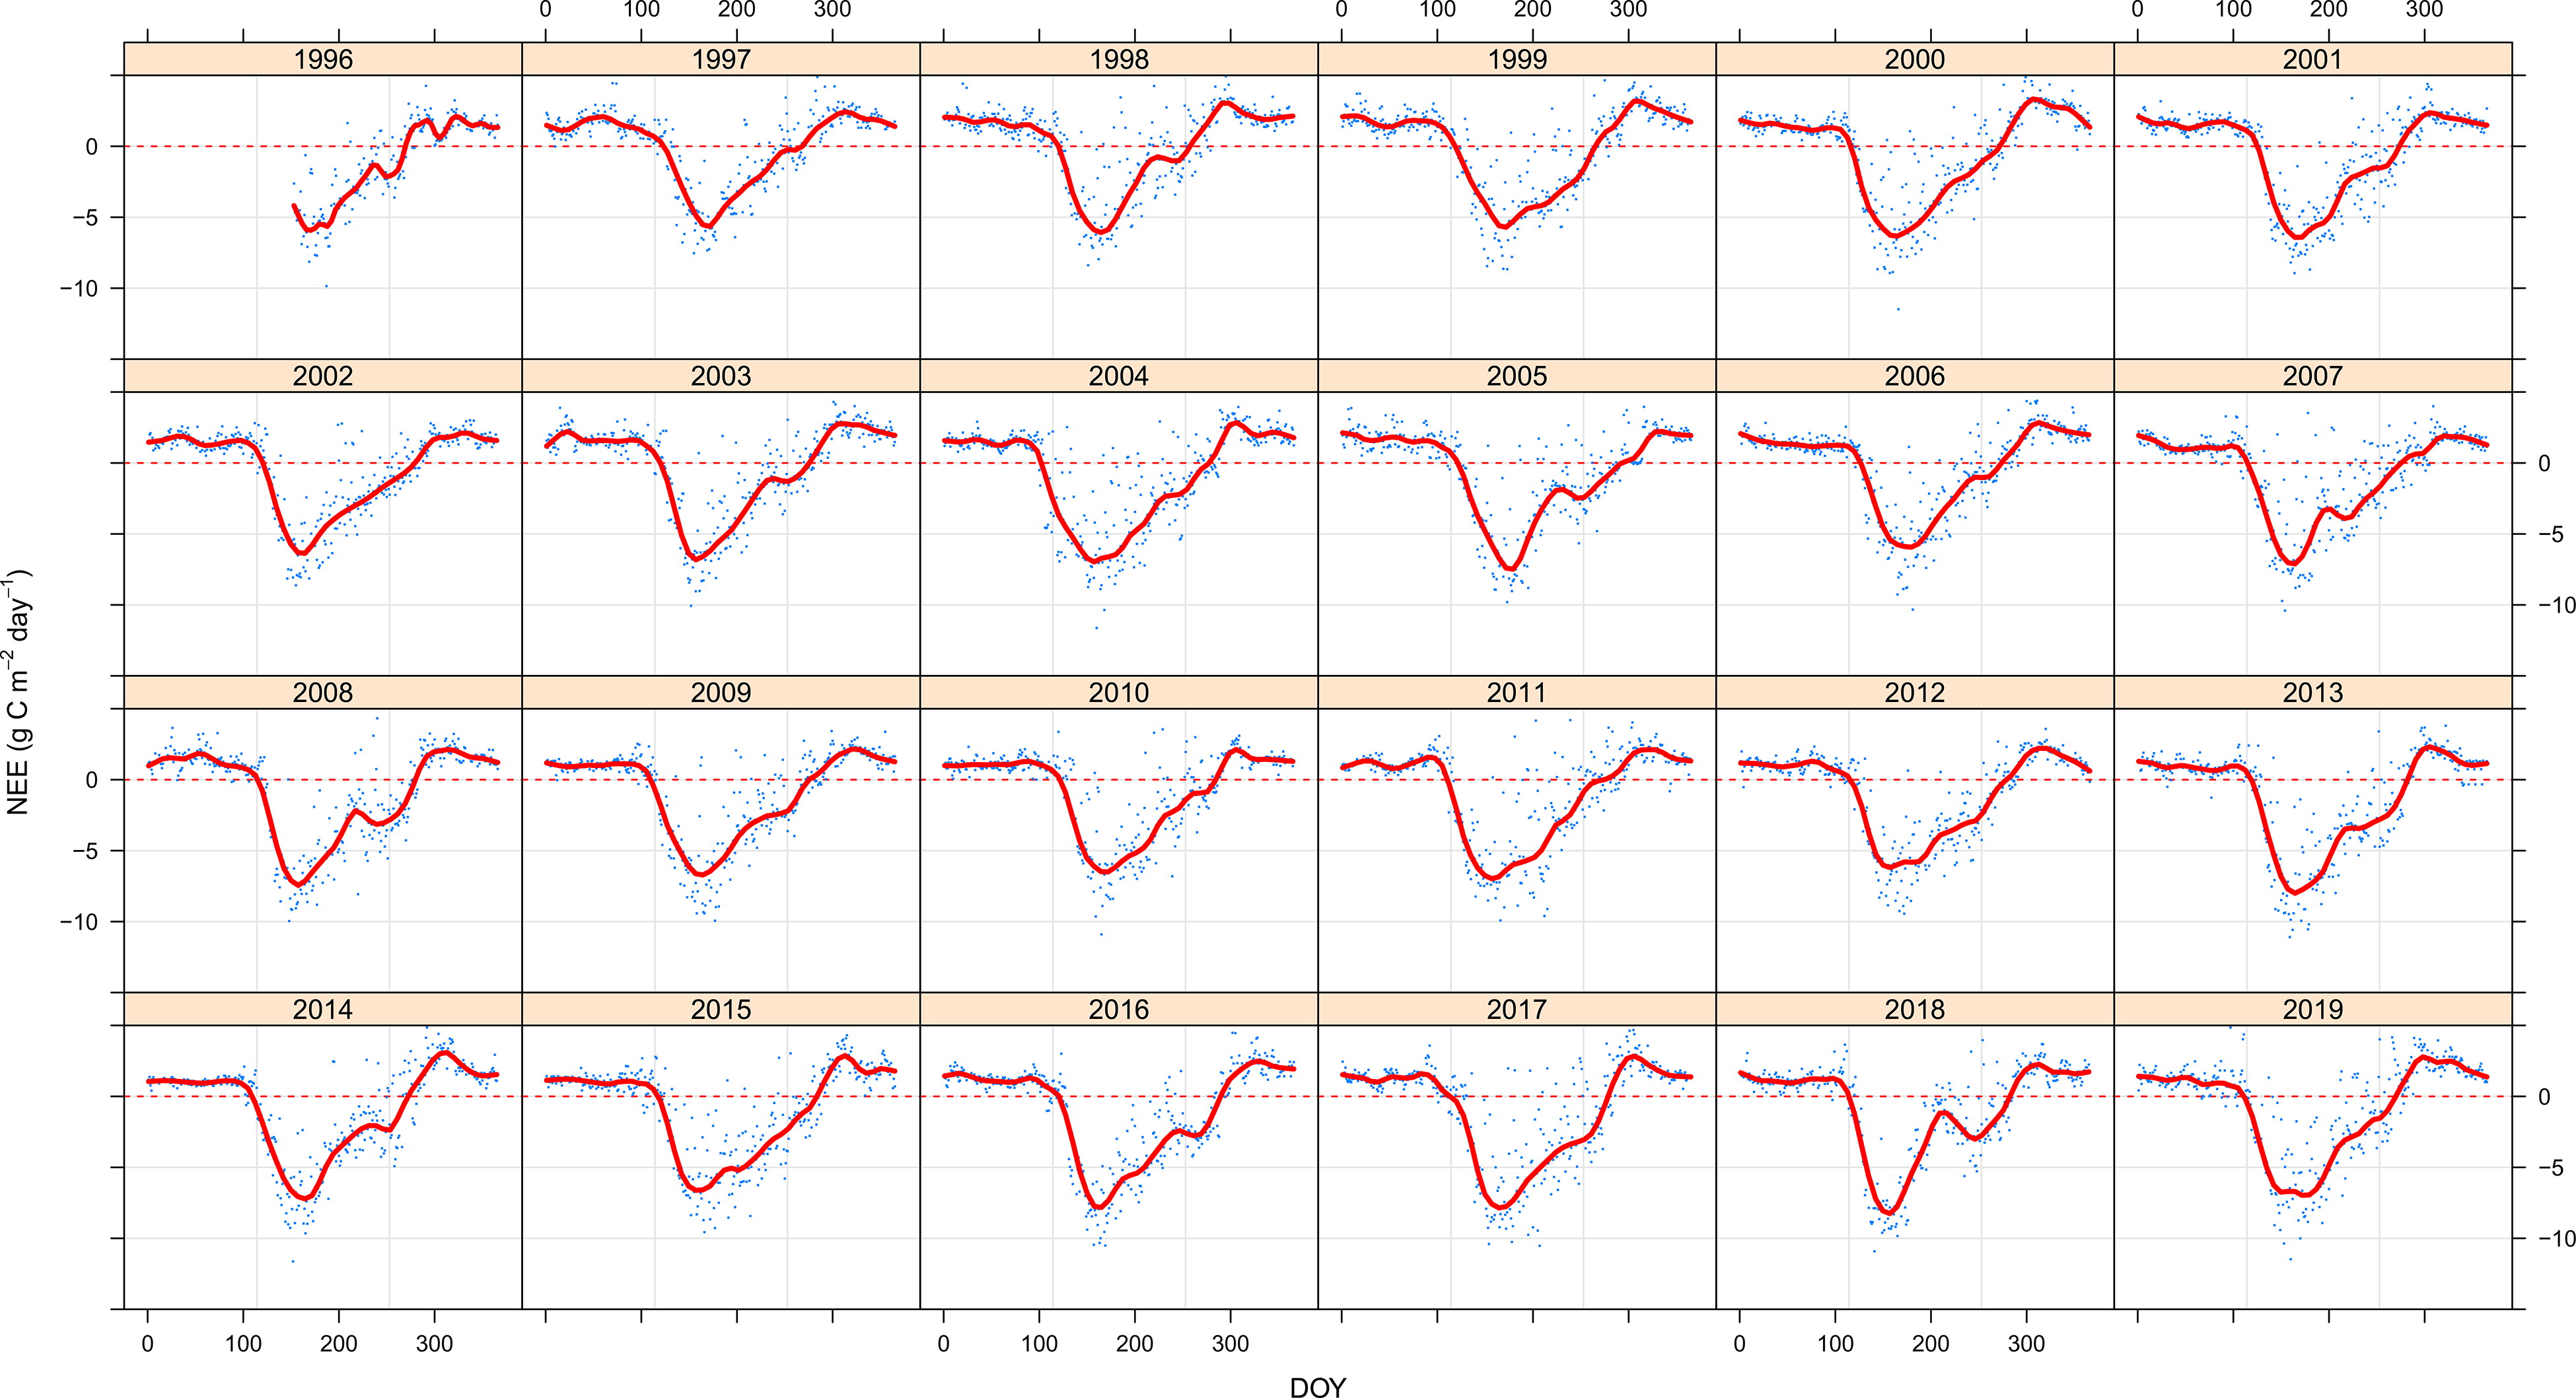
Fig. 2.
Net ecosystem exchange (g C m– 2 d−1) as a function of day of year.
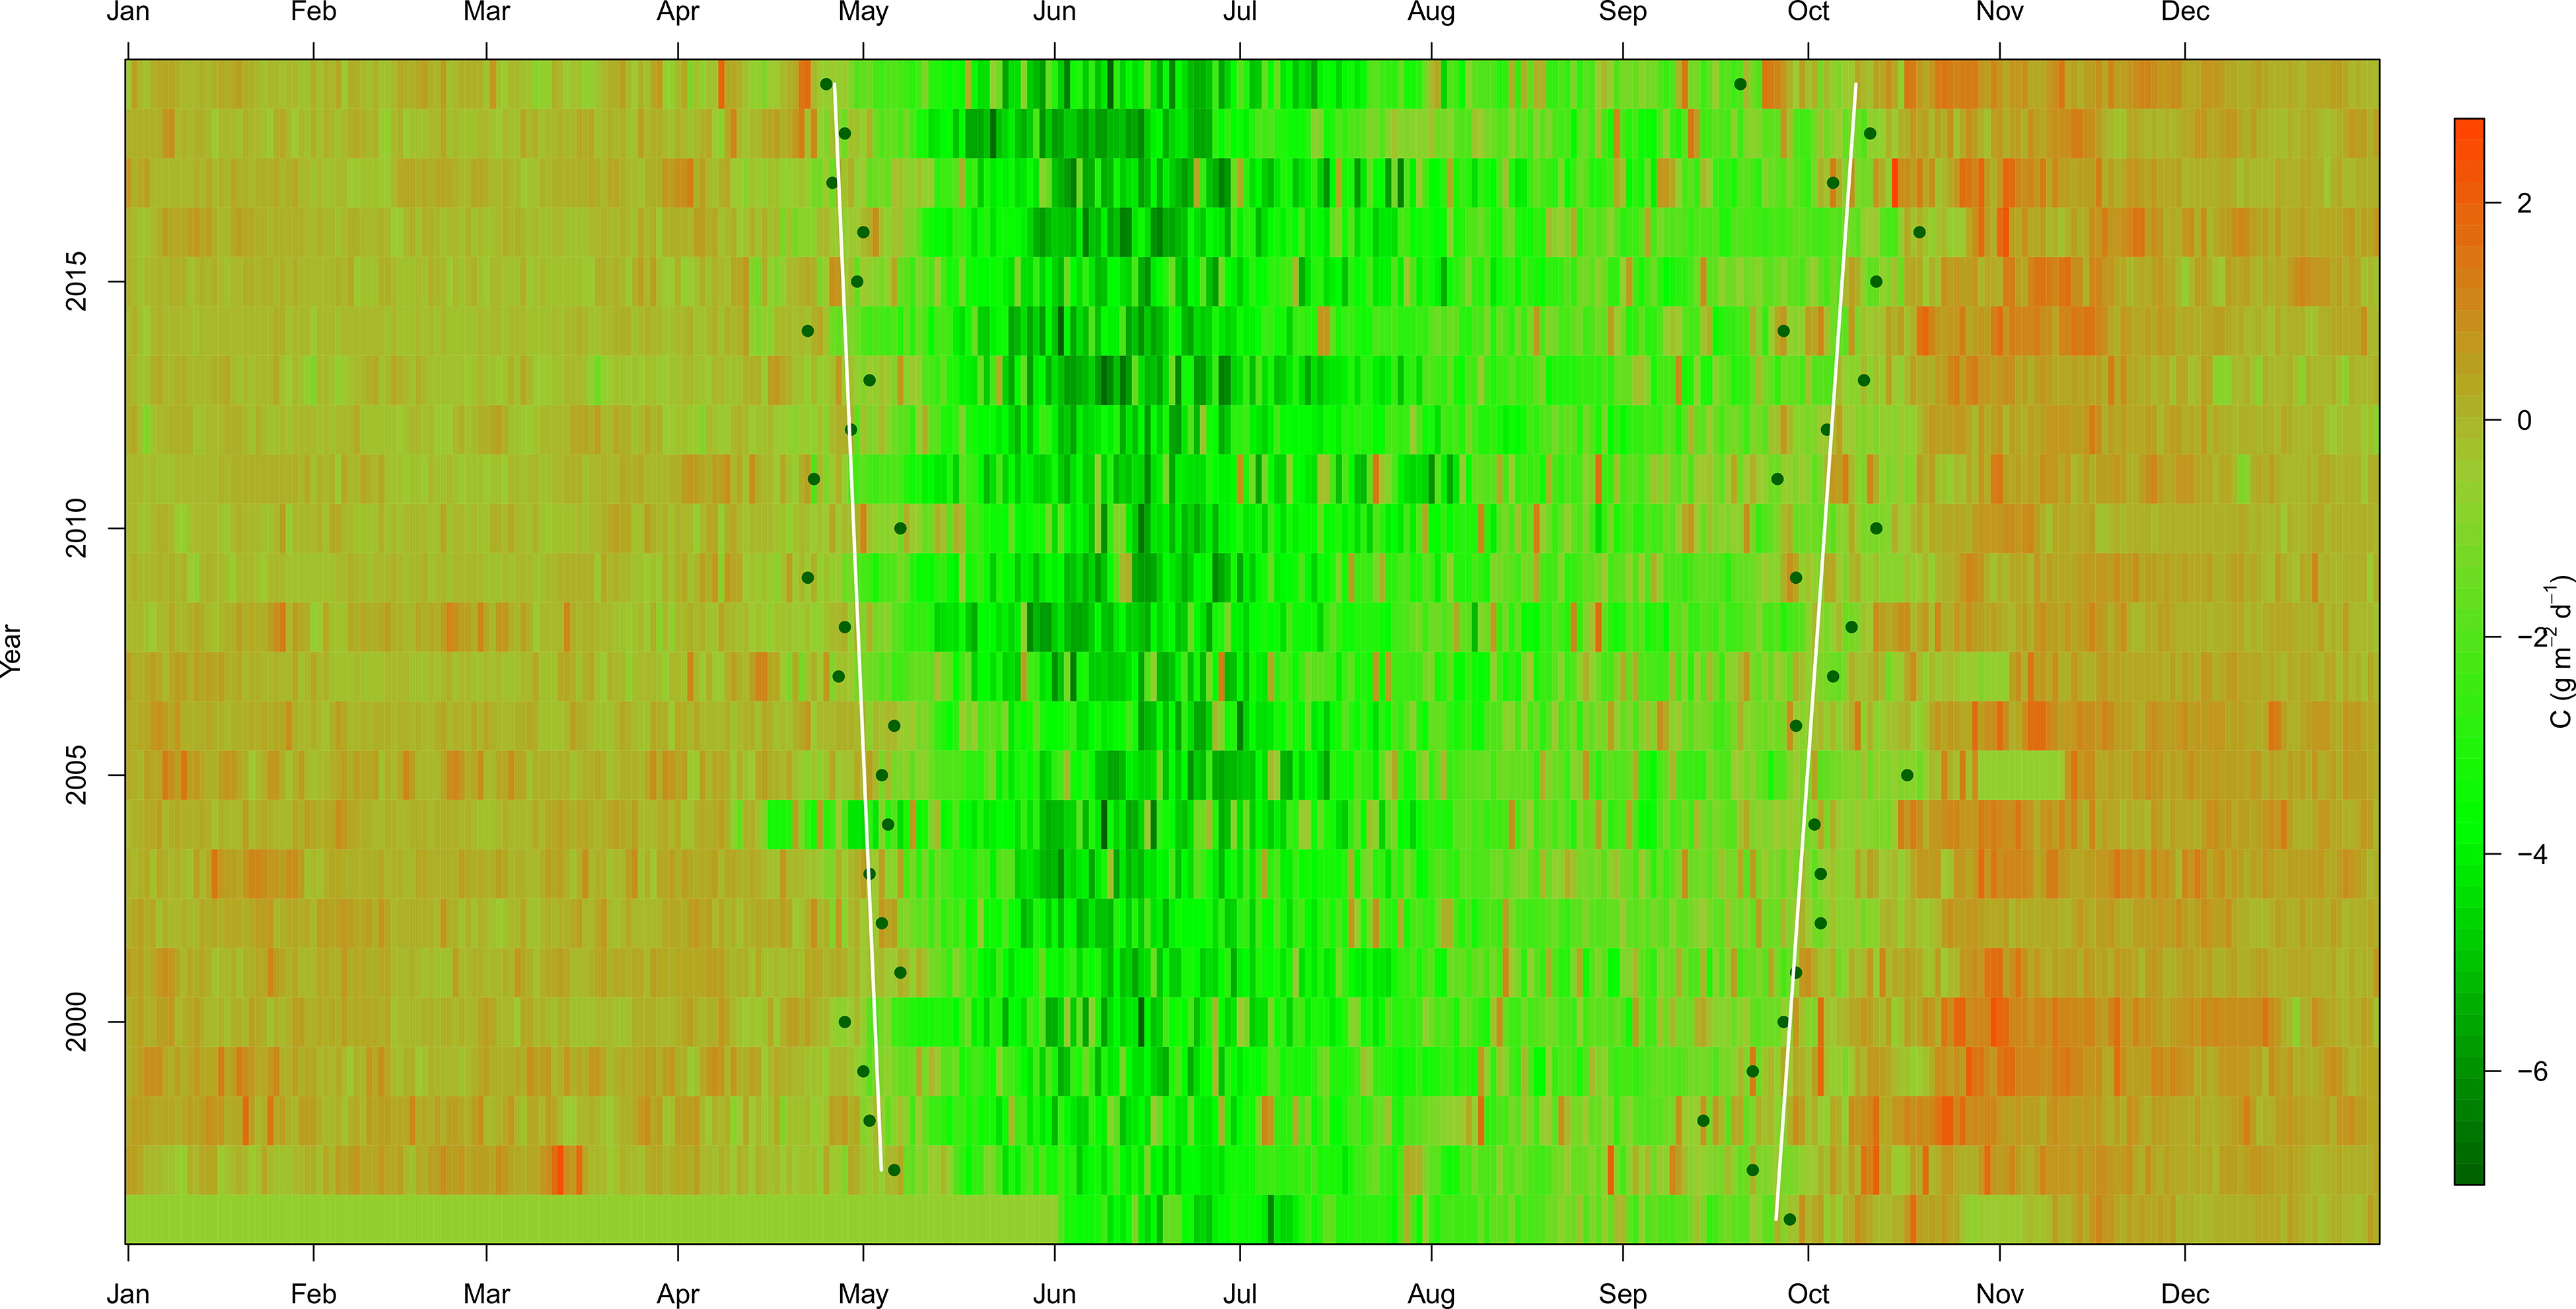
Fig. 3.
Imageplot of daily values of NEE (g C m– 2 d−1 over the years 1996–2019. Values are missing in the period January 1 st through May 31 st , 1996. Green dots shows beginning and end of carbon uptake period (CUP). Lines show regressions.
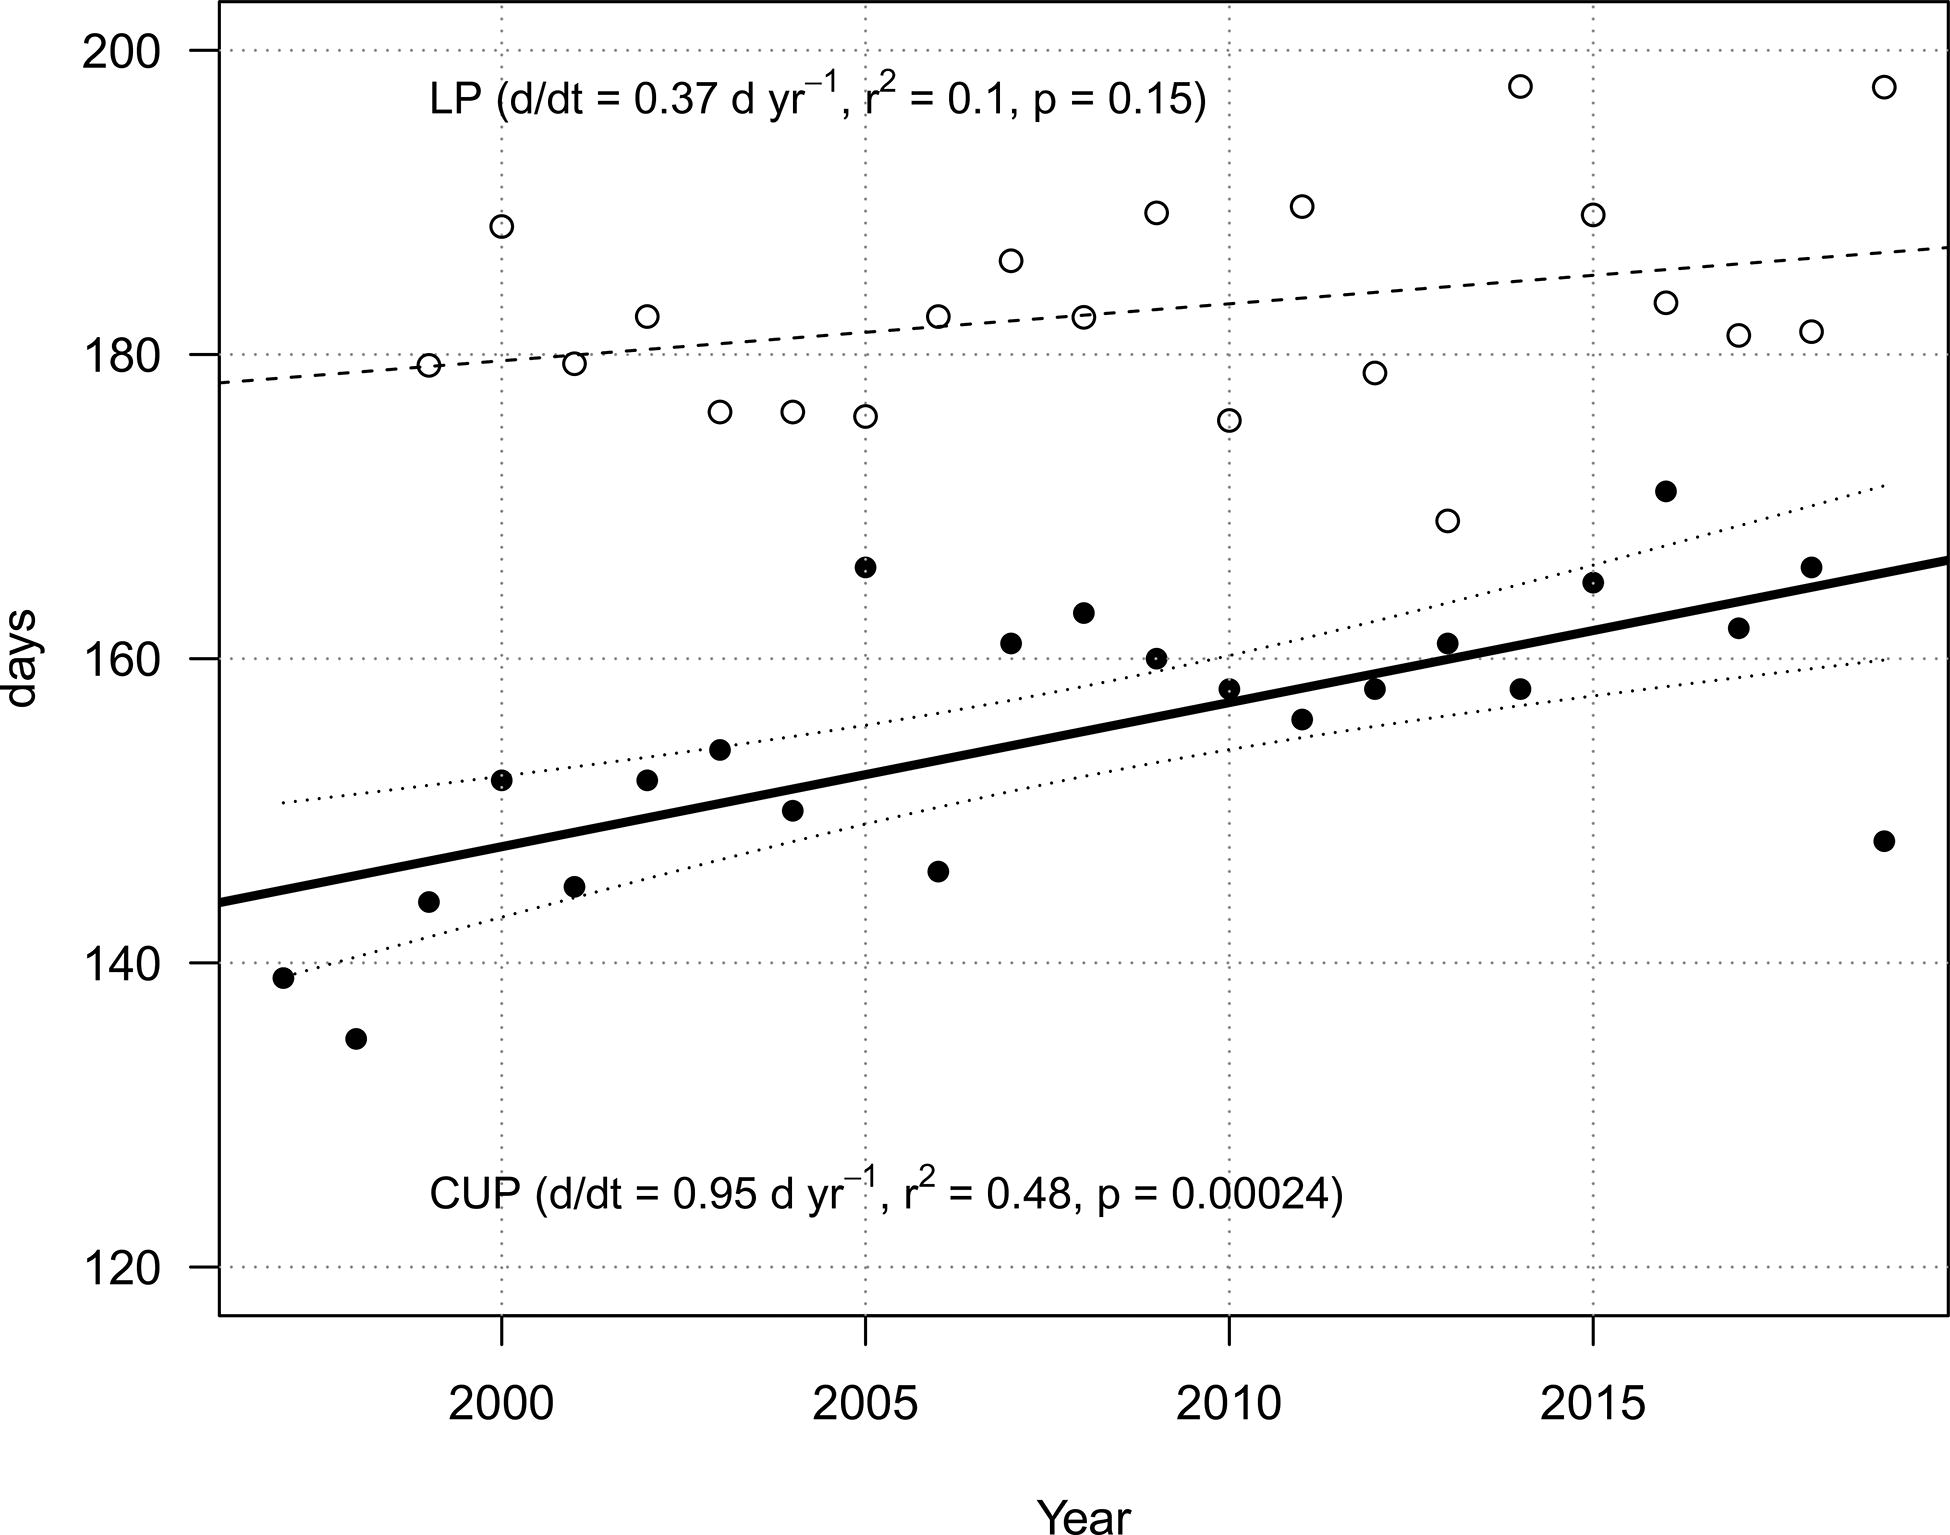
Fig. 4.
Length (days) of leaf period (LP) and carbon uptake period (CUP) vs. year.
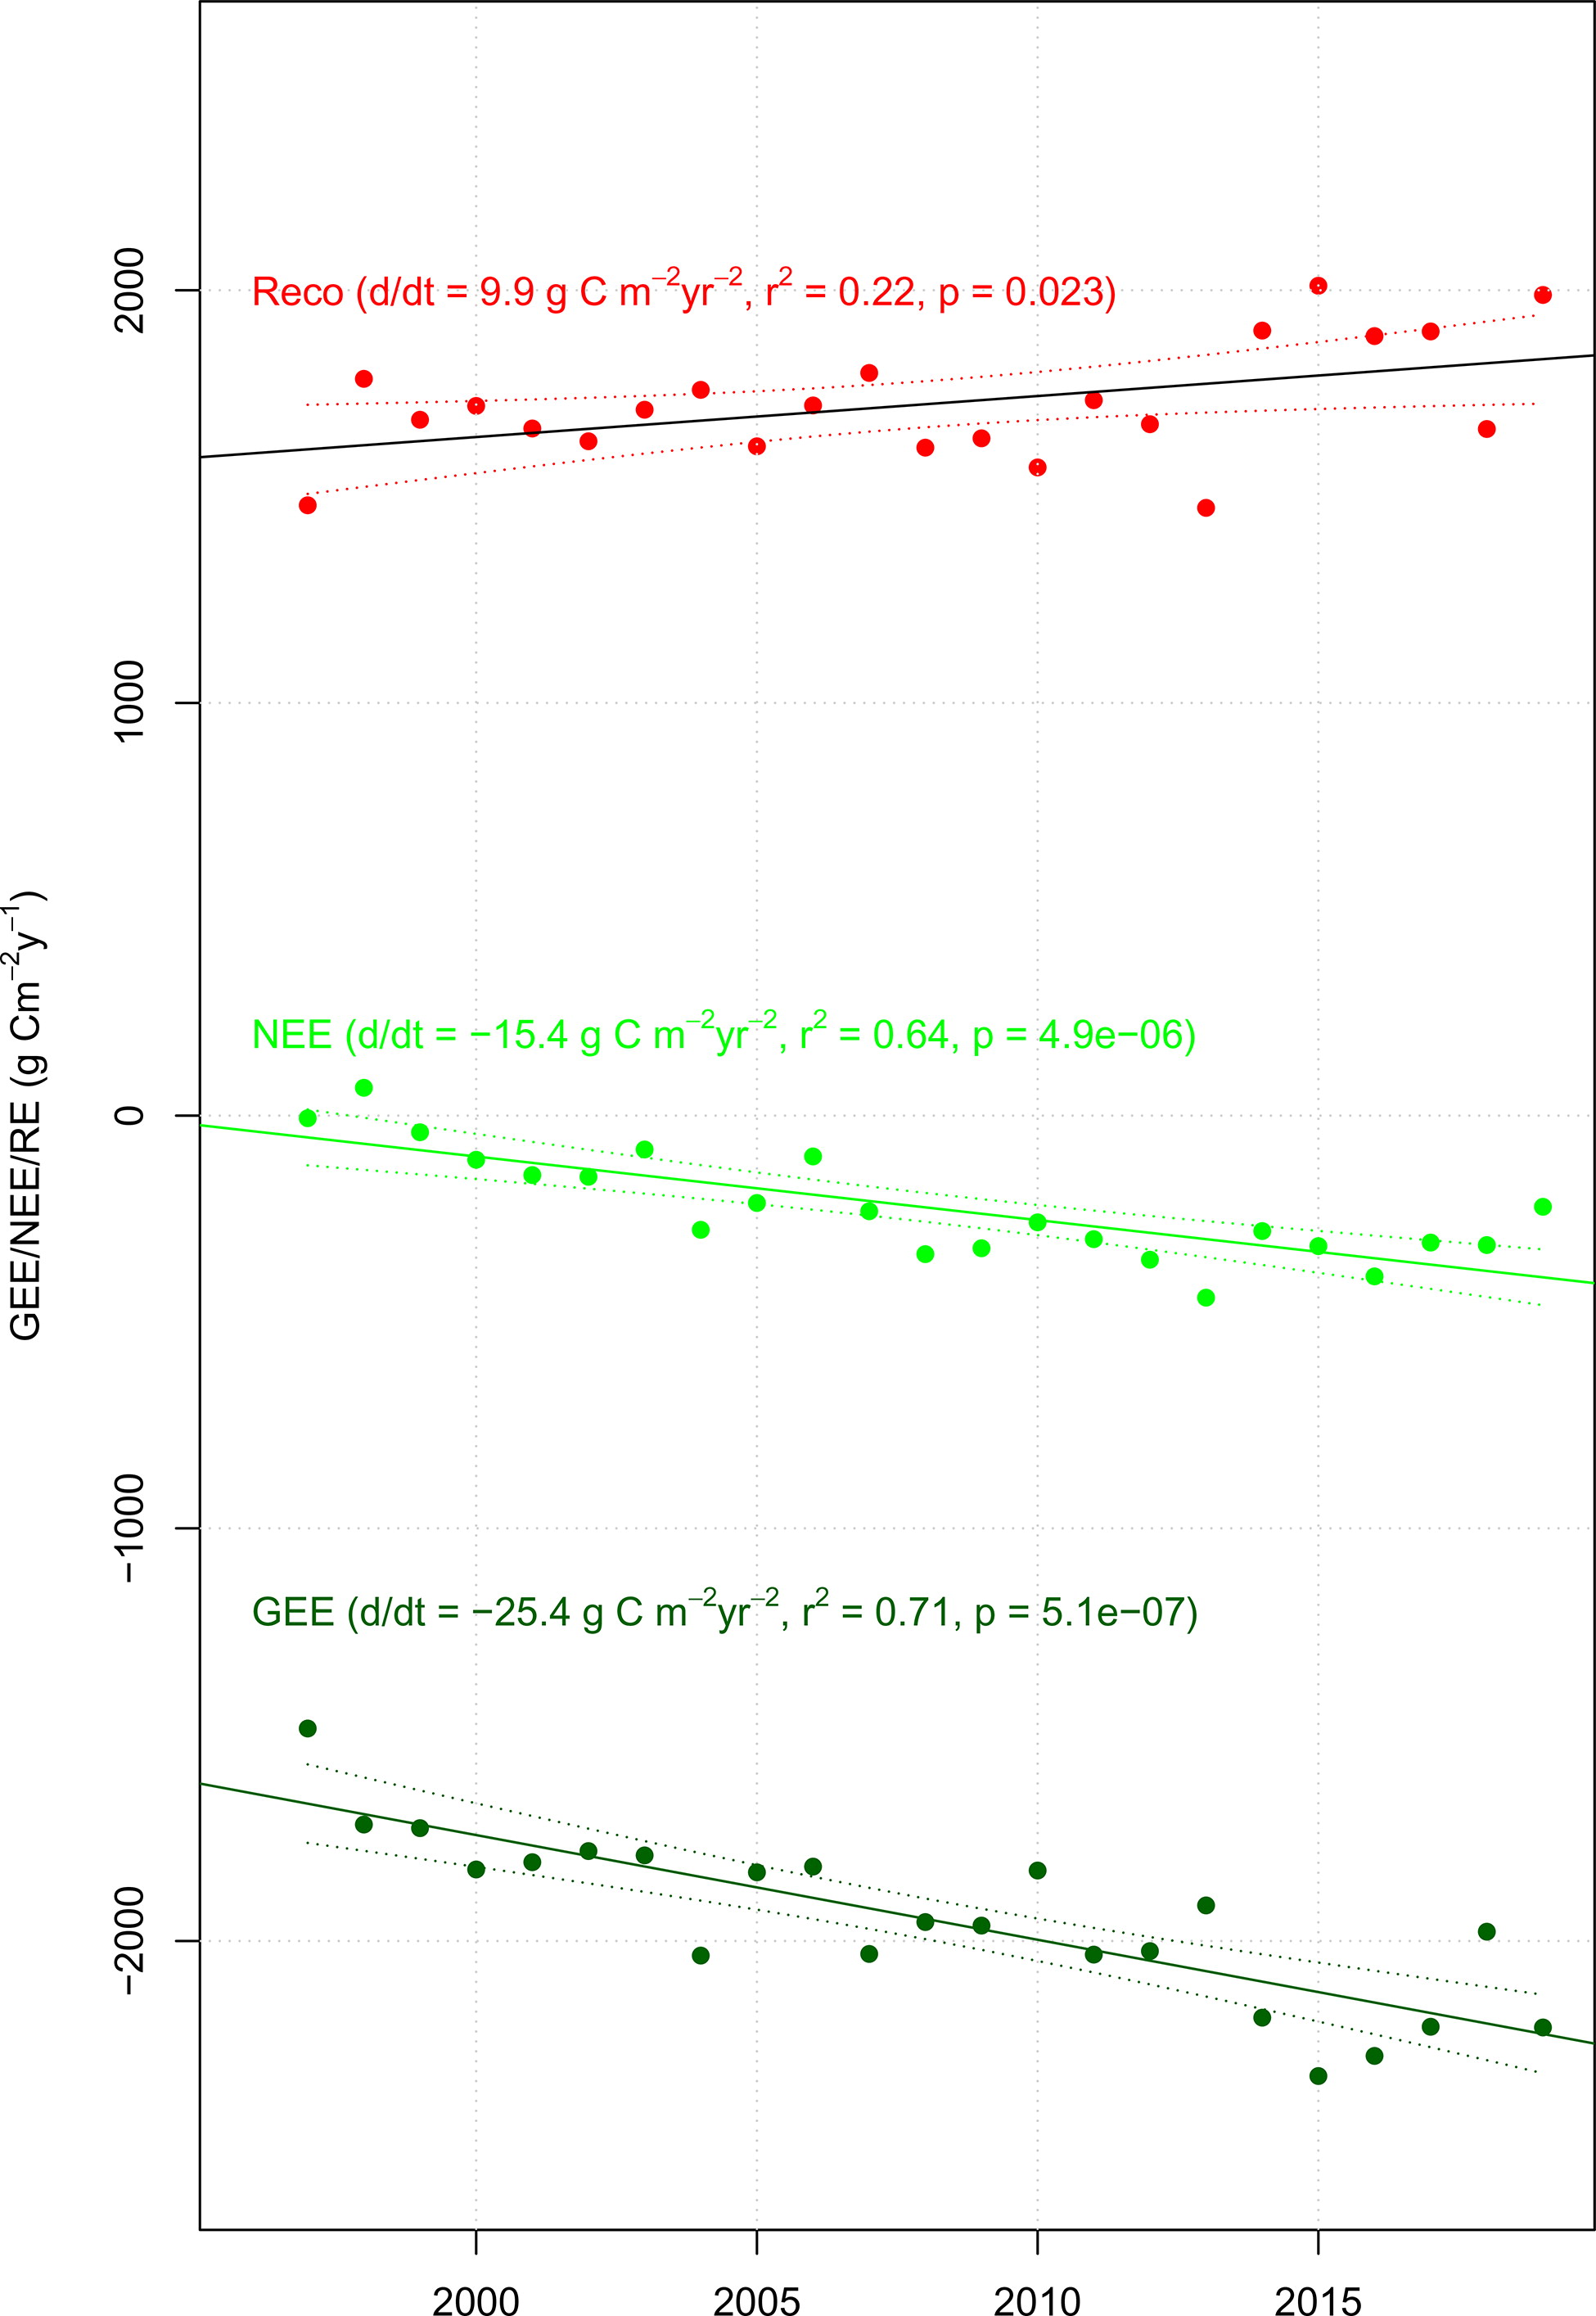
Fig. 5.
Annual RE, NEE, GEE g C m– 2 yr−1) vs. year. Full line = regression line, dotted lines = 95% significance limits.
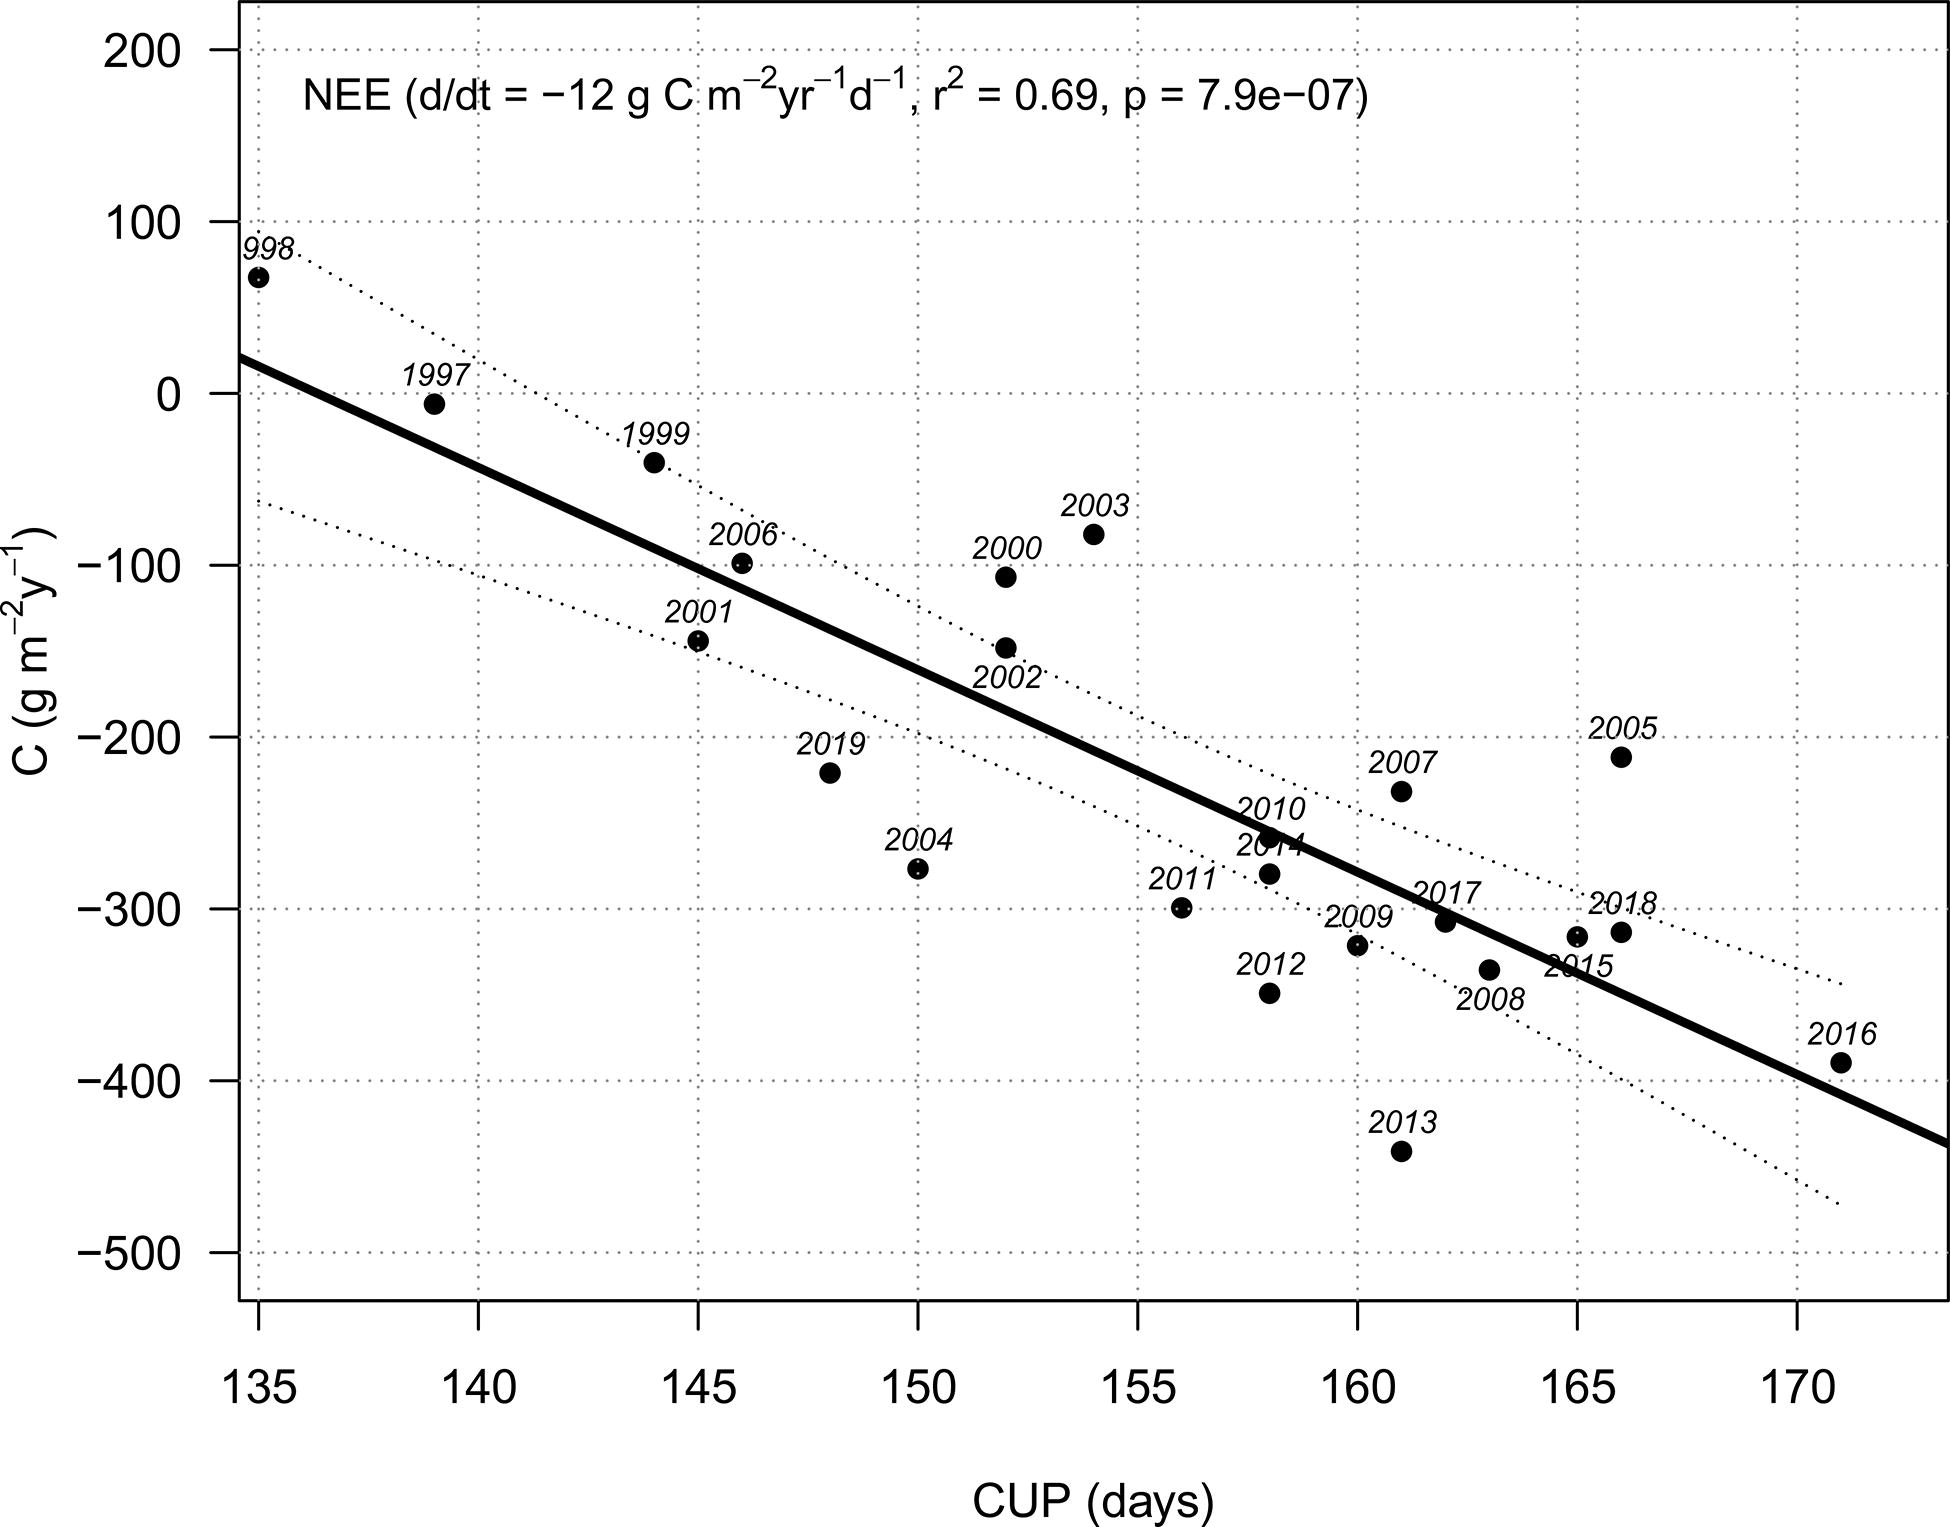
Fig. 6.
Annual NEE (g C m– 2 yr−1) vs. carbon uptake period (CUP (d)).
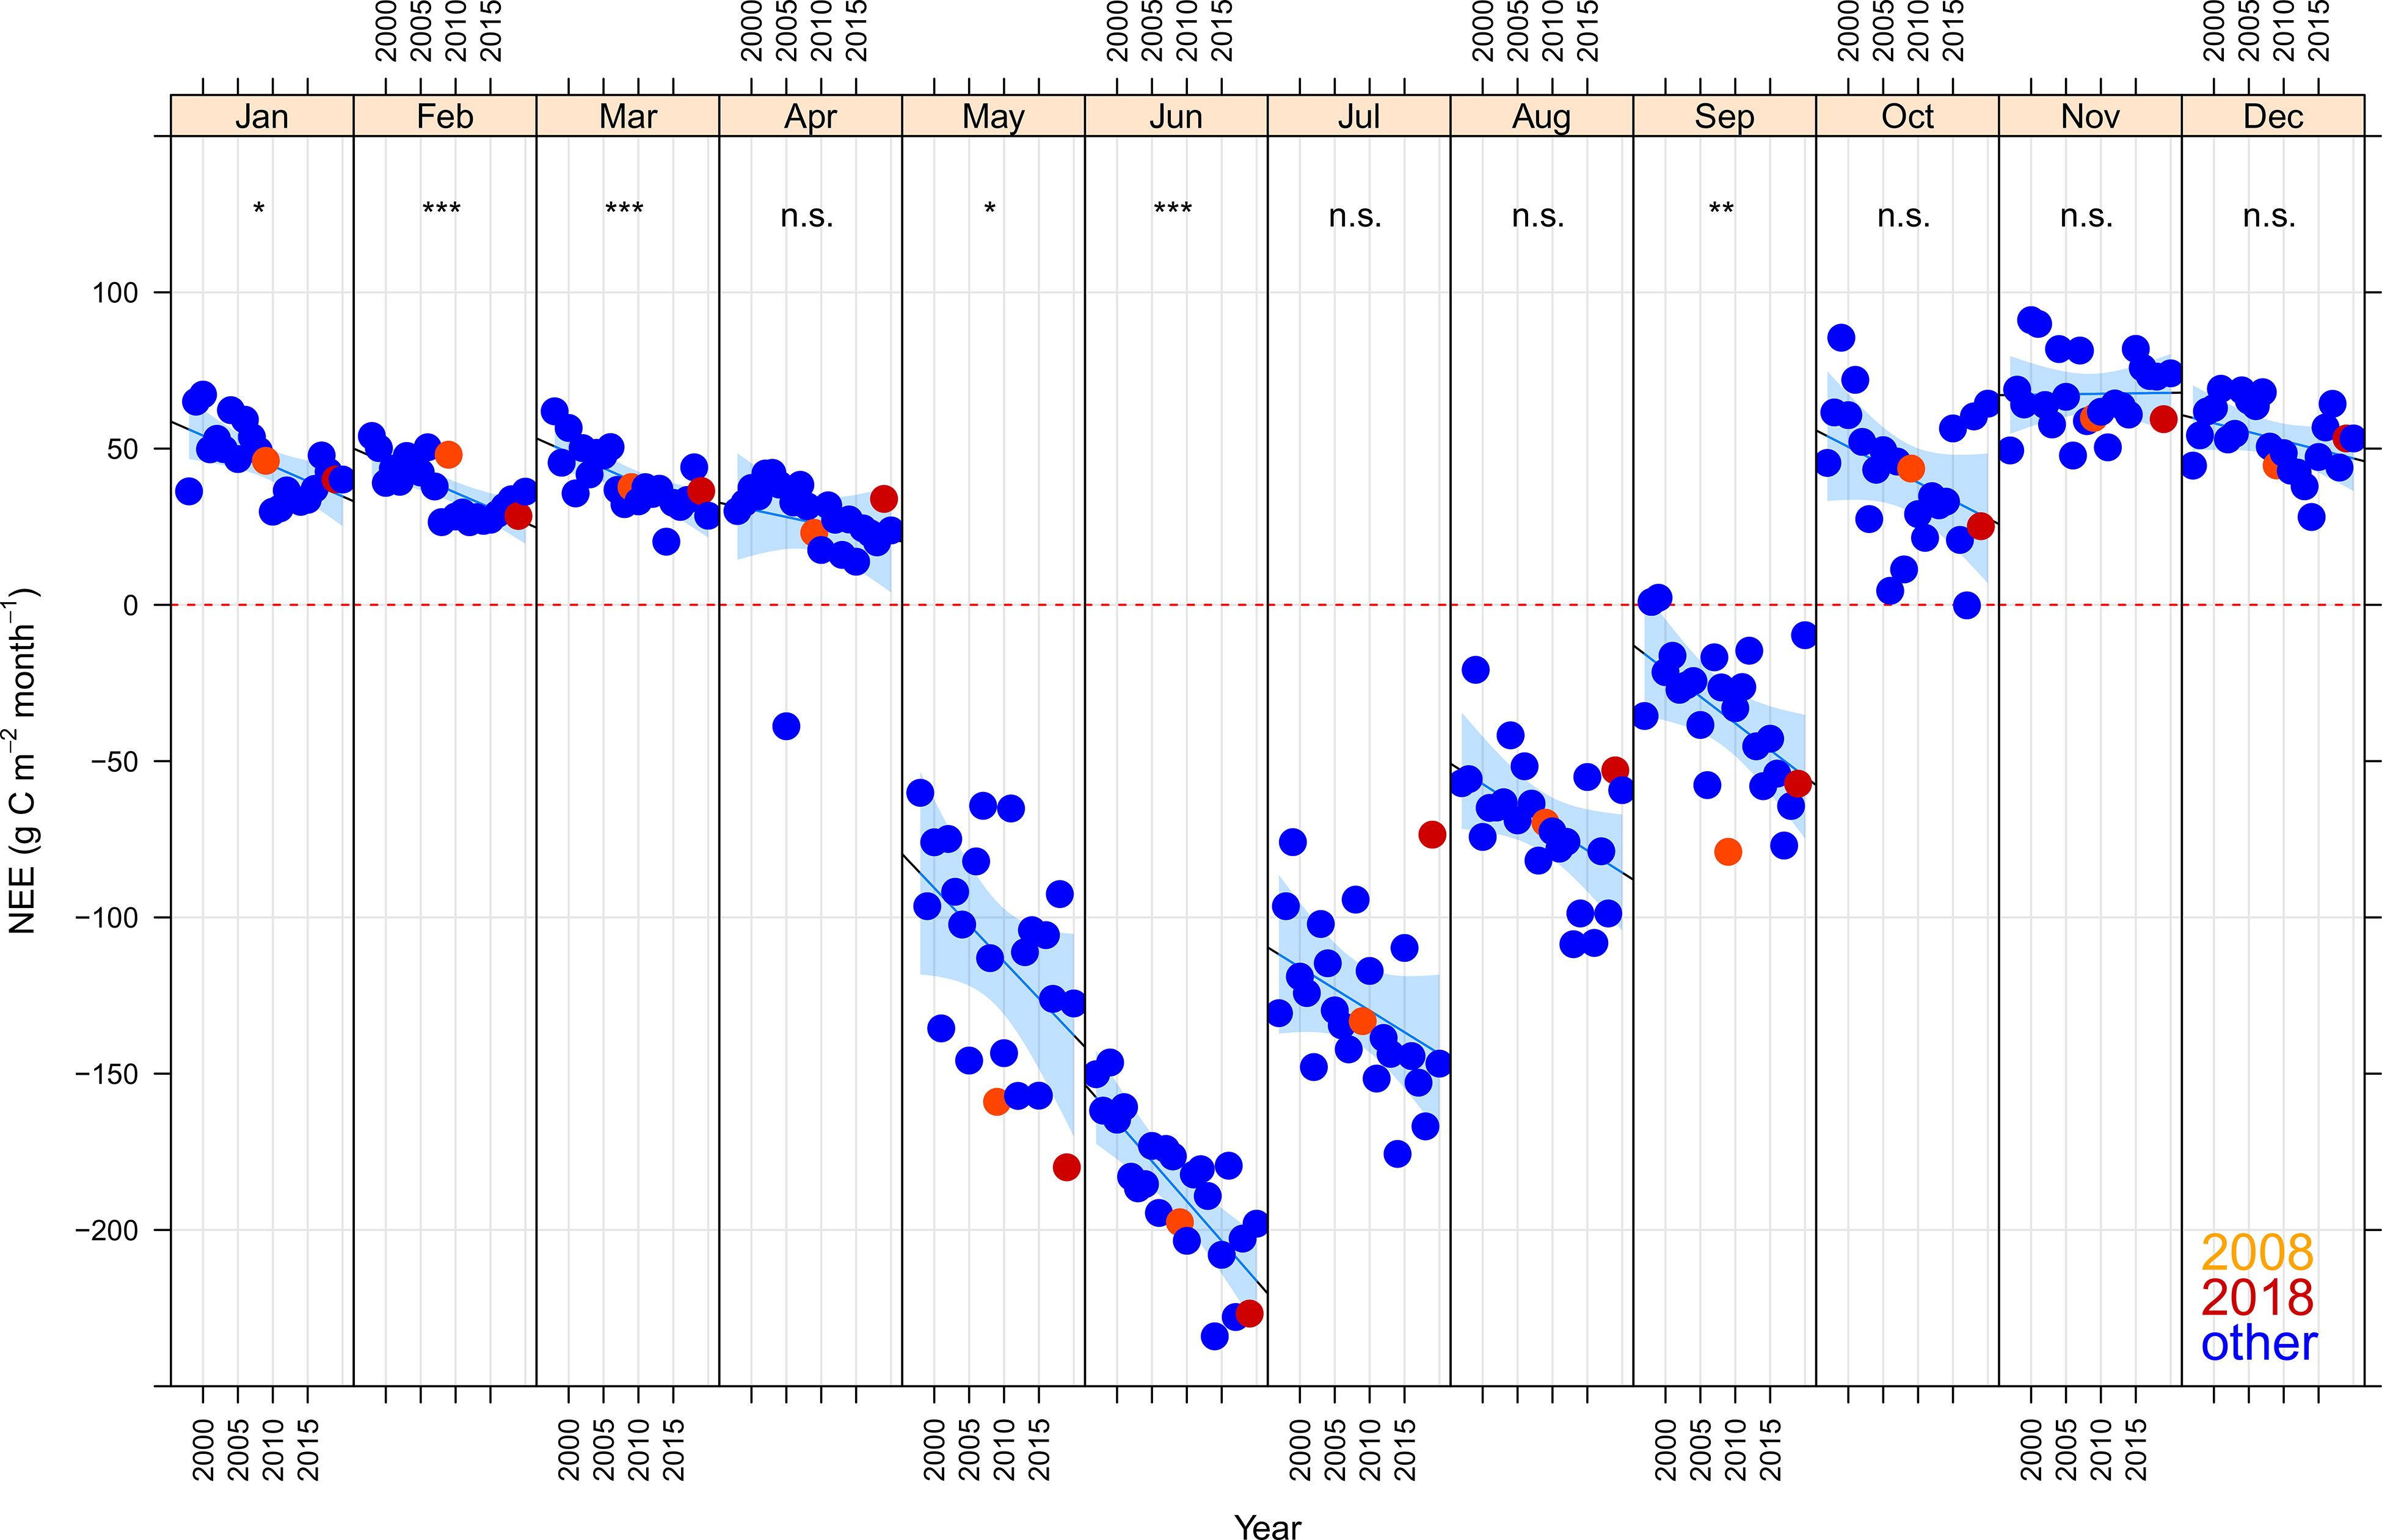
Fig. 7.
NEE by month and year with regression lines and 99.9% confidence limits (shaded areas). Significance of slope indicated for each month. n.s = not significant, * = p < 0.05, ** = p < 0.01, *** = p < 0.001. Years with significant signs of summer drought indicated with different colours.
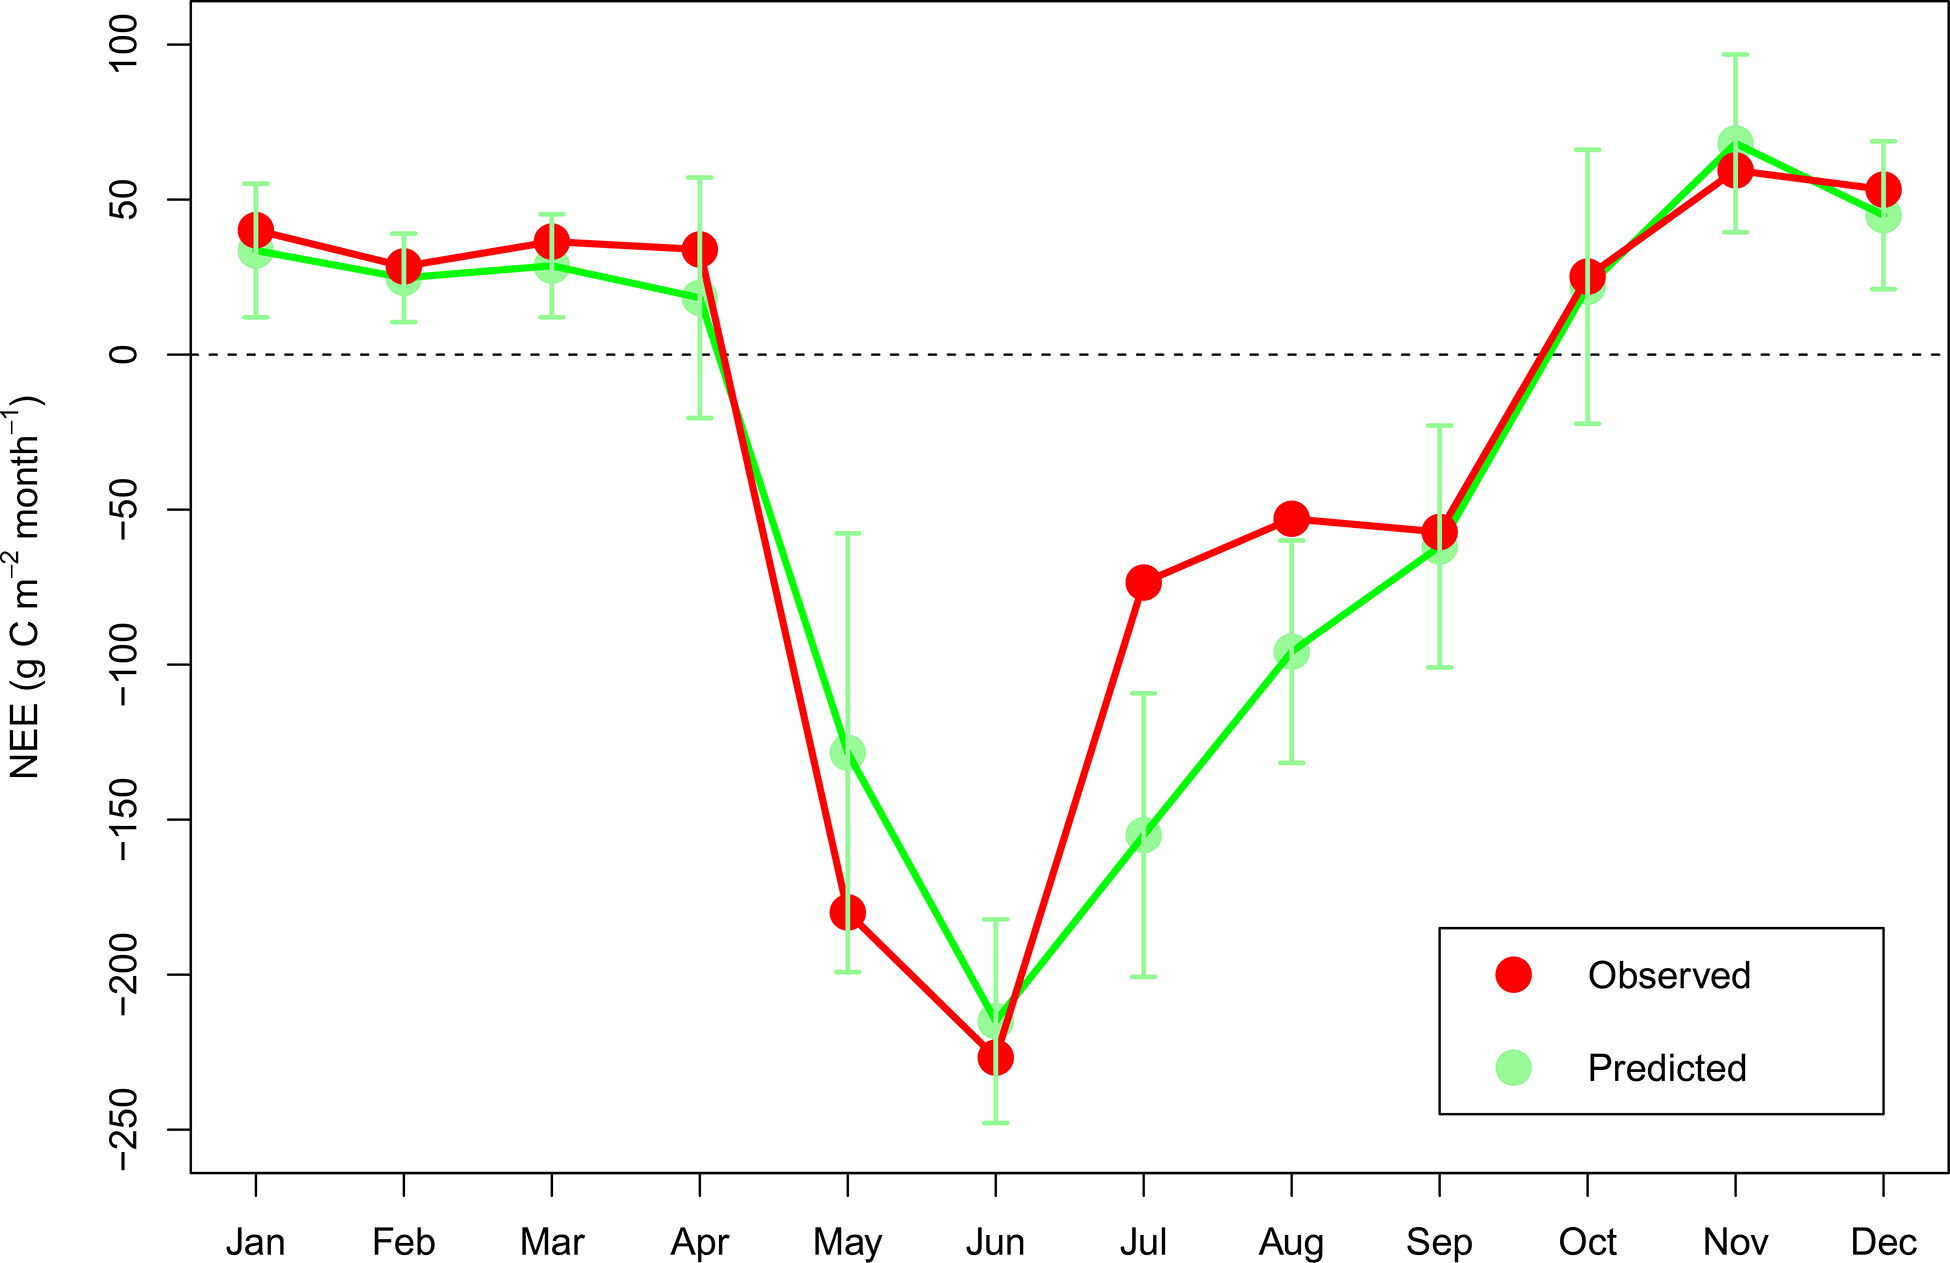
Fig. 8.
Comparison between observed NEE in 2018 and NEE predicted by the monthly trends during 1996 to 2017.
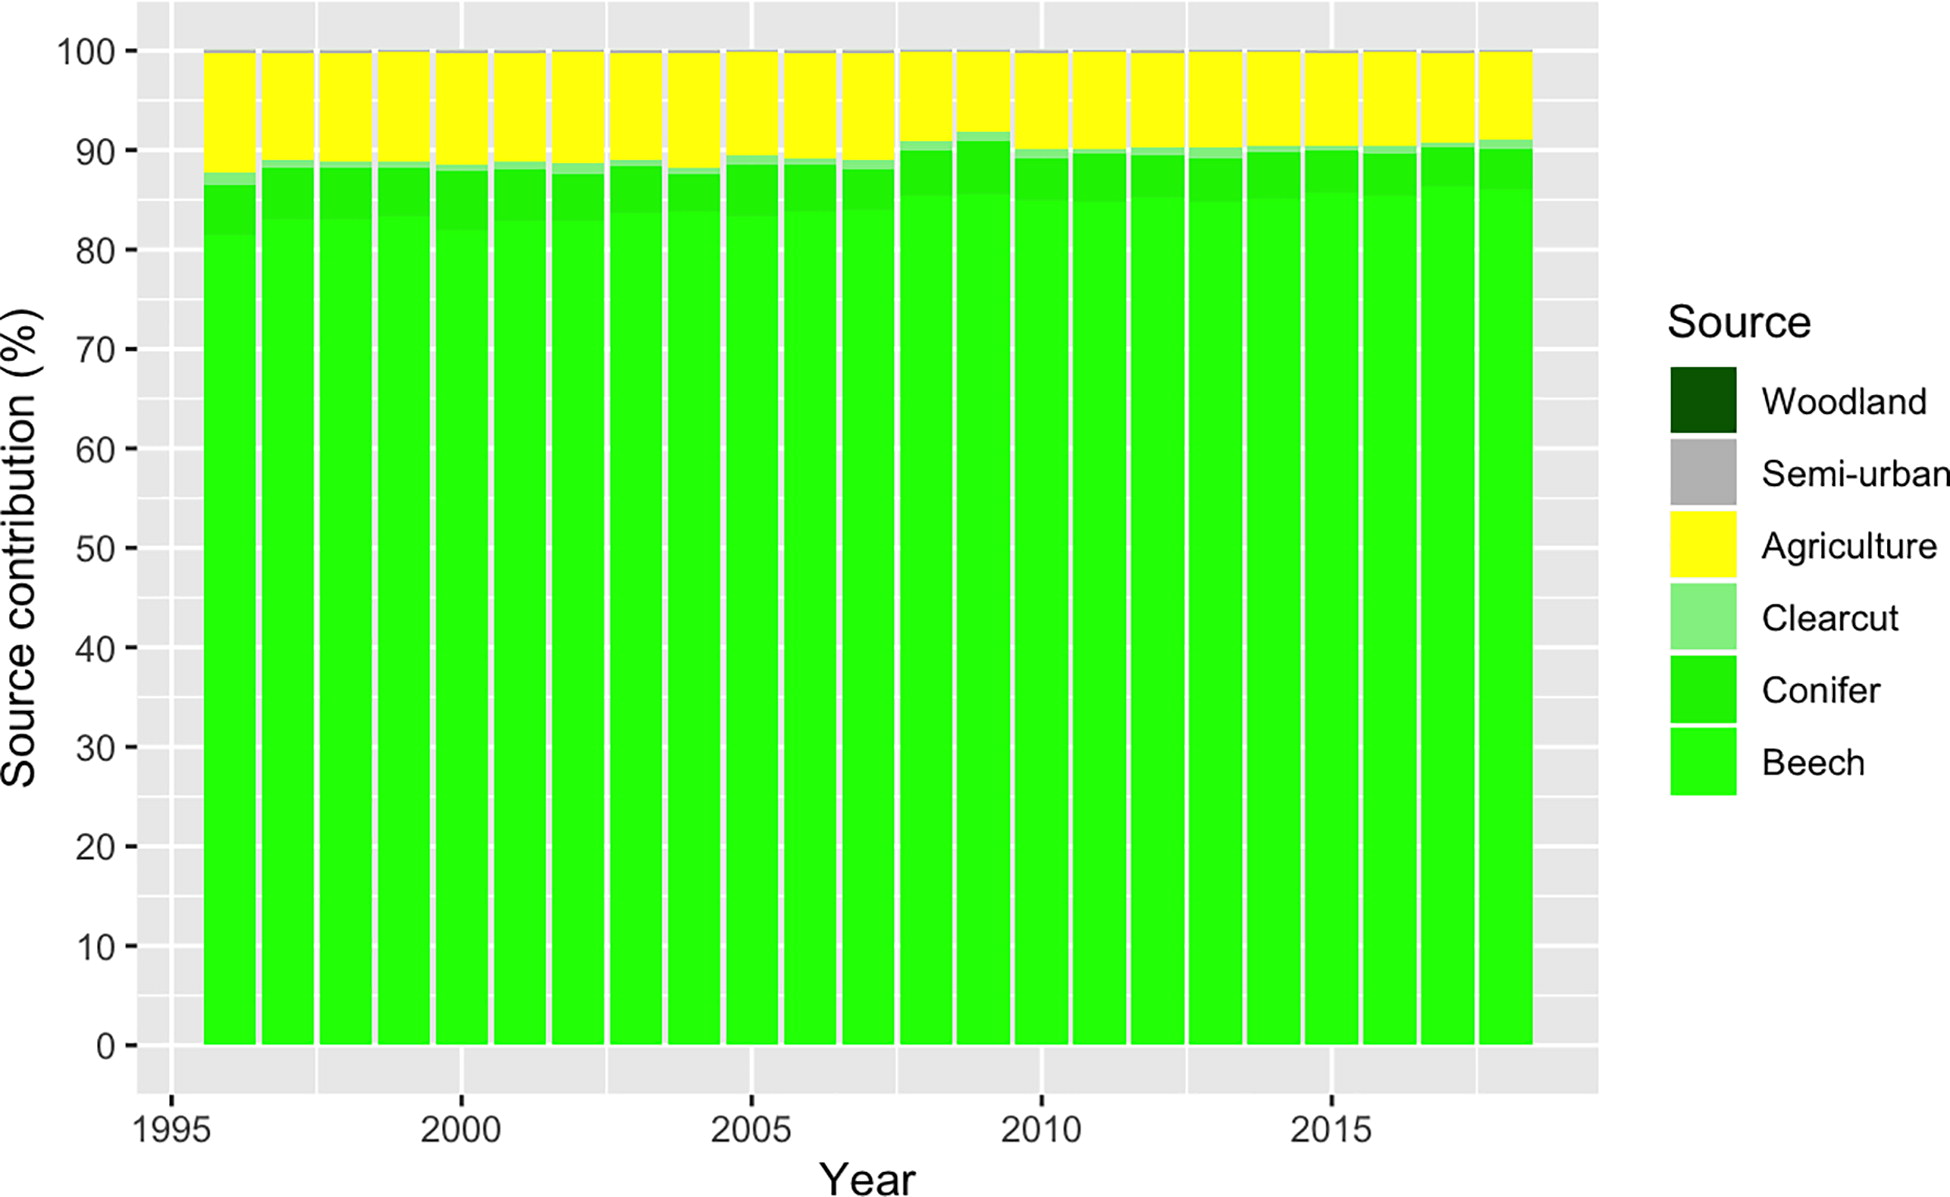
Fig. 9.
Source contribution for the years 1996–2019.
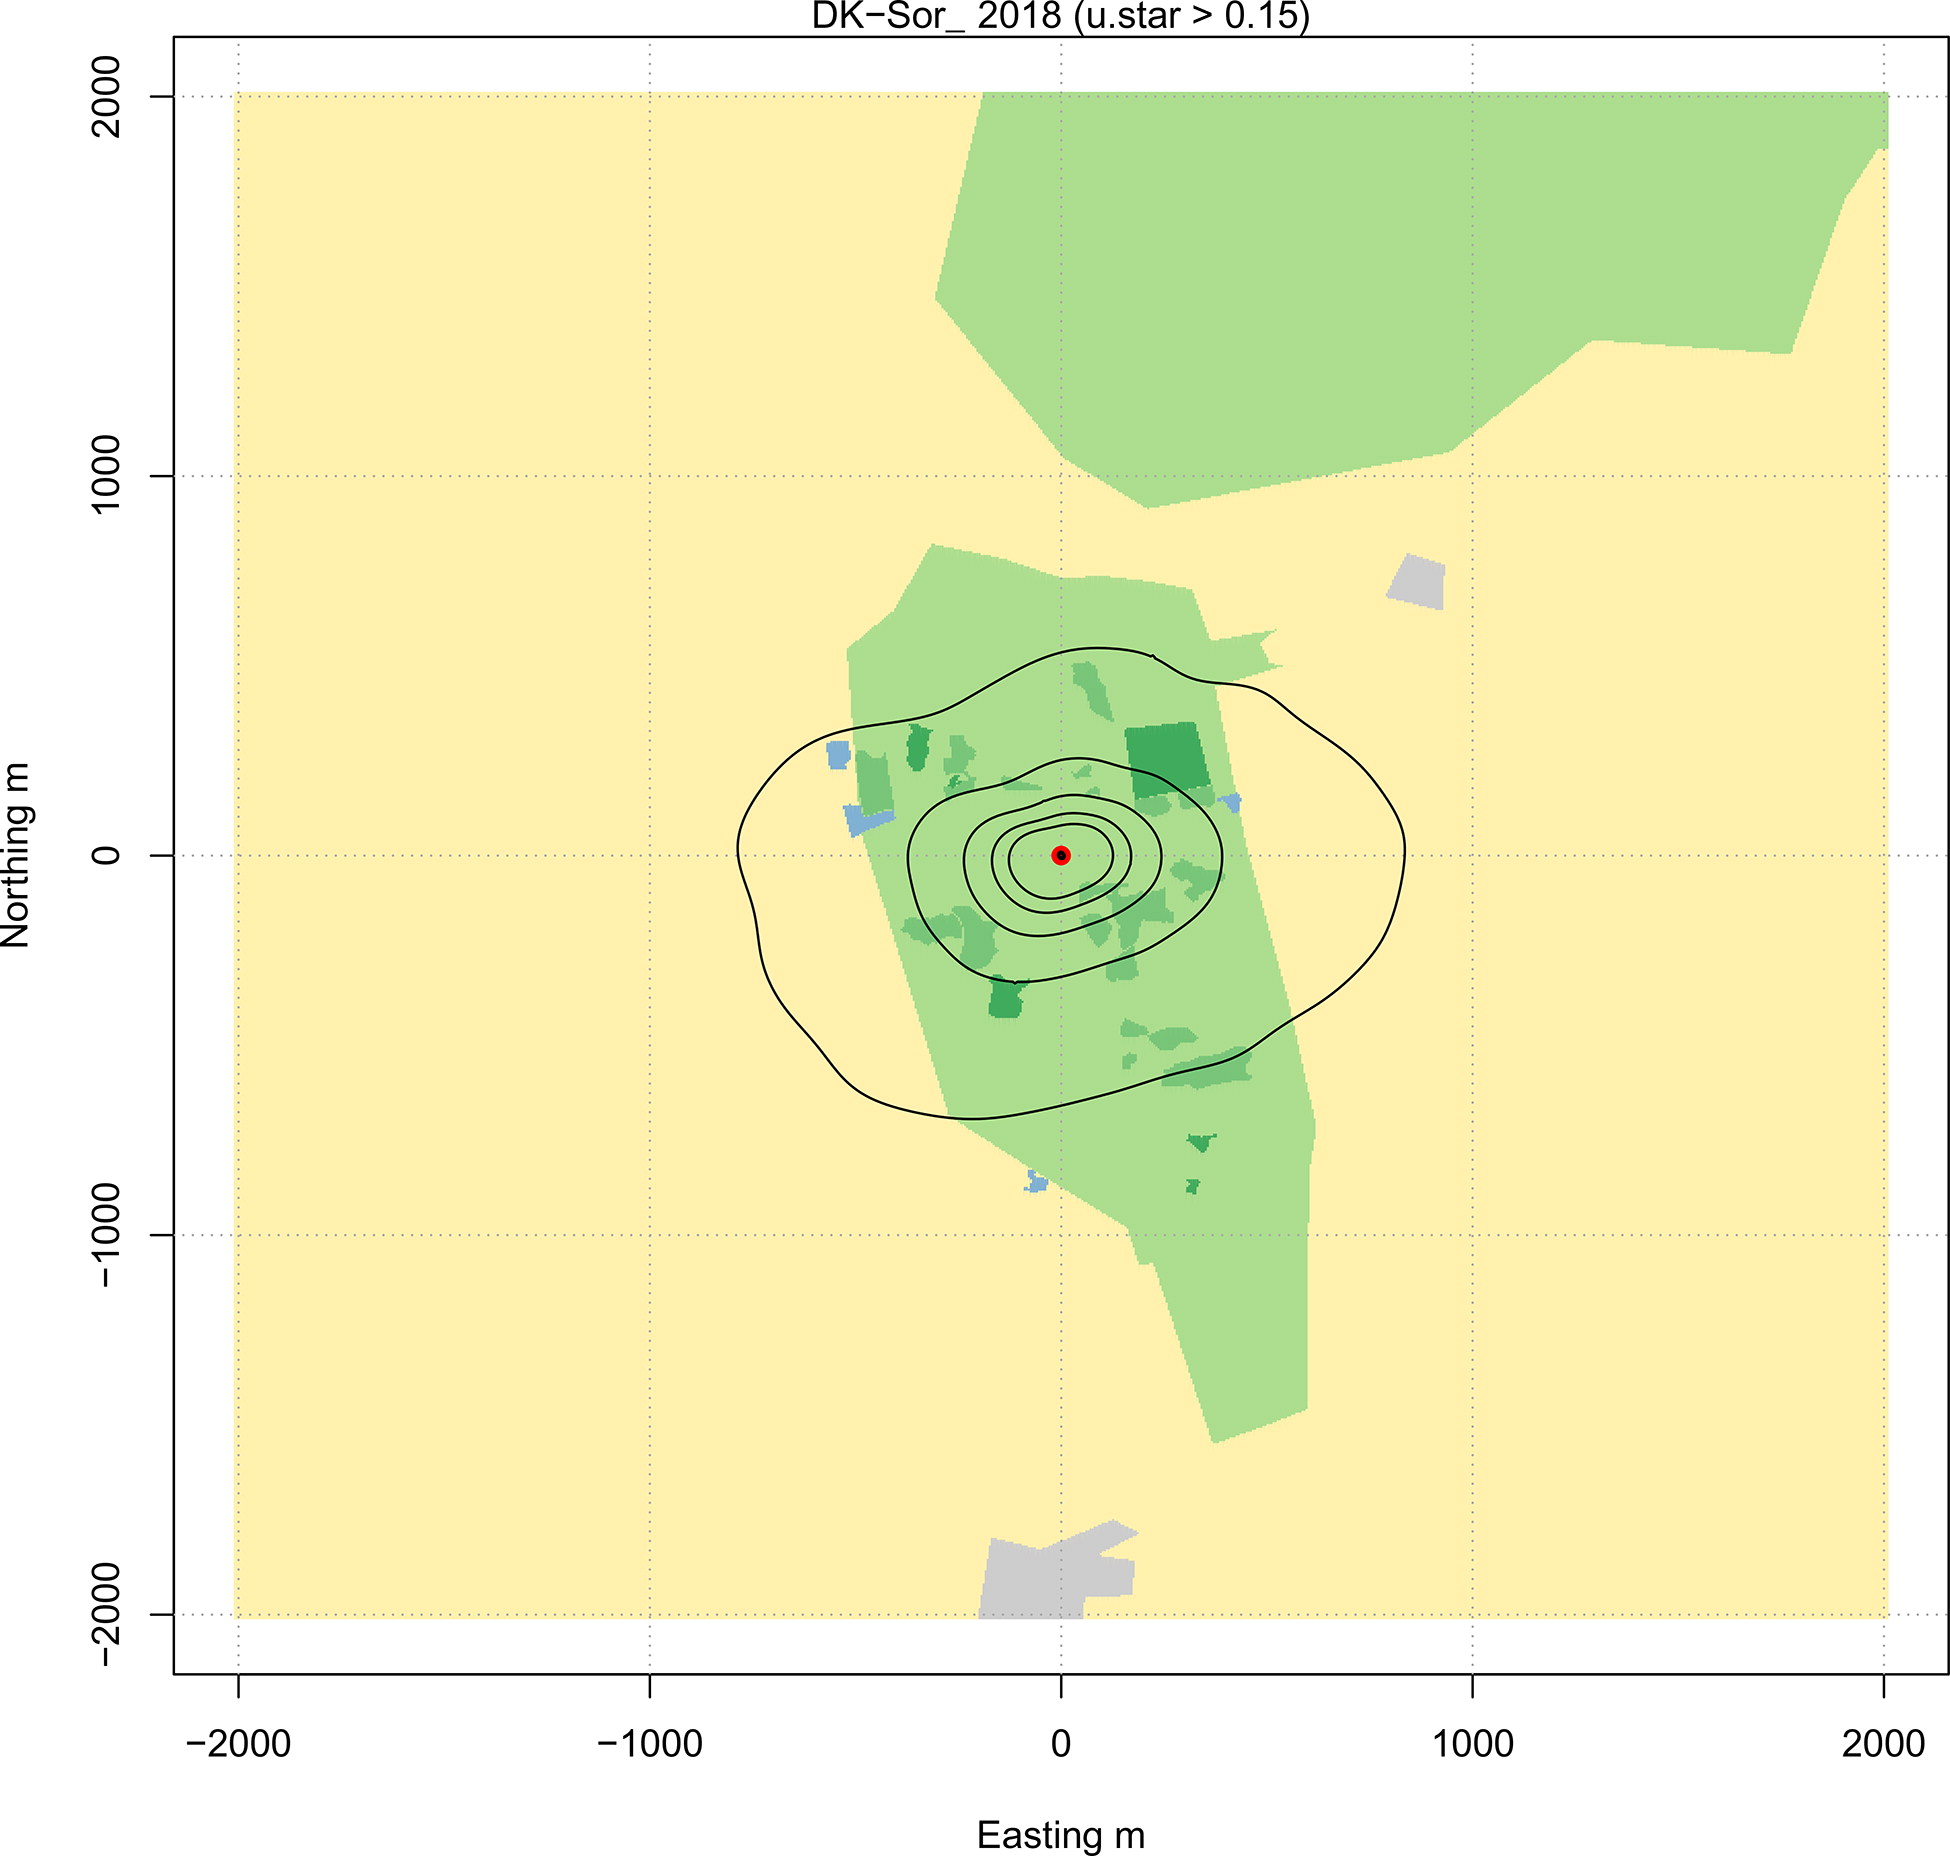
Fig. 10.
Flux foot print for 2018. The red dot depicts the tower location. Footprint contour lines are shown in steps of 10% from 50% to 90%. The background shows land use: beech forest (light green), coniferous forest (green), clear-cut (dark green), agriculture (pale yellow), built-up area (blue), and woodland patches (grey).
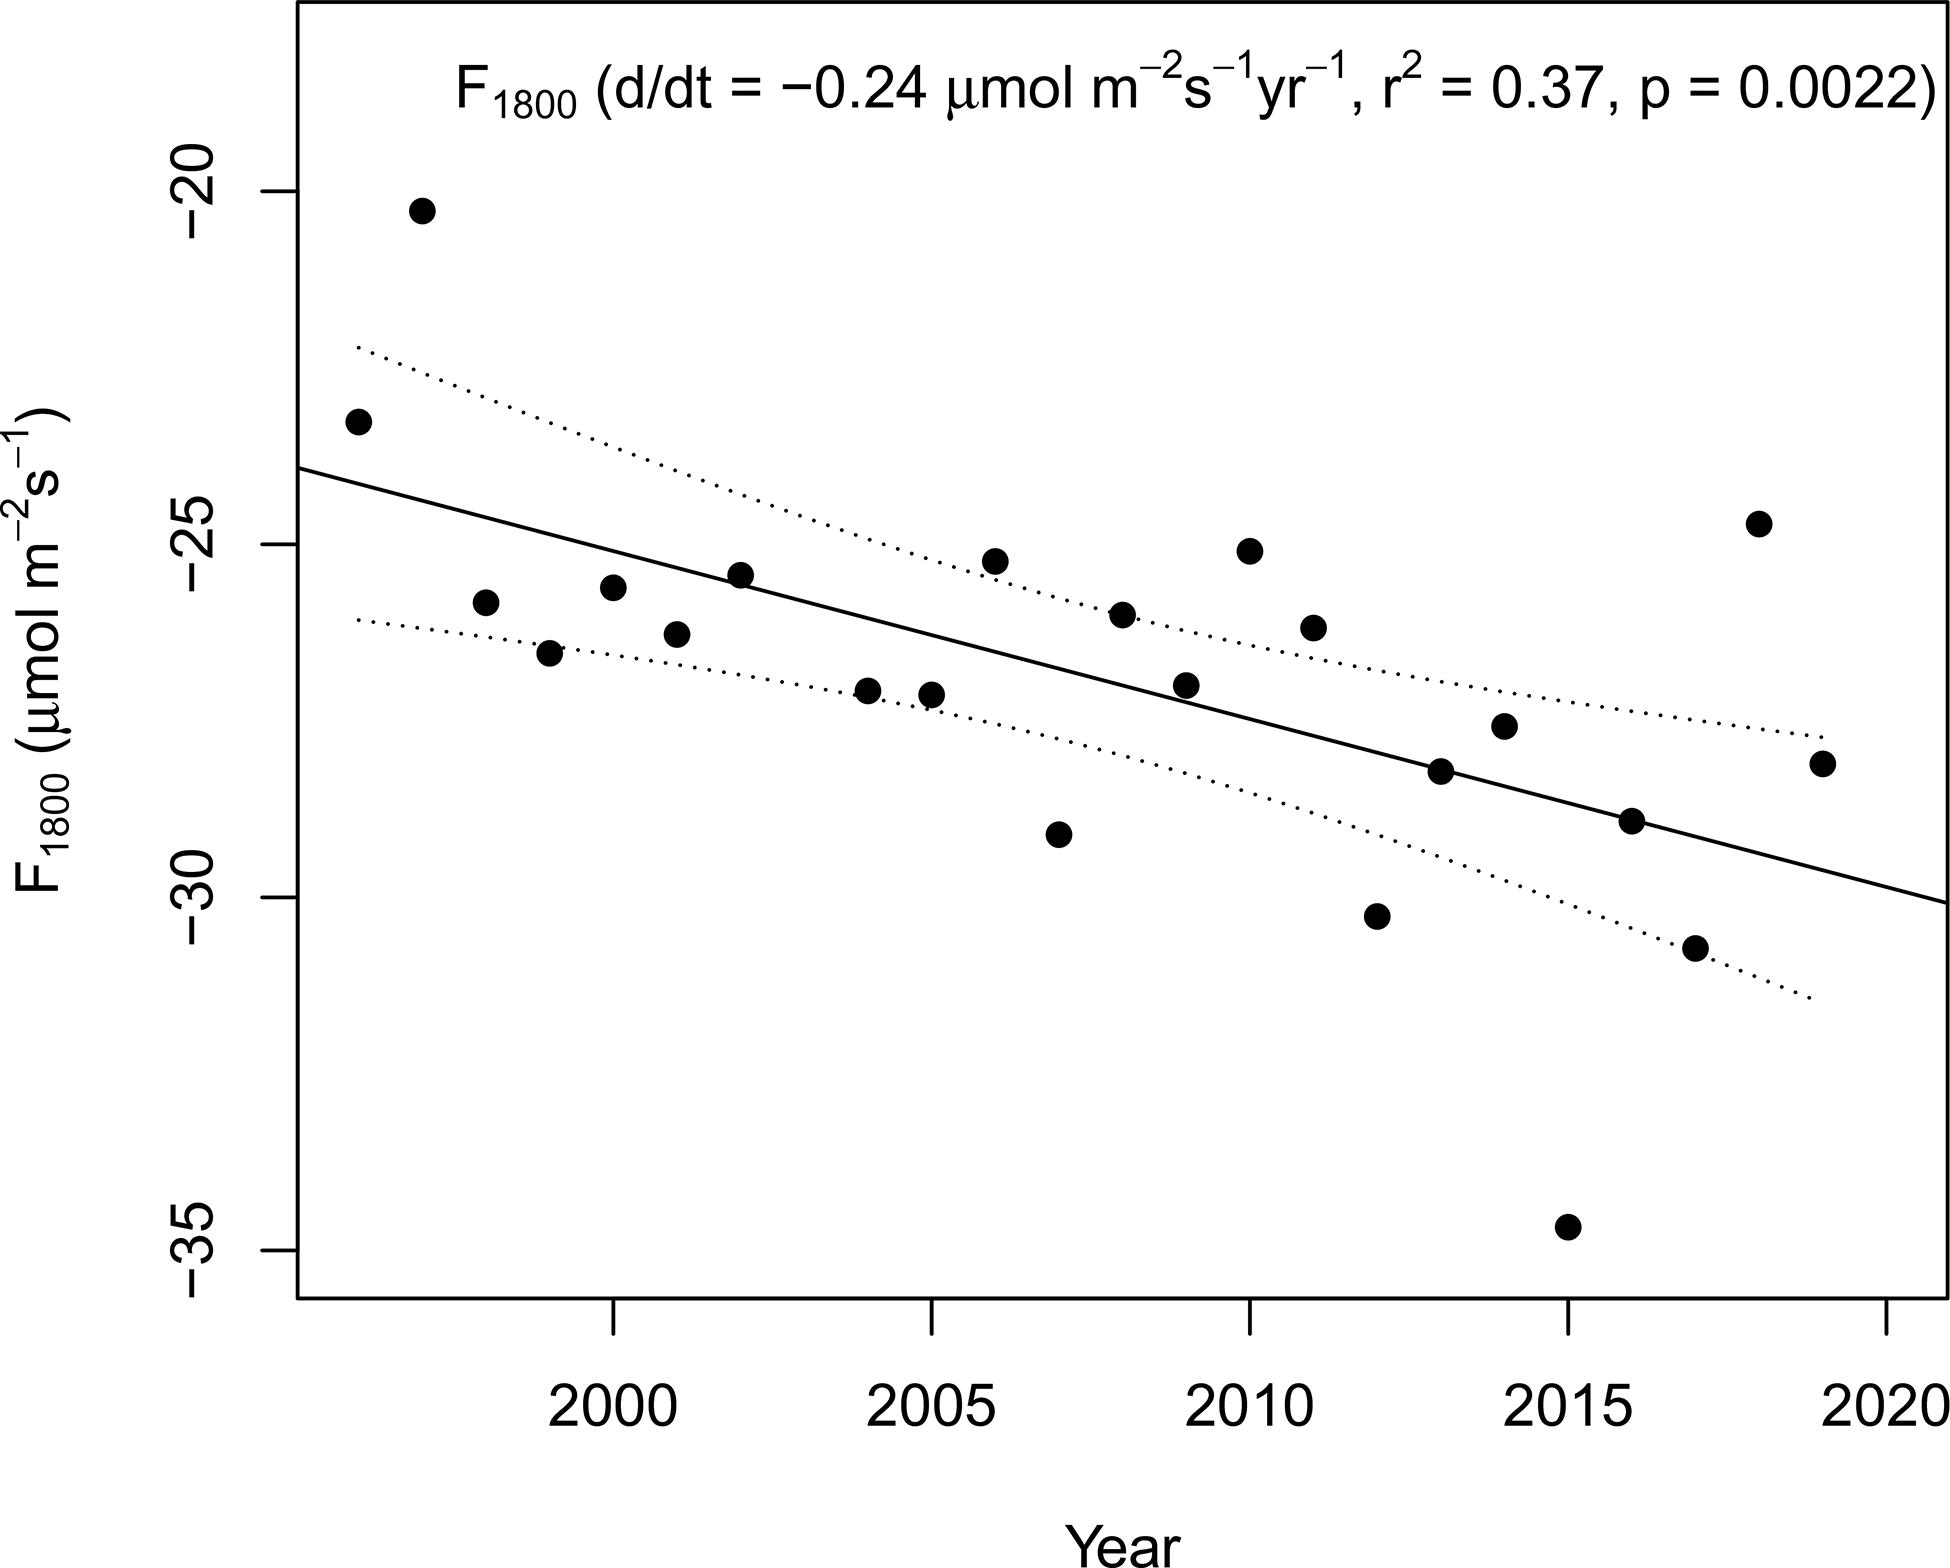
Fig. 11.
Maximum rate of photosynthetic assimilation at Q = 1800 mol m– 2 s−1 (F1800) in June each year from 1996 to 2019. Dotted lines are 95% confidence limits.
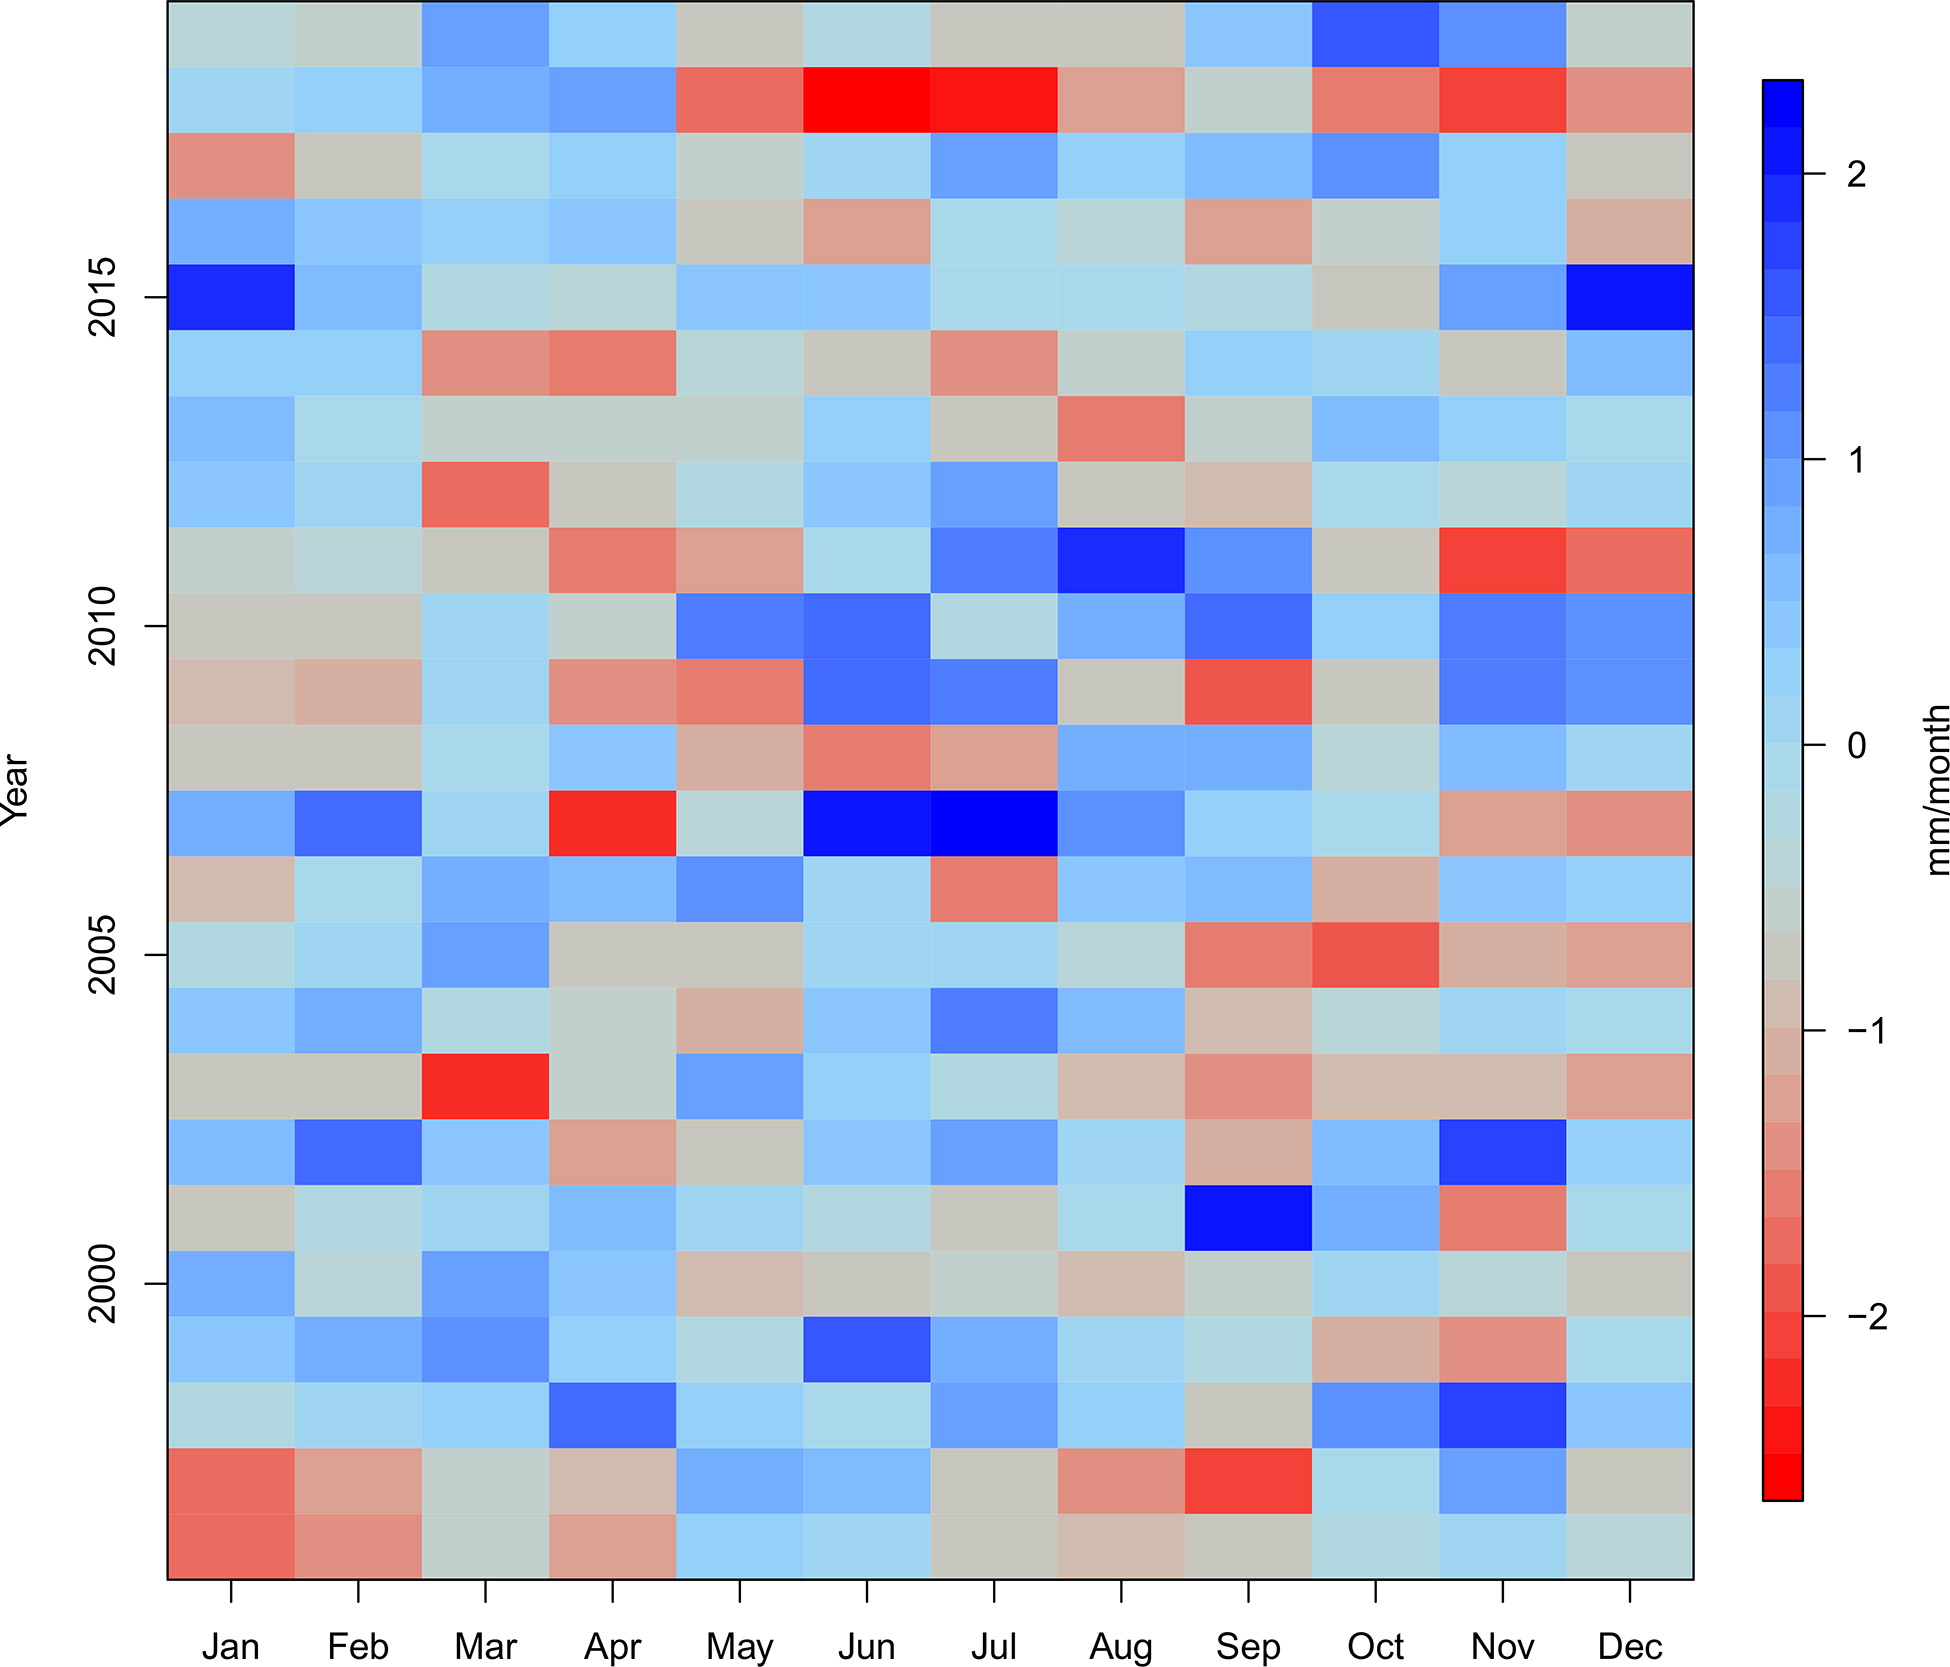
Fig. 12.
Monthly SPEI index for grid cell covering DK-Sor 1996–2019 (Vicente-Serrano et al., 2010).
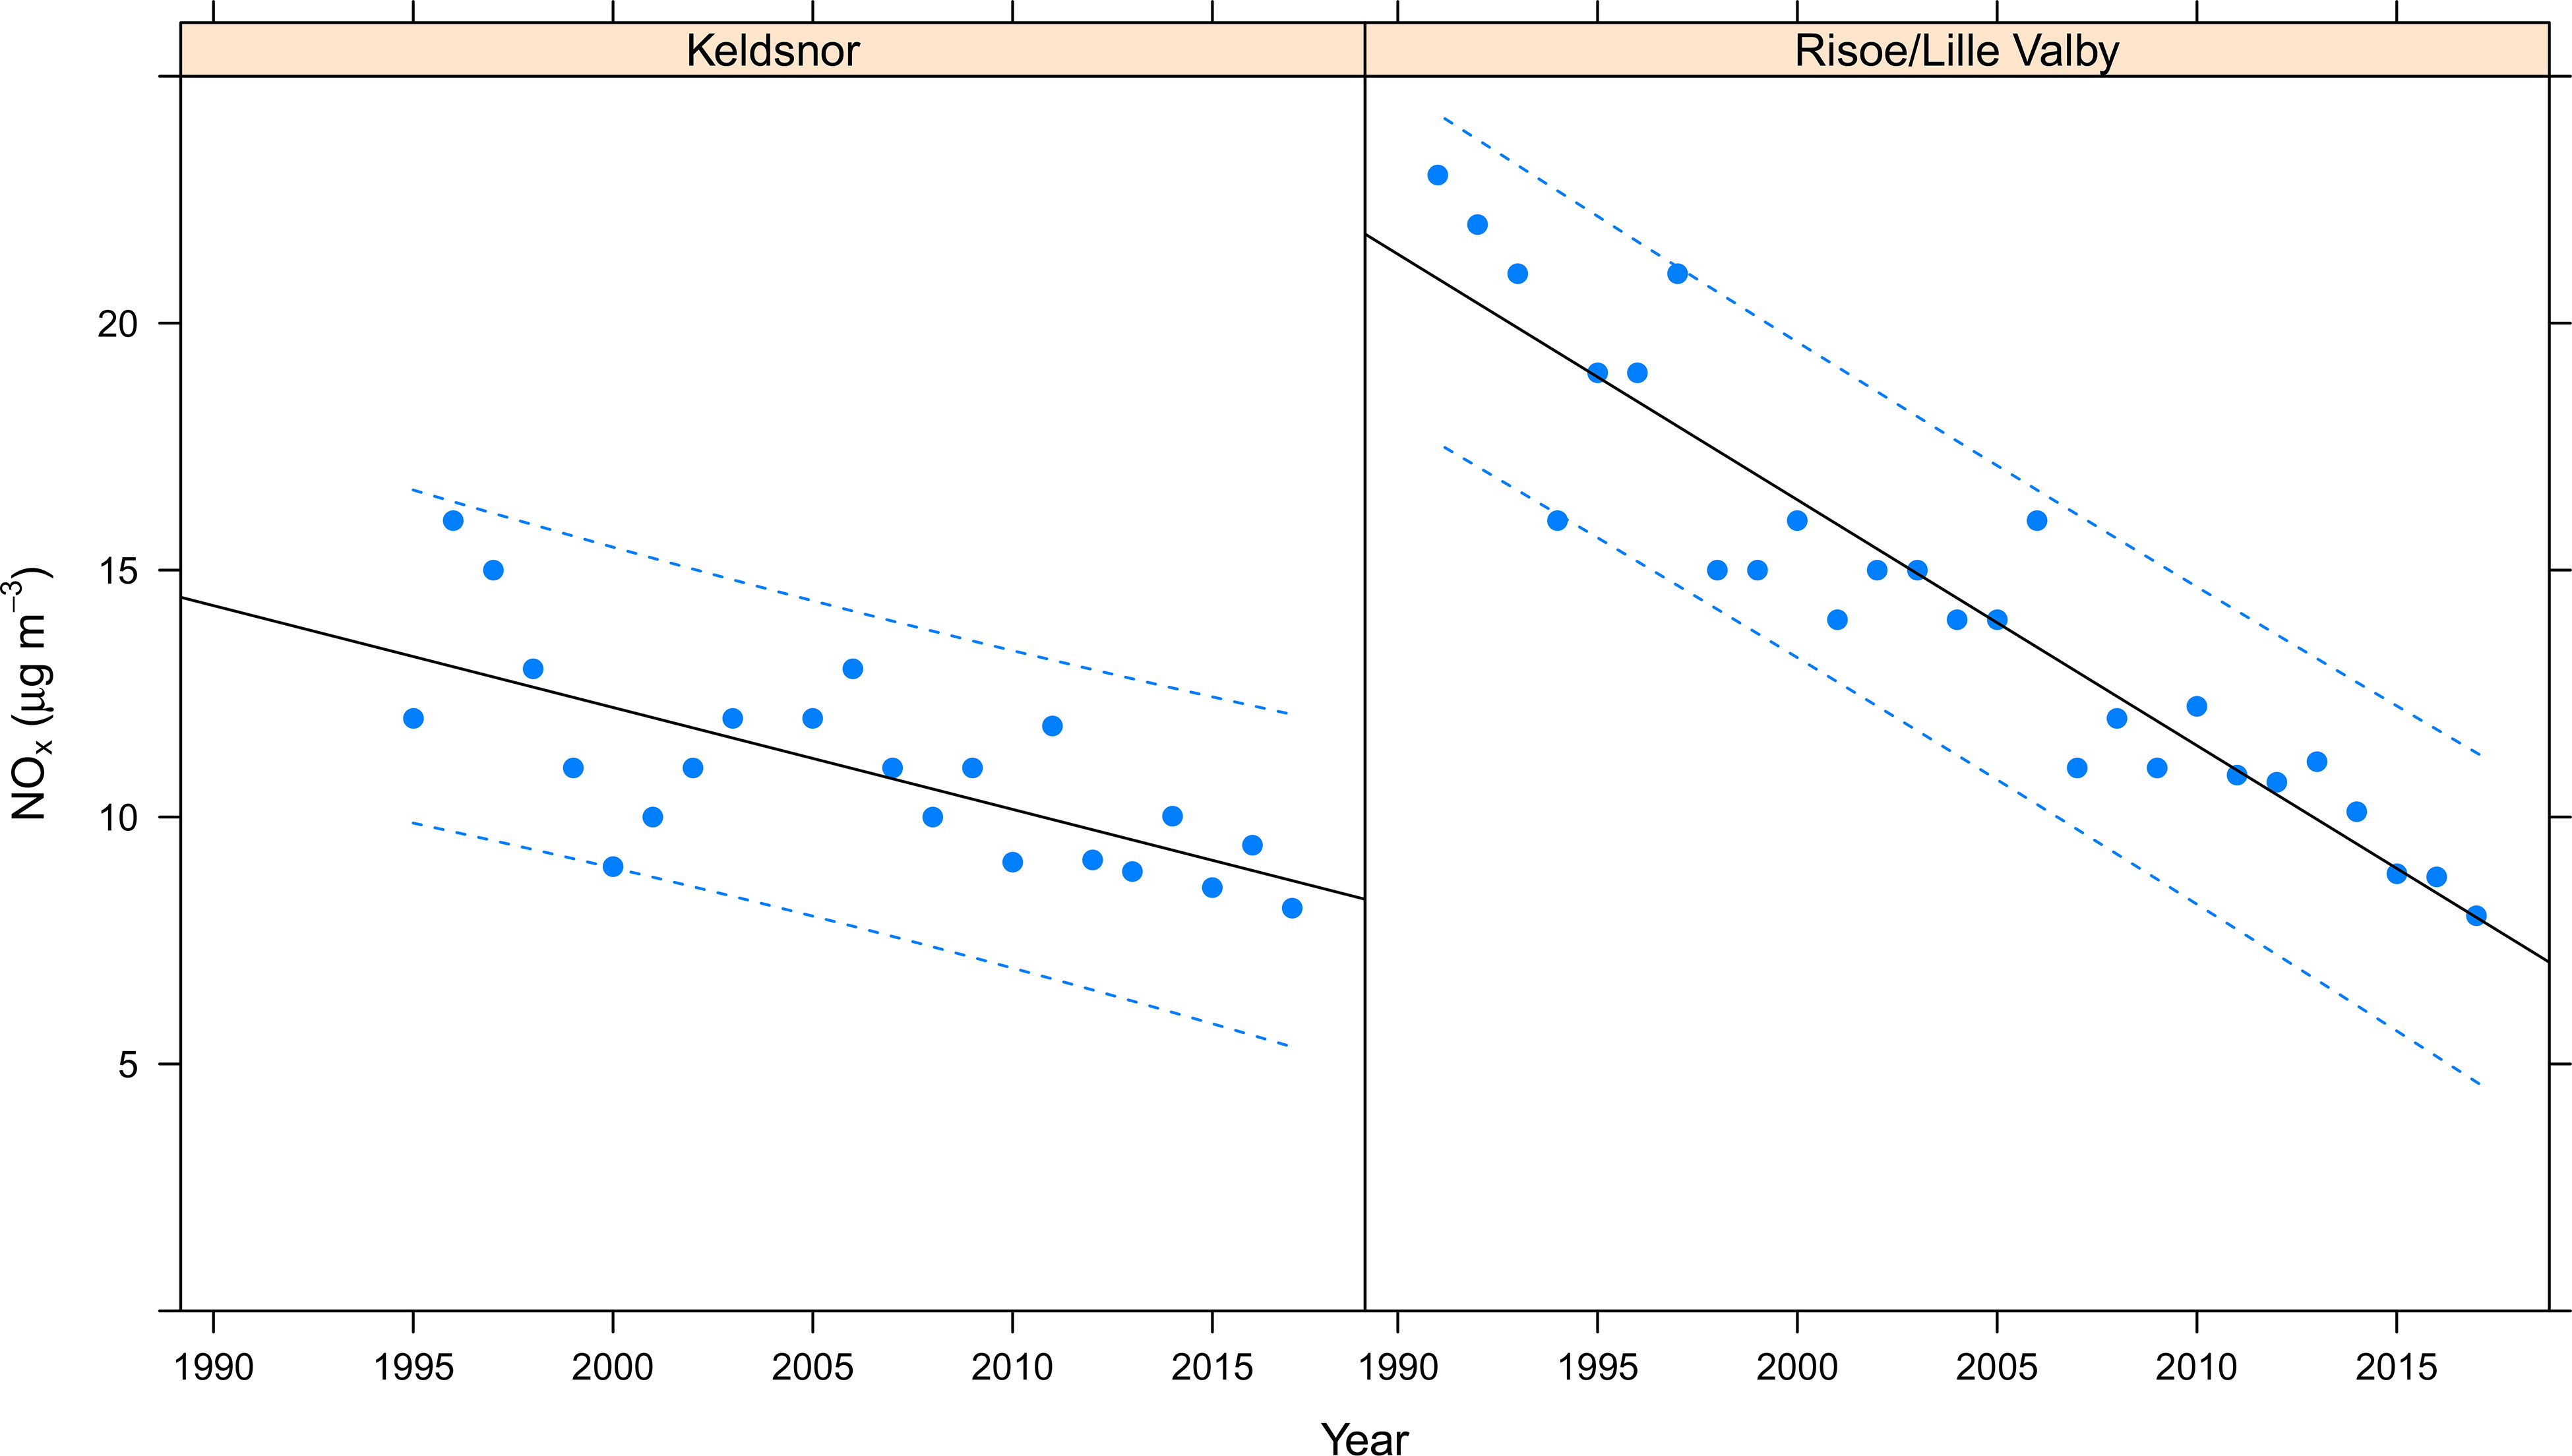
Fig. 13.
Concentration of NO x in the atmosphere (μg m– 3 ) at two air pollution background stations in Denmark (Ellermann et al., 2018).
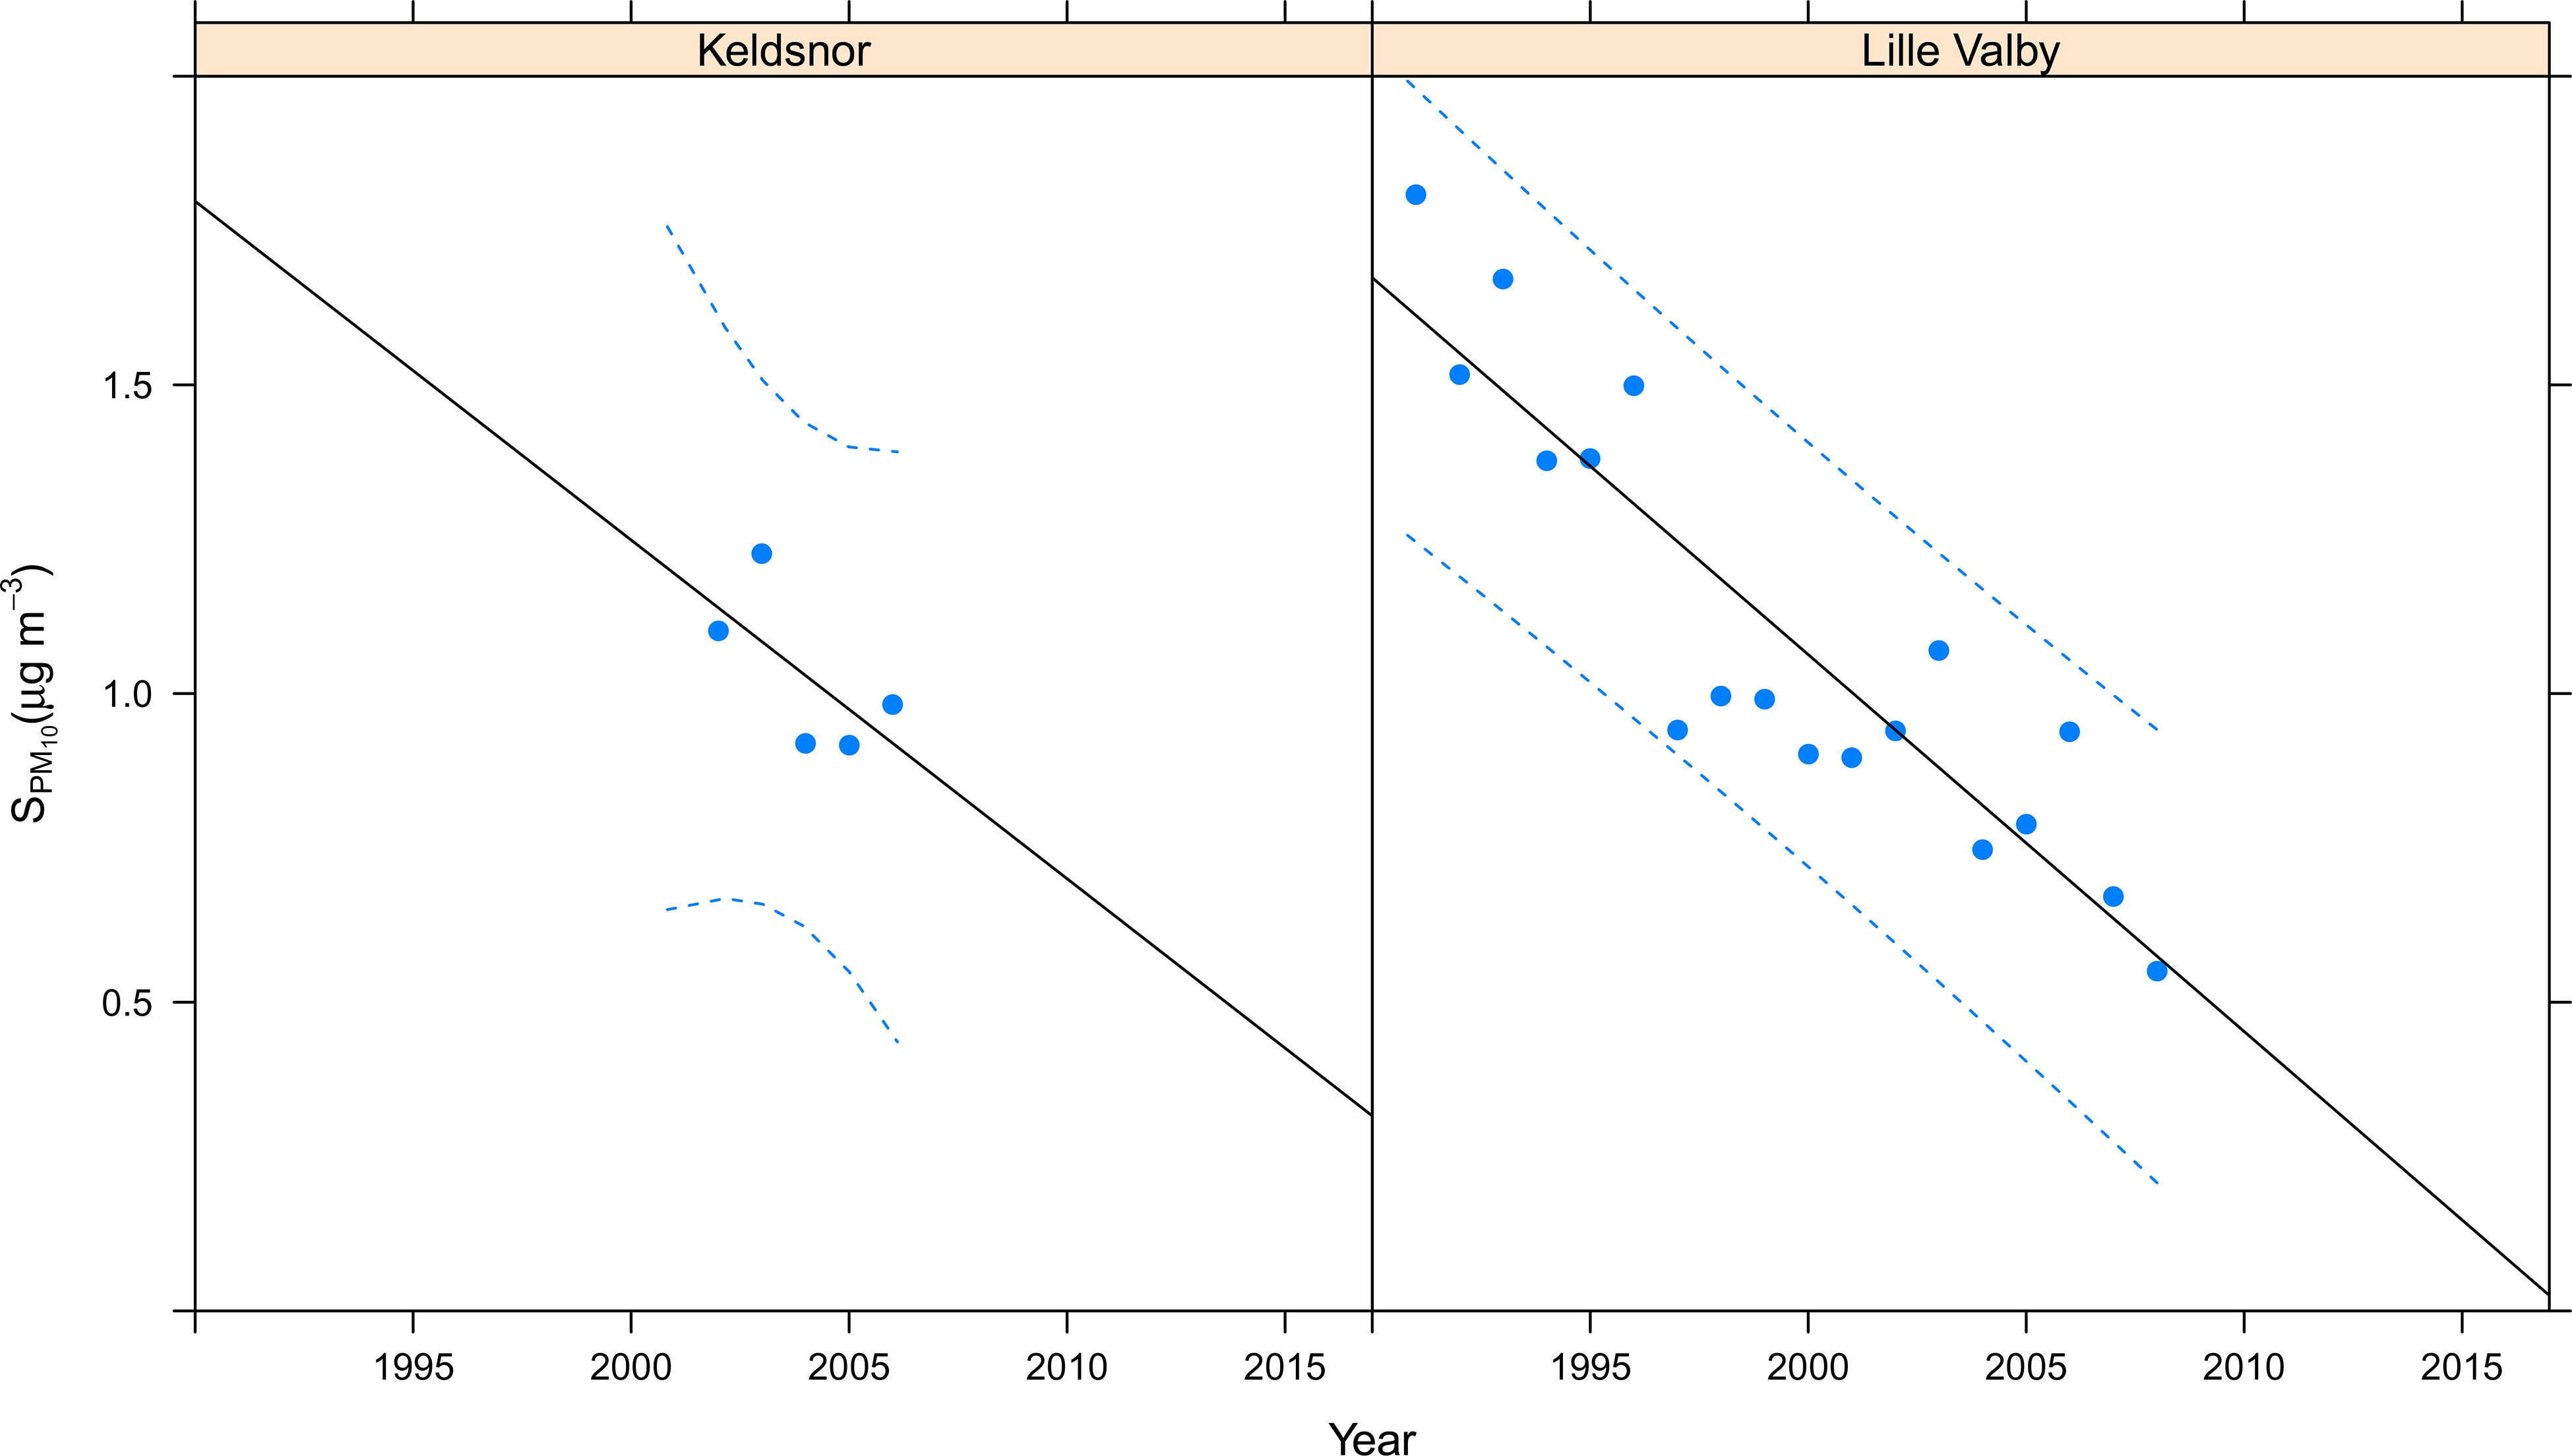
Fig. 14.
Concentration of S in PM10 (μg m– 3 ) at two air pollution background stations in Denmark (Ellermann et al., 2018).
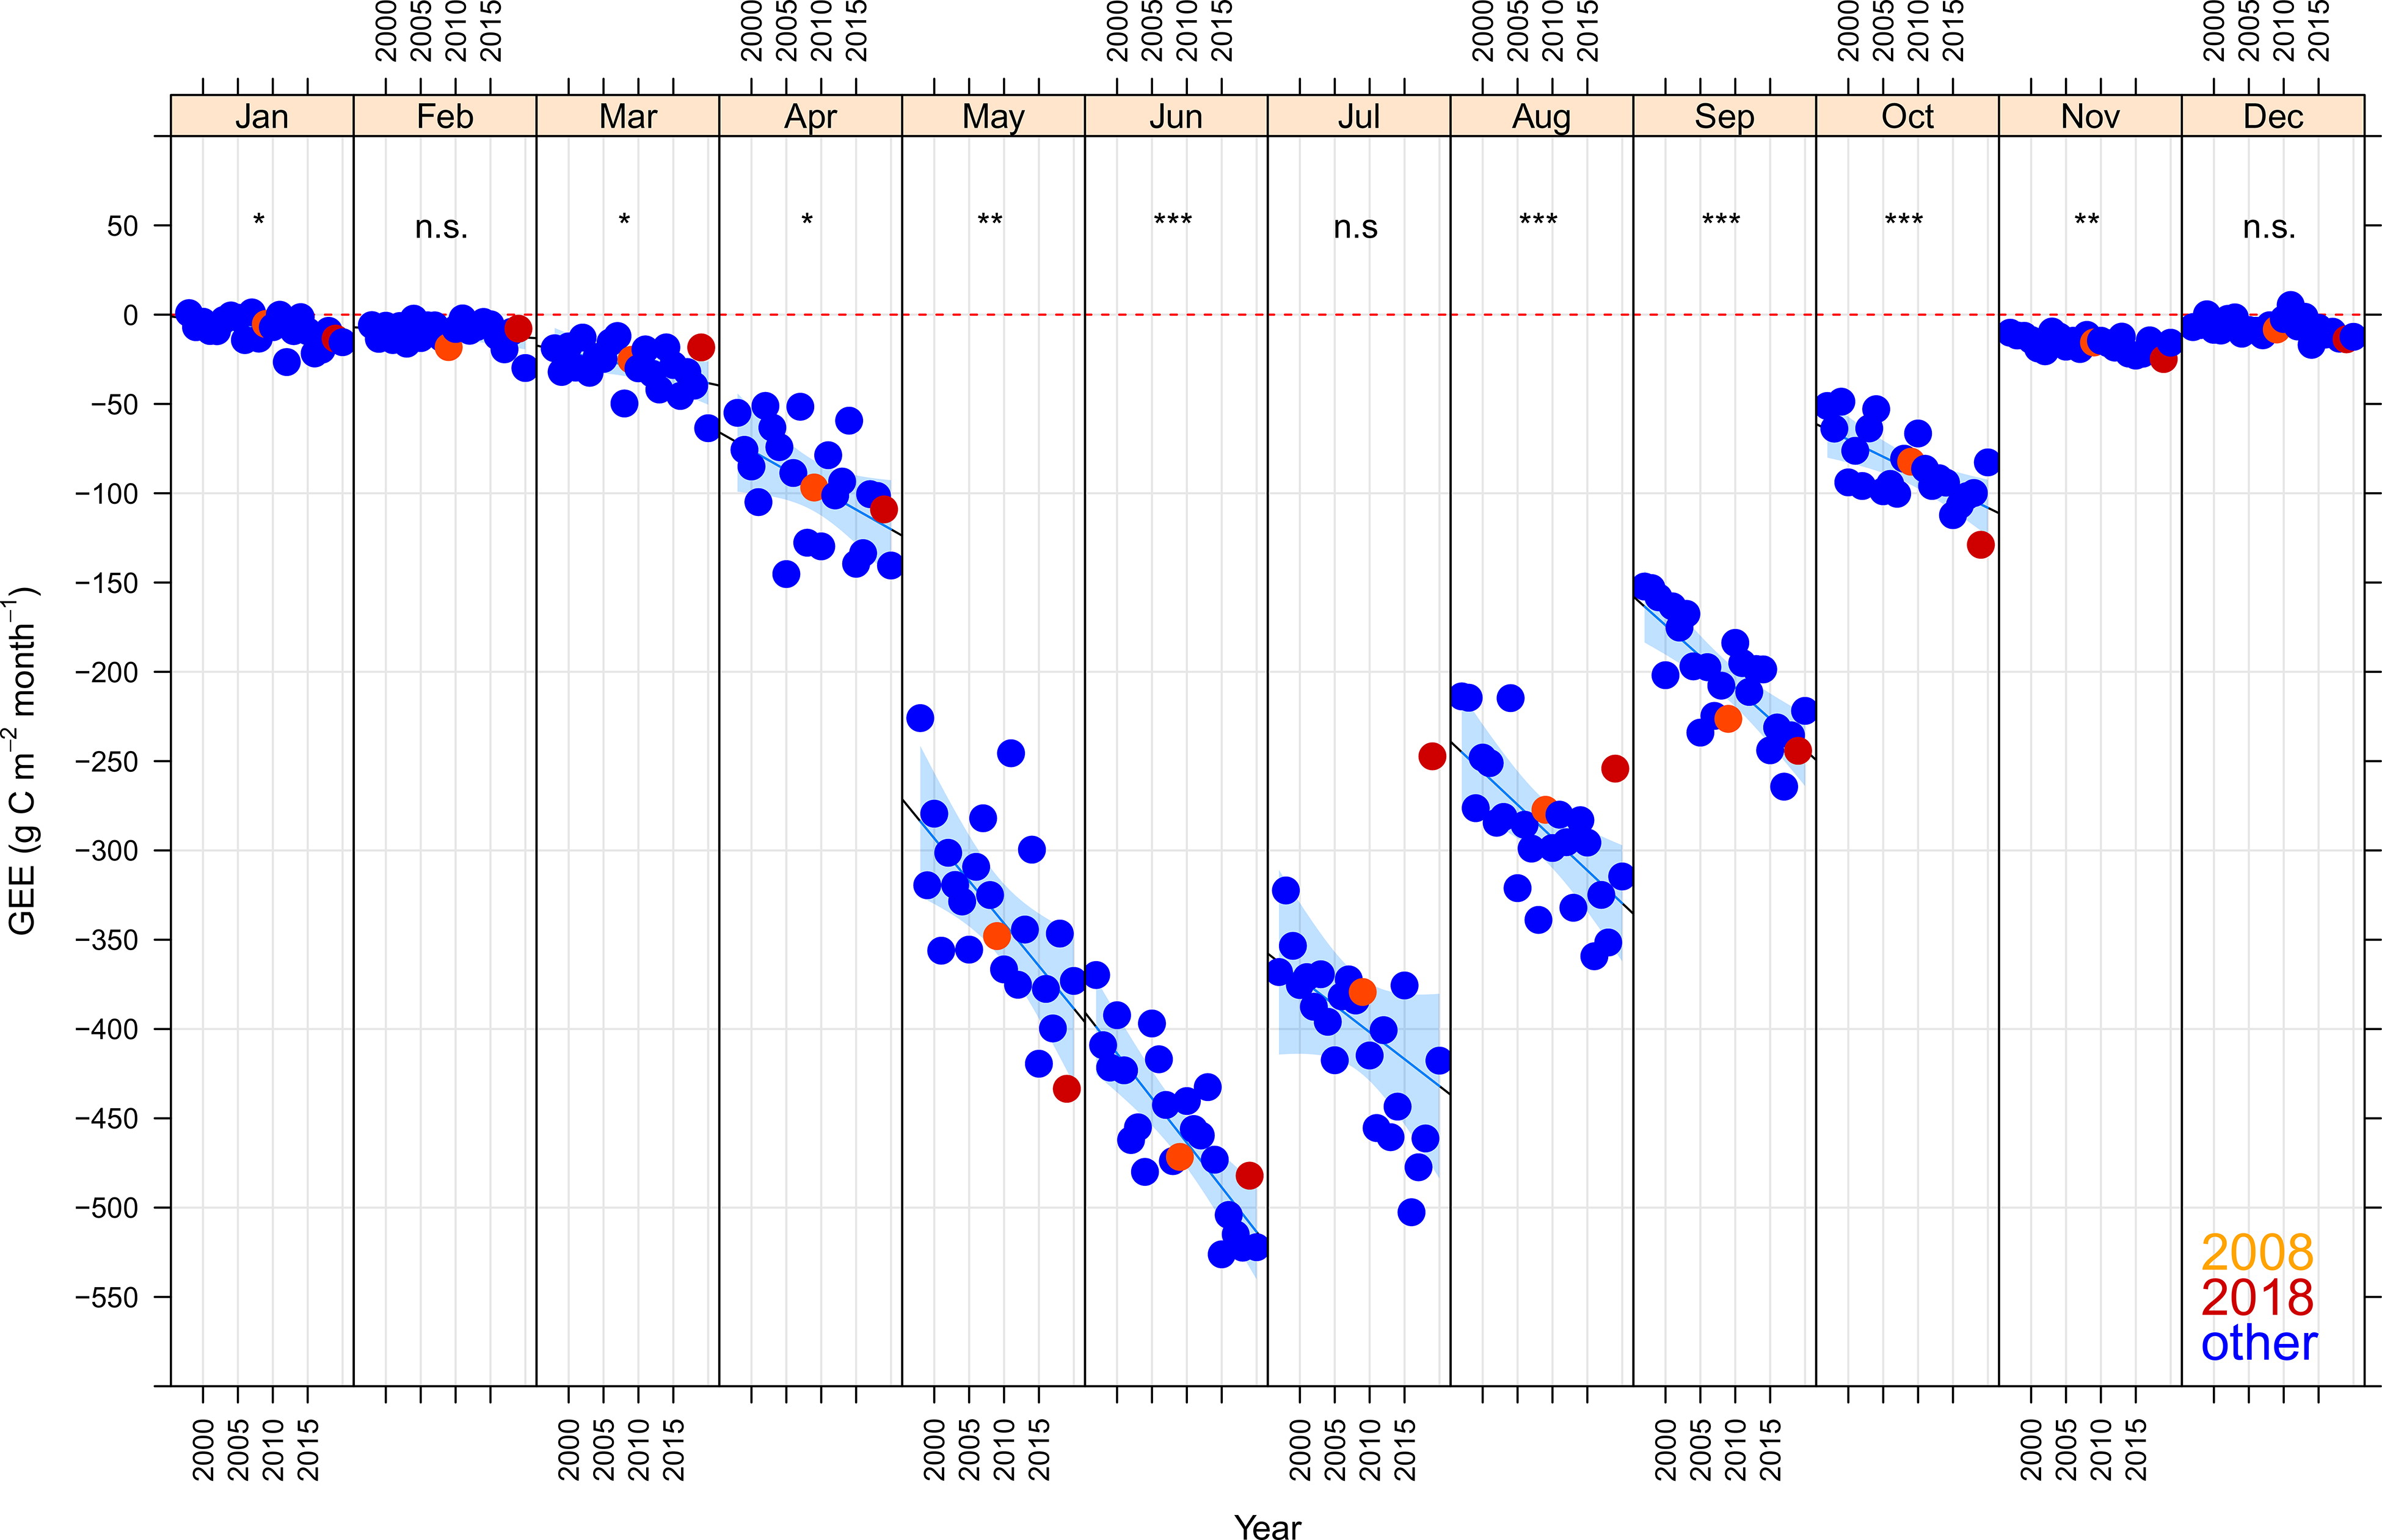
Fig. A1.
GEE by month and year with regression lines and 99.9% confidence limits (shaded areas). Significance of slope indicated for each month. n.s = not significant, * = p < 0.05, ** = p < 0.01, *** = p < 0.001. Years with significant signs of summer drought indicated with different colours.
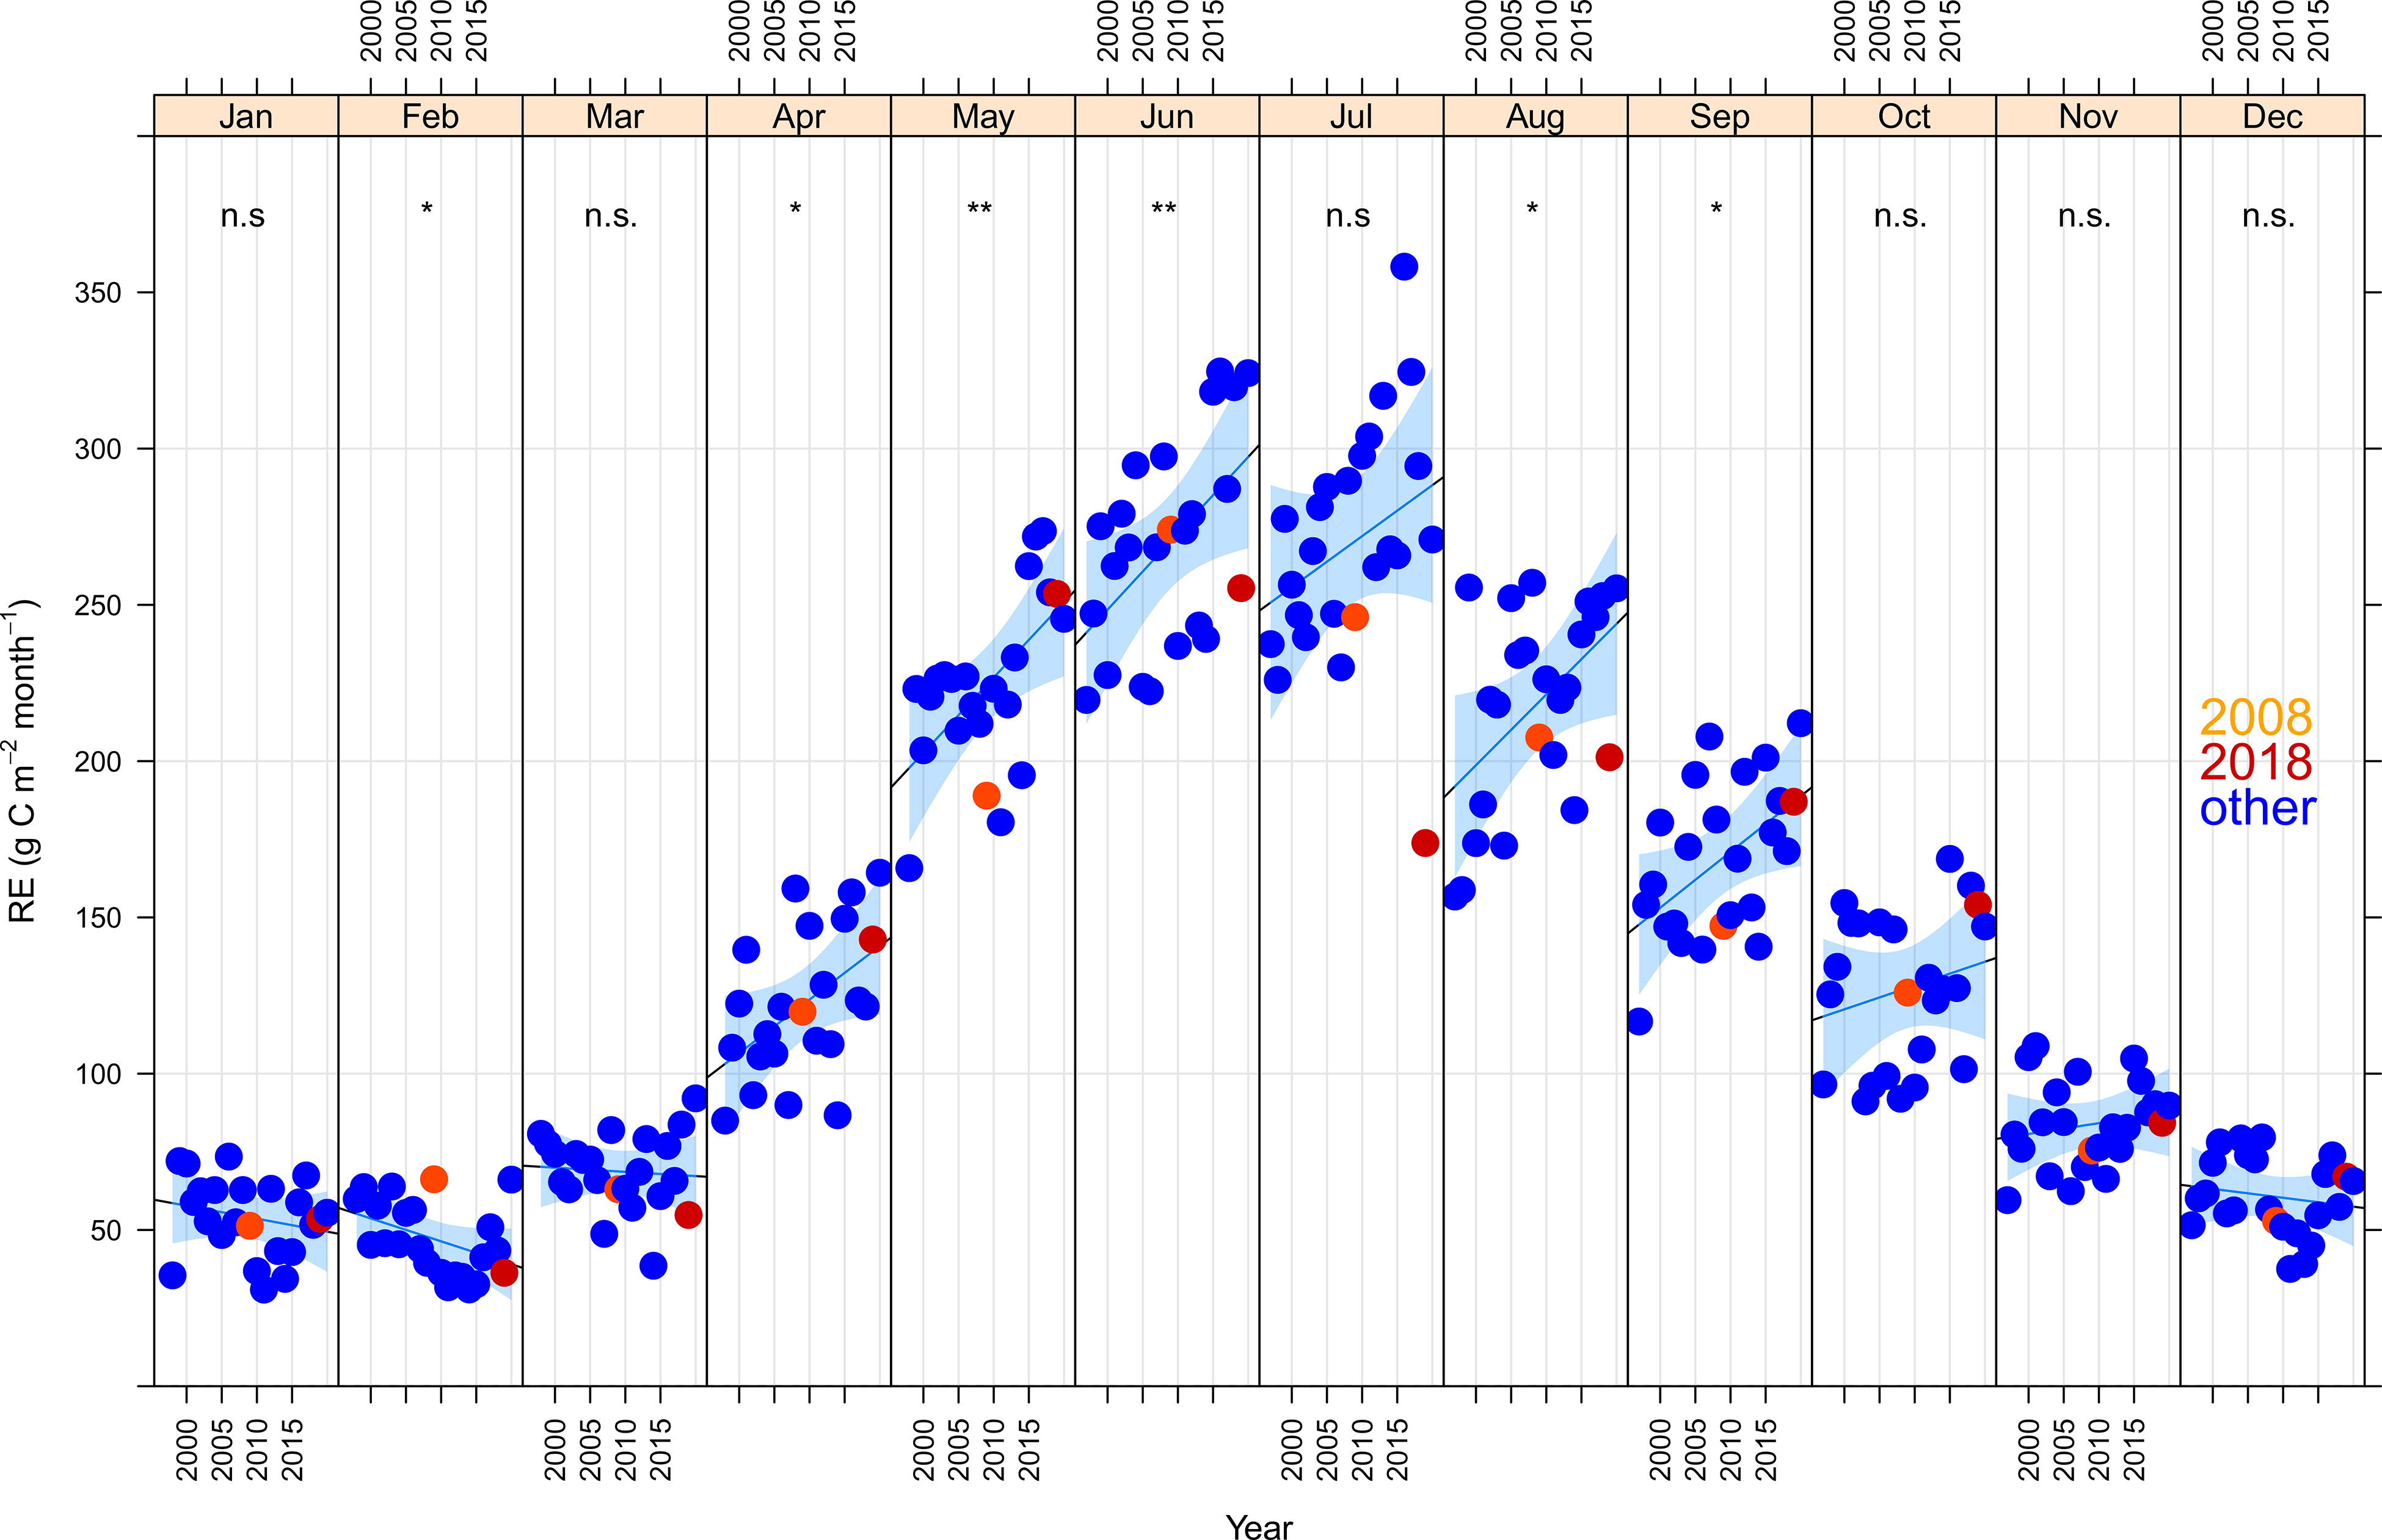
Fig. A2.
RE by month and year with regression lines and 99.9% confidence limits (shaded areas). Significance of slope indicated for each month. n.s = not significant, * = p < 0.05, ** = p < 0.01, *** = p < 0.001. Years with significant signs of summer drought indicated with different colours.