
Table 1.
The durations and AMS data coverages for the three intensive measurement campaigns organized in 2012, 2014 and 2016.
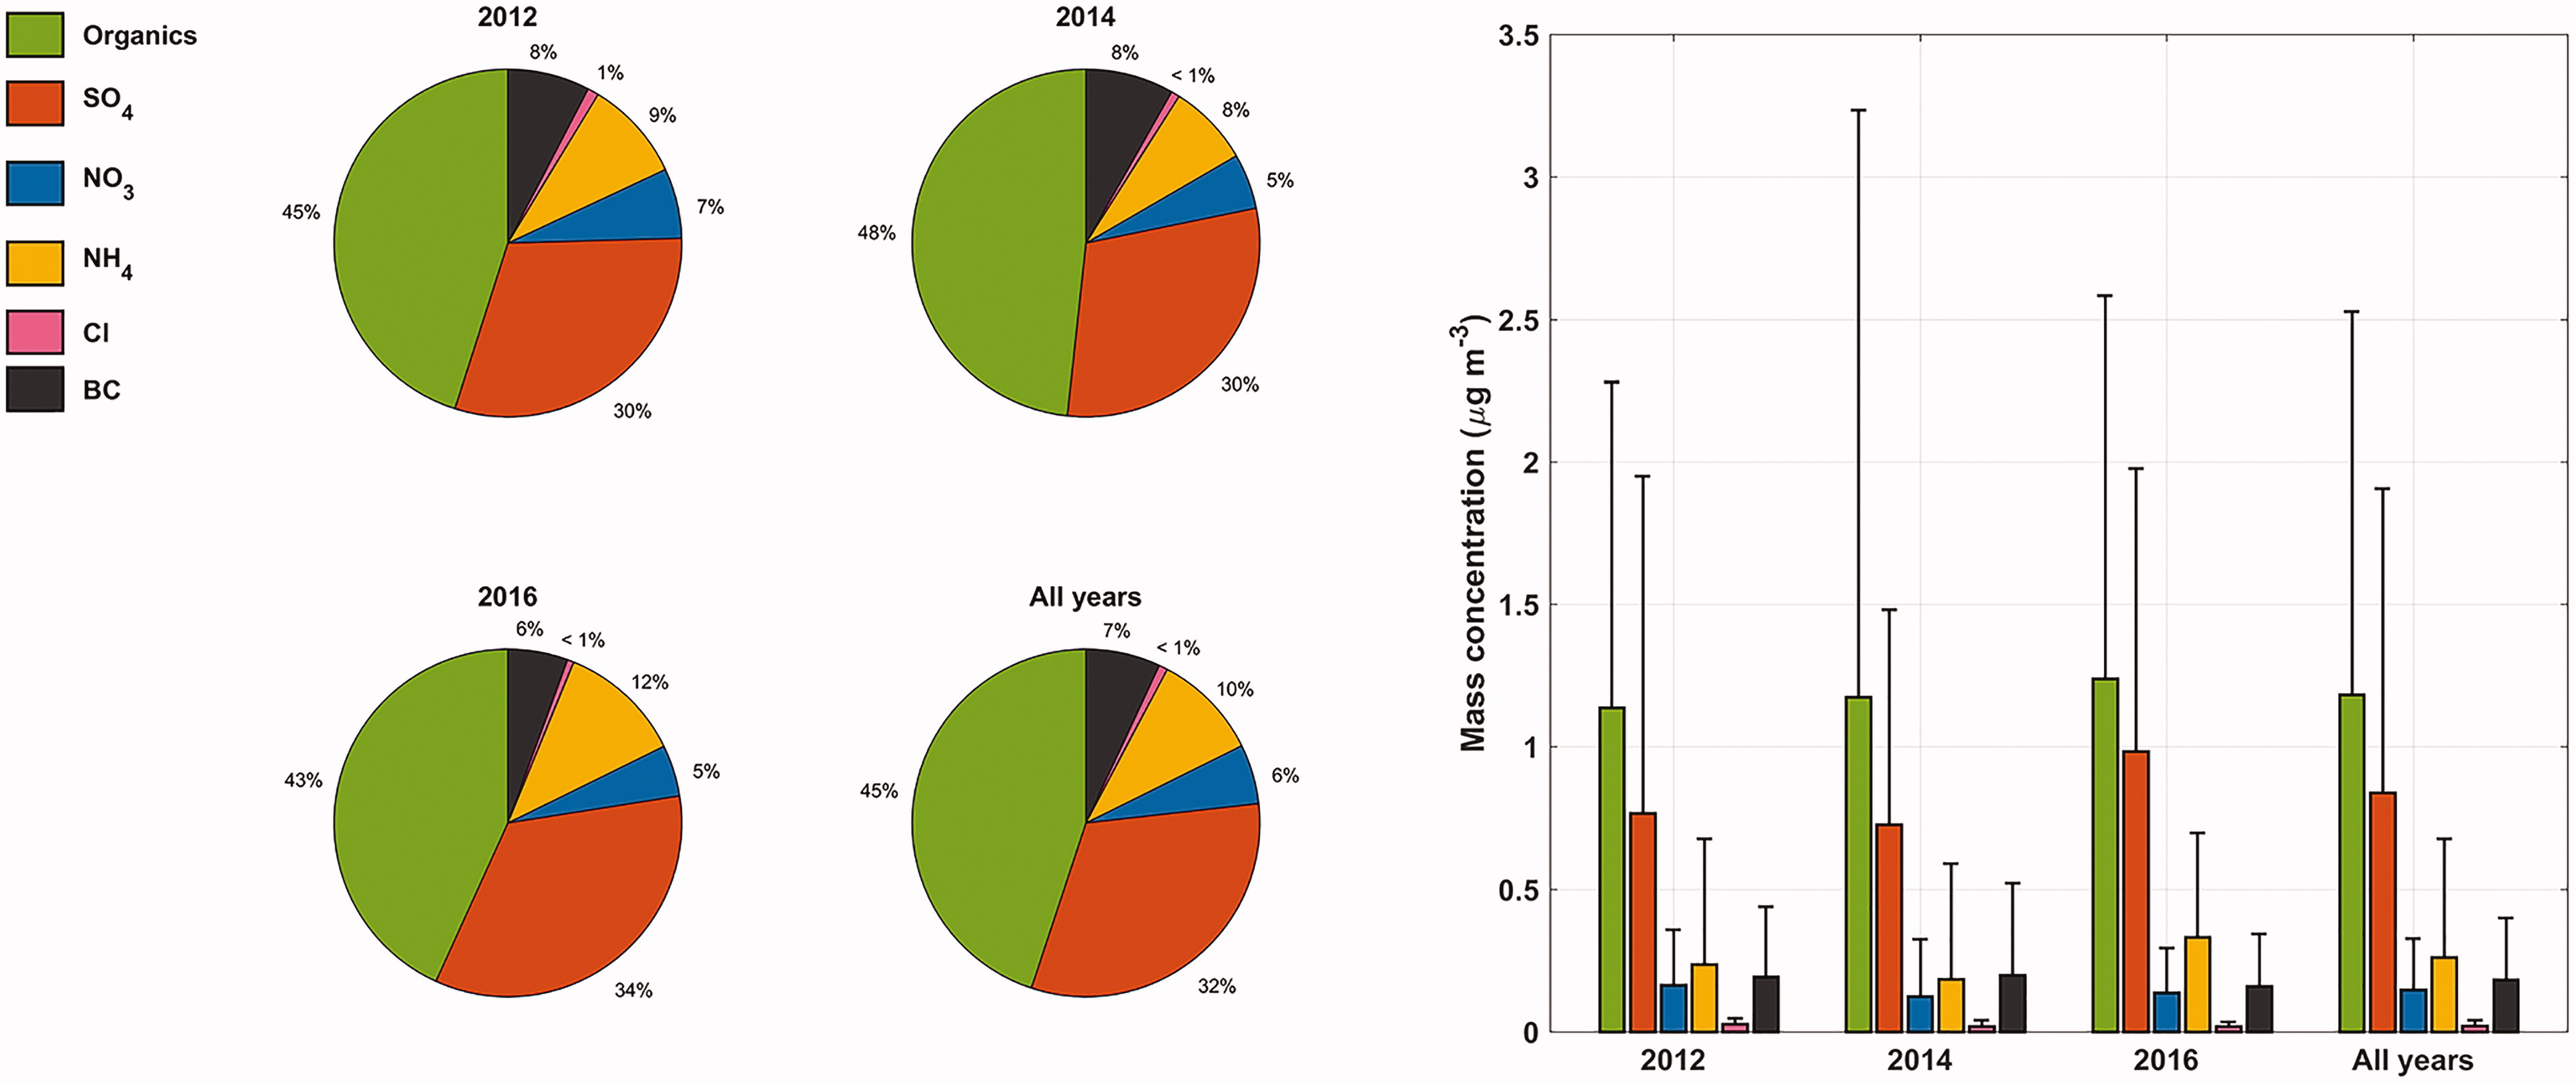
Fig. 1.
The average aerosol chemical composition measured at the Puijo station during the intensive measurement campaigns in 2012, 2014 and 2016. The whiskers in the mass concentration plot illustrate the range below the 90th percentile.
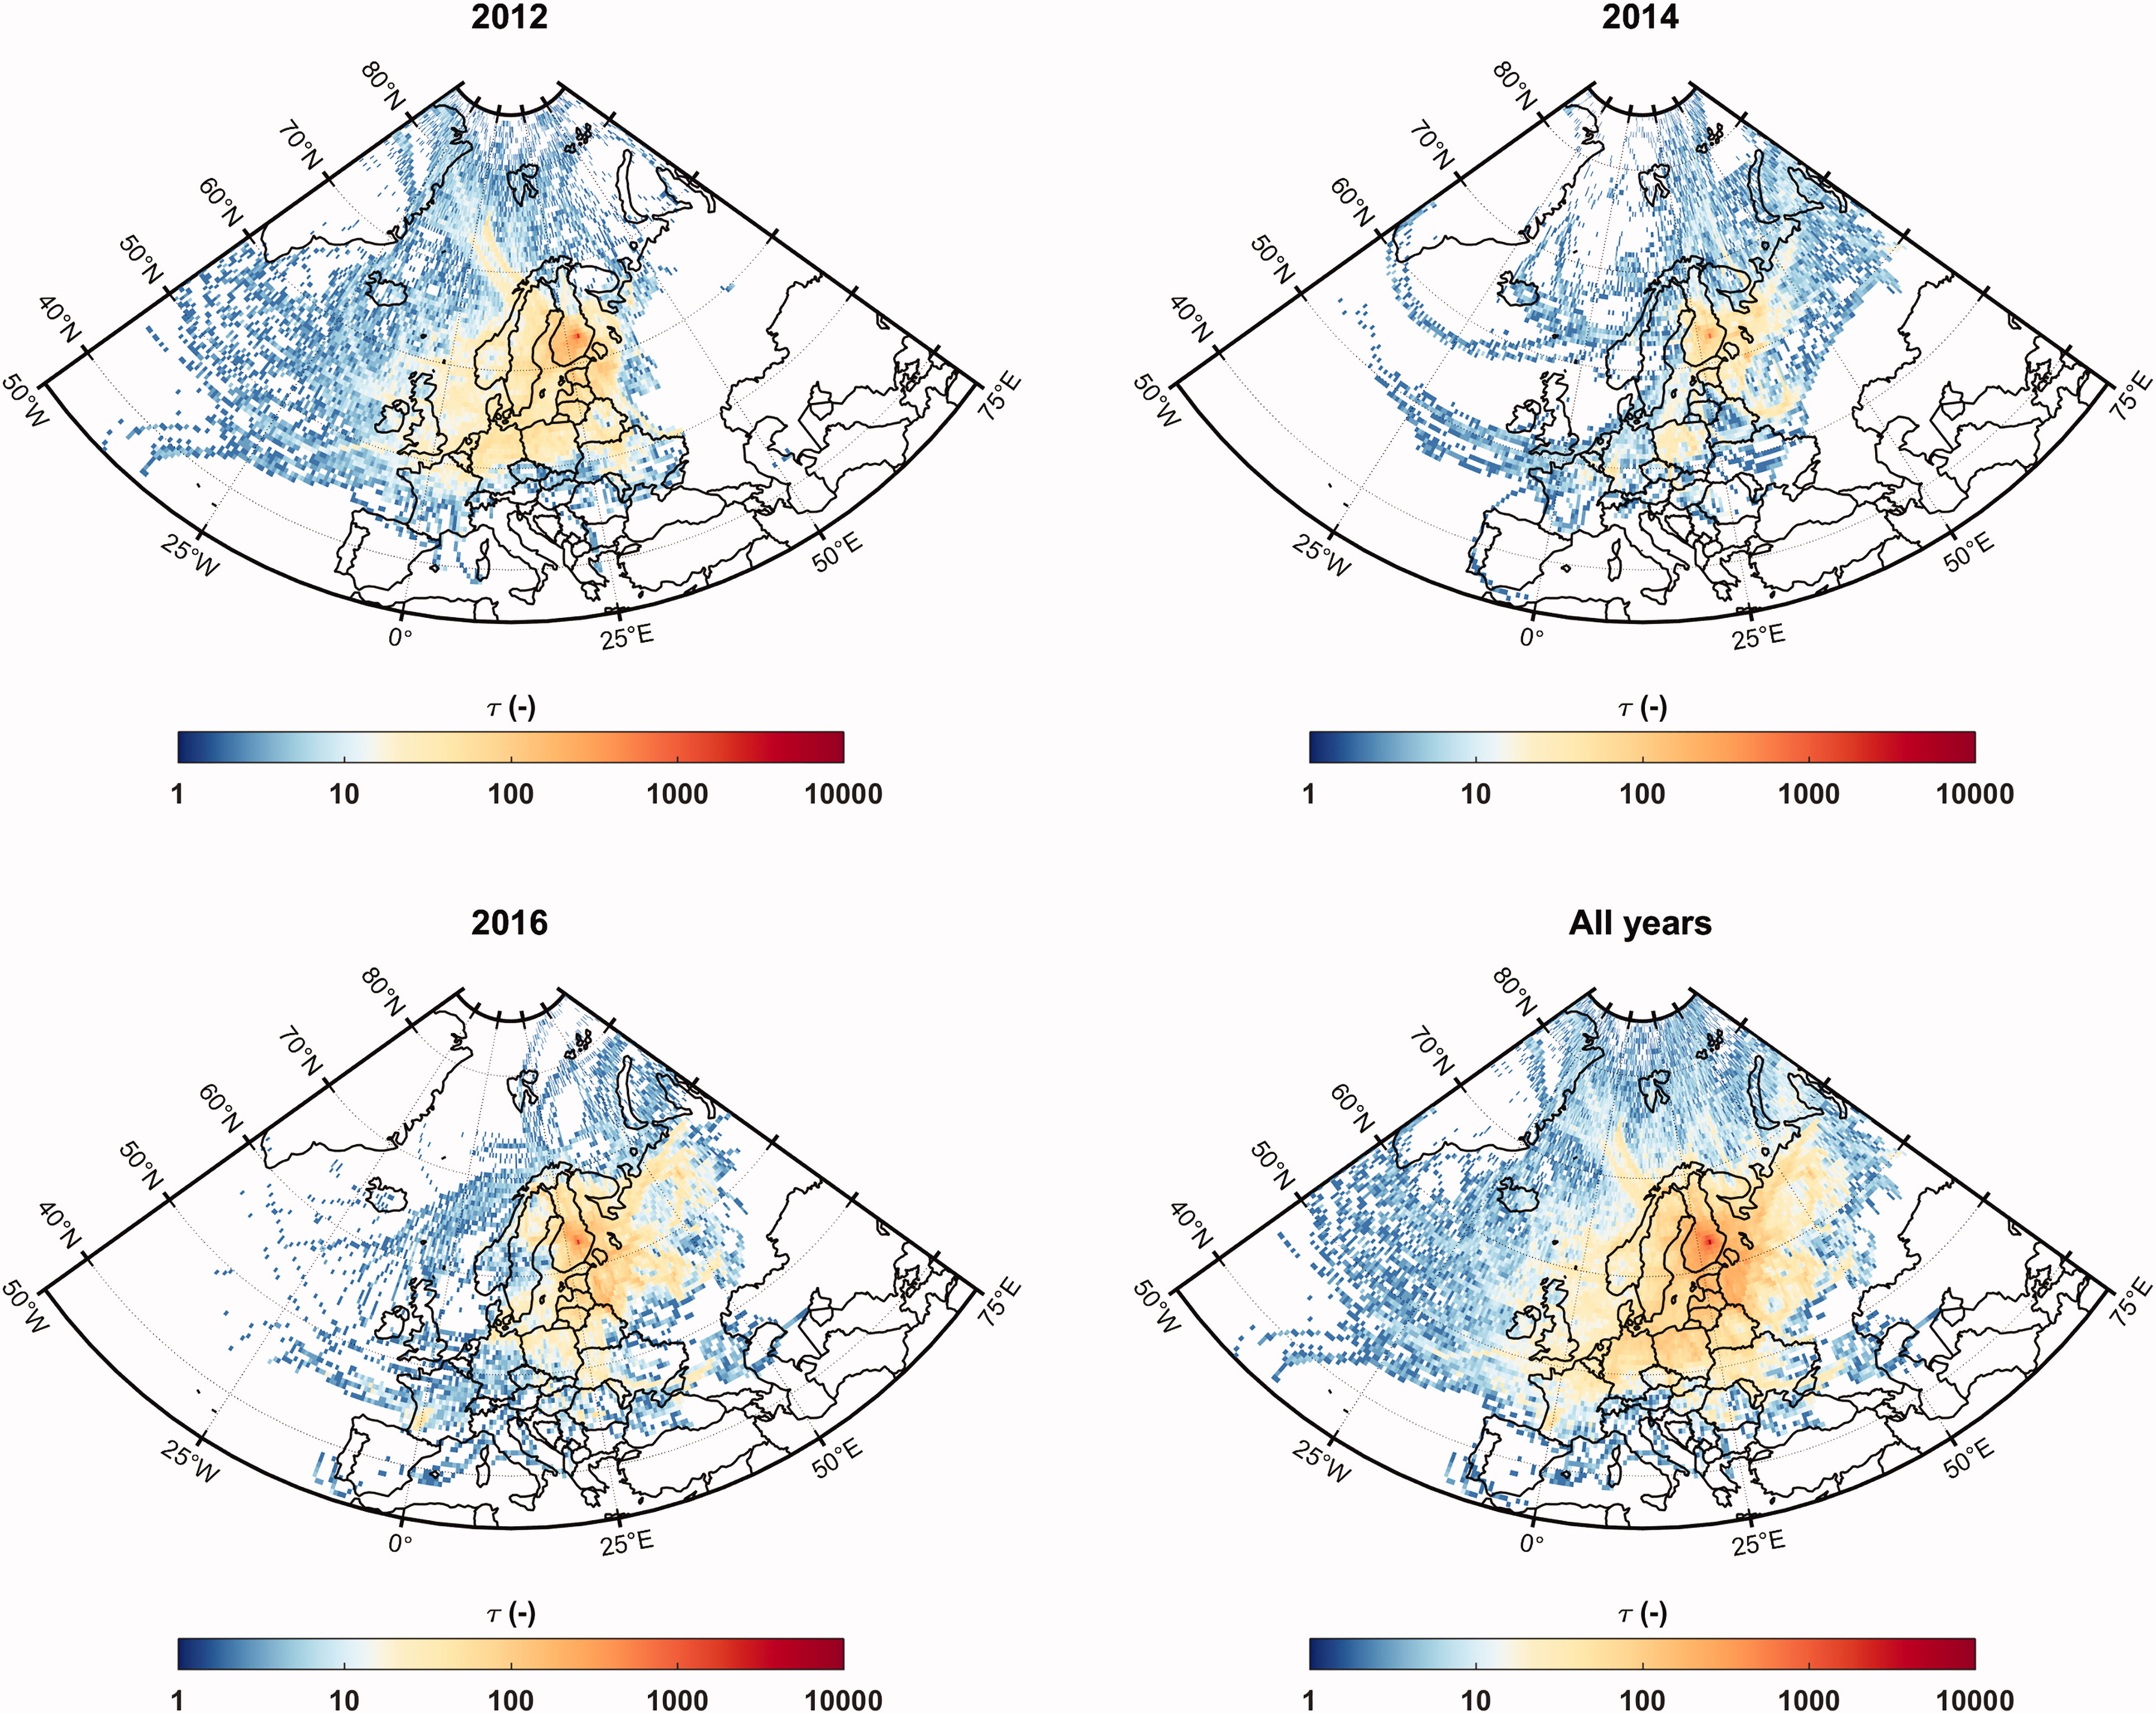
Fig. 2.
Spatial distribution of trajectory endpoints during the three intensive measurements campaigns. The logarithmic colour scale illustrates the total number of trajectory endpoints in each 0.5° × 0.5° grid cell.
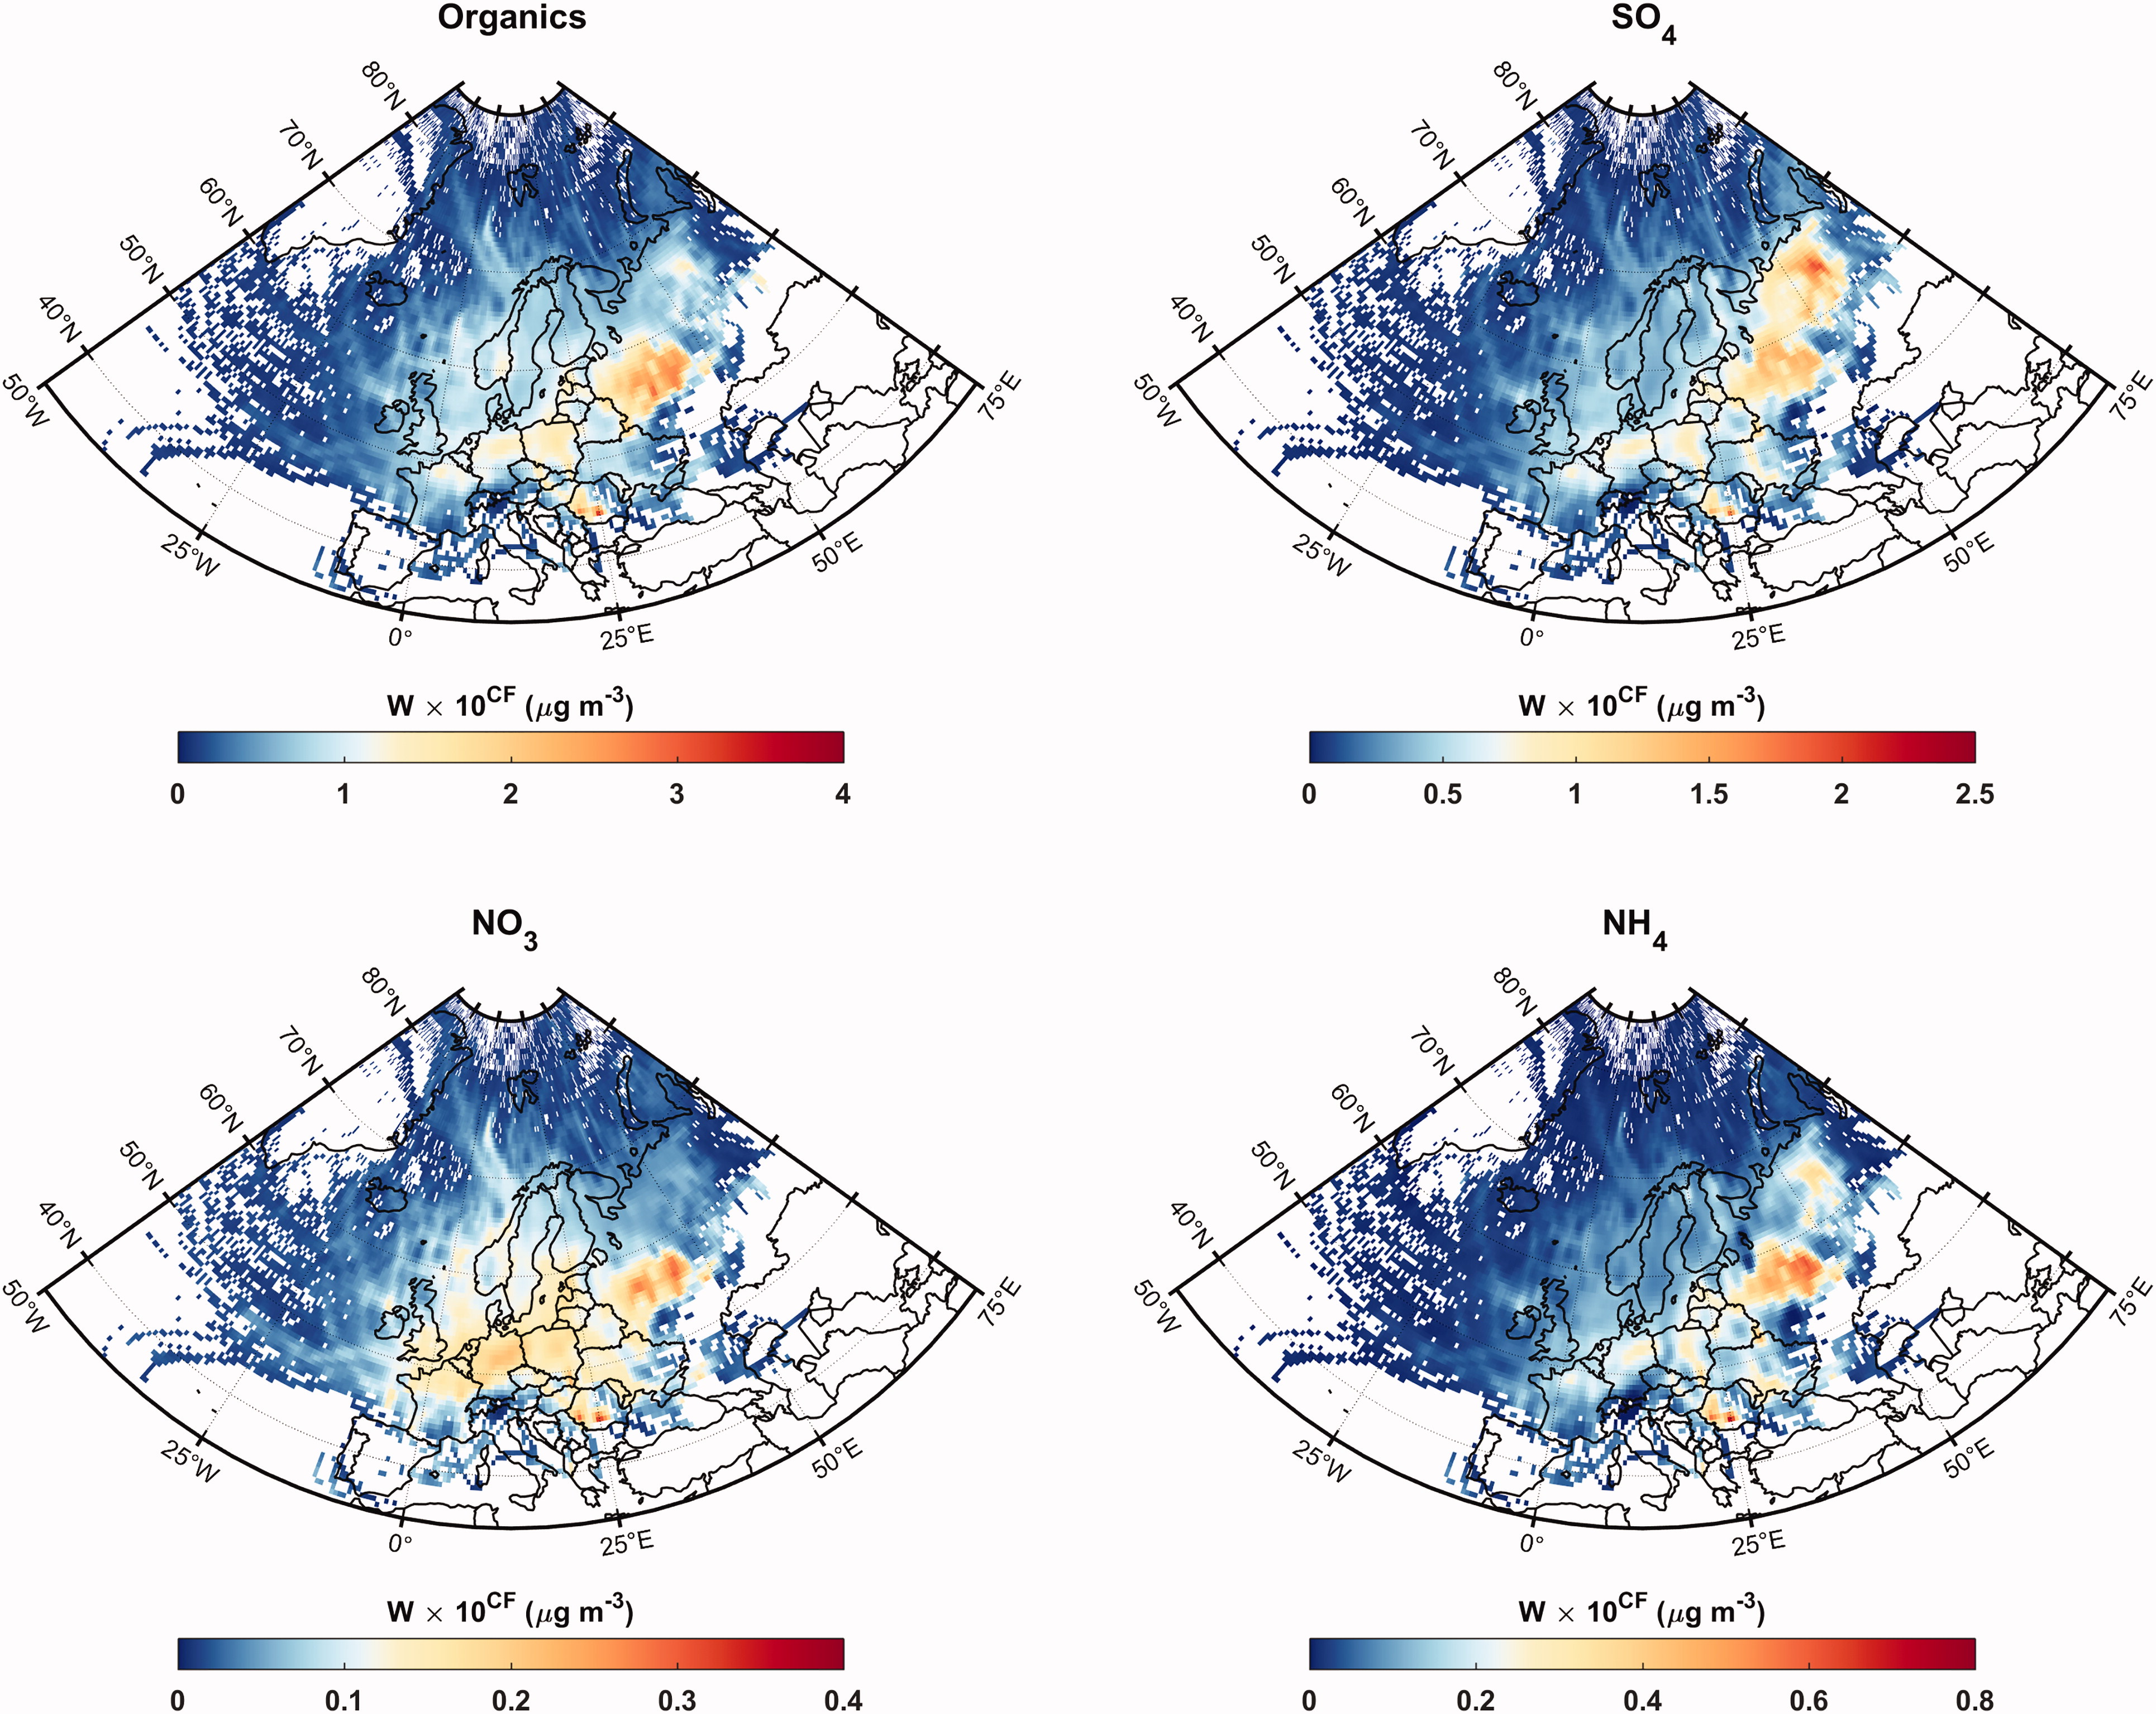
Fig. 3.
The endpoint-weighted concentrations fields of organics, sulphate (SO4), nitrate (NO3) and ammonium (NH4) averaged over the three intensive measurement campaigns in 2012, 2014 and 2016.
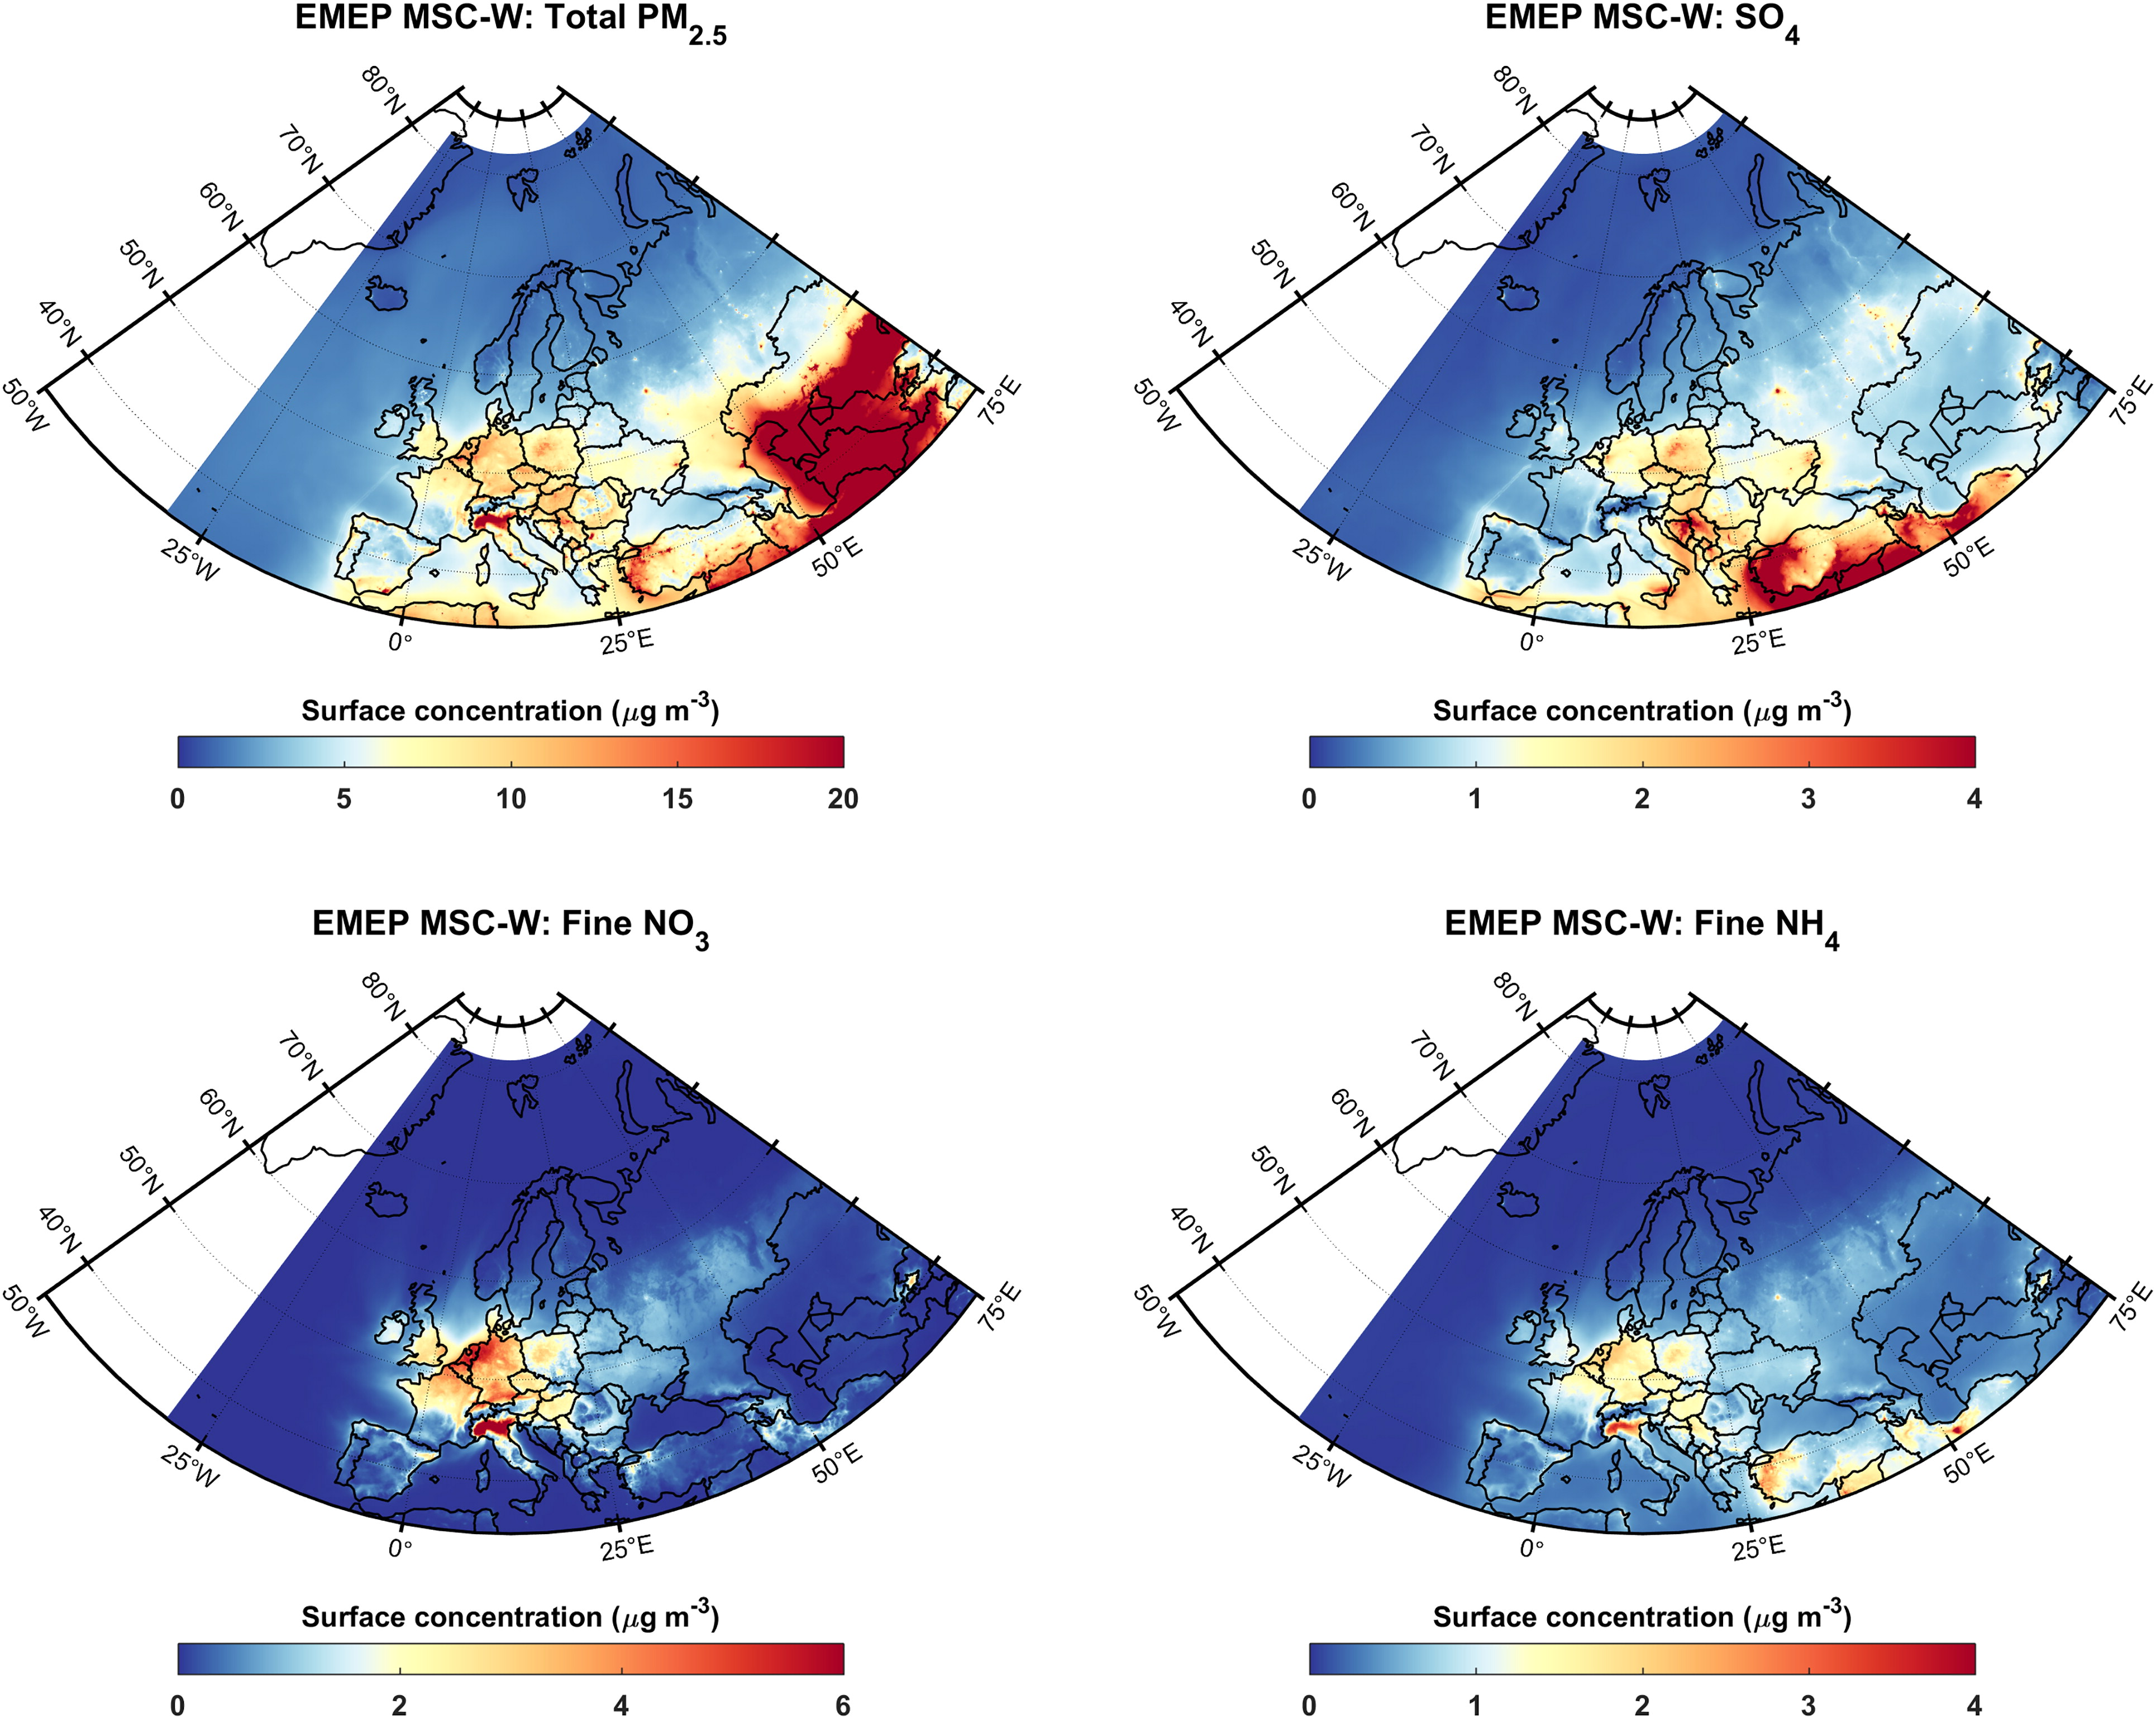
Fig. 4.
Average surface air concentrations of total PM2.5, SO4, fine mode NO3 and fine mode NH4 as modelled with EMEP MSC-W. Data from The Norwegian Meteorological Institute.
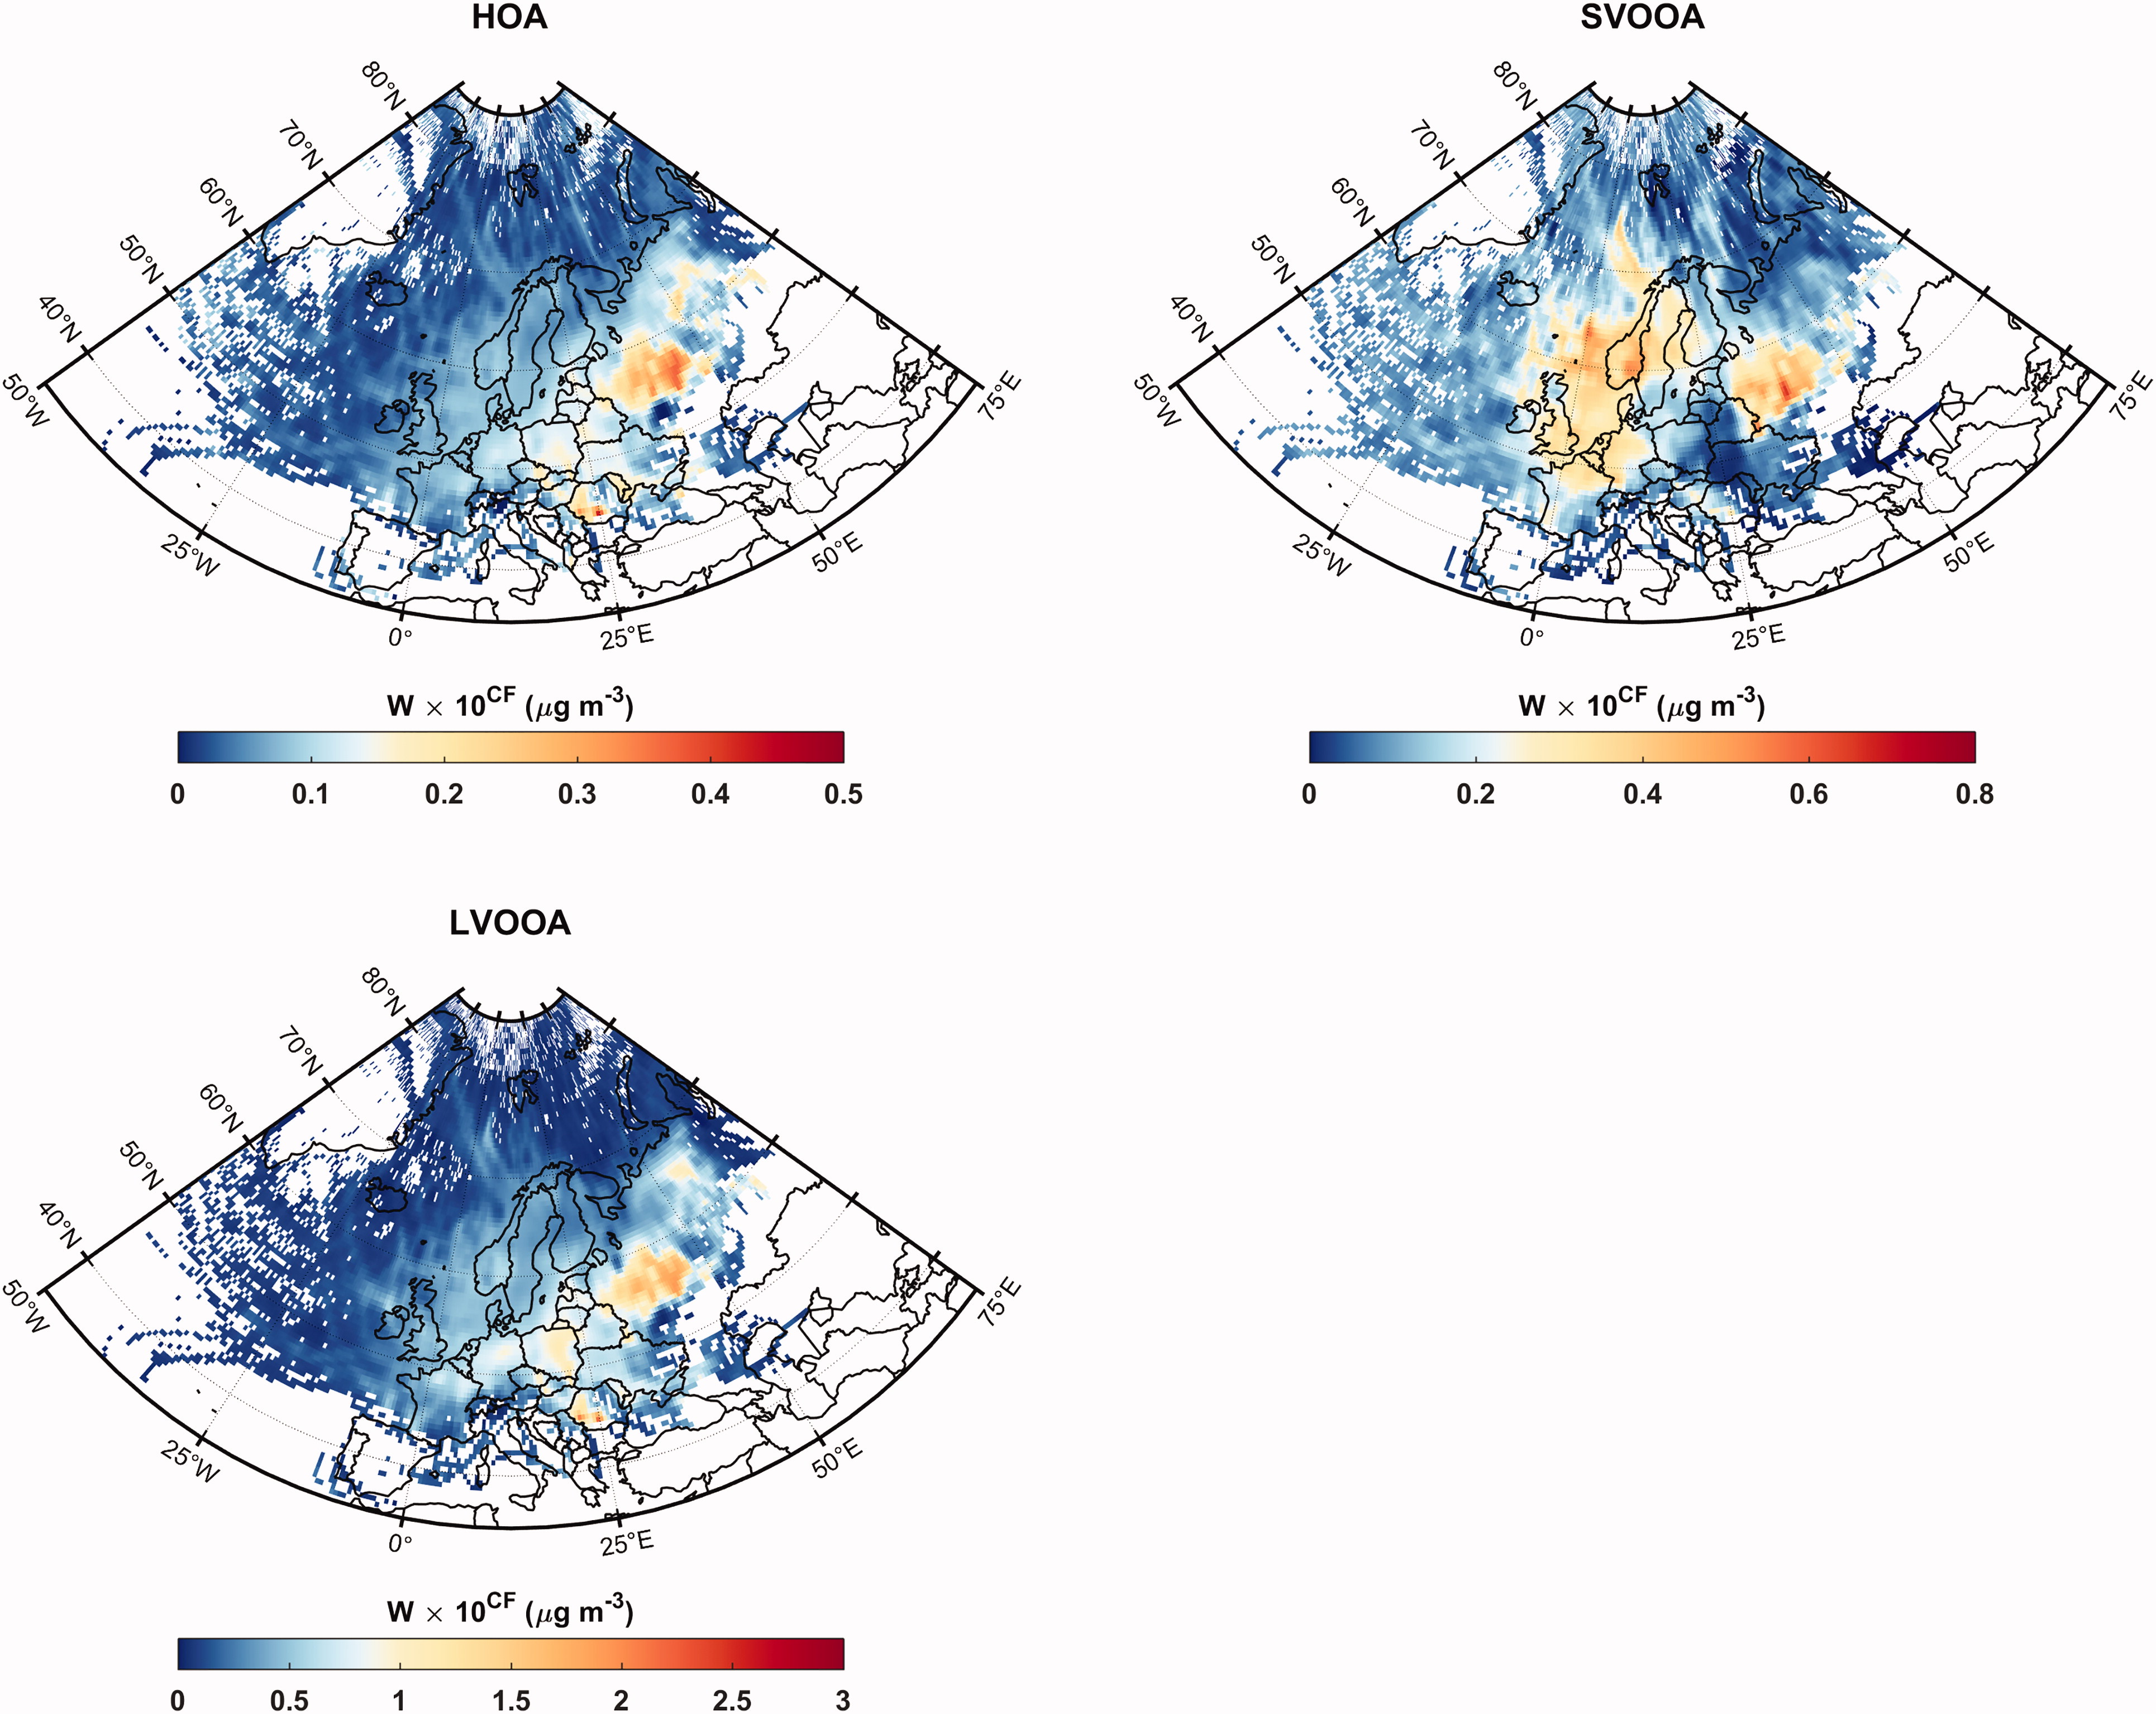
Fig. 5.
The endpoint-weighted concentrations fields of PMF factors HOA, SVOOA and LVOOA averaged over the three intensive measurement campaigns in 2012, 2014 and 2016.
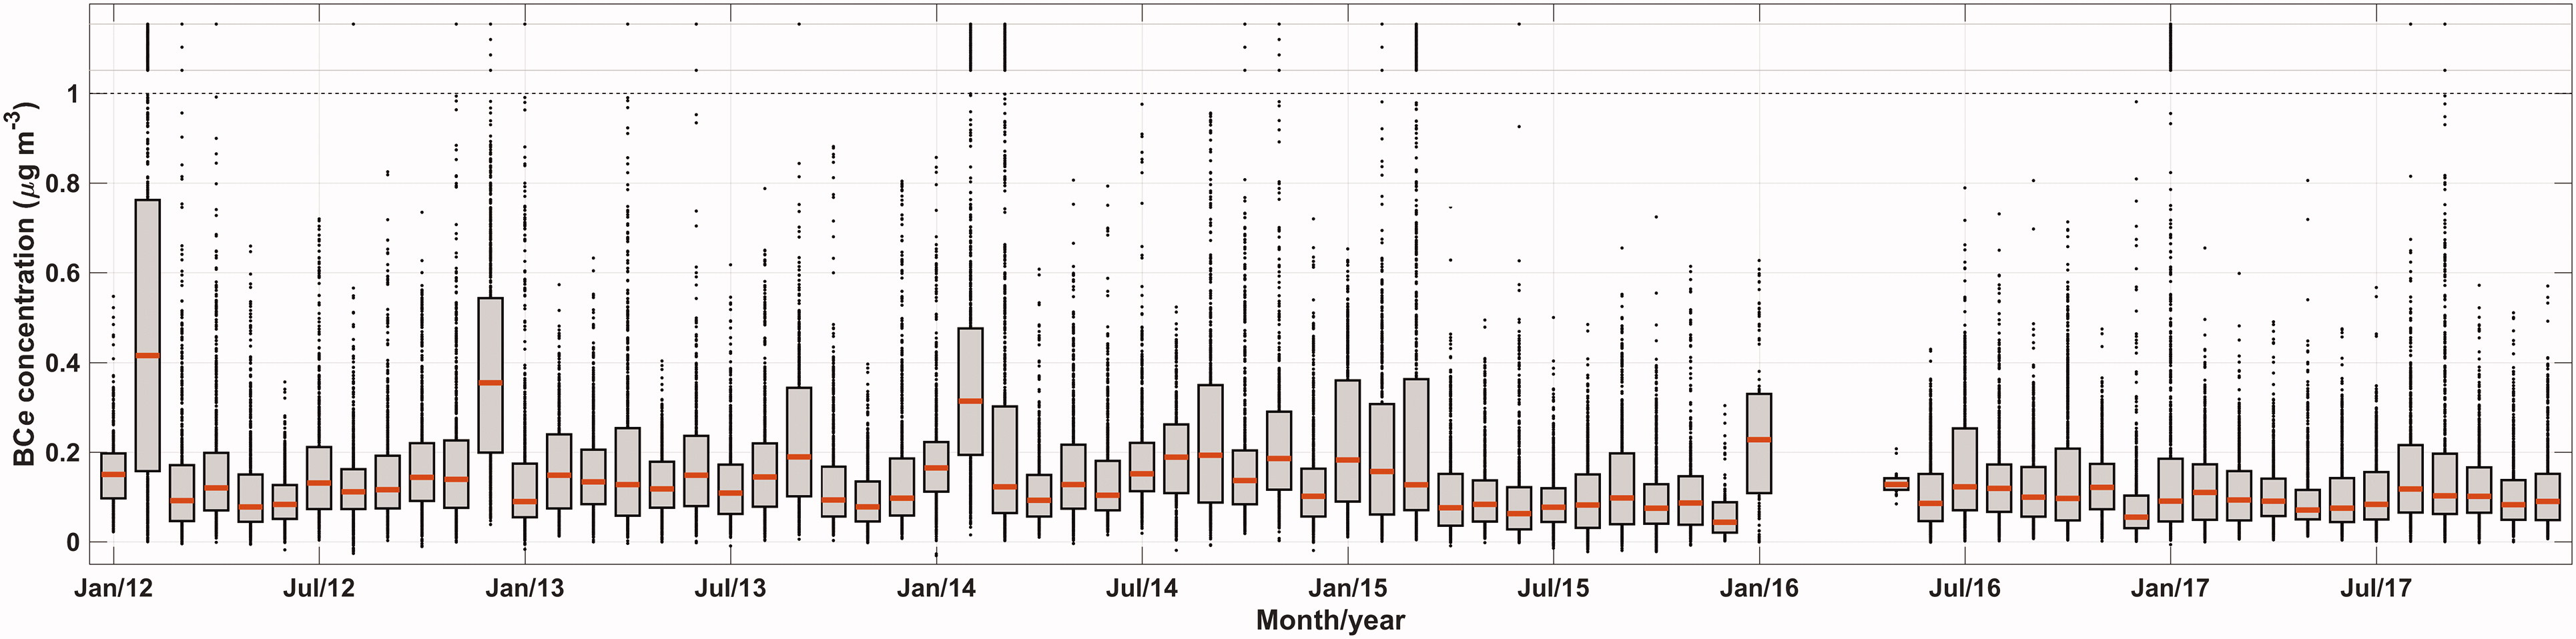
Fig. 6.
Time series of monthly equivalent black carbon (BCe) concentrations measured at the Puijo station. The grey box illustrates the range between the 25th and 75th percentiles, the red horizontal line is the monthly median and the black dots show the hourly averaged observations outside the quartile range. The block above the dashed horizontal line illustrates the occurrence of BCe concentrations larger than 1 µg m−3.
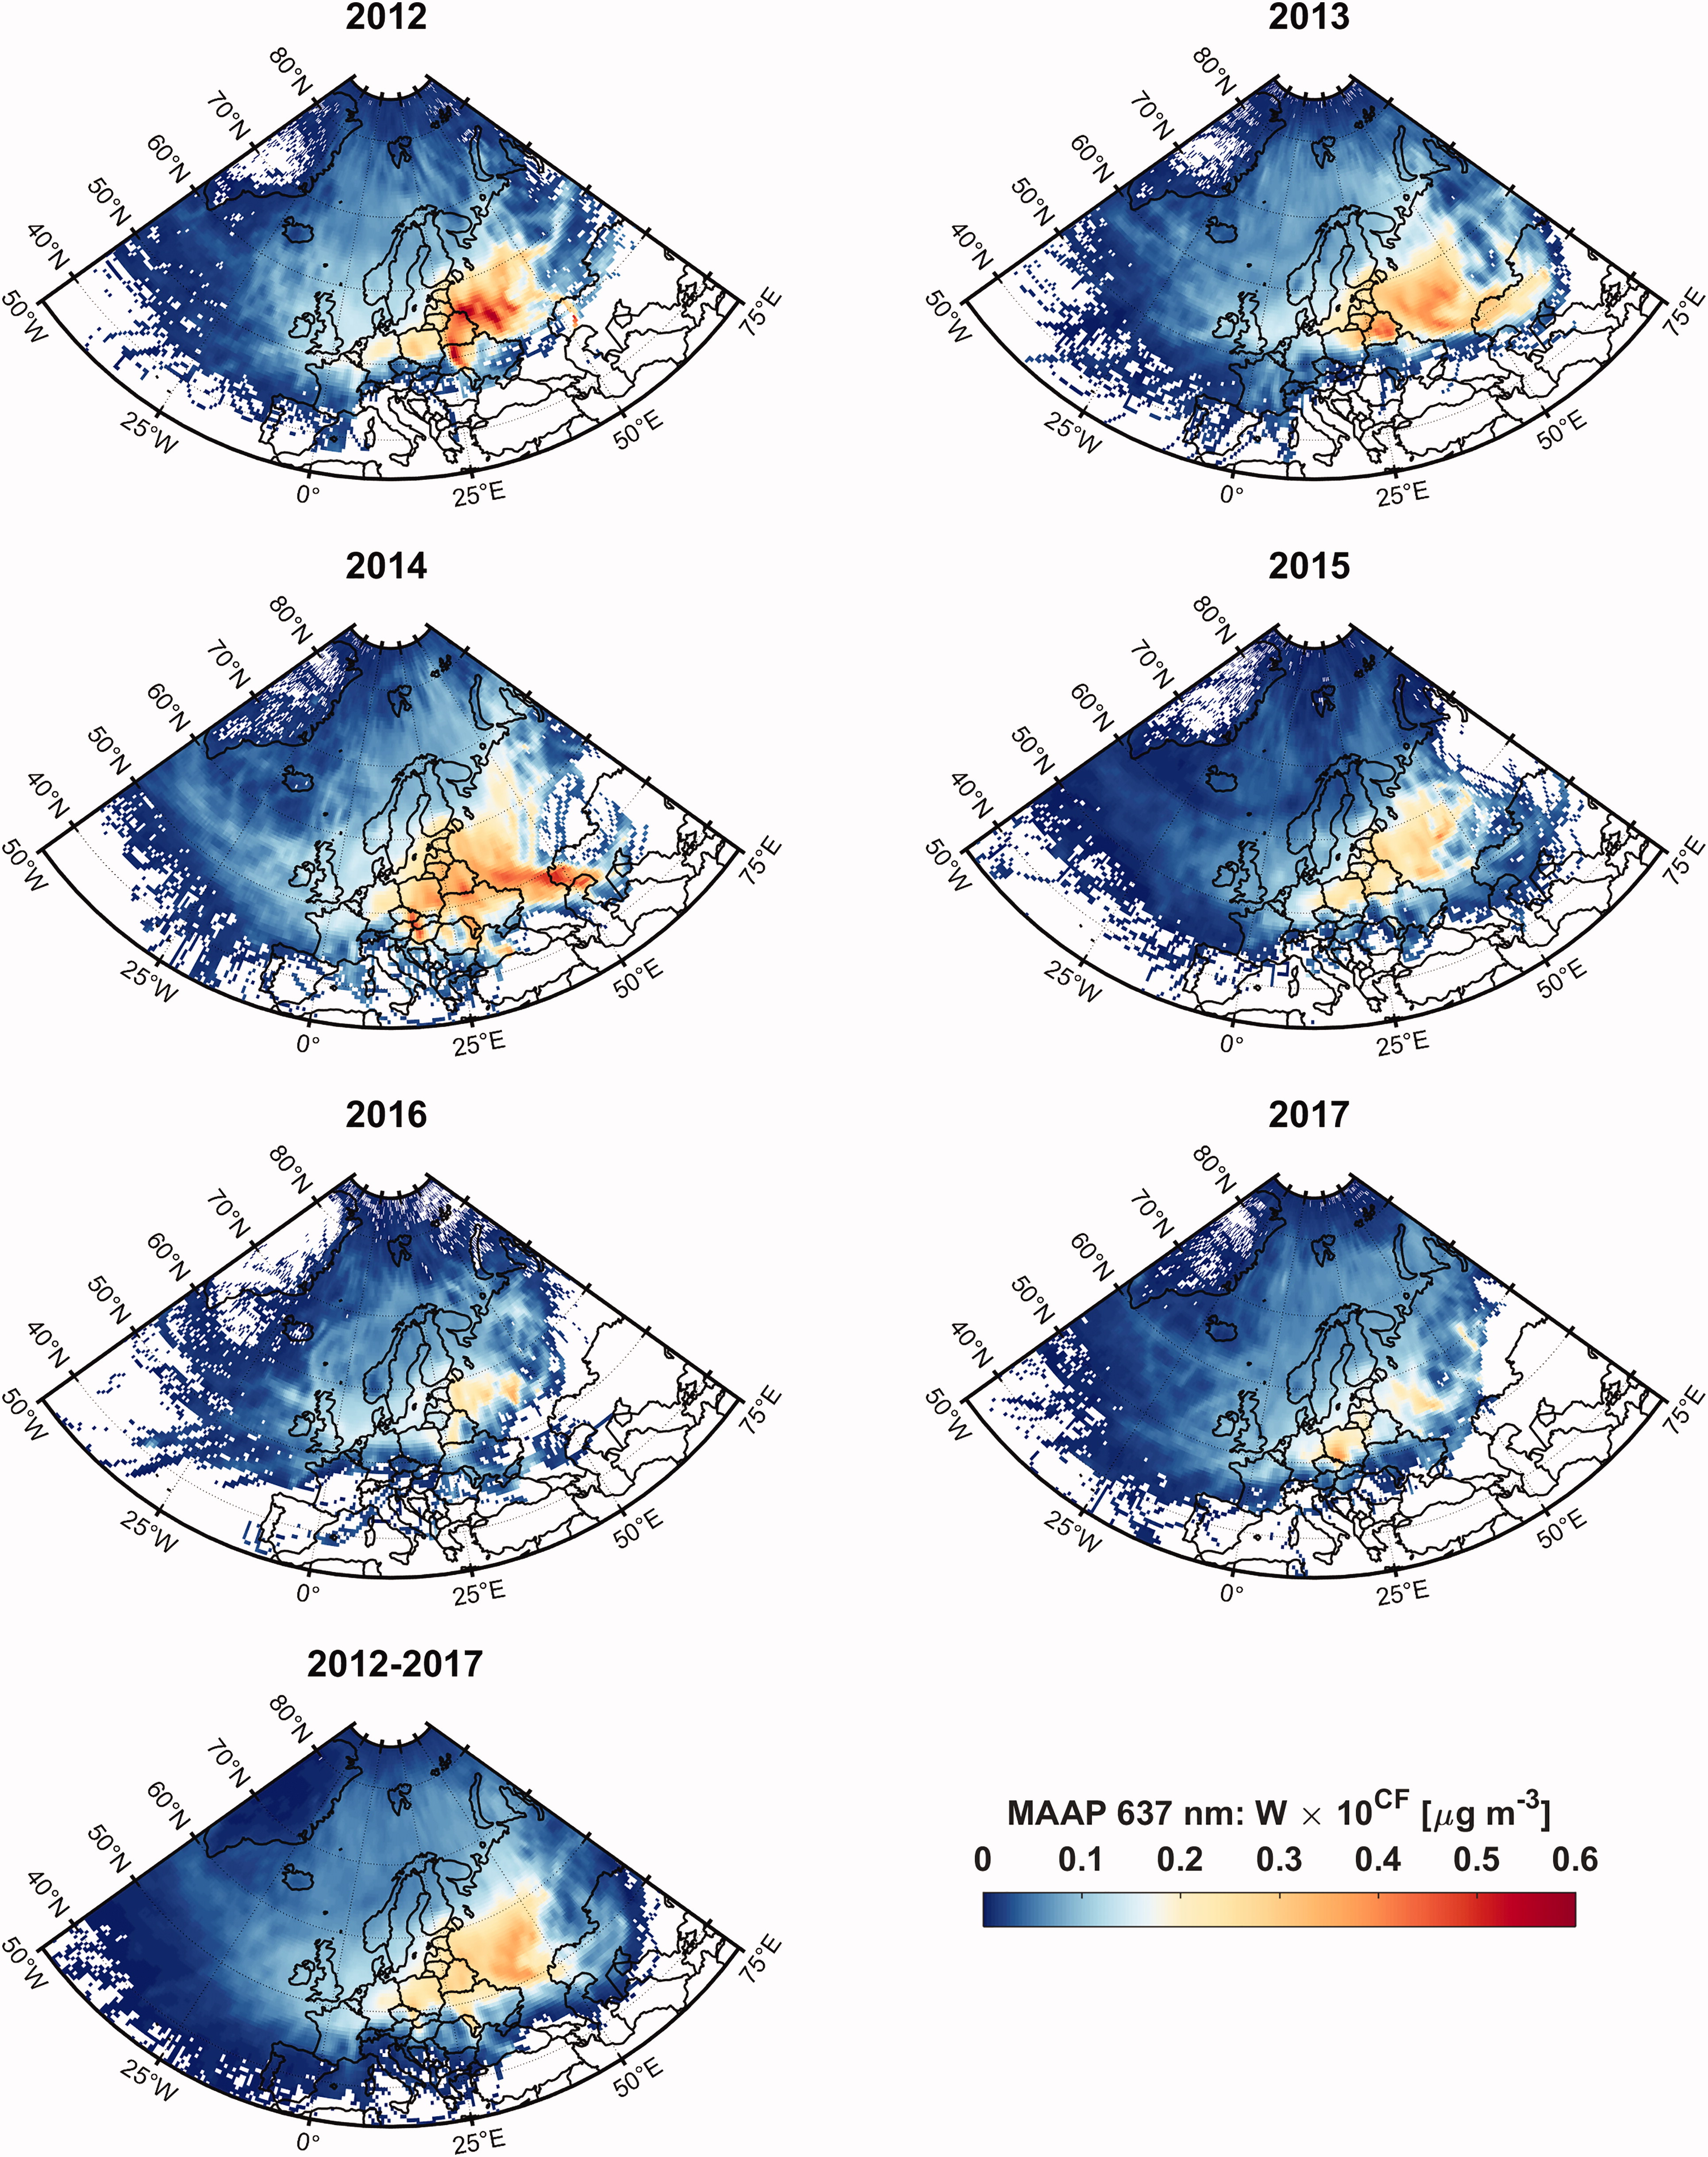
Fig. 7.
The endpoint-weighted concentration fields of equivalent black carbon (BCe) in 2012–2017.
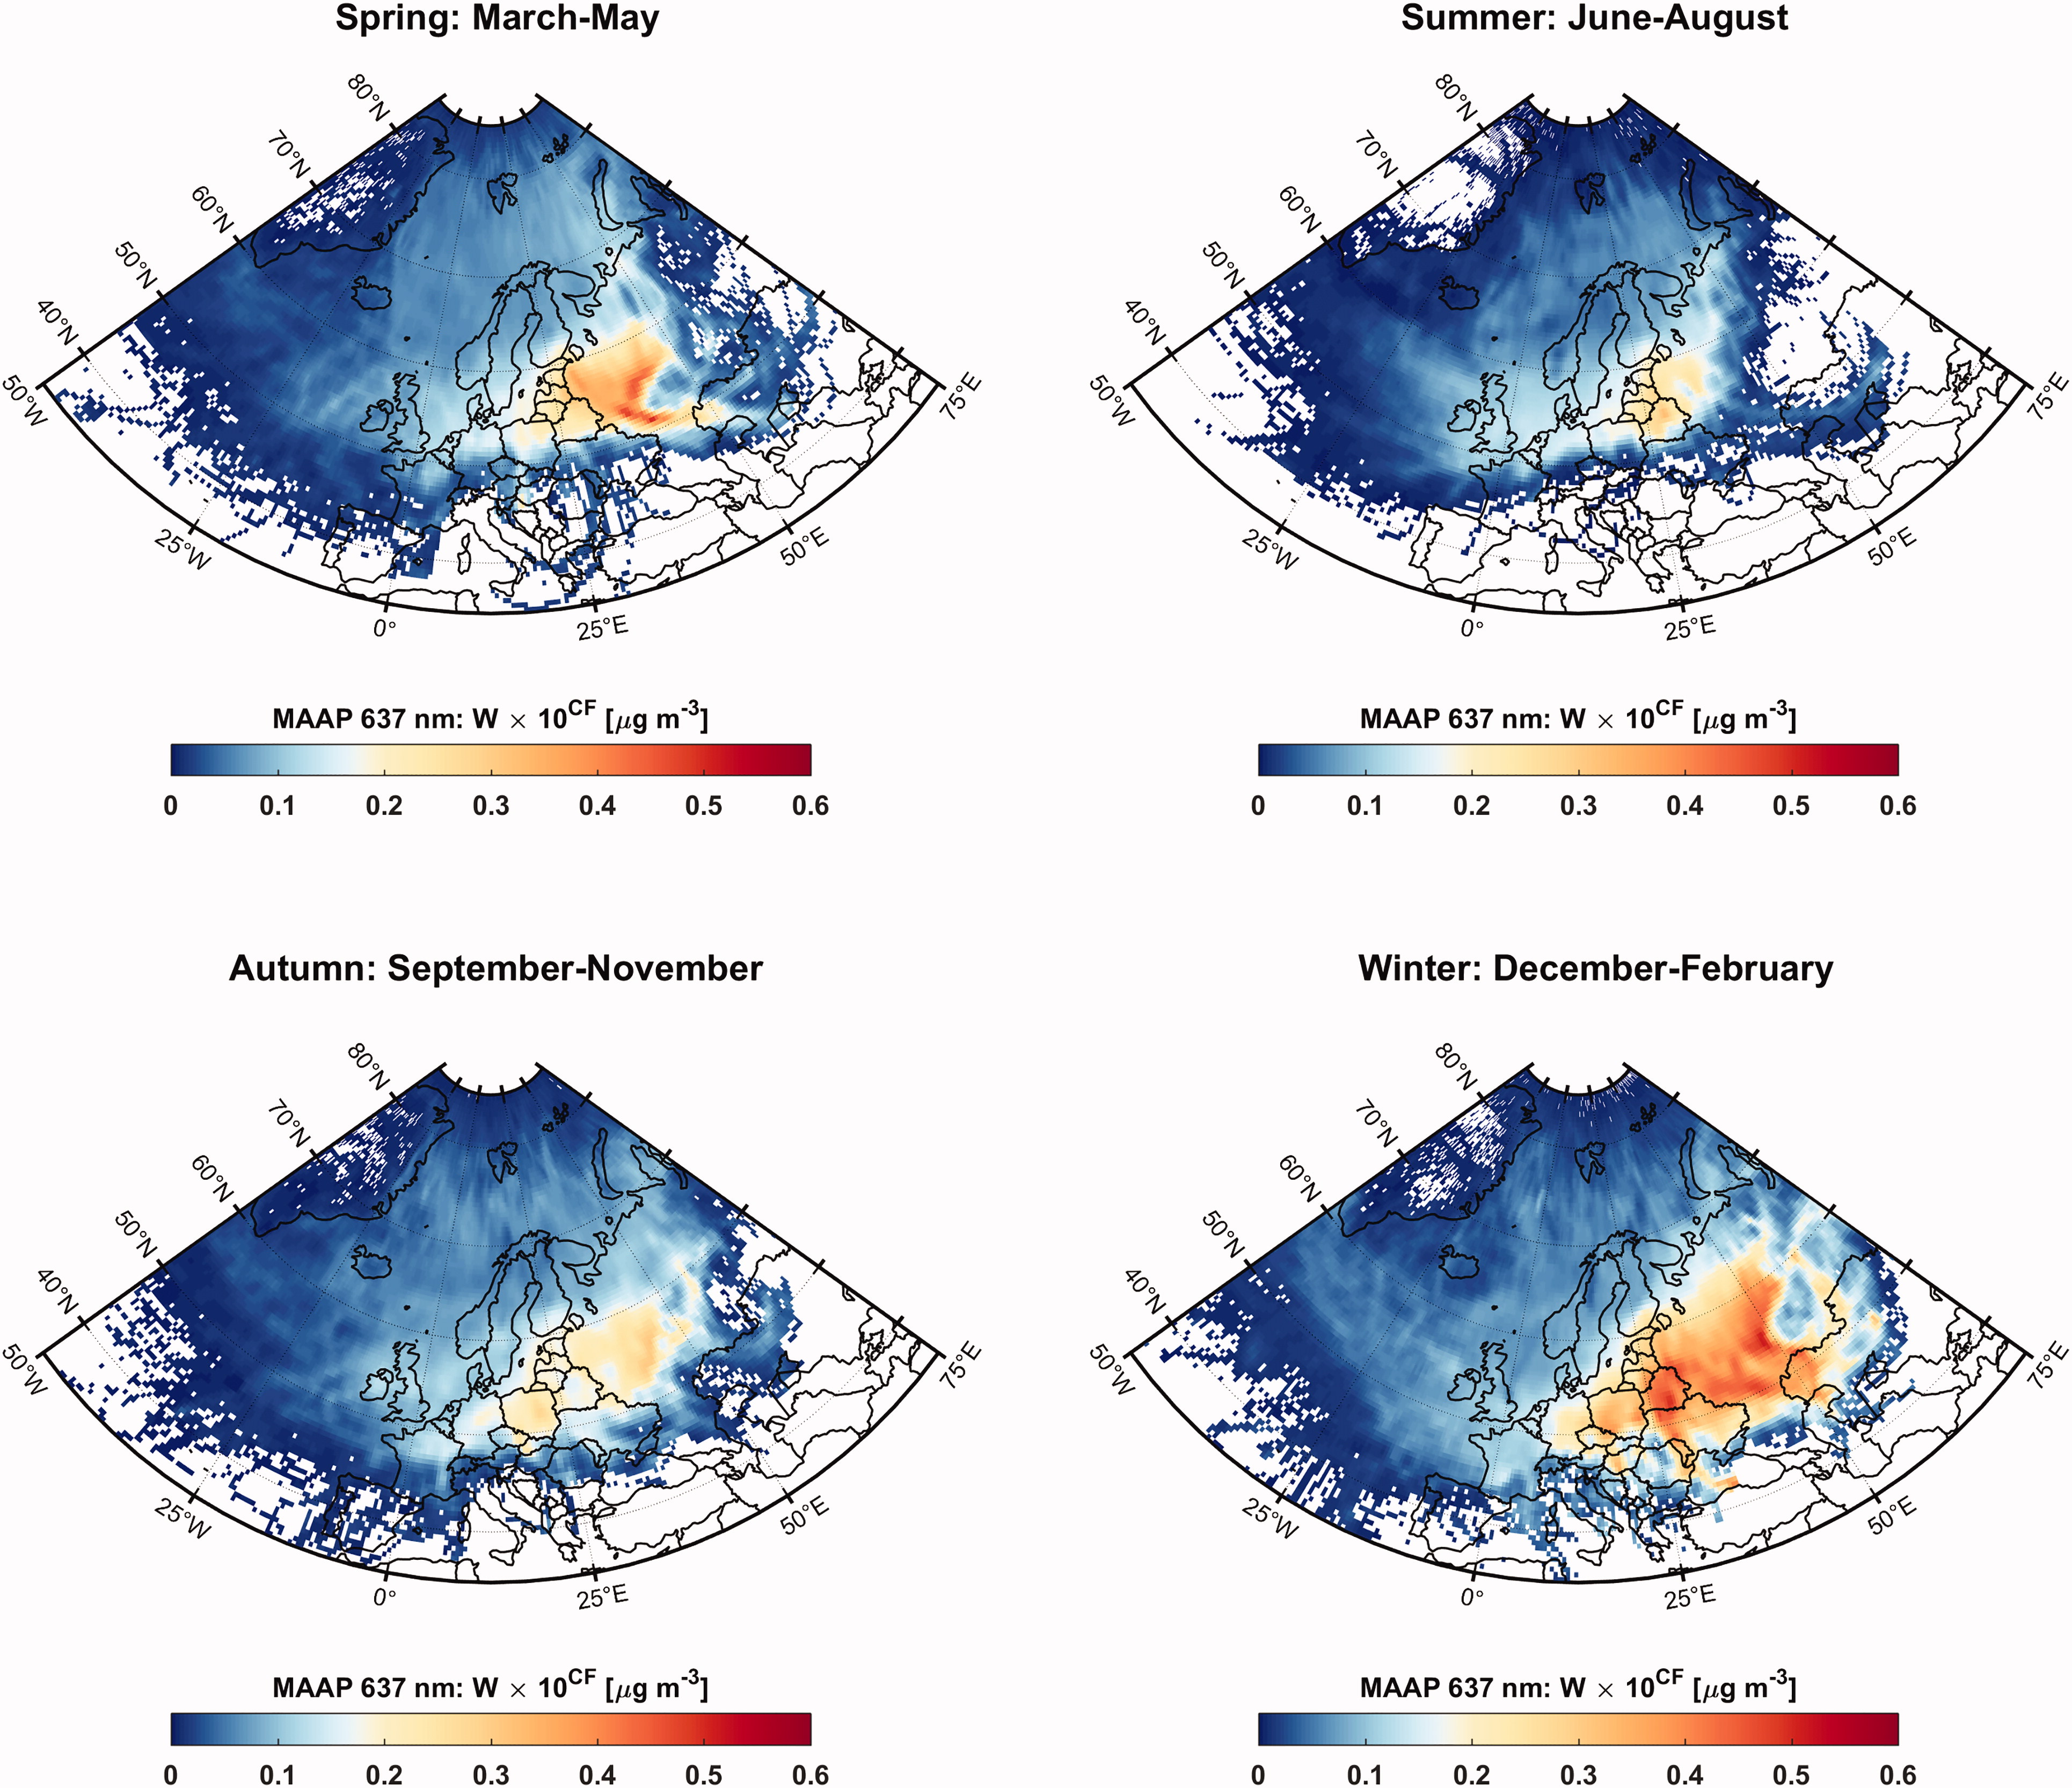
Fig. 8.
The seasonally averaged endpoint-weighted concentration fields of equivalent black carbon (BCe) in 2012–2017.
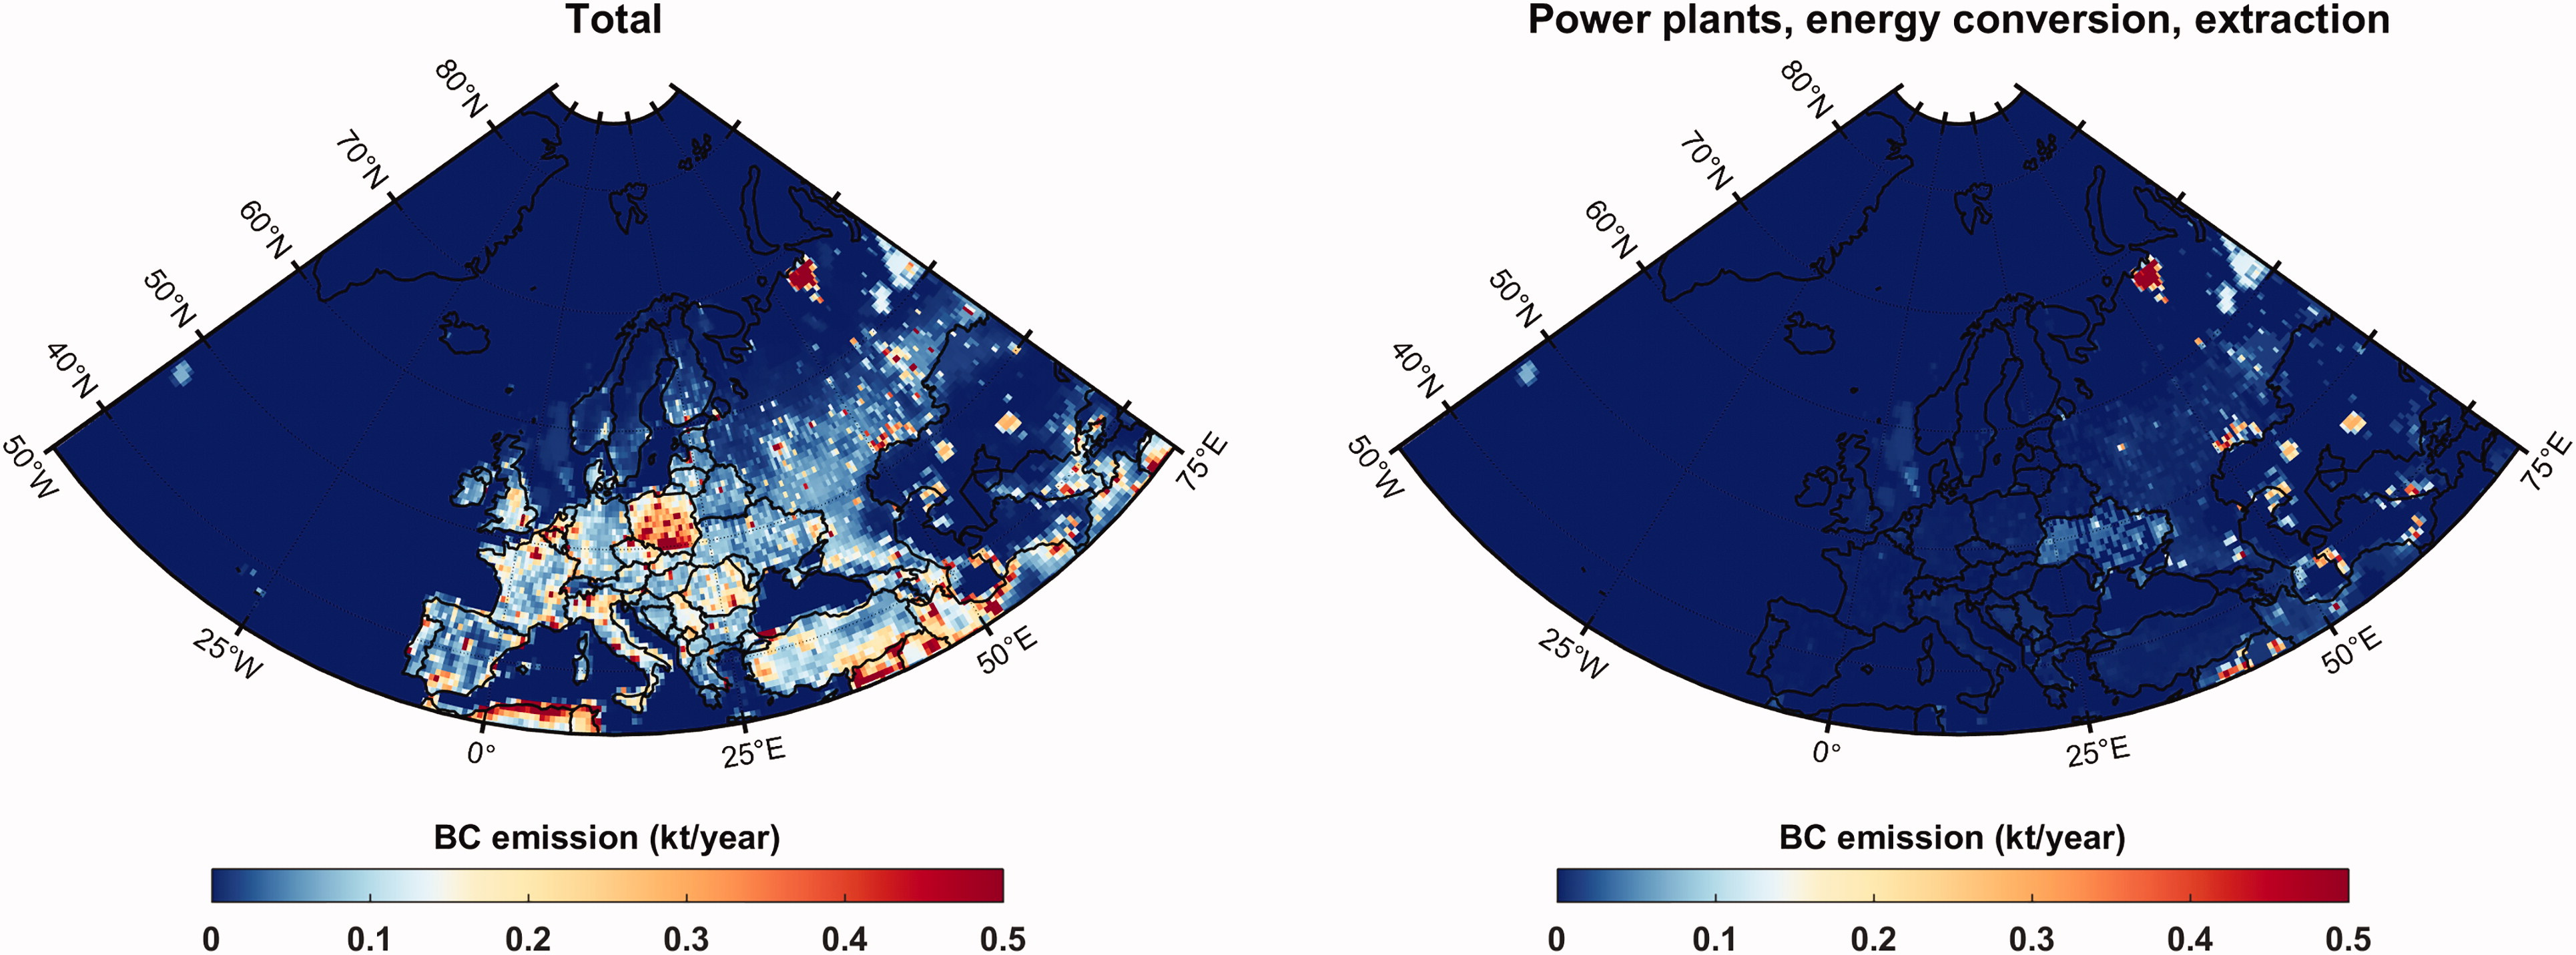
Fig. 9.
ECLIPSE v5 emissions for black carbon (BC). Emissions from gas flaring are included in the emissions from power plants, energy conversion and extraction.