
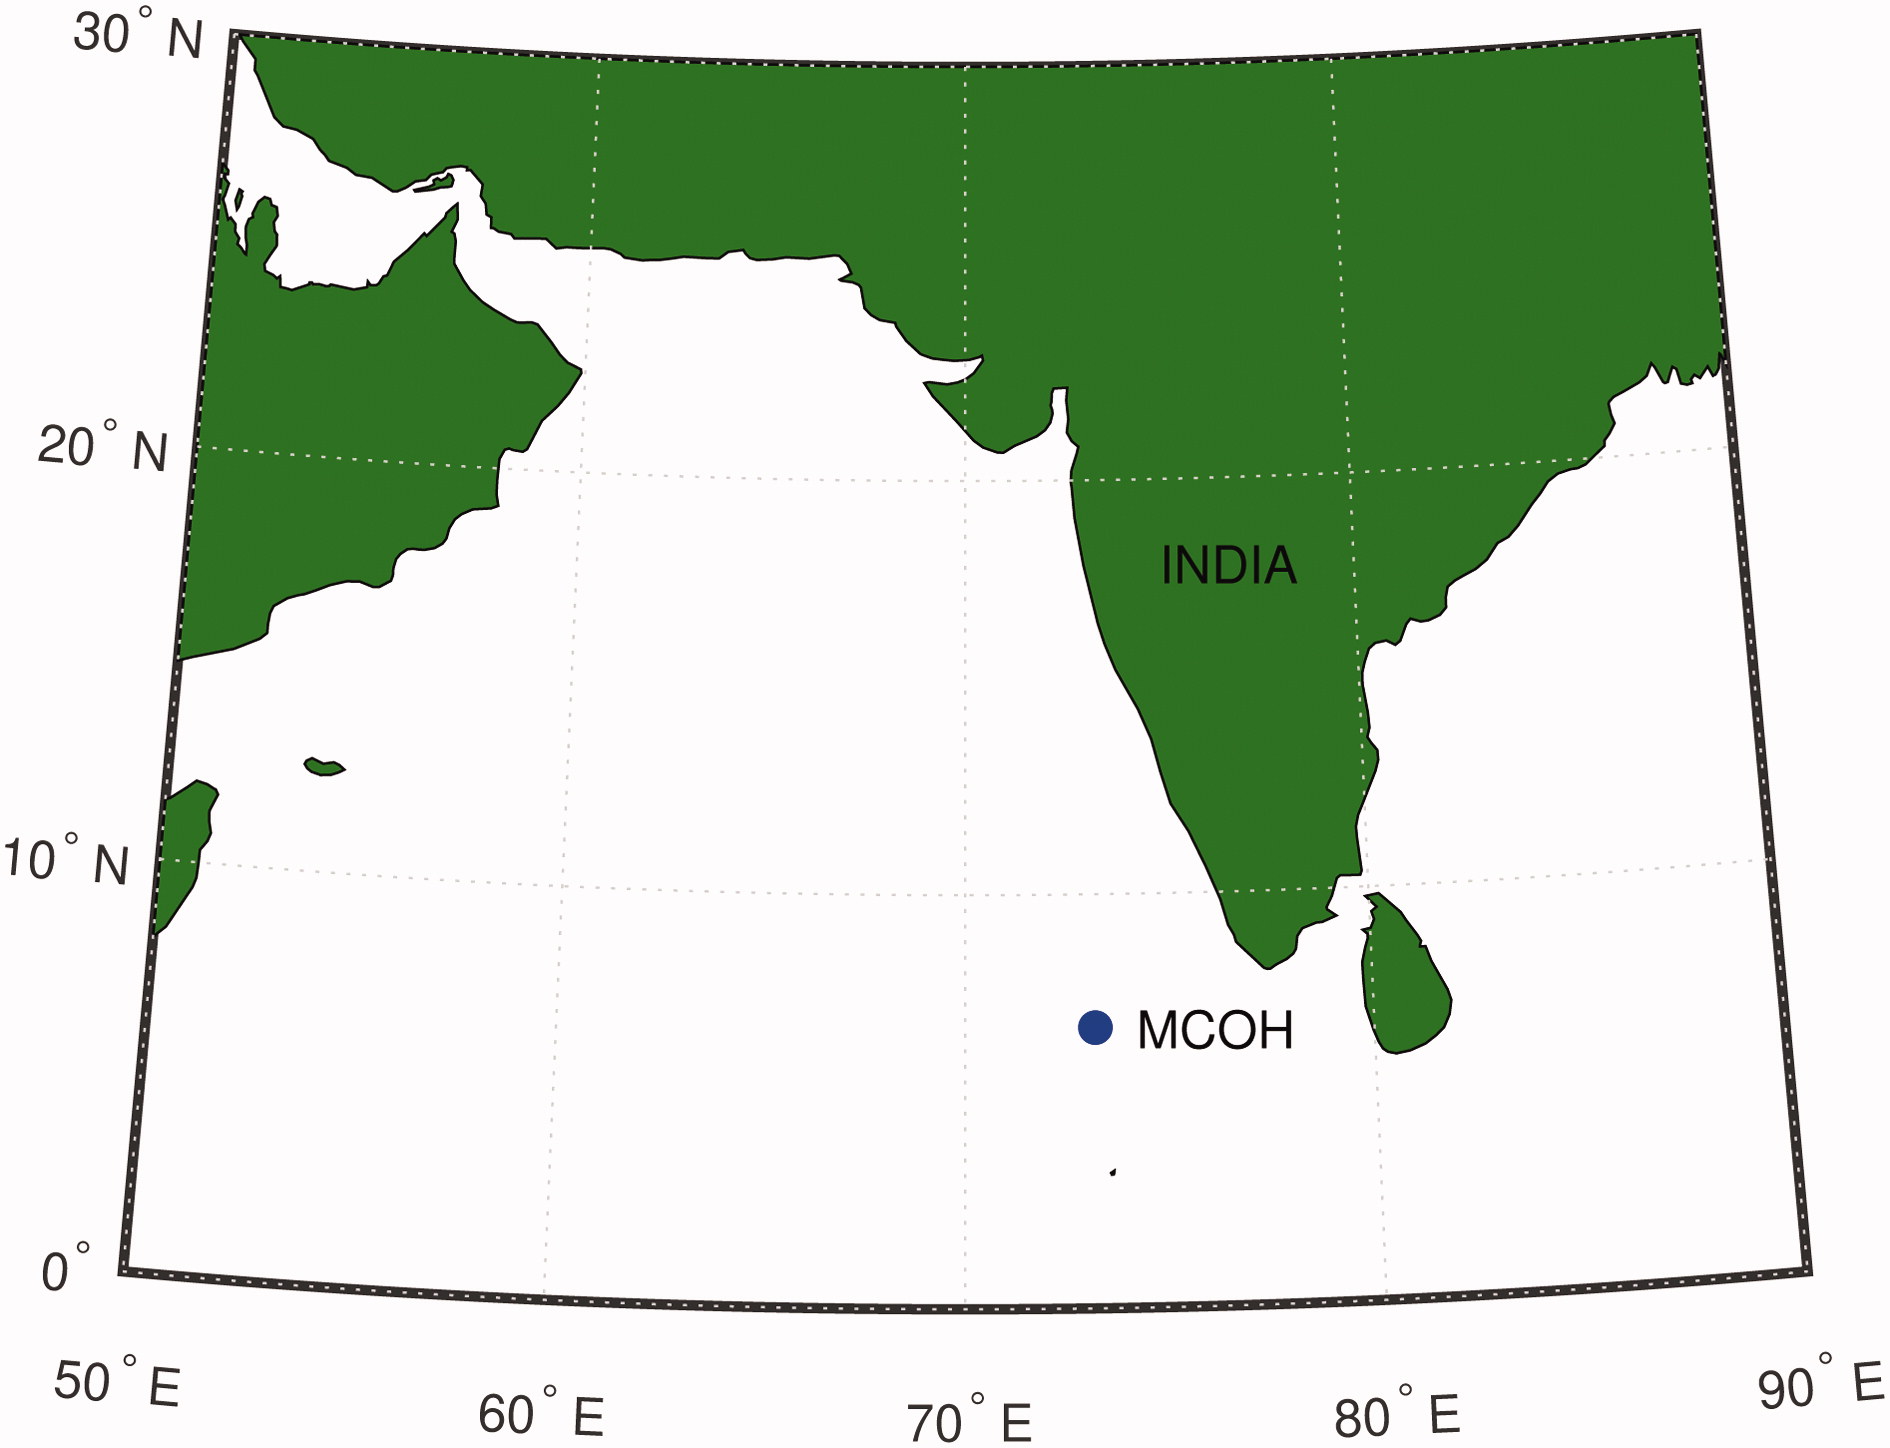
Fig. 1.
Location of the Maldives Climate Observatory of Hanimaadhoo (MCOH) in the Indian Ocean.
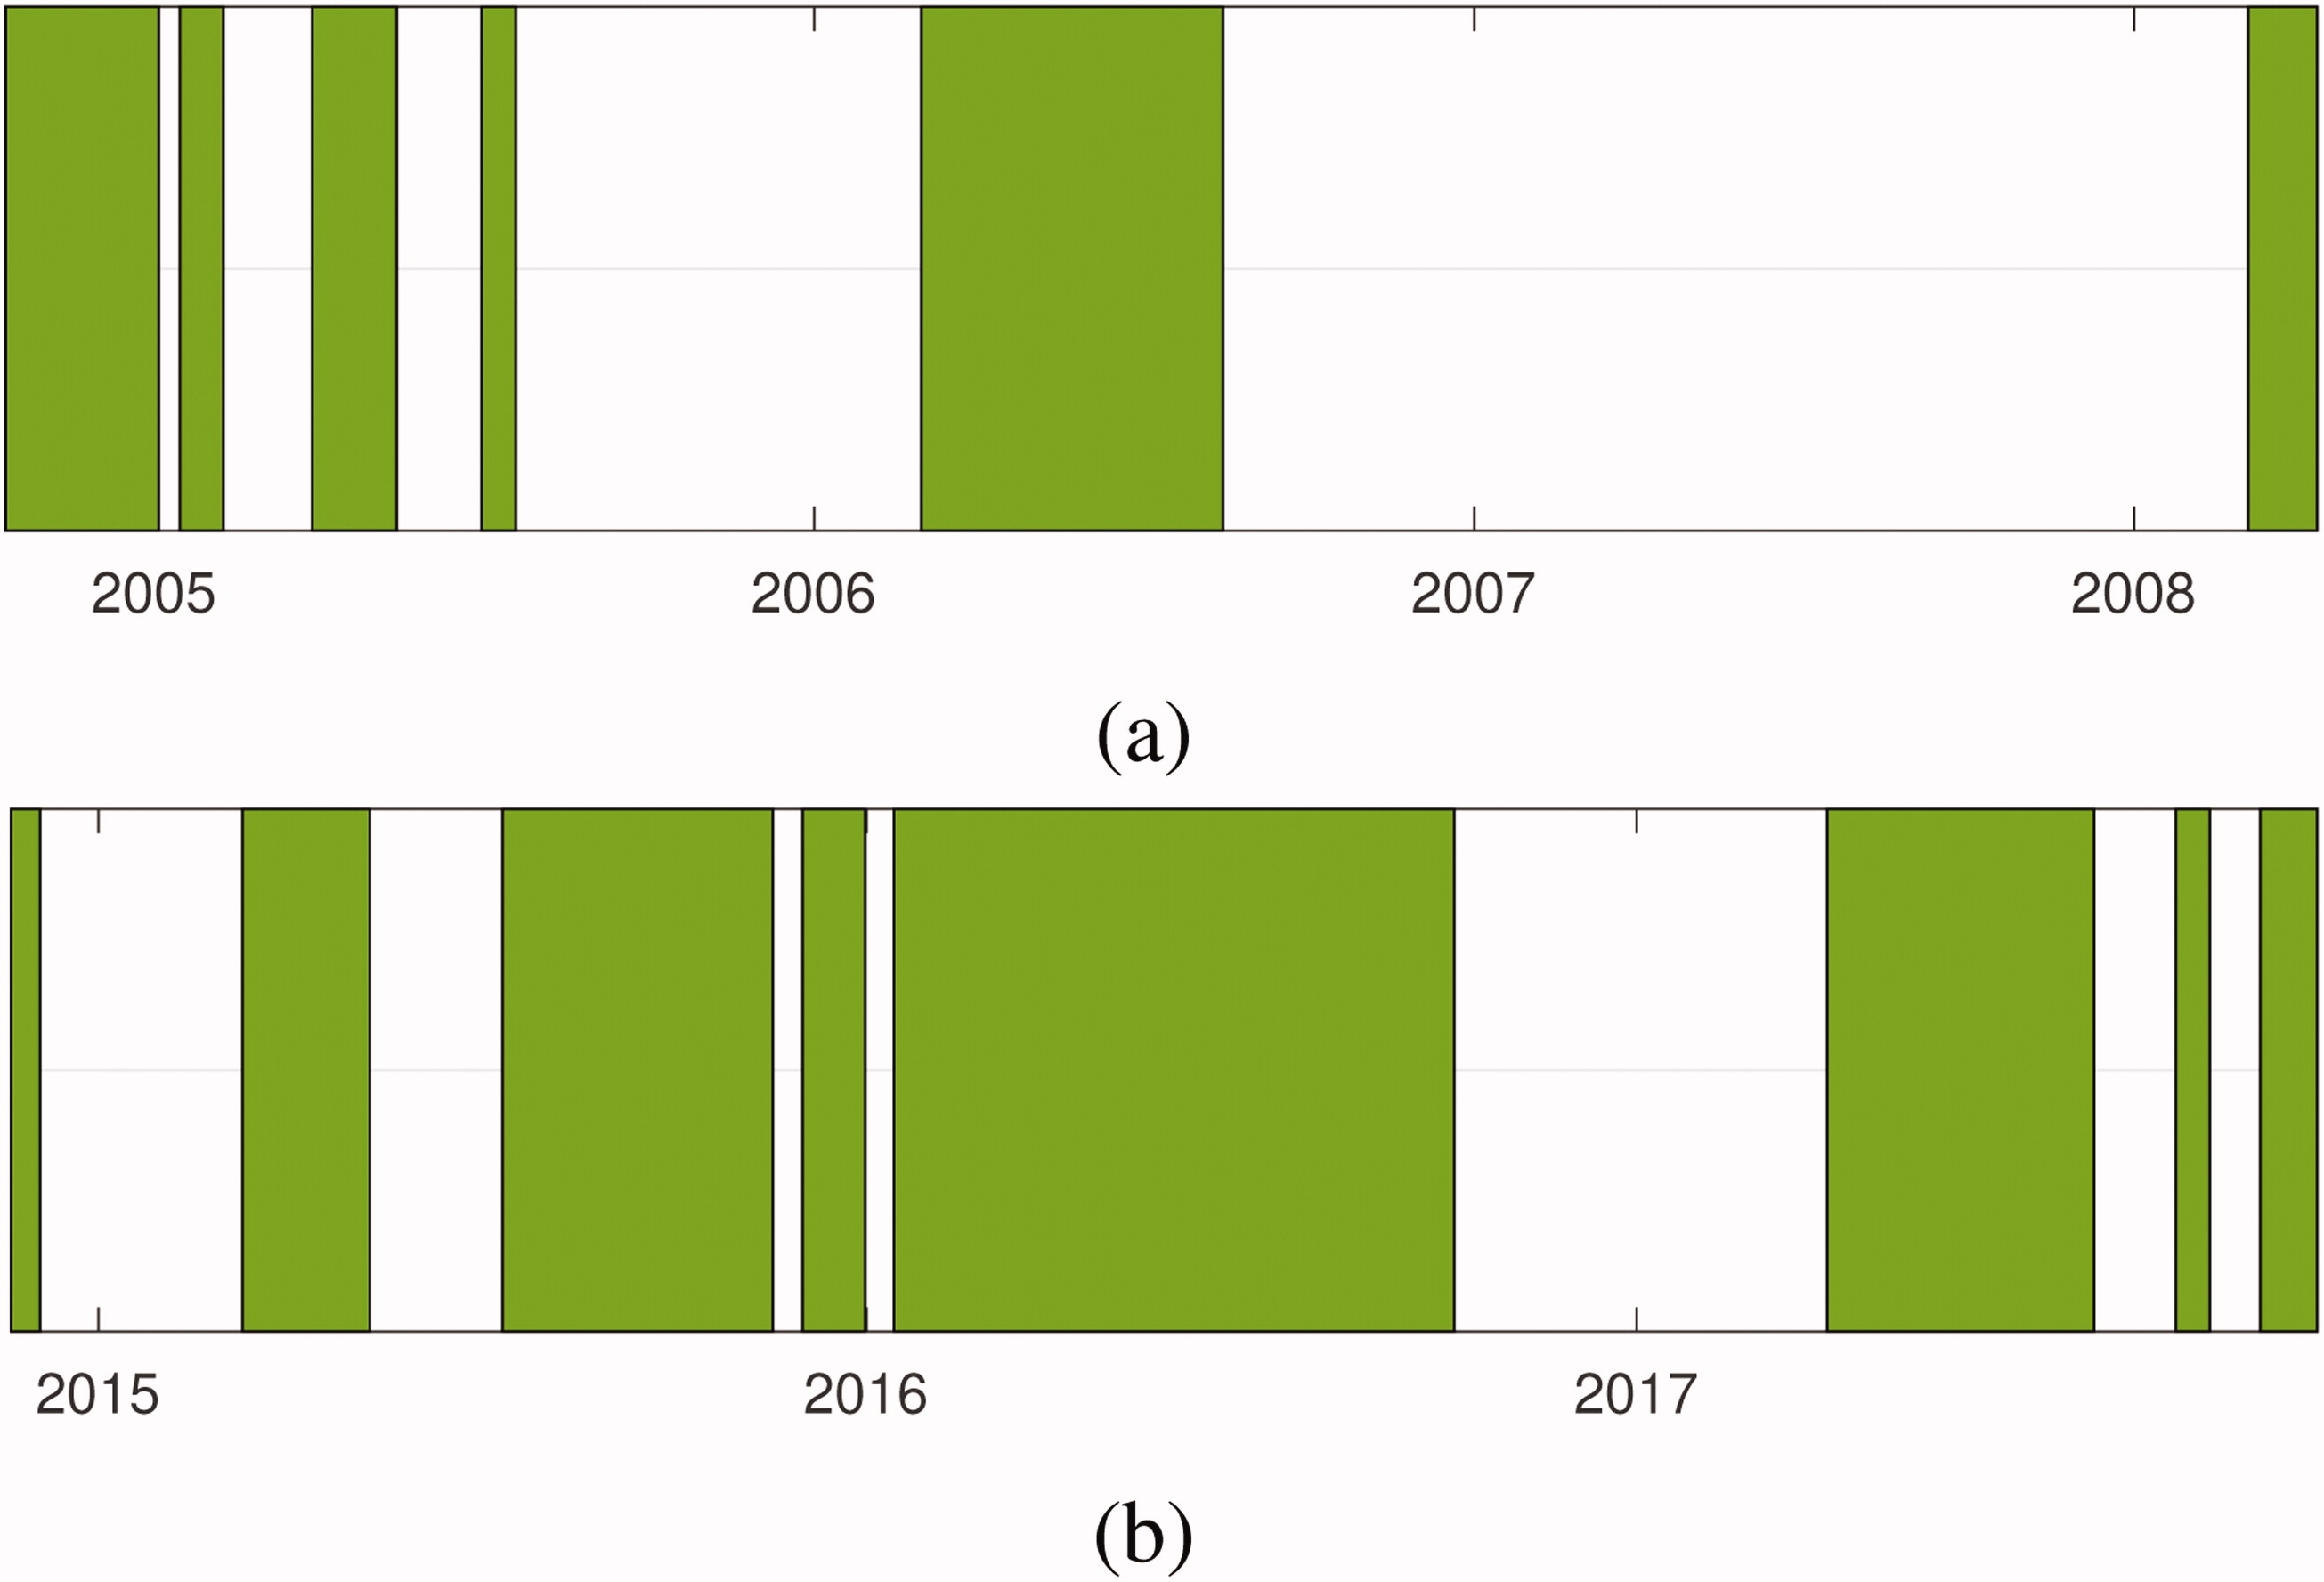
Fig. 2.
Measurement periods at MCOH for which (a) SMPS data was available and (b) DMPS data was available.
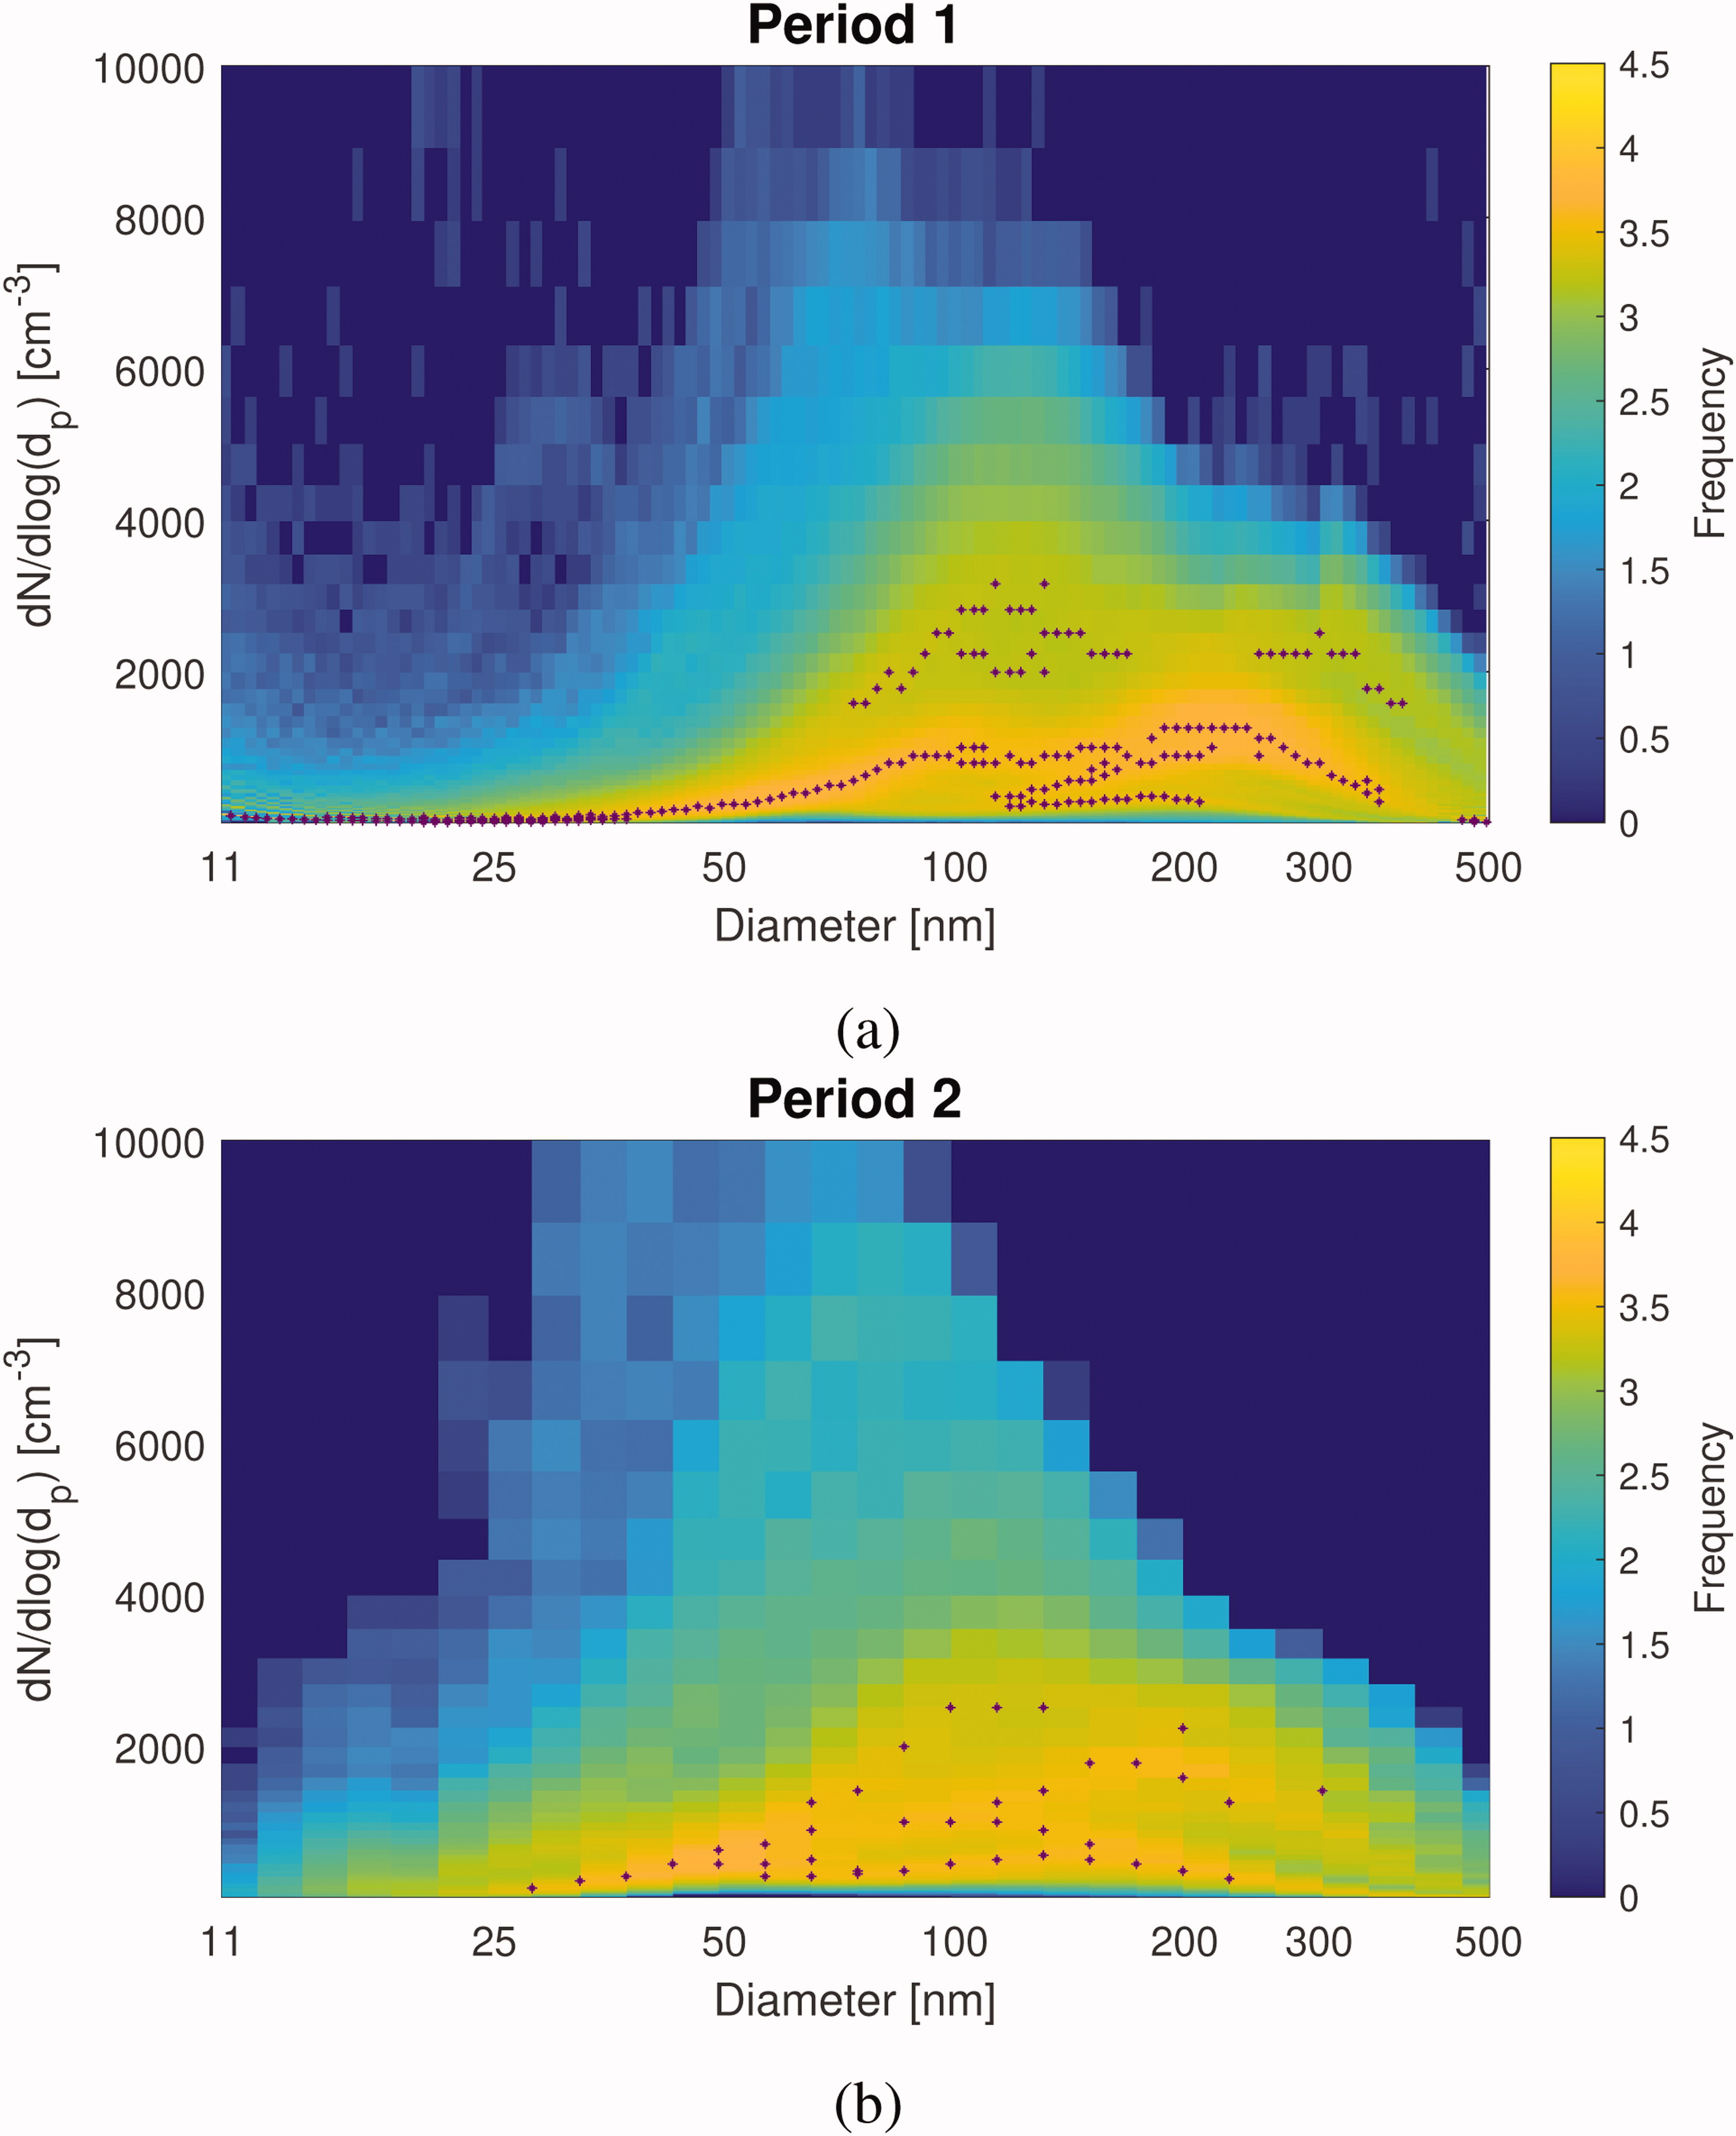
Fig. 3. Histogram figures of fine particle size distributions during (a) Period 1 measured with the SMPS, and (b) Period 2 measured with the DMPS. On the x-axis is the particle diameter (nm) and on the y-axis is the concentration (). Colours indicate the frequency of measured particle size distributions. The purple dots indicate the maximum peaks in frequency for each size bins. For values lower than 1259 on the y-axis the minimum for peak height is 3.5 and for values higher than 1259 the minimum peak height is 3.0. The figures comprise all data we have during the respective measurement periods.
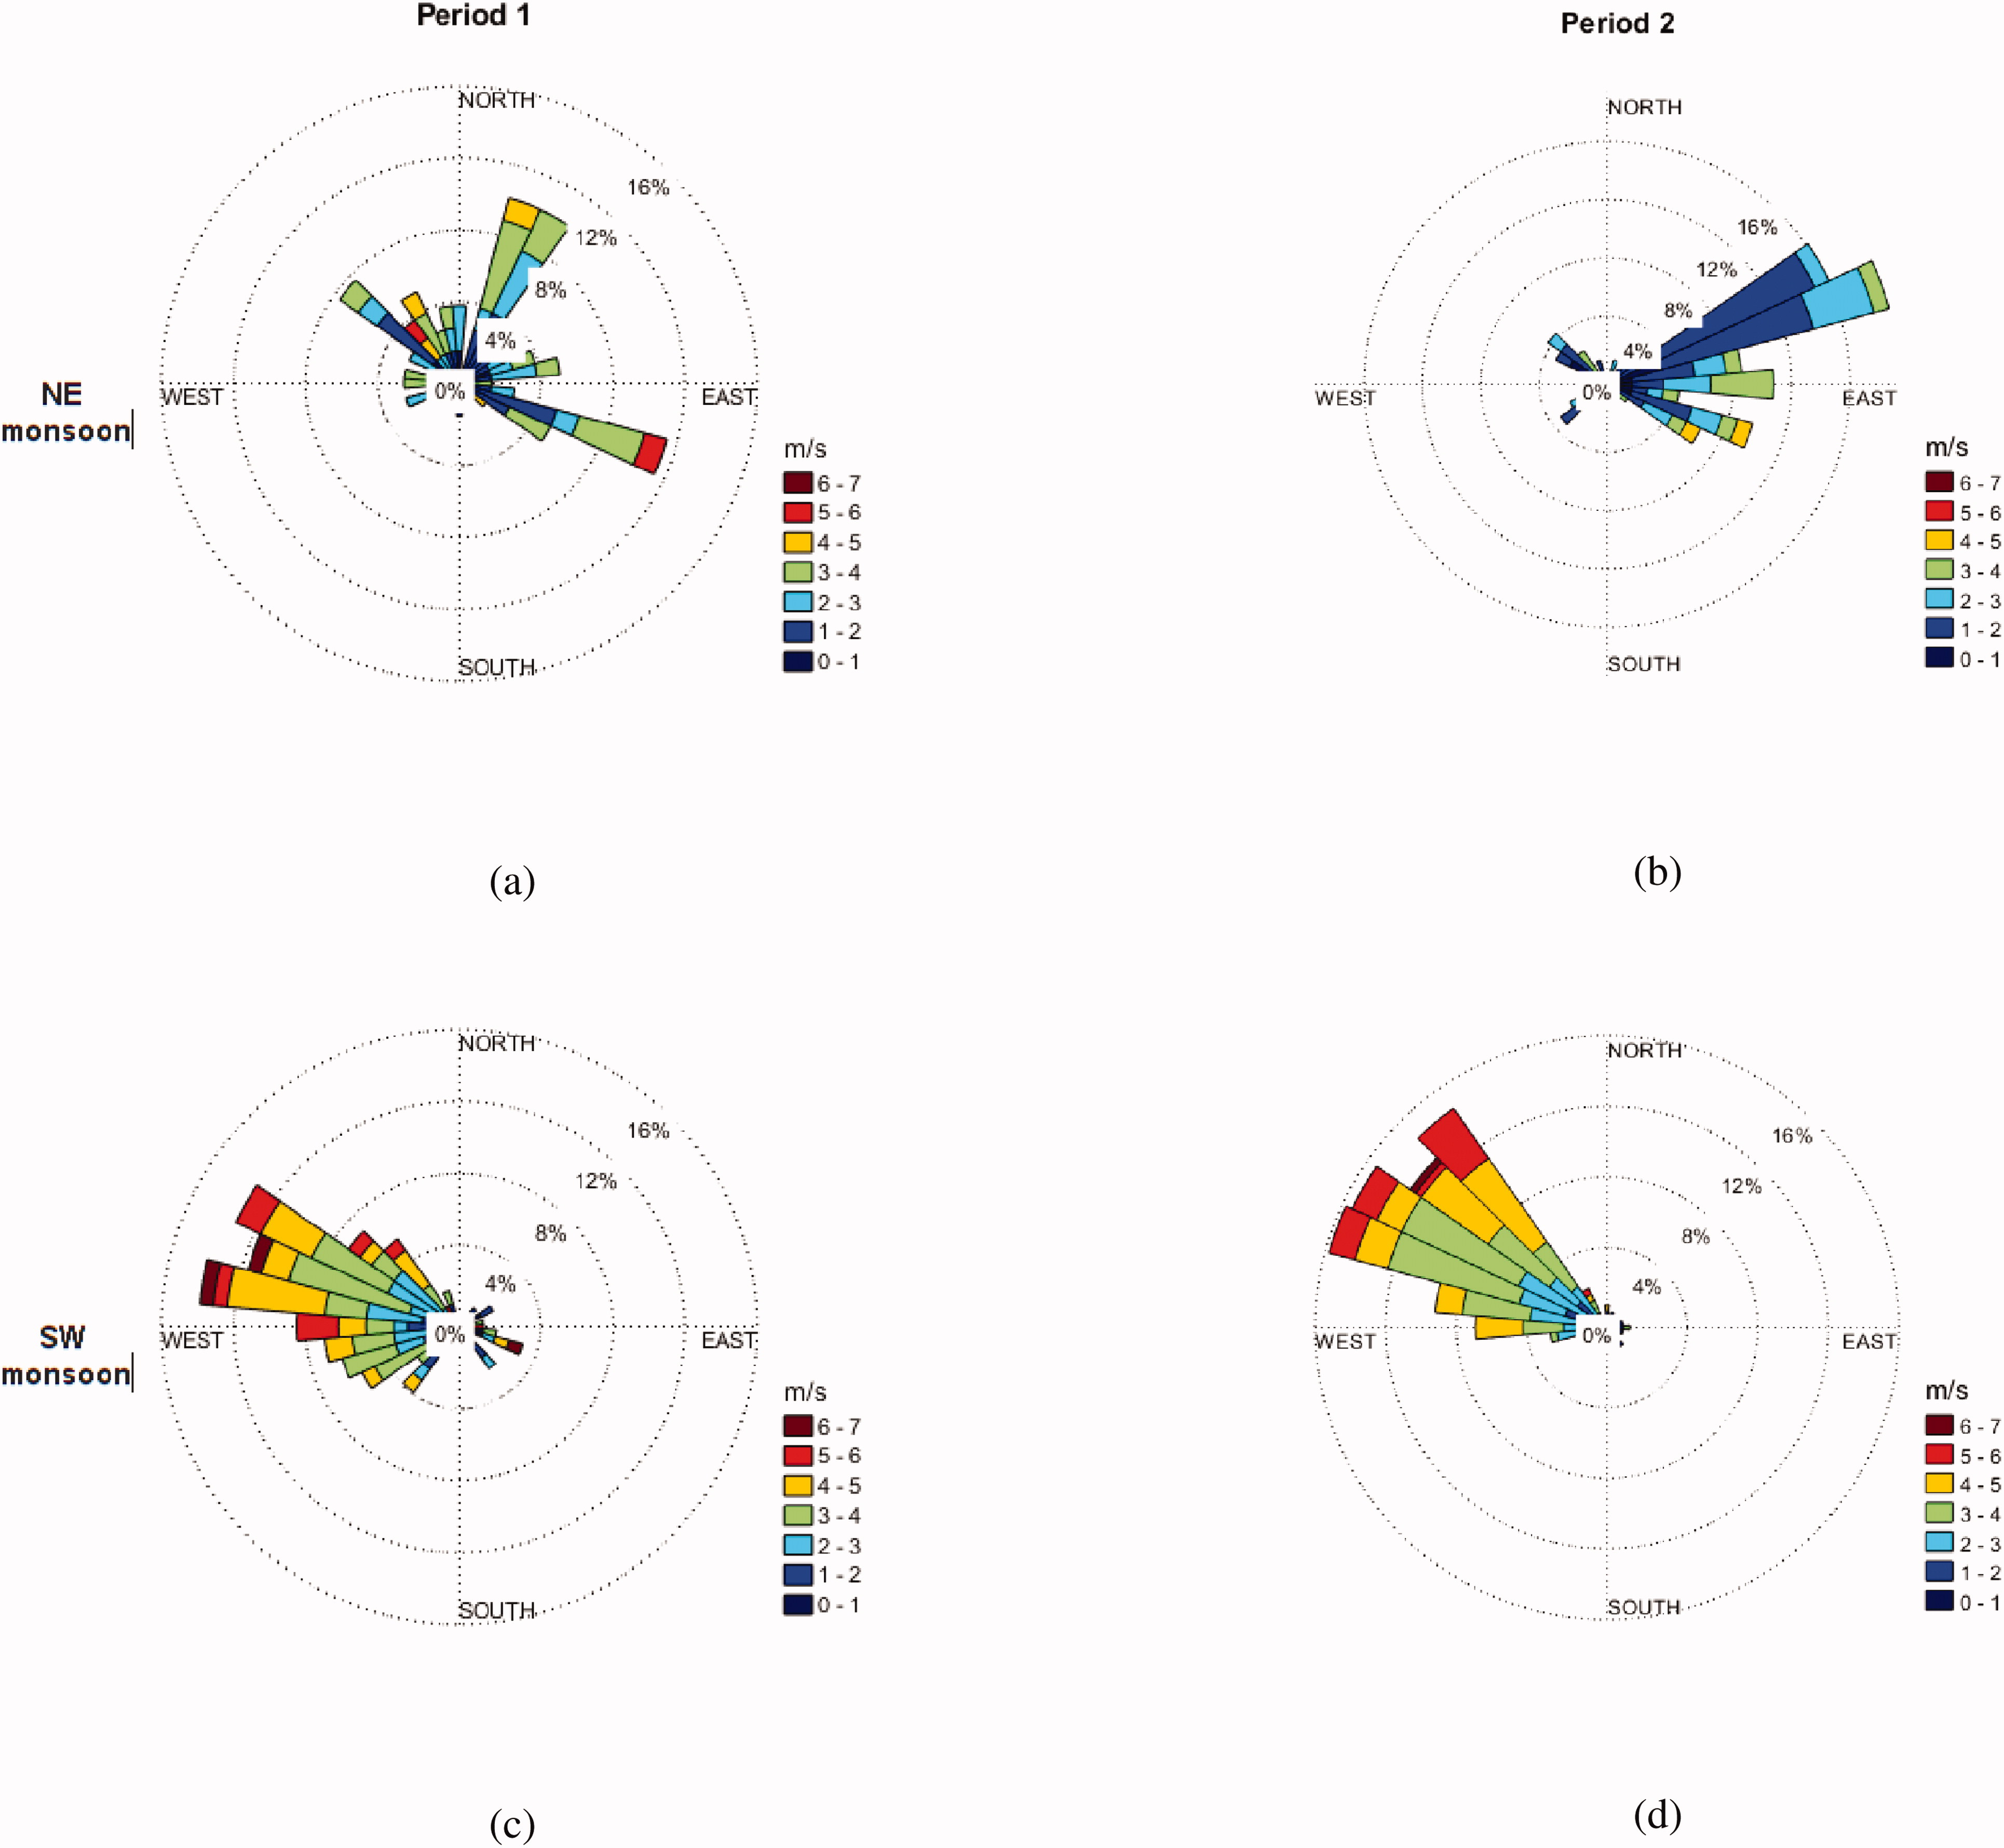
Fig. 4. Wind roses for different seasons at the Maldives: (a) NE monsoon season in Period 1, (b) NE monsoon season in Period 2, (c) SW monsoon season in Period 1, and (d) SW monsoon season in Period 2. The colours indicate wind speed () and the percentages the prevalence in wind directions per season. The meteorological data used in the figures corresponds with the aerosol particle data availability and averaged daily.
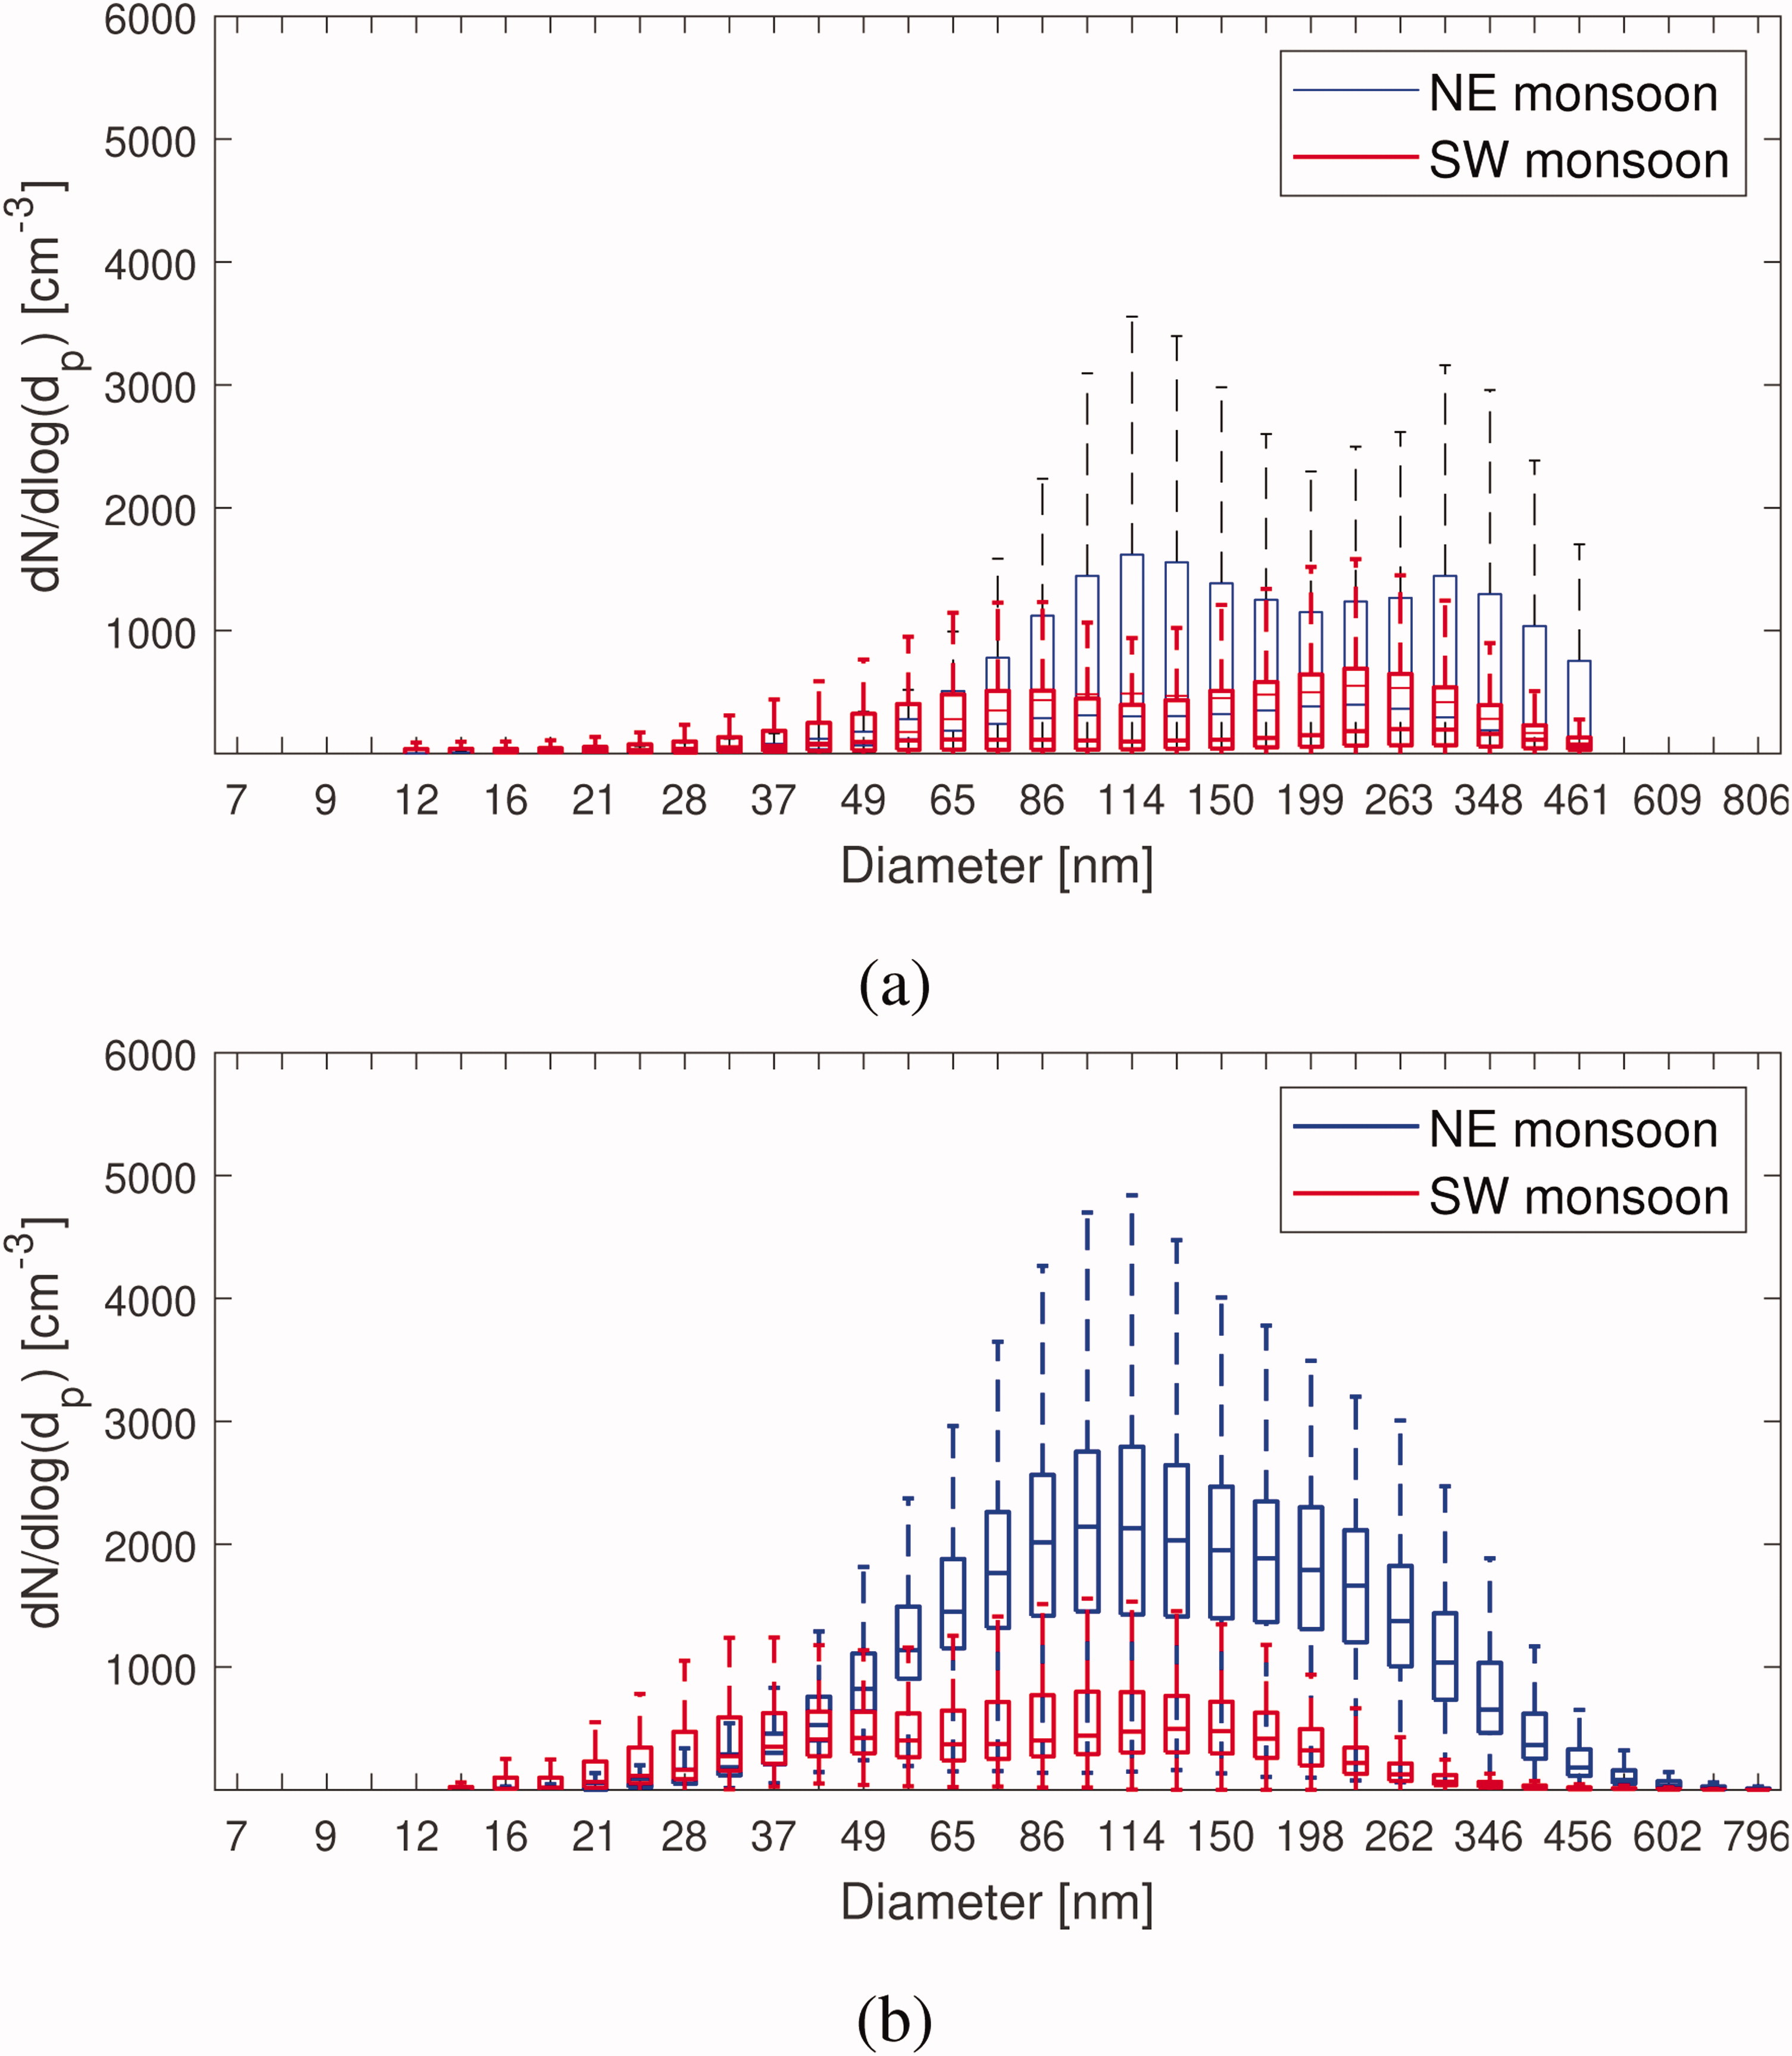
Fig. 5. Box-and-whisker plots of hourly-averaged particle size distributions during (a) Period 1 and (b) Period 2. X-axis is the particle diameter and y-axis the particle concentration (). Blue color indicates the NE monsoon season, and red SW monsoon season. Panel (a) depicts SMPS measurements for which the data has been interpolated to similar bin sizes as for the DMPS data in panel (b). The central line in the boxes indicate the median, and the bottom and top lines of the boxes indicate the and percentiles. The whiskers mark the most extreme data points that are not considered as outliers.
Table 1.
Particle total number concentrations measured during NE and SW monsoon in Period 1 and 2.
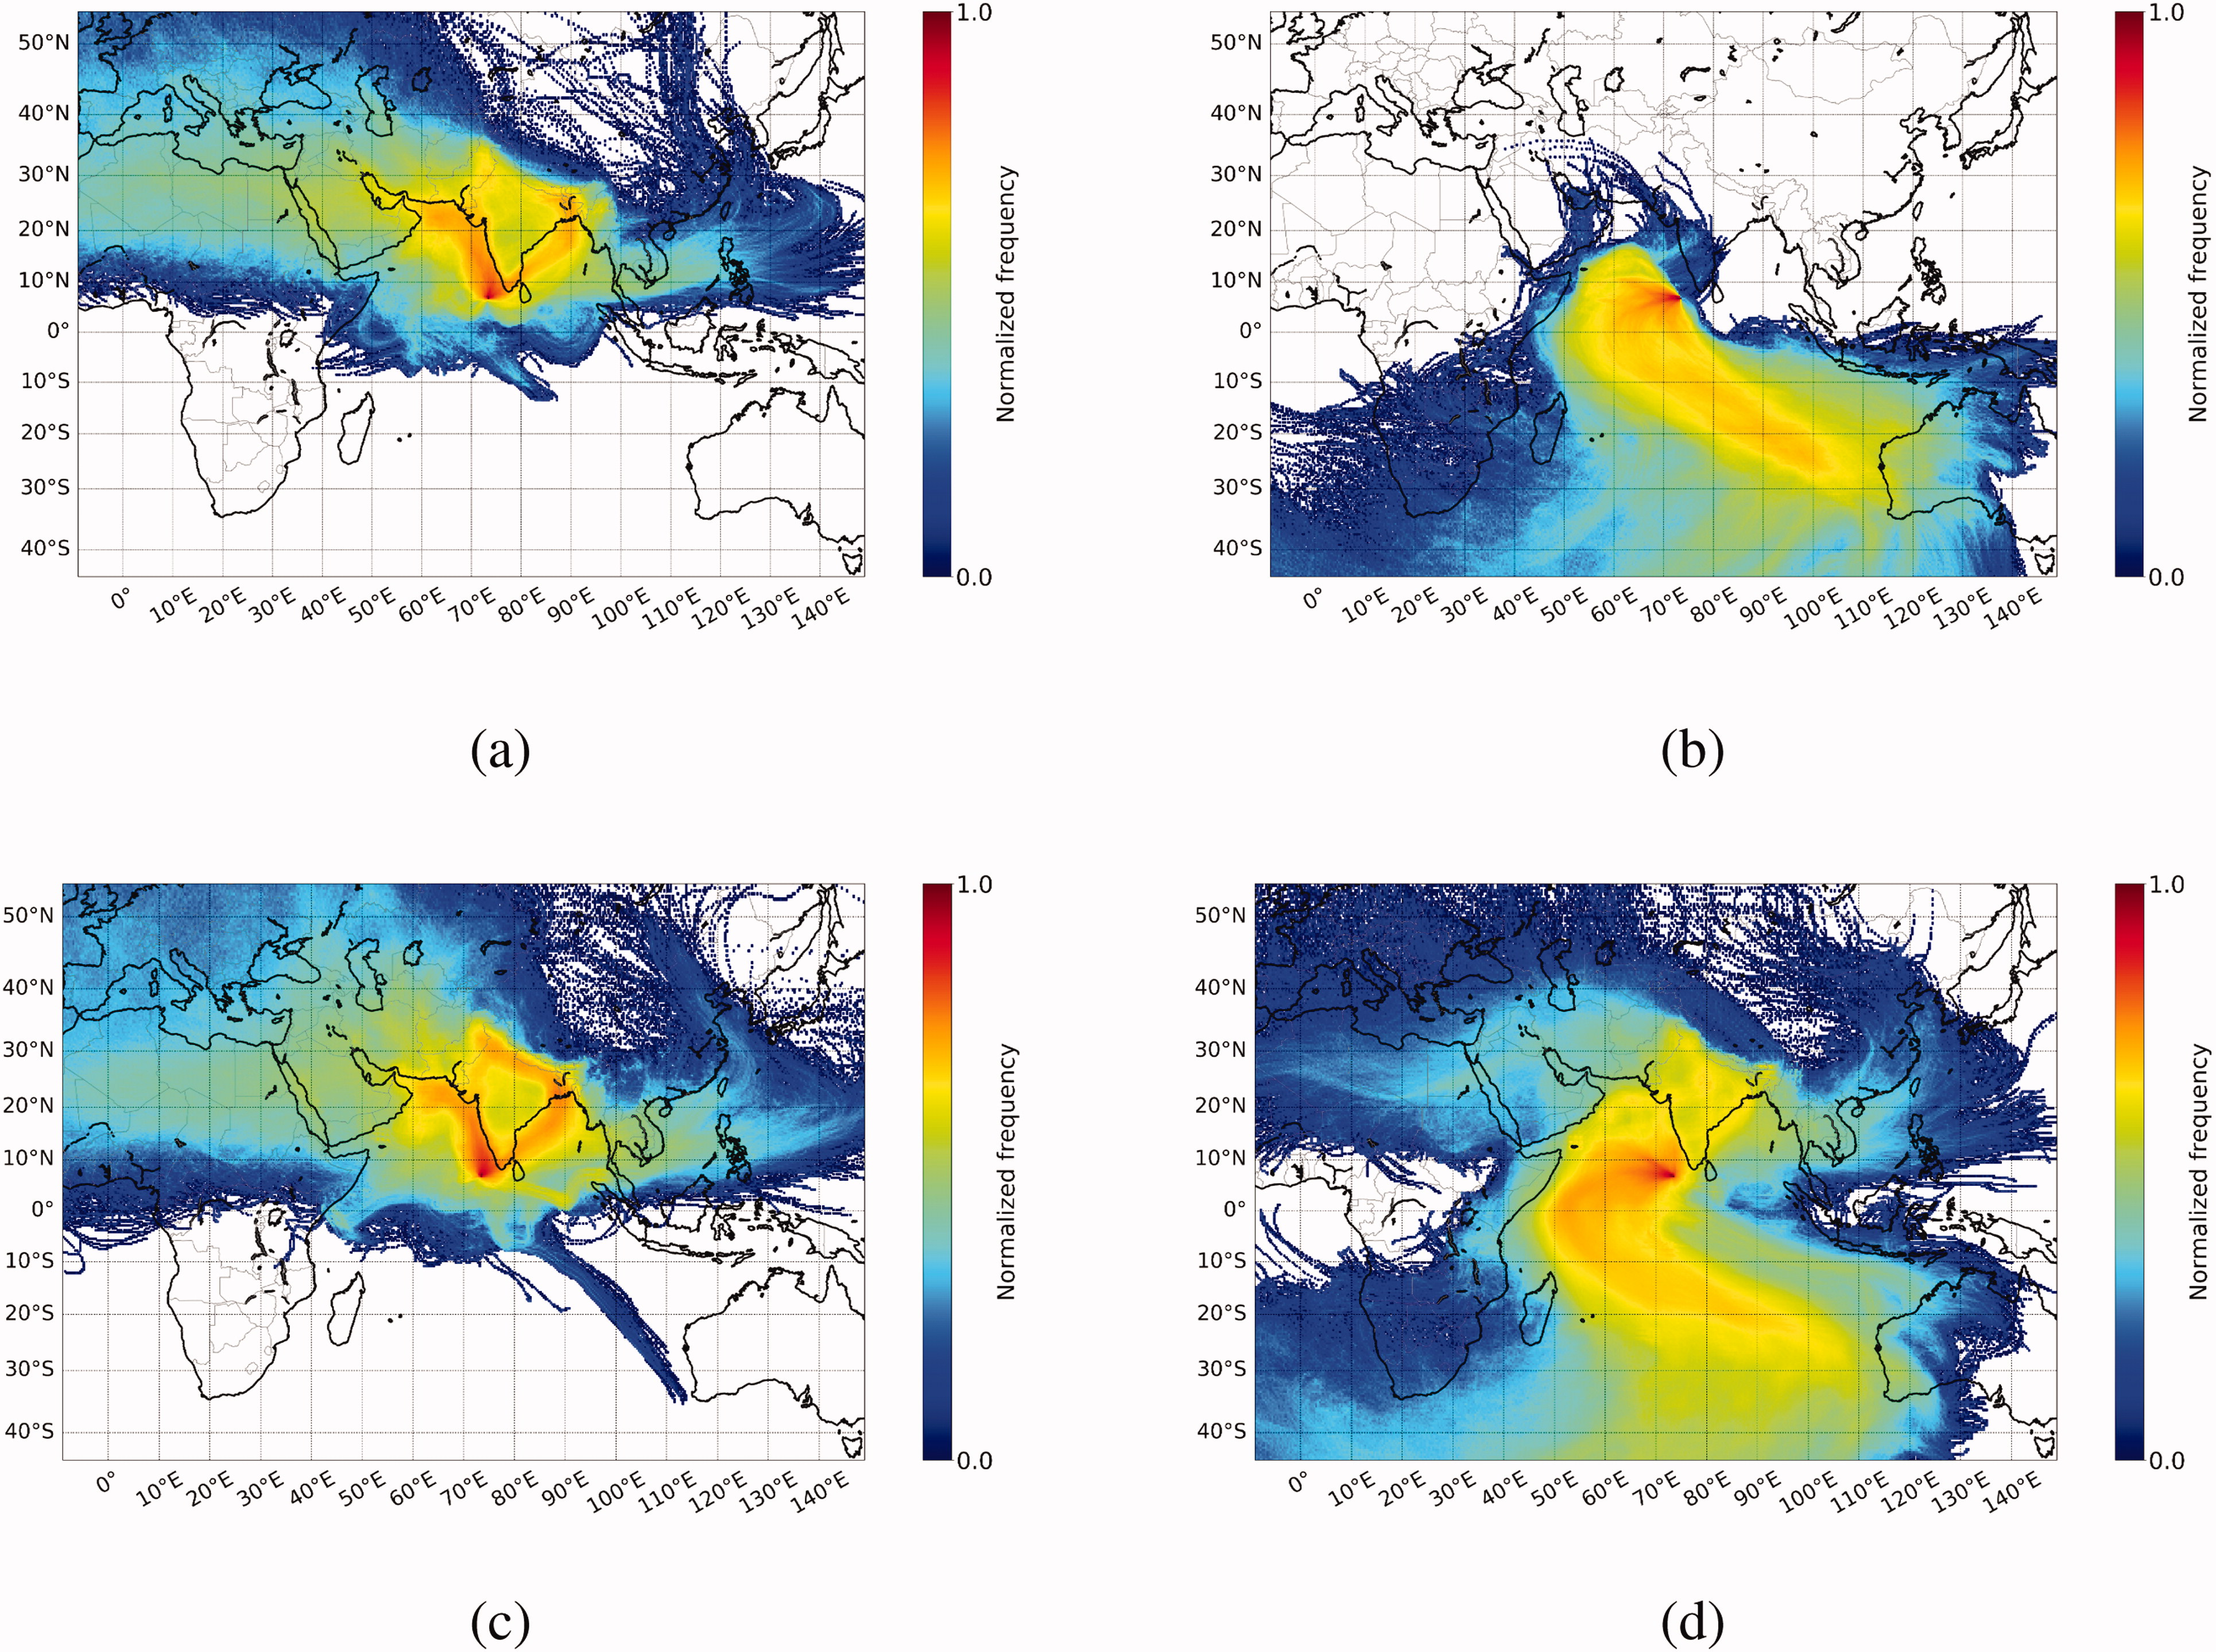
Fig. 6. Frequency map of the HYSPLIT back trajectories calculated for (a) 2004–2008 NE monsoon season, (b) 2004–2008 SW monsoon season, (c) 2014–2017 NE monsoon season, and (d) 2014–2017 SW monsoon season. The back-trajectories are calculated for every hour when there exists particle number size distribution data and each back-trajectory extends 14 days back in time.
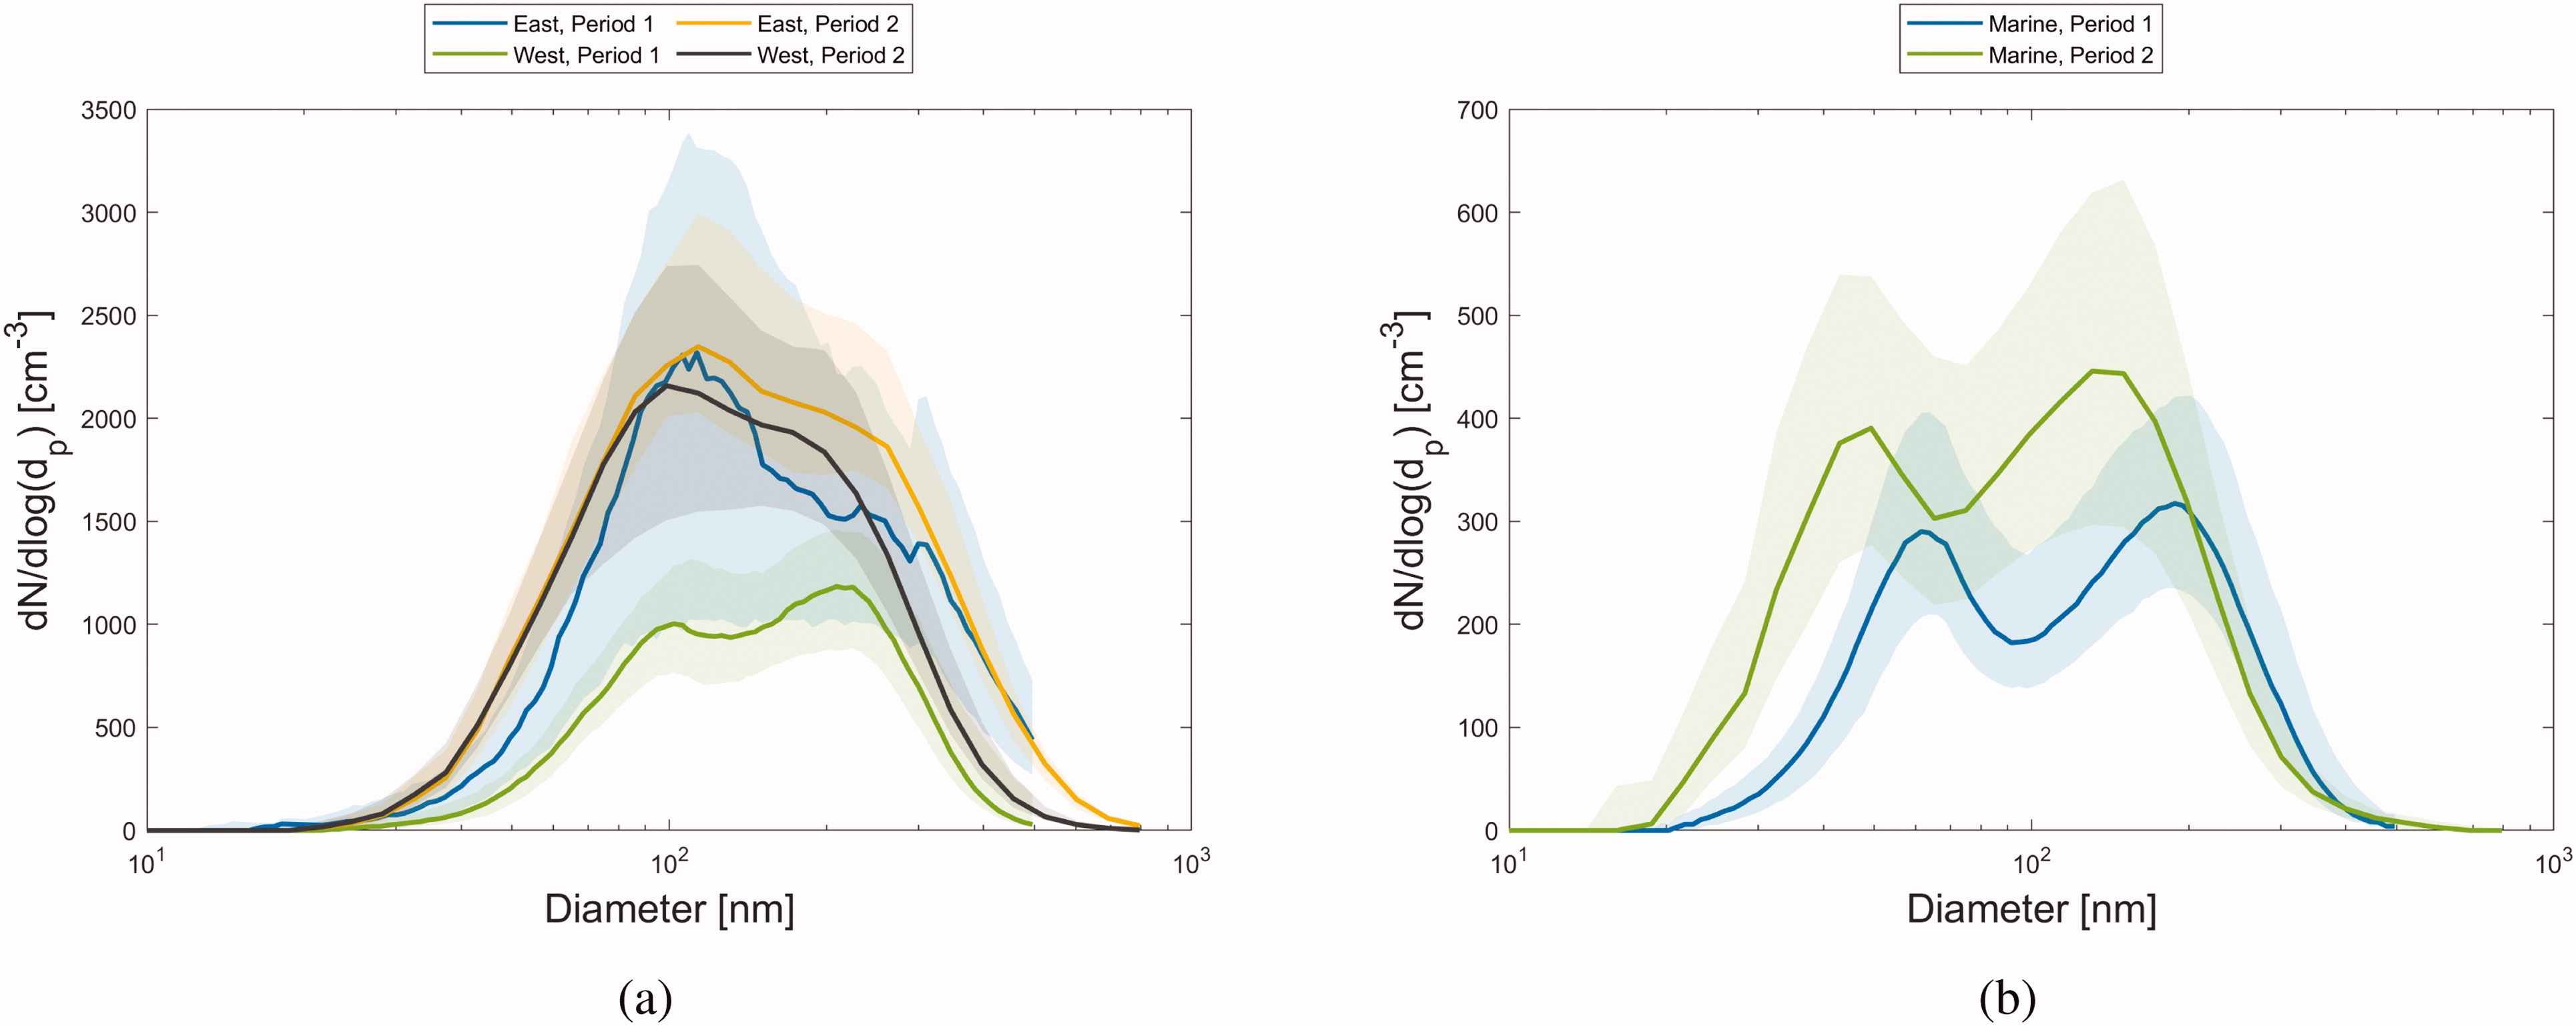
Fig. 7.
Particle median size distributions for identified air masses during (a) the NE monsoon season, travelling down either the eastern or western side of the Indian subcontinent, and (b) over the ocean during the SW monsoon season. On the x-axis is the particle diameter (nm) and on the y-axis is the particle concentration (). The shaded areas indicate the median ± the interquartile range of the distributions.
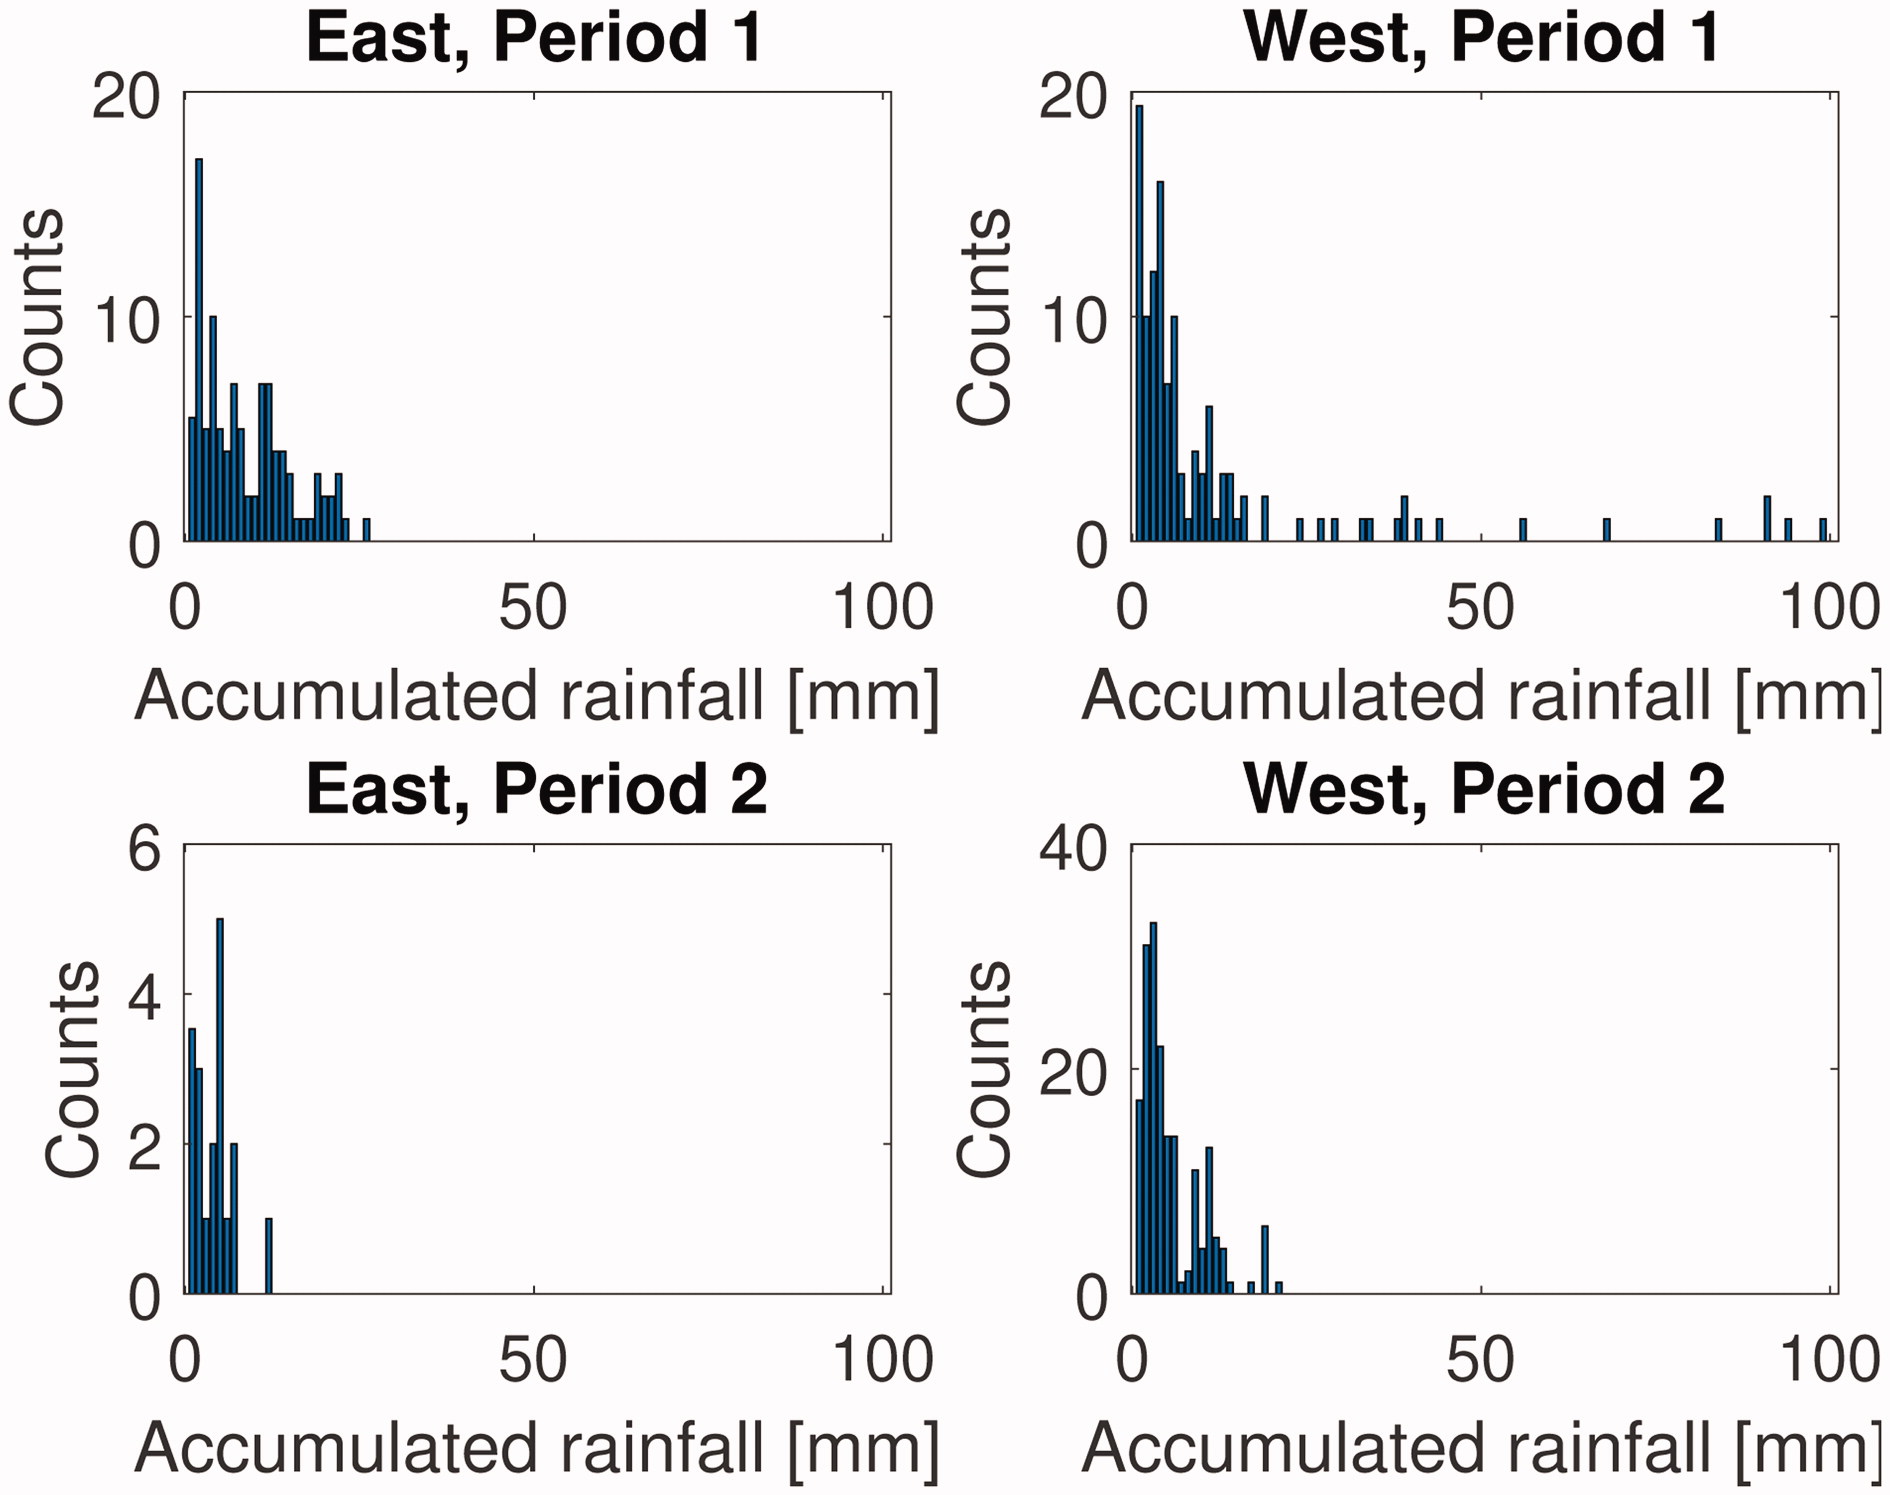
Fig. 8.
Rainfall accumulation histograms for air masses travelling down either the eastern or western side of the Indian subcontinent during the NE monsoon season. The number of counts for the first rainfall accumulation bin of the histogram is divided by 30 for better comparison with the other values.
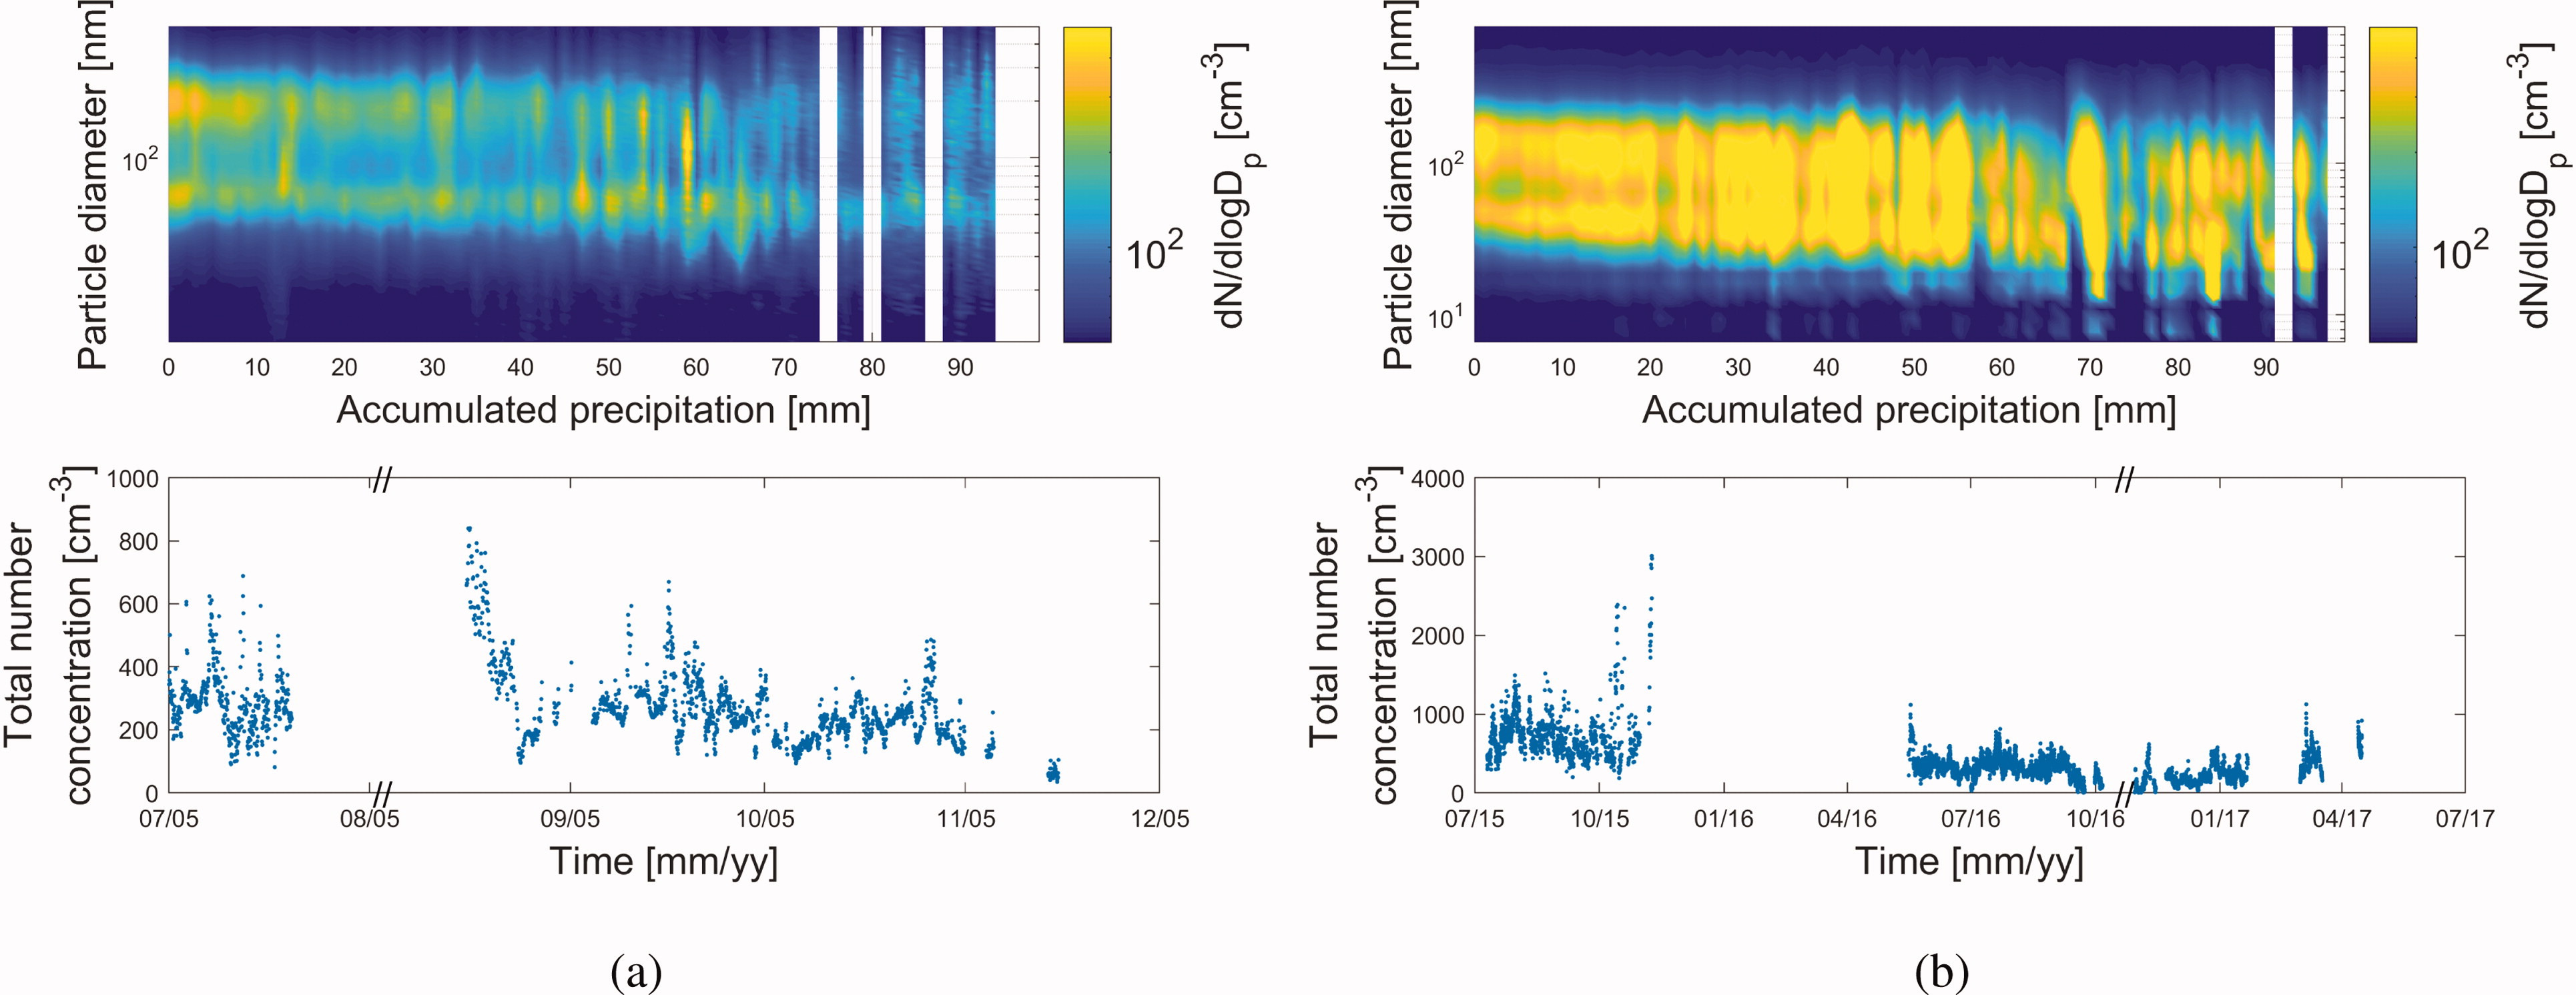
Fig. 9. Impact of accumulated rainfall on measured particle size distribution and total number concentration time series during the SW monsoon season in (a) Period 1, and (b) Period 2. In the upper figure on the x-axis is the accumulated rainfall (mm) during four days before the air mass arrived to the measurement site, on the y-axis is the particle diameter (nm) and the concentration () is in colour. In the lower figure on the x-axis is time and on the y-axis is the total number concentration (). All data are in hourly resolution, and the particle size distribution data are averaged to 1 mm rain bins.
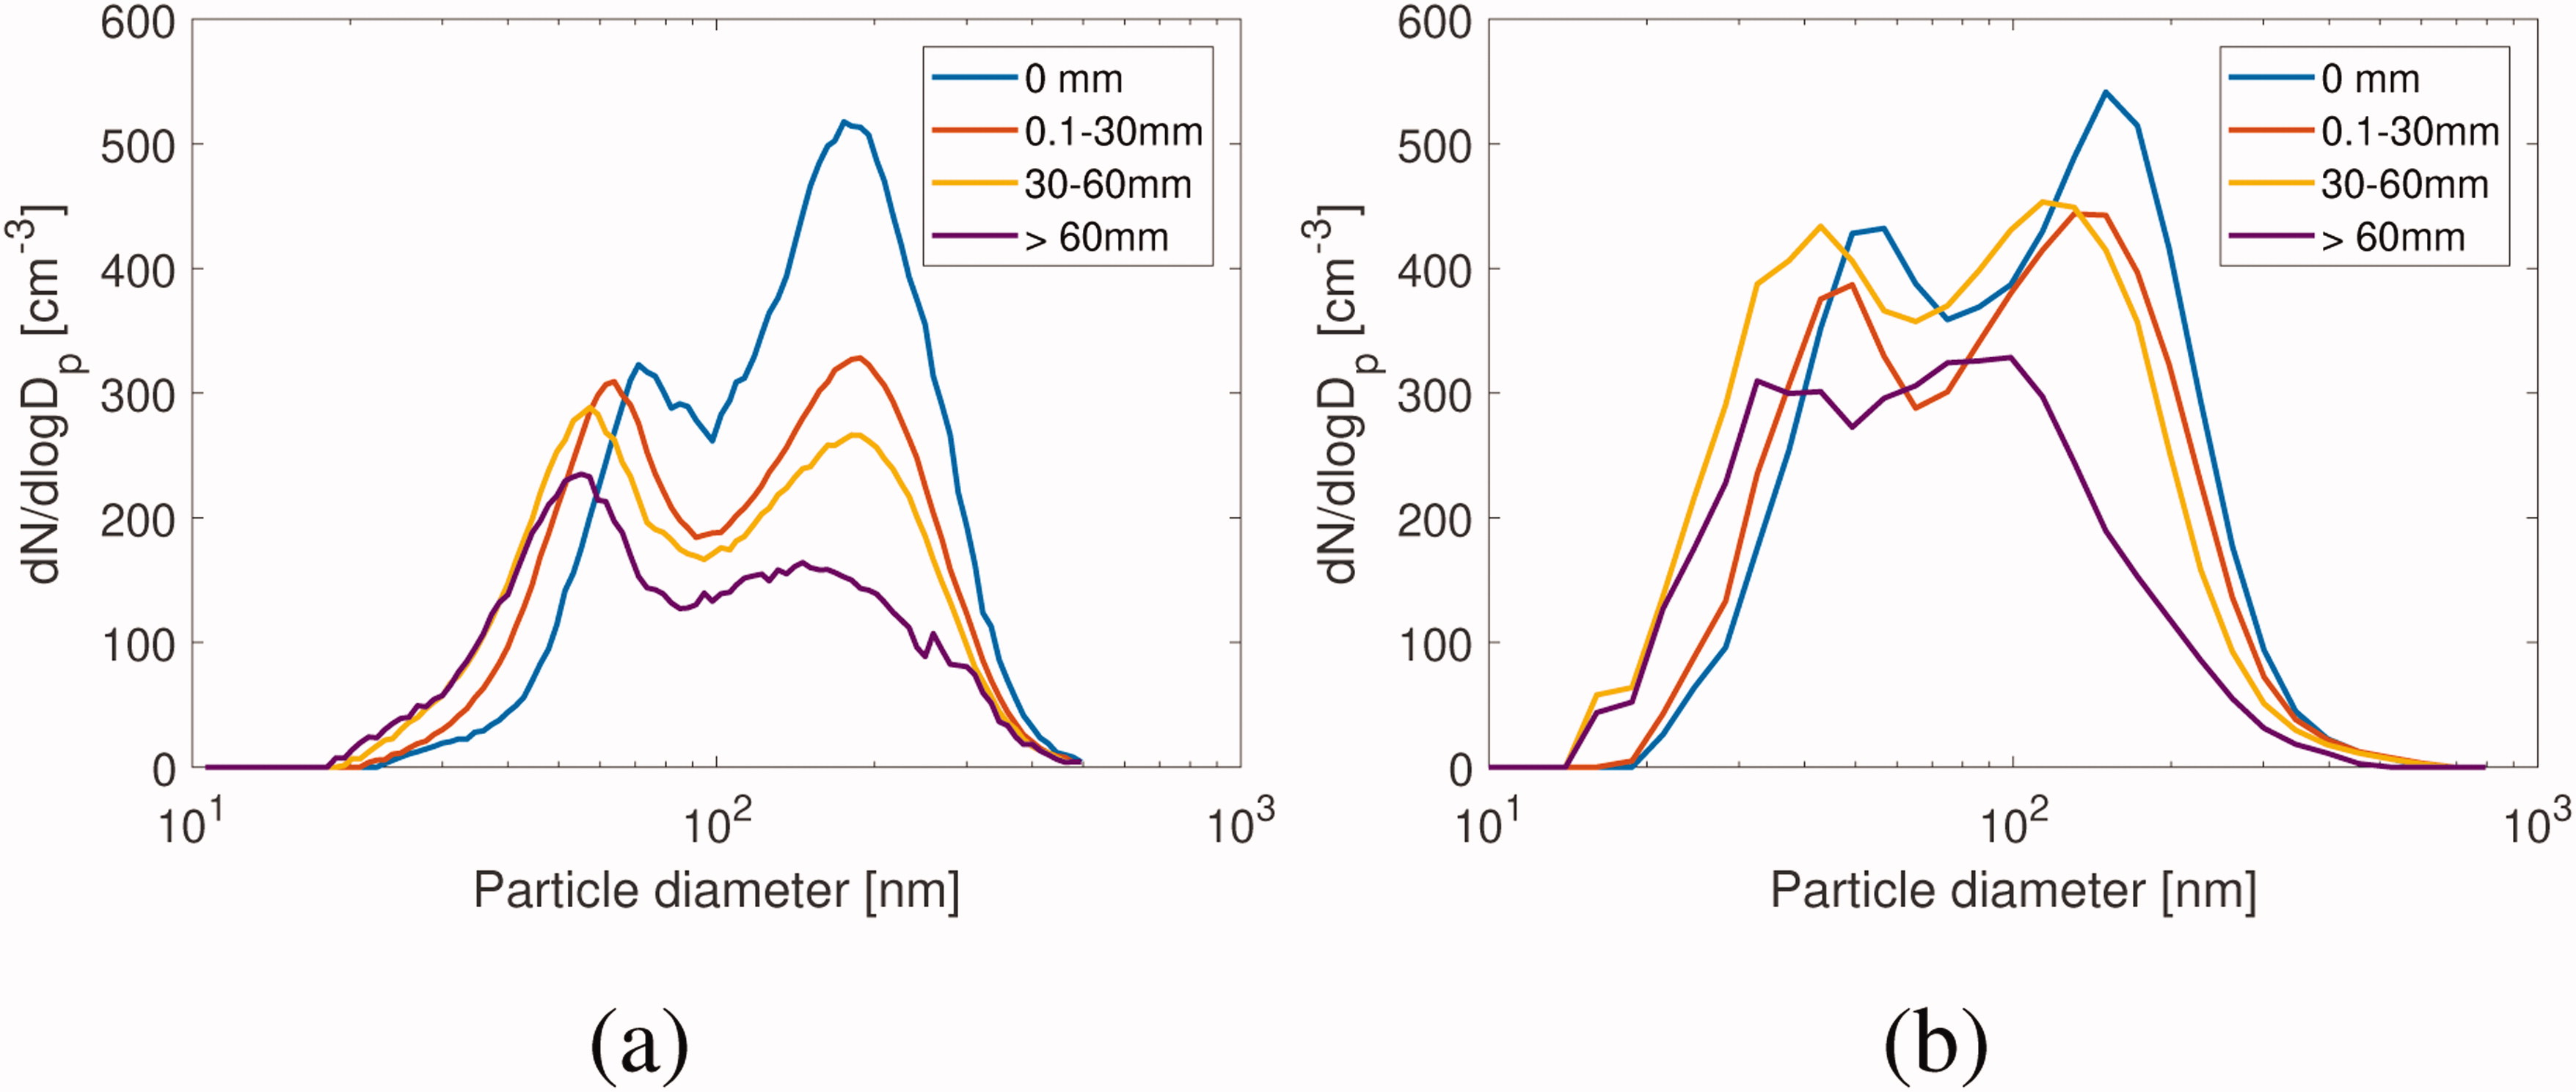
Fig. 10. Impact of accumulated rainfall on measured particle size distribution during the SW monsoon season in (a) Period 1, and (b) Period 2. On the x-axis is the particle diameter (nm) and on the y-axis is the particle concentration (). All data are in hourly resolution. The size distributions with different amounts of rainfall are plotted with different colours.