
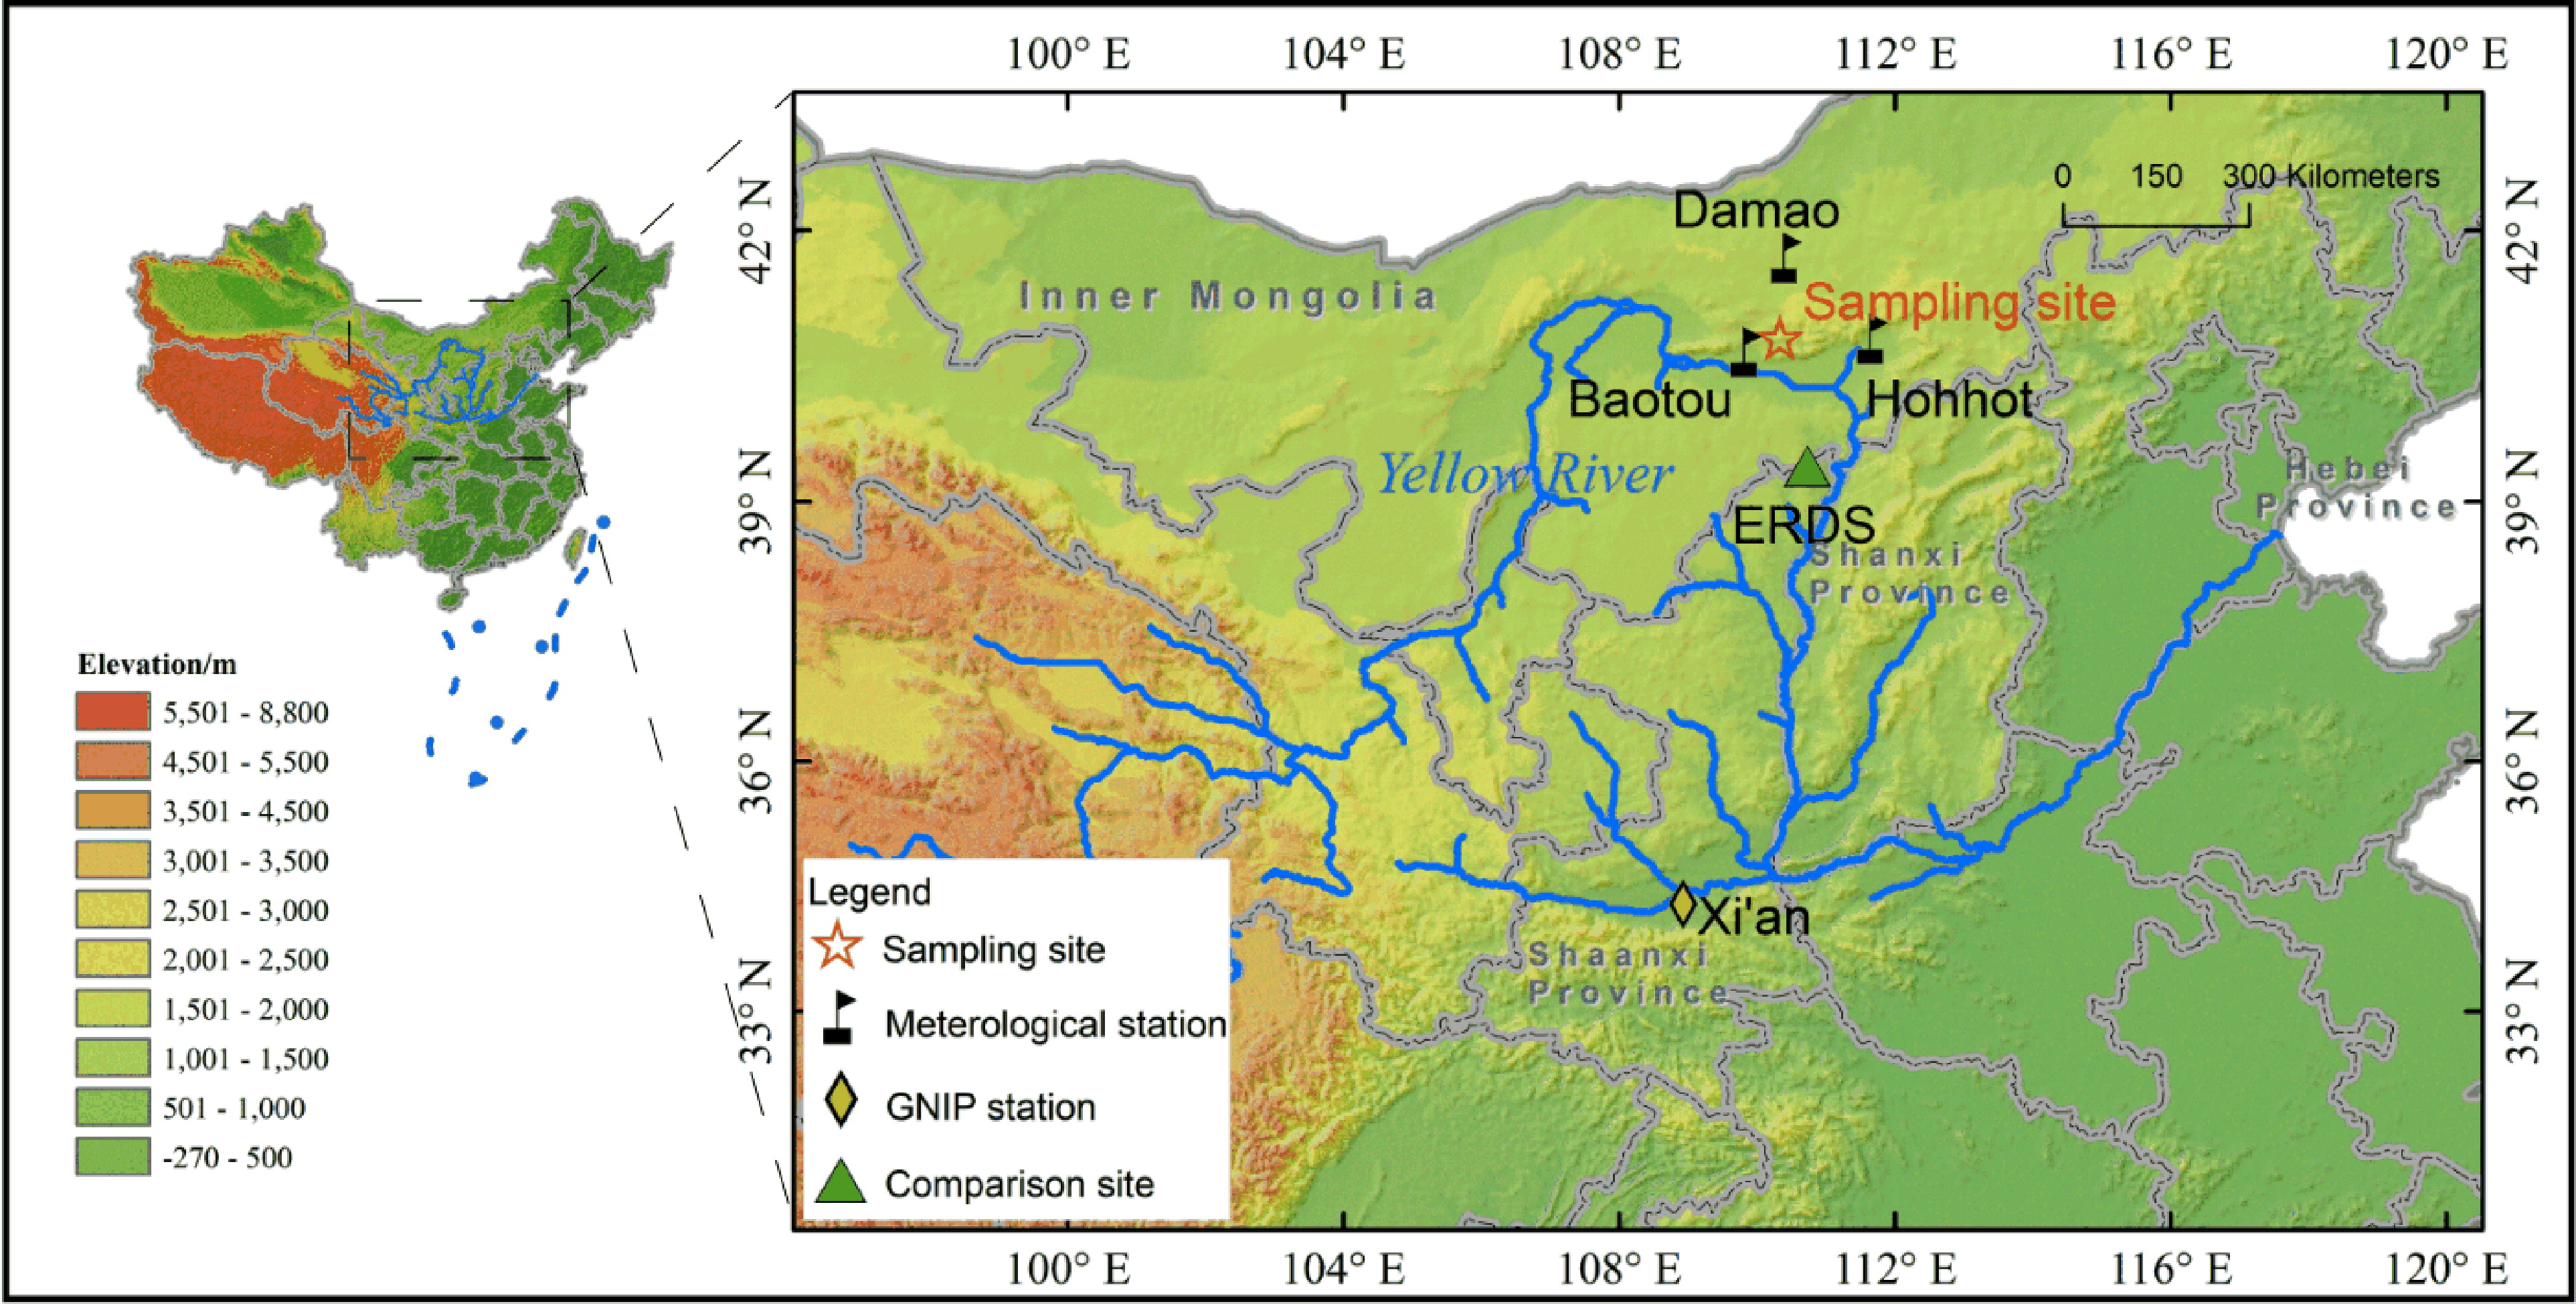
Fig. 1.
Geographical locations of the sampling site, three meteorological stations and one site for δ18O comparison (ERDS, Liu, Wang et al. 2019). The δ18OP site in Xi’an from the Global Network of Isotopes in Precipitation project (GNIP) was denoted and the δ18OP site in Baotou was at the same location of the Baotou meteorological station.
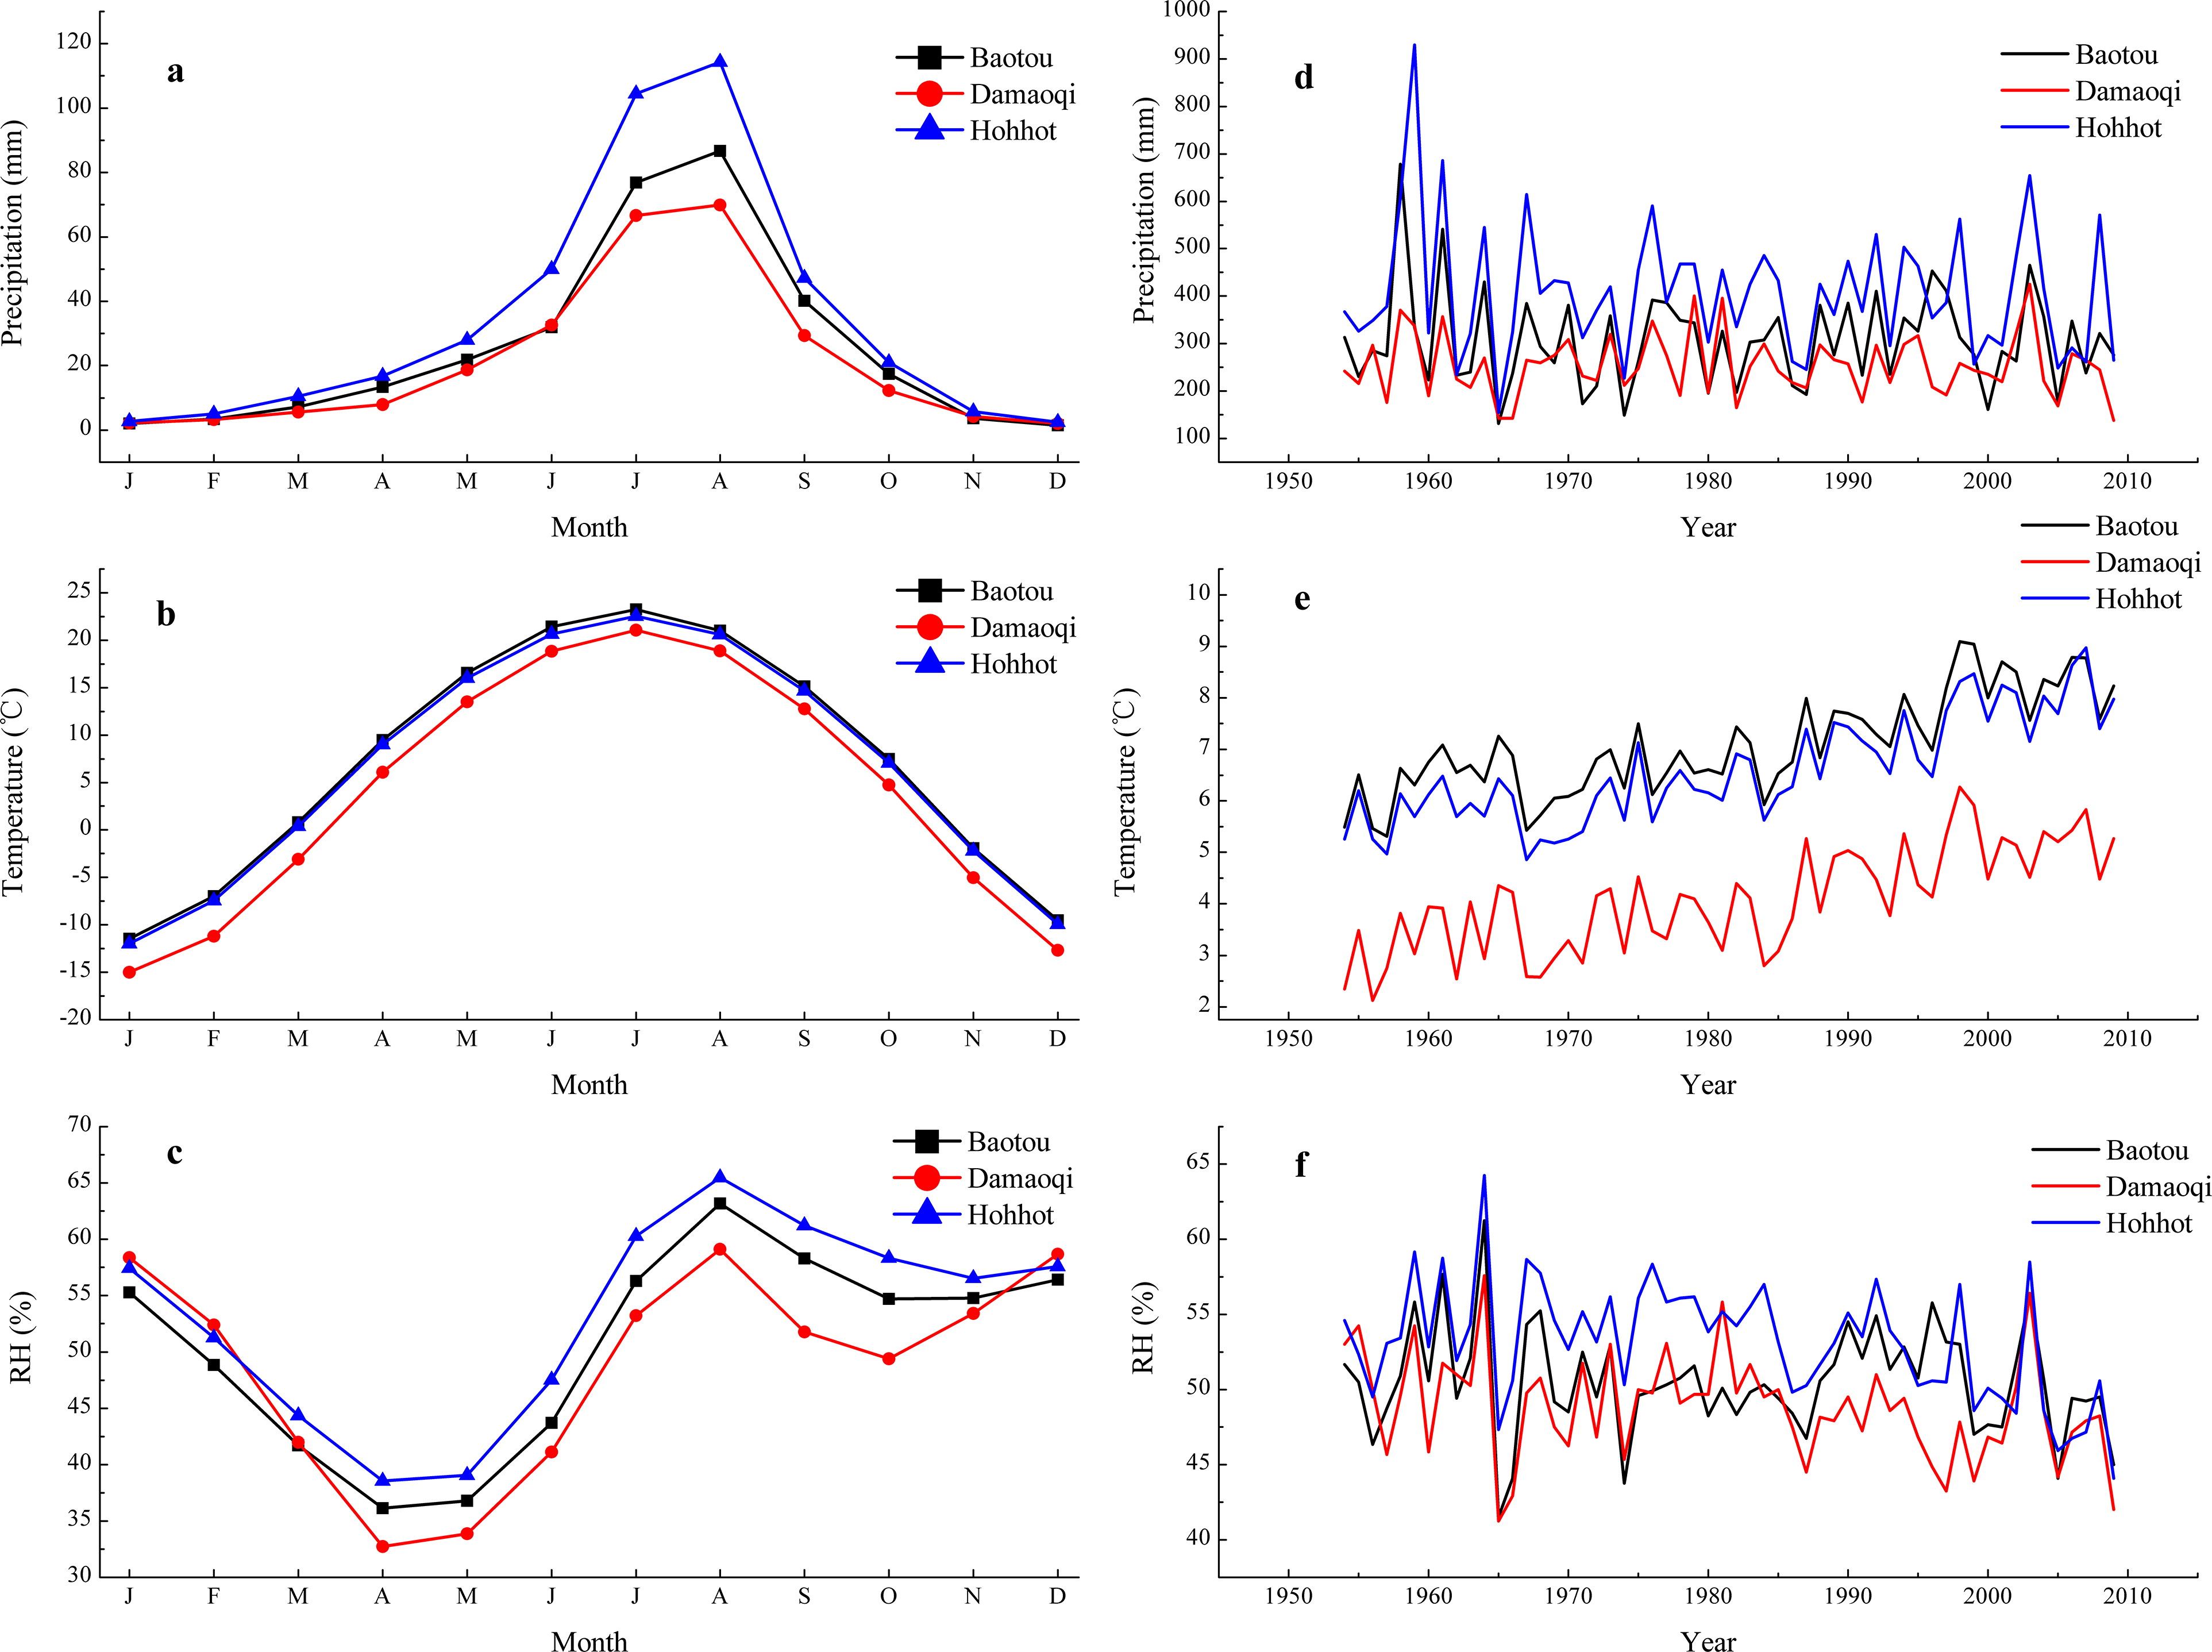
Fig. 2.
The monthly variations of (a) precipitation, (b) temperature and (c) relative humidity and the annual variations of (d) precipitation, (e) temperature and (f) relative humidity at the Baotou, Damaoqi and Hohhot stations during 1954–2009 AD.
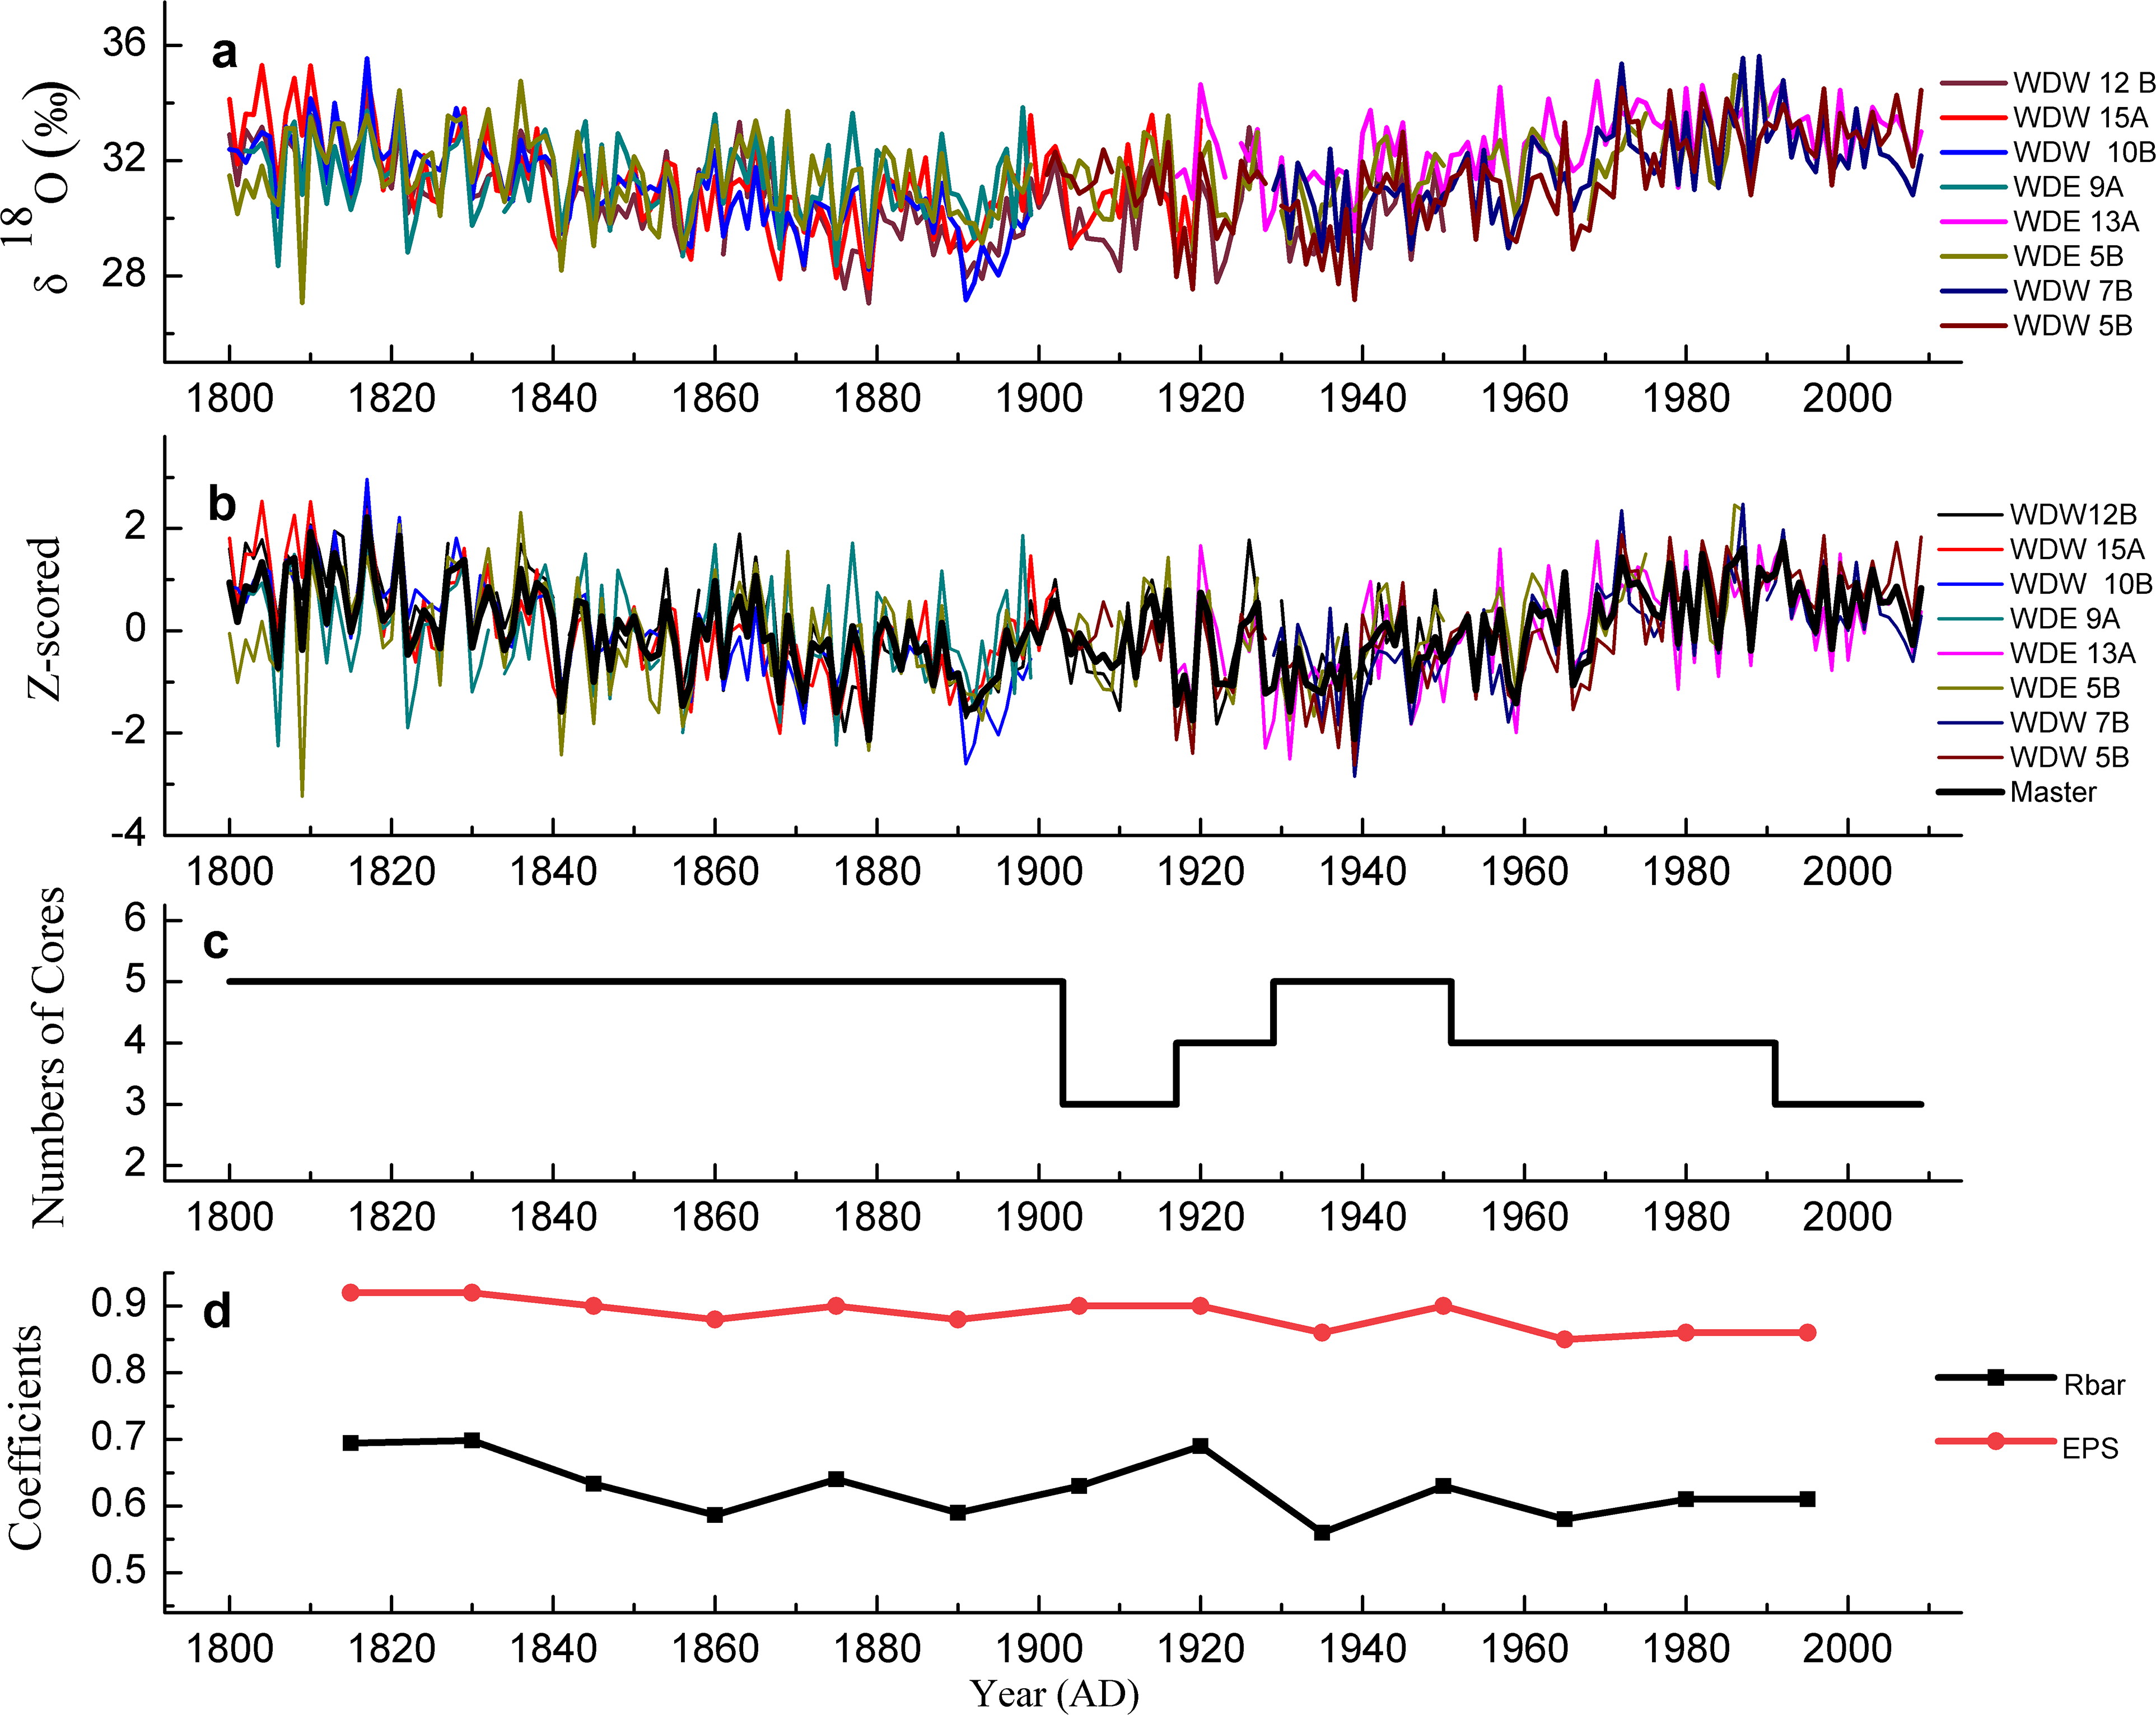
Fig. 3.
The δ18OTR series in Baotou. (a) The raw δ18O data of the eight cores. (b) The master δ18OTR series produced by averaging the eight z-scored individual series. (c) Numbers of cores through the chronology interval. (d) Mean interseries correlation (Rbar), the running EPS calculated using 30-year windows and a lag time of 15 years.
Table 1.
Statistical features of the eight individual series.
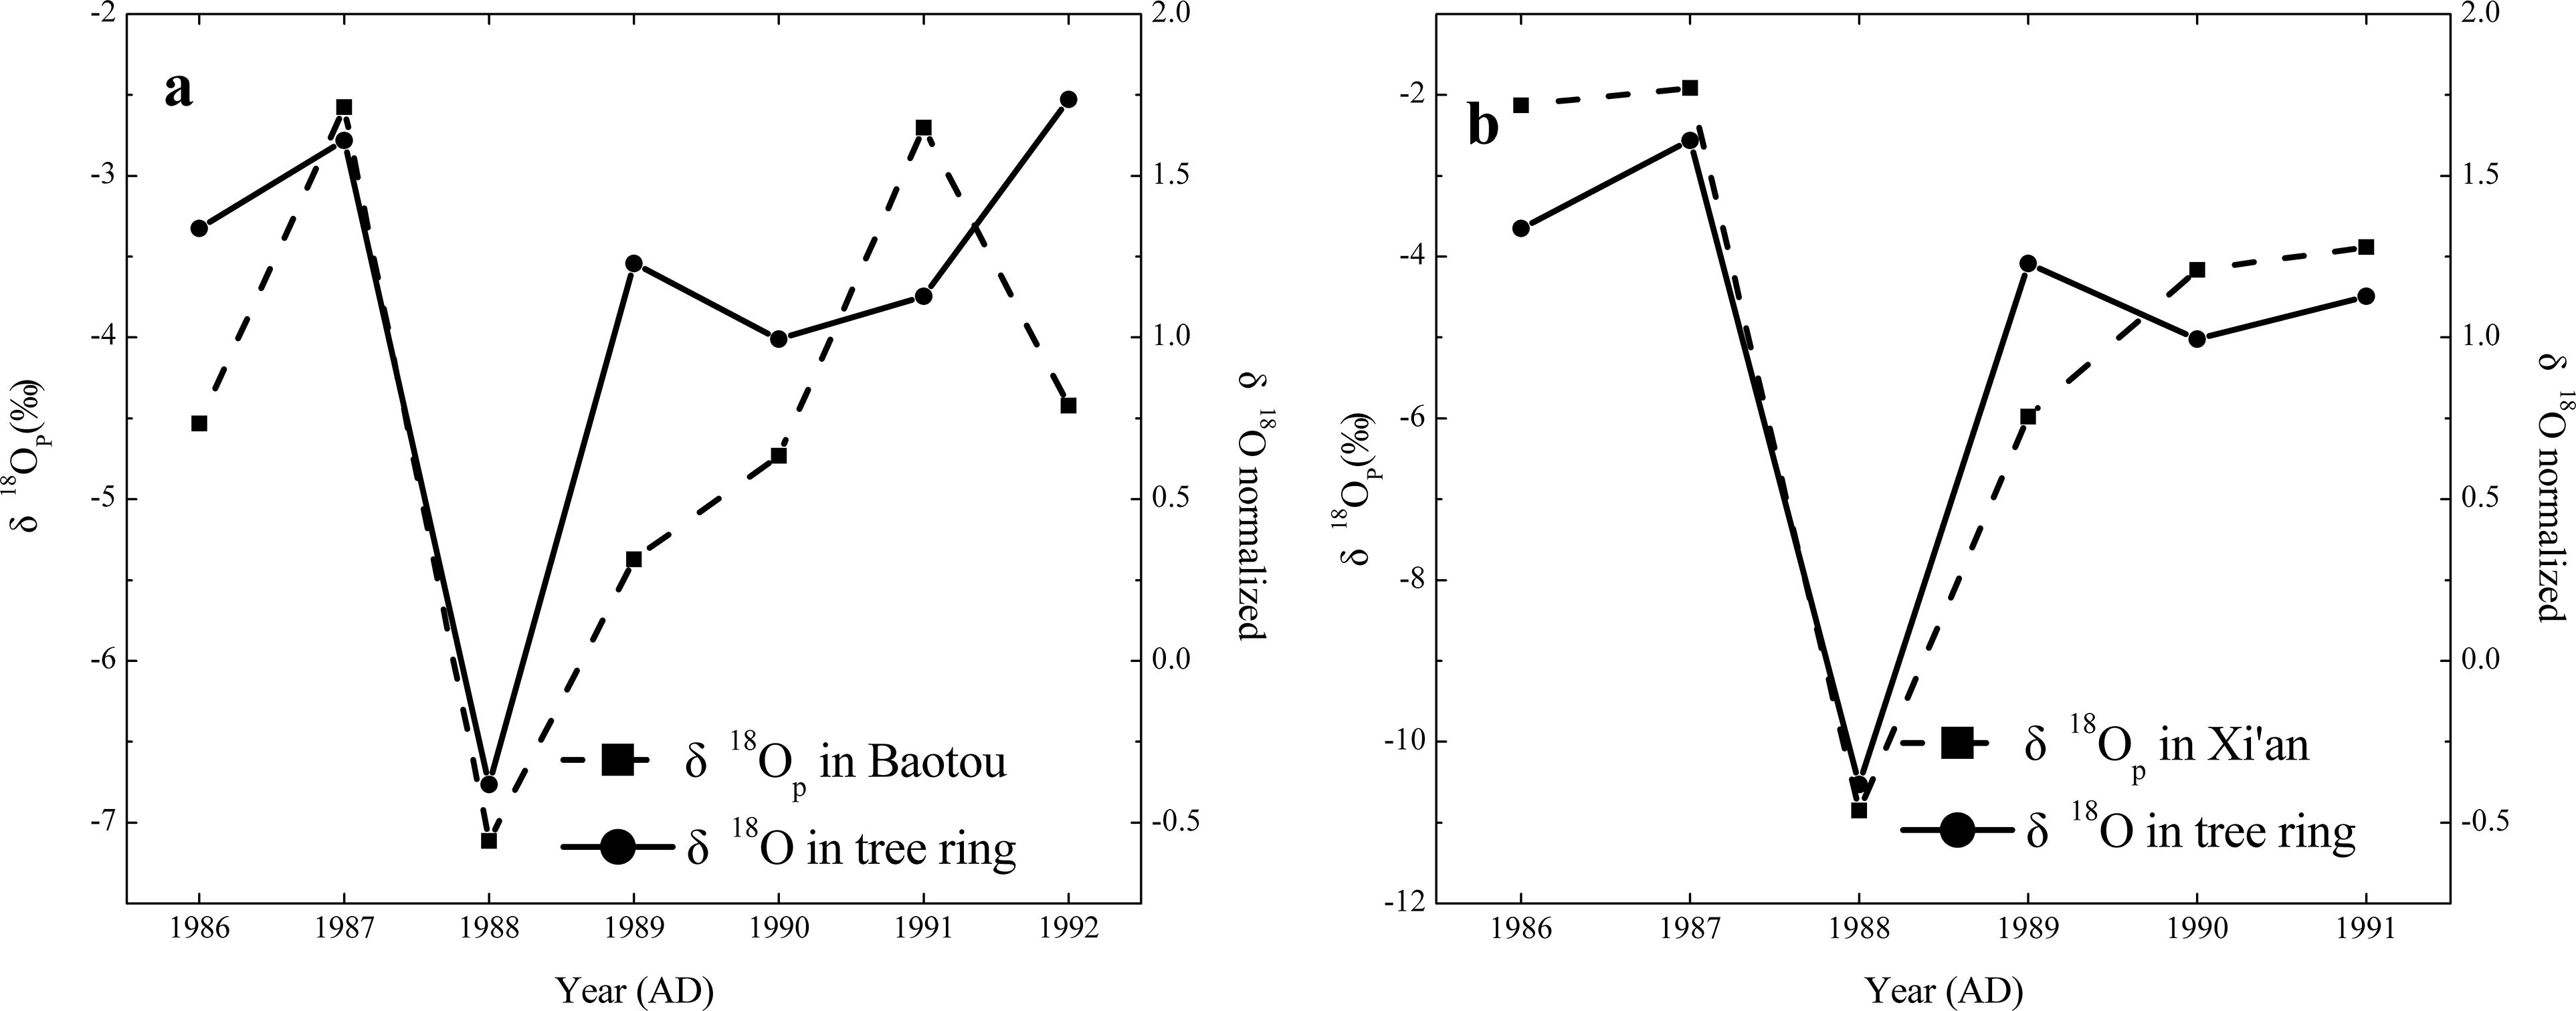
Fig. 4.
Comparisons of the δ18OTR series and δ18OP in (a) Baotou; (b) Xi’an.
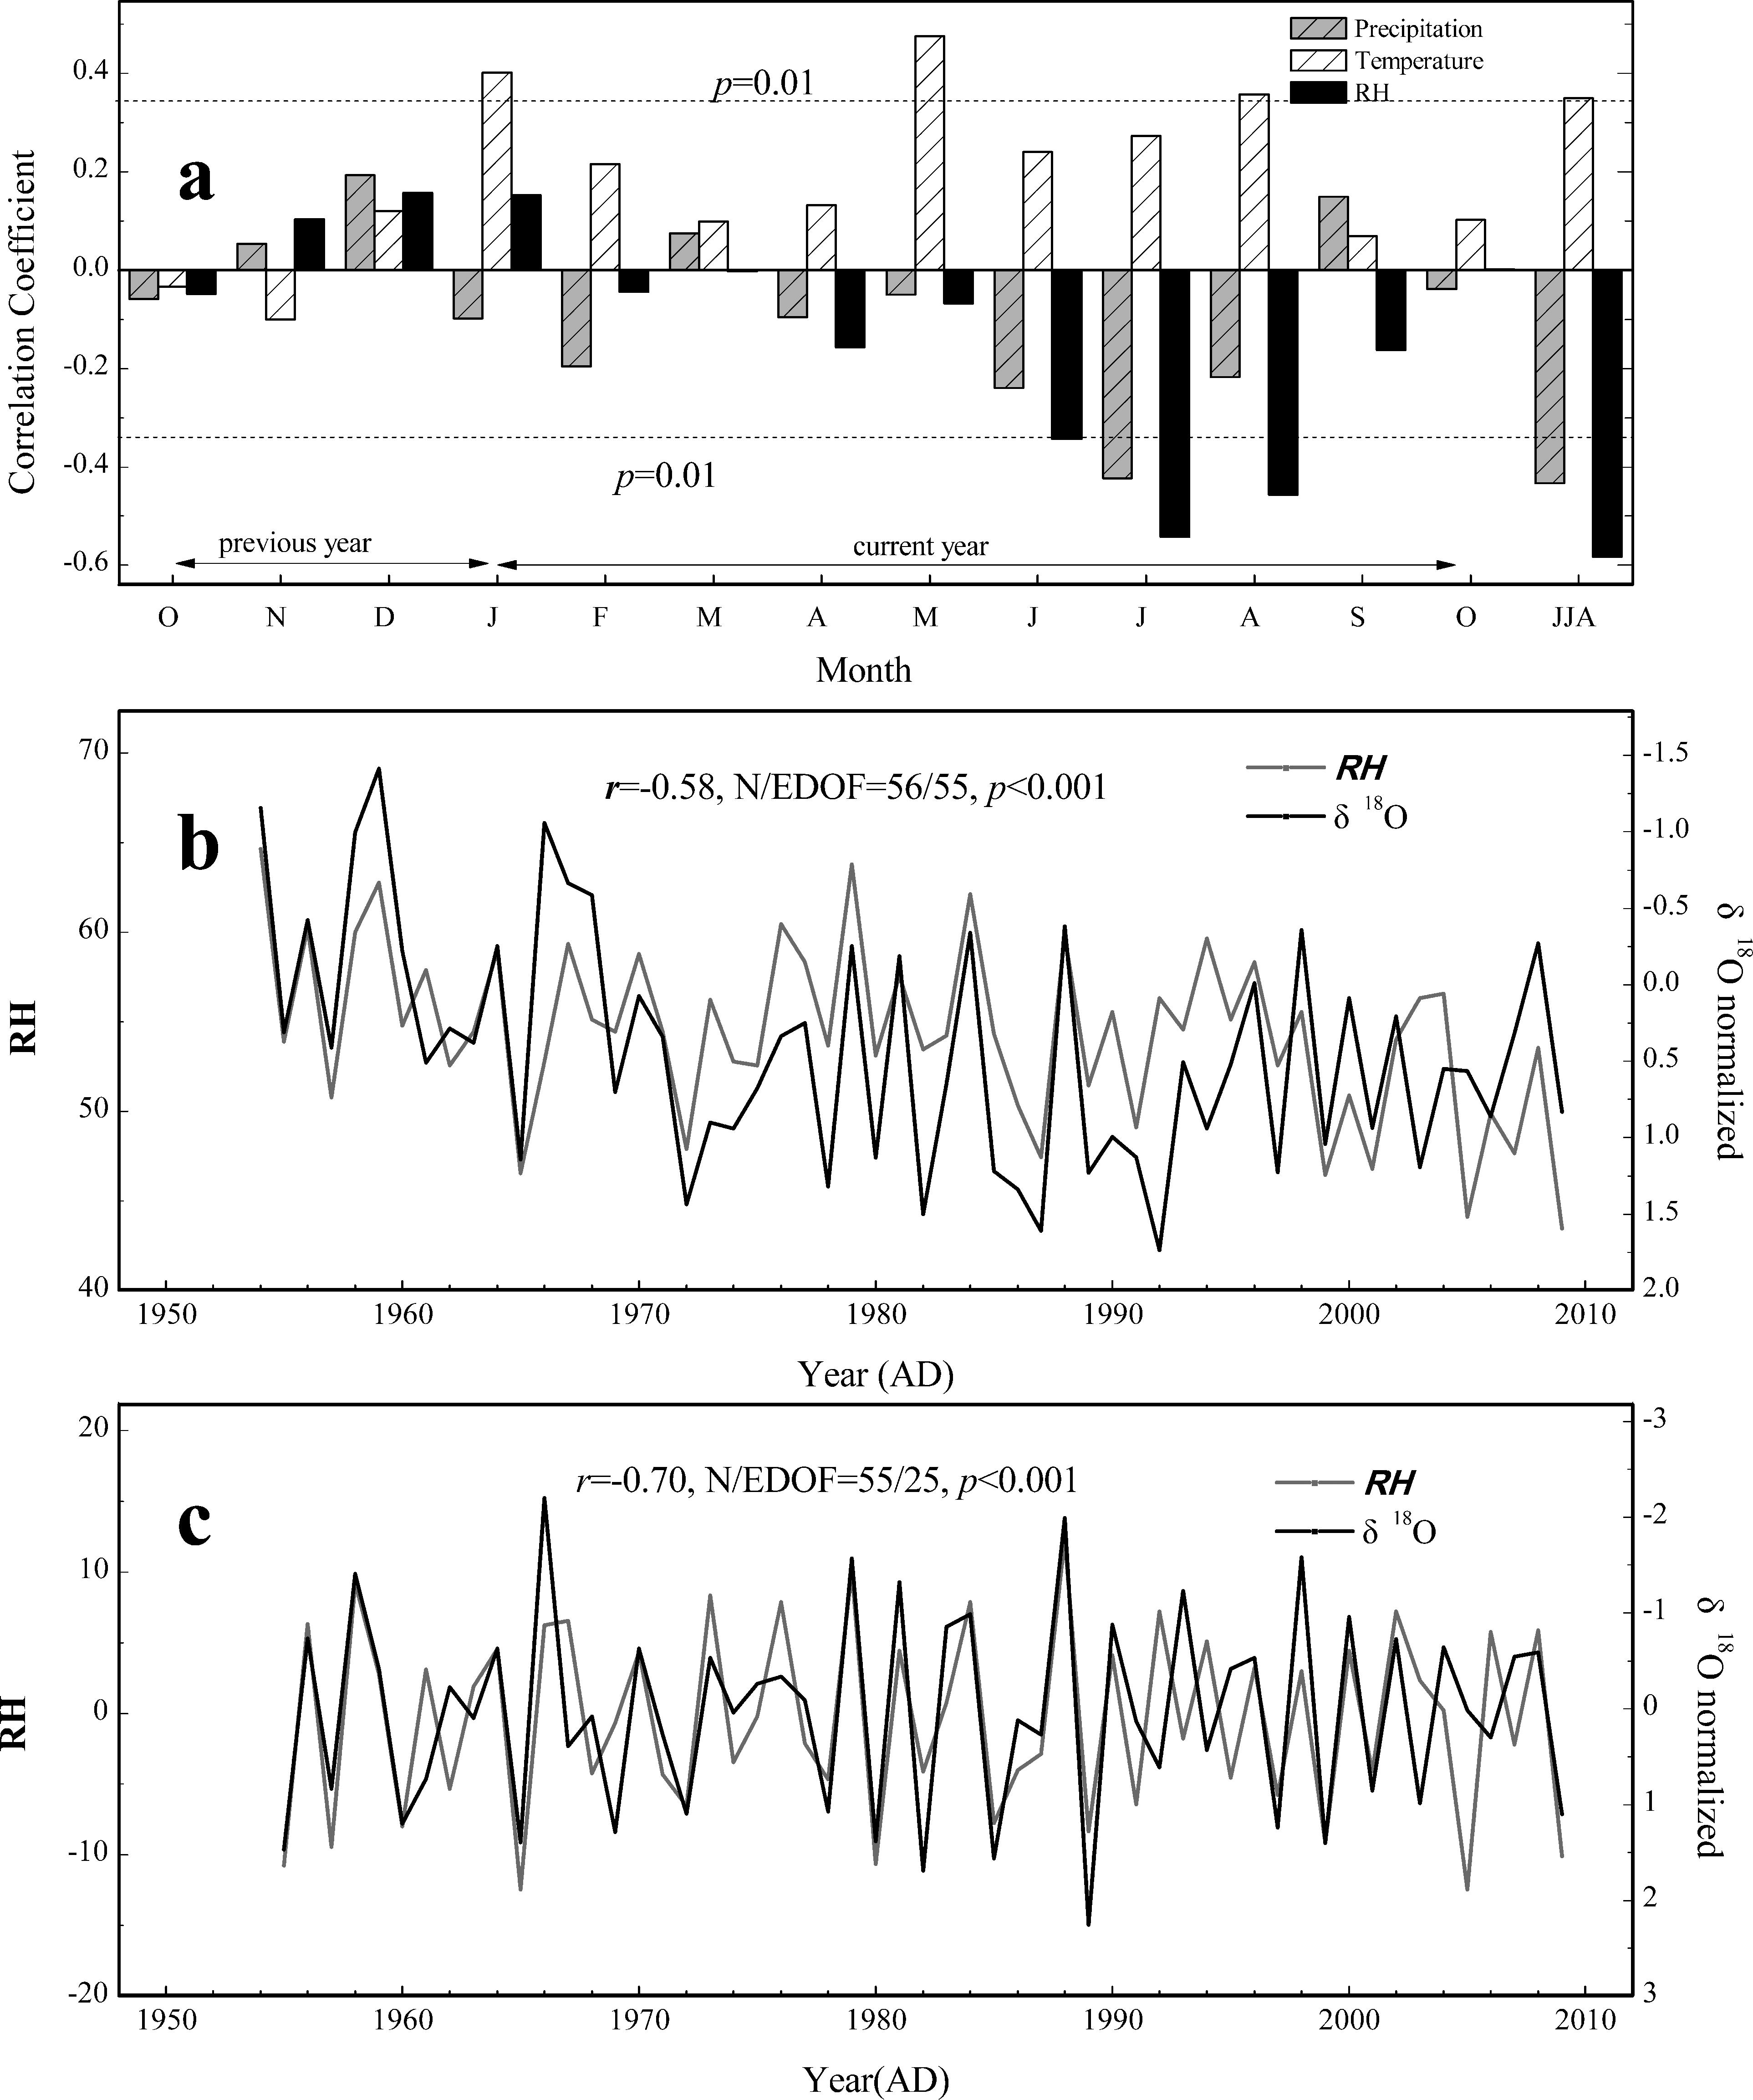
Fig. 5.
Correlations and comparisons between the δ18OTR record and climate factors. (a) The correlations between the δ18OTR series and the climate factors during 1954–2009 AD; (b) The comparison of the original data between the δ18OTR series and RHJJA. (c) The comparison of the first-order data between the δ18OTR series and RHJJA.
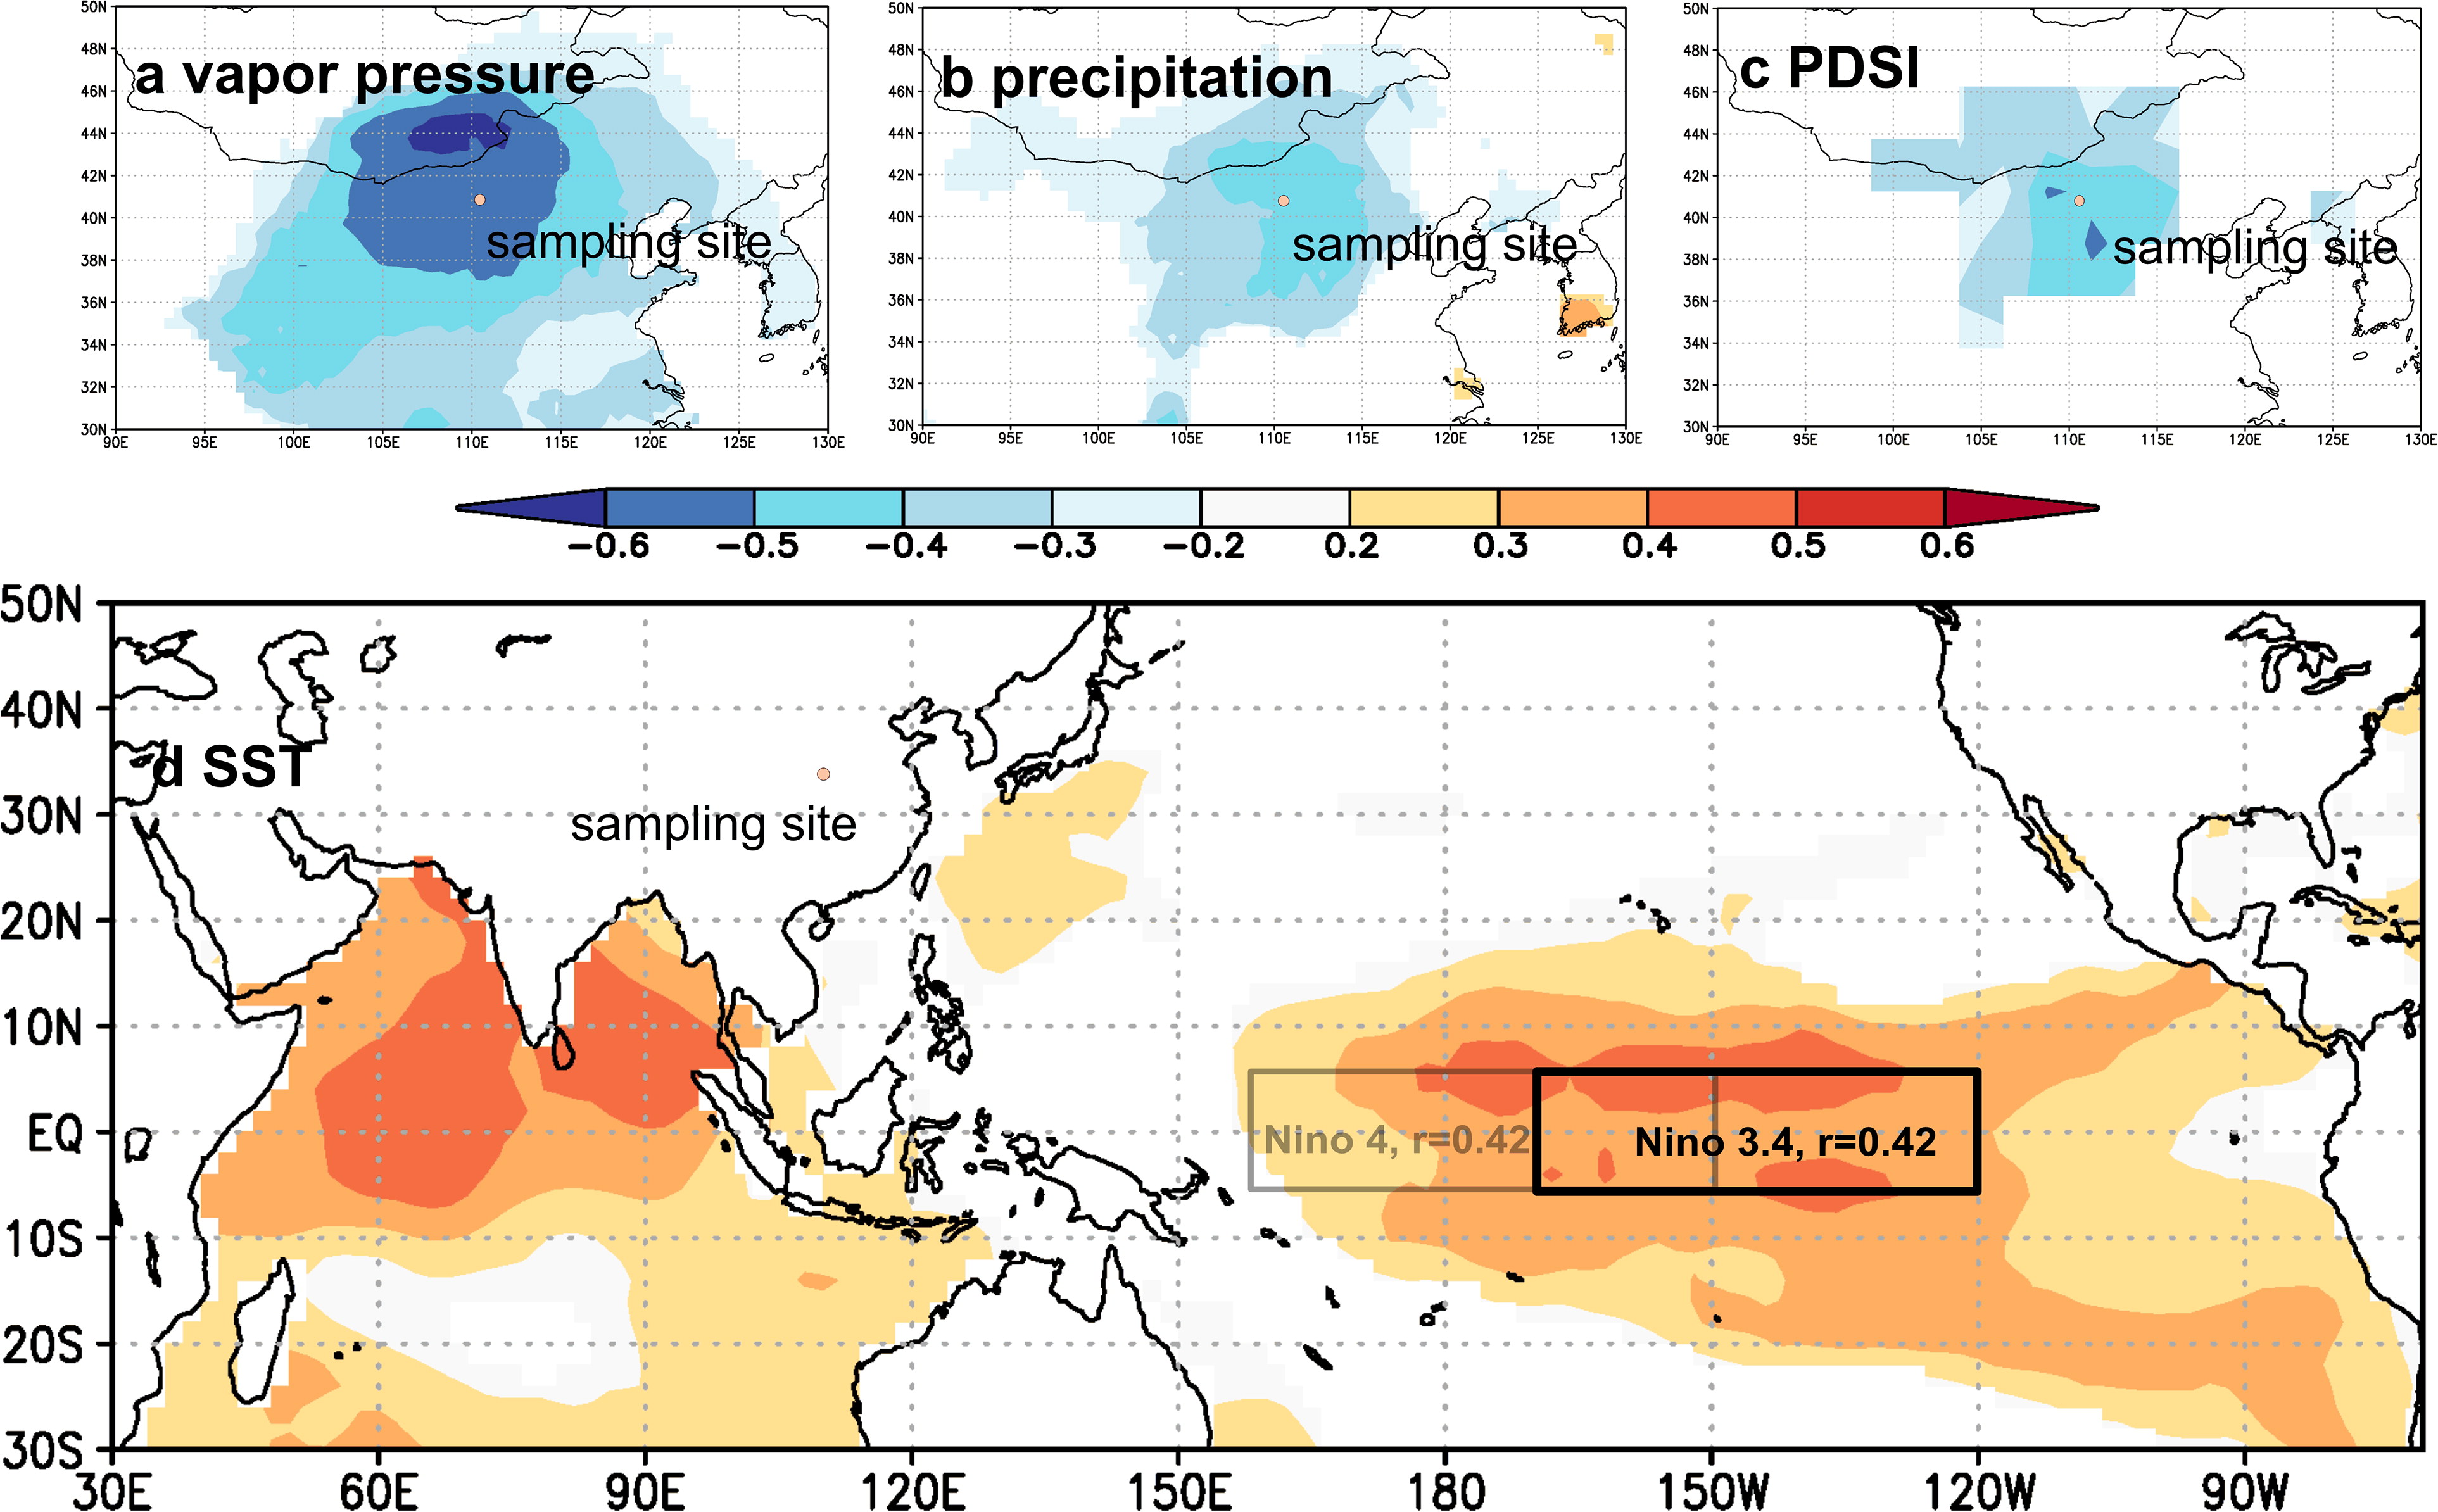
Fig. 6.
Spatial correlations of the δ18OTR record with (a) the vapour pressure (CRU TS4.03) from 1950 to 2009 AD; (b) precipitation (CRU TS4.03) from 1950 to 2009 AD; (c) scPDSI (UCAR) from 1950 to 2009 AD; (d) SST (ERSST dataset) from 1854 to 2009 AD. The black and grey rectangles denote the Niño 3.4 and Niño 4 regions, respectively, and the correlation coefficients with the δ18OTR record are both indicated. The sampling site is illustrated with a red dot. All with p values < 0.1.
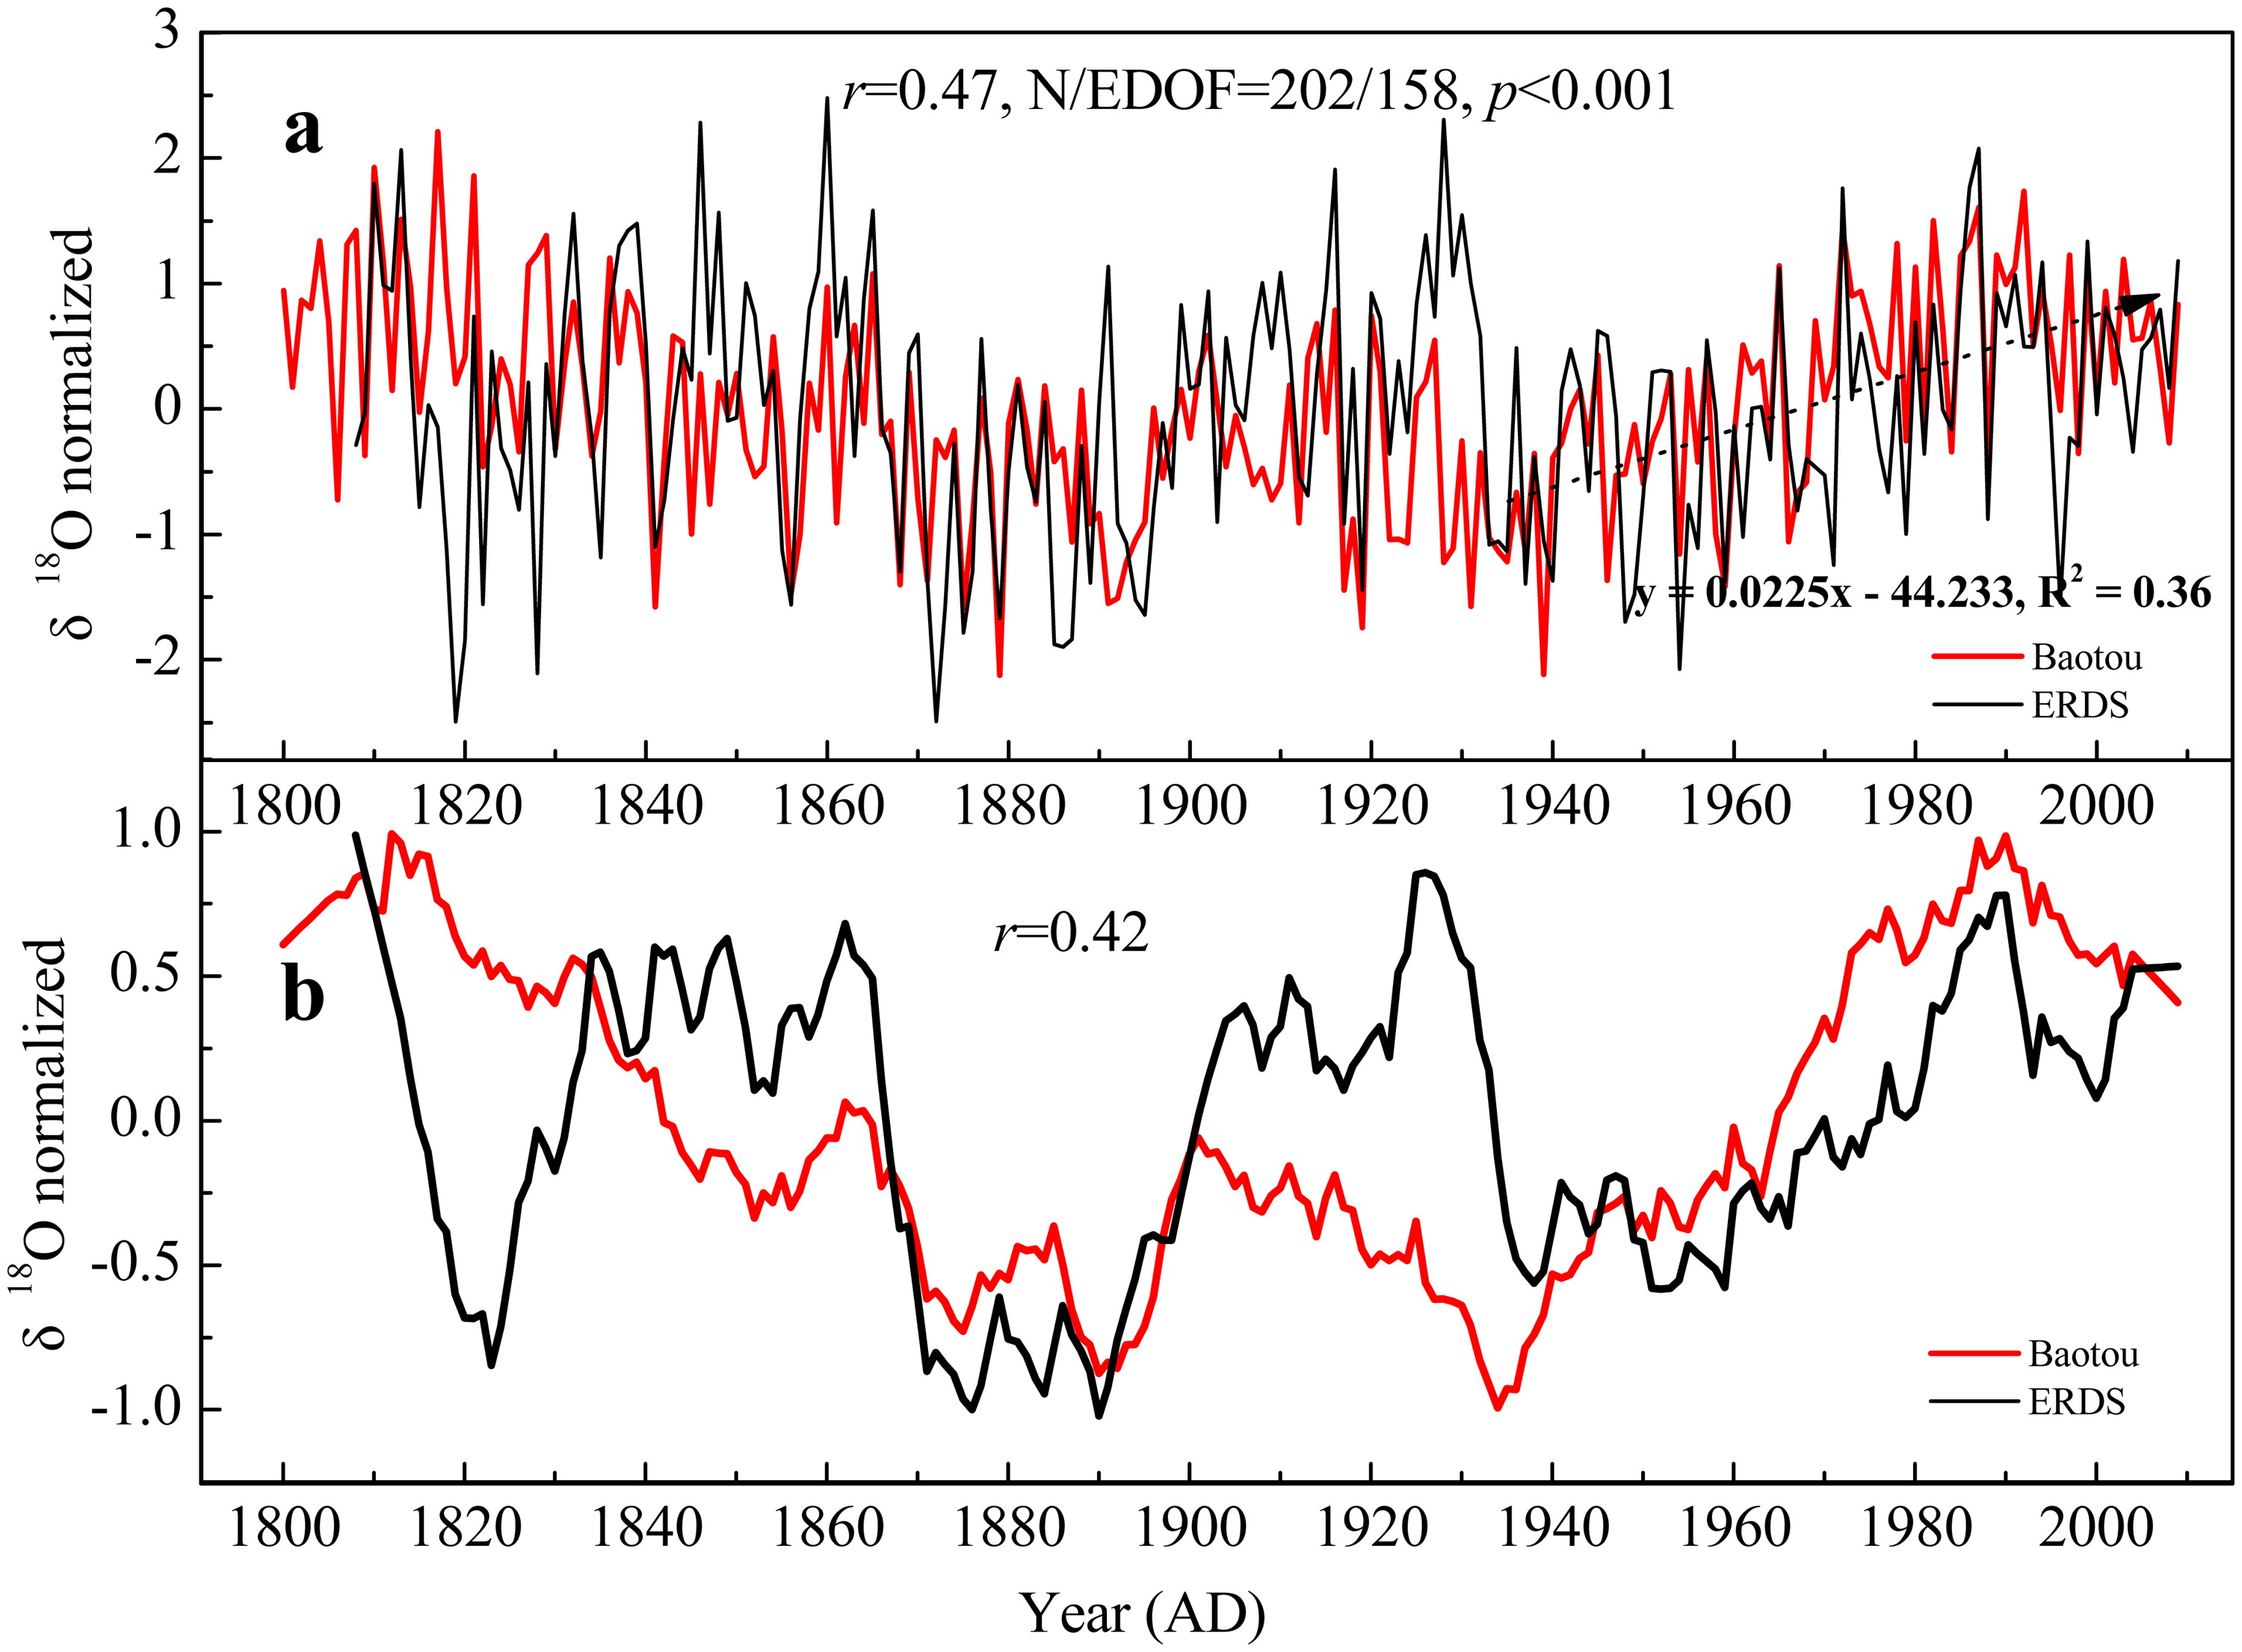
Fig. 7.
Comparison of the δ18OTR records from Baotou and ERDS. (a) The original series of the two records. The δ18OTR record in ERDS (Liu, Wang et al. 2019) was normalised using the same method. The arrow line indicates the significant increasing trend of δ18OTR in Baotou since 1934 (Liu, Liu et al. 2019; Liu, Wang et al. 2019). (b) The 11-year moving averaging series of the two records.
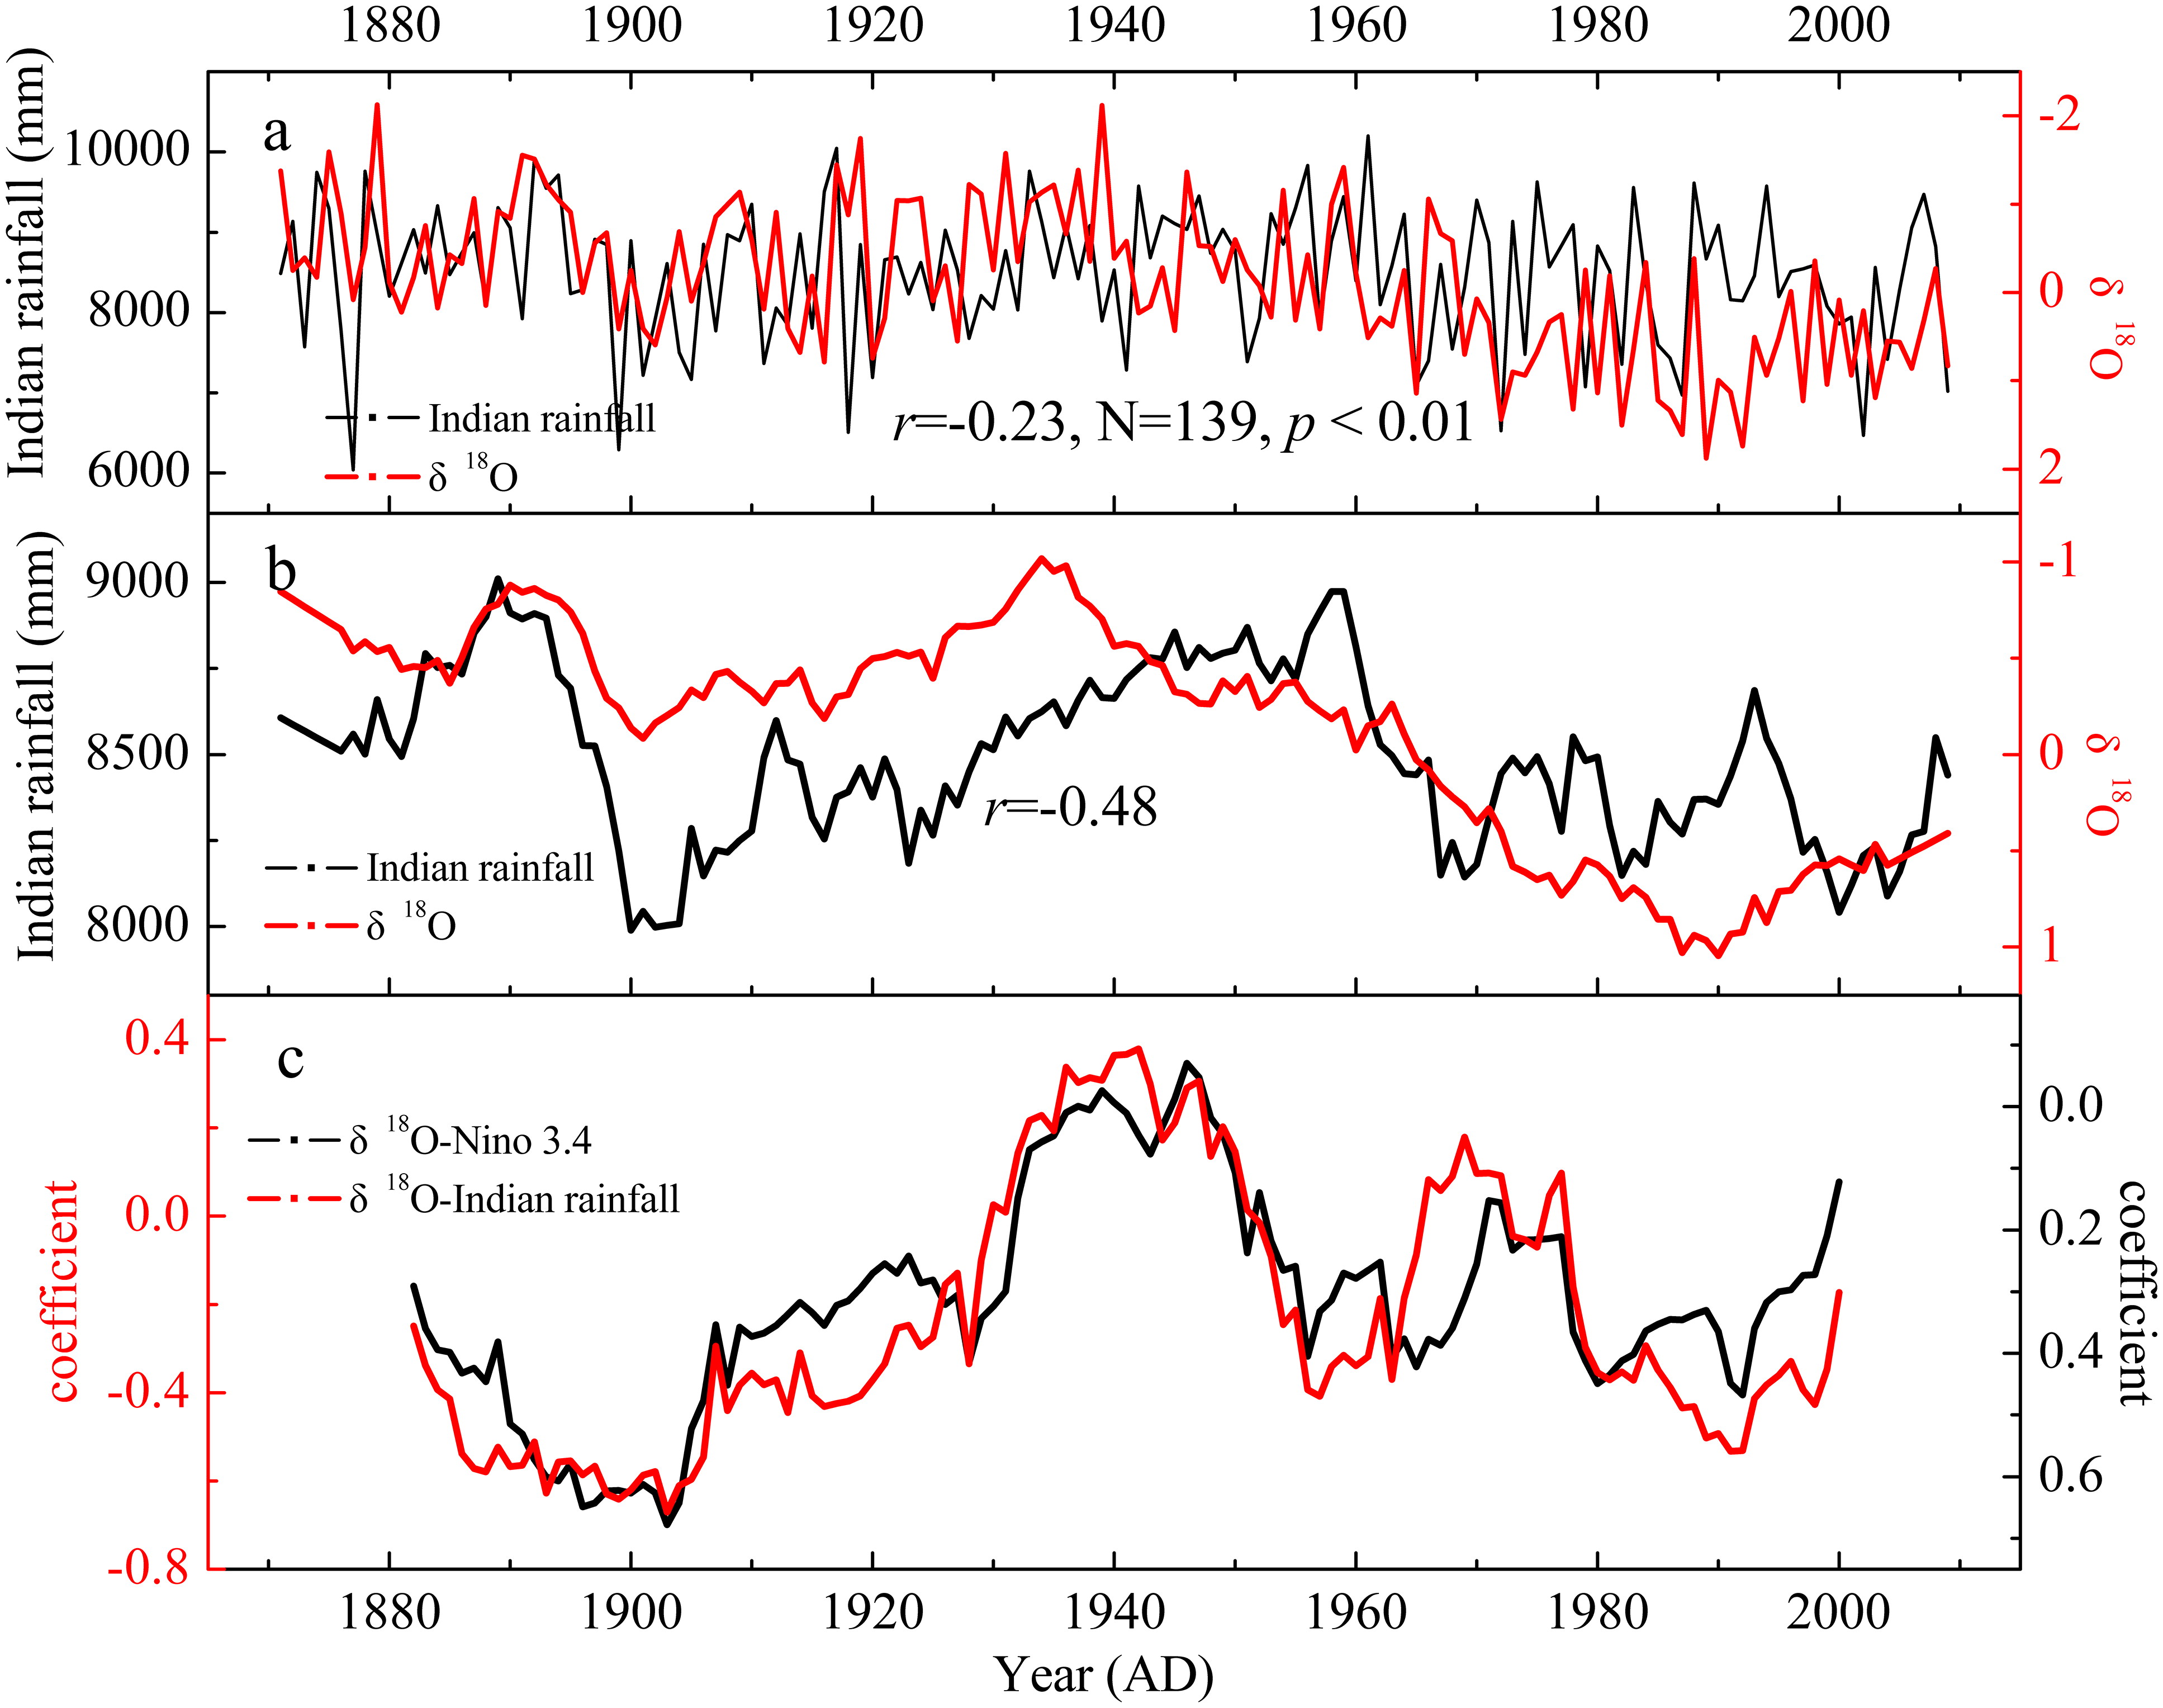
Fig. 8.
The correlations of δ18OTR with the ISM and ENSO. (a) Comparison of the original series between the δ18OTR record in Baotou and all Indian precipitation (JJAS); (b) Comparison of the 21-year moving averaging series between the δ18OTR record in Baotou and the all Indian precipitation (JJAS); (c) The 21-year moving correlations between δ18OTR record in Baotou and the JJA Niño 3.4 index (ERSST), comparing with the 21-year moving correlation of the all Indian precipitation (JJAS). The all Indian precipitation (JJAS) was used to represent the ISM intensity.