
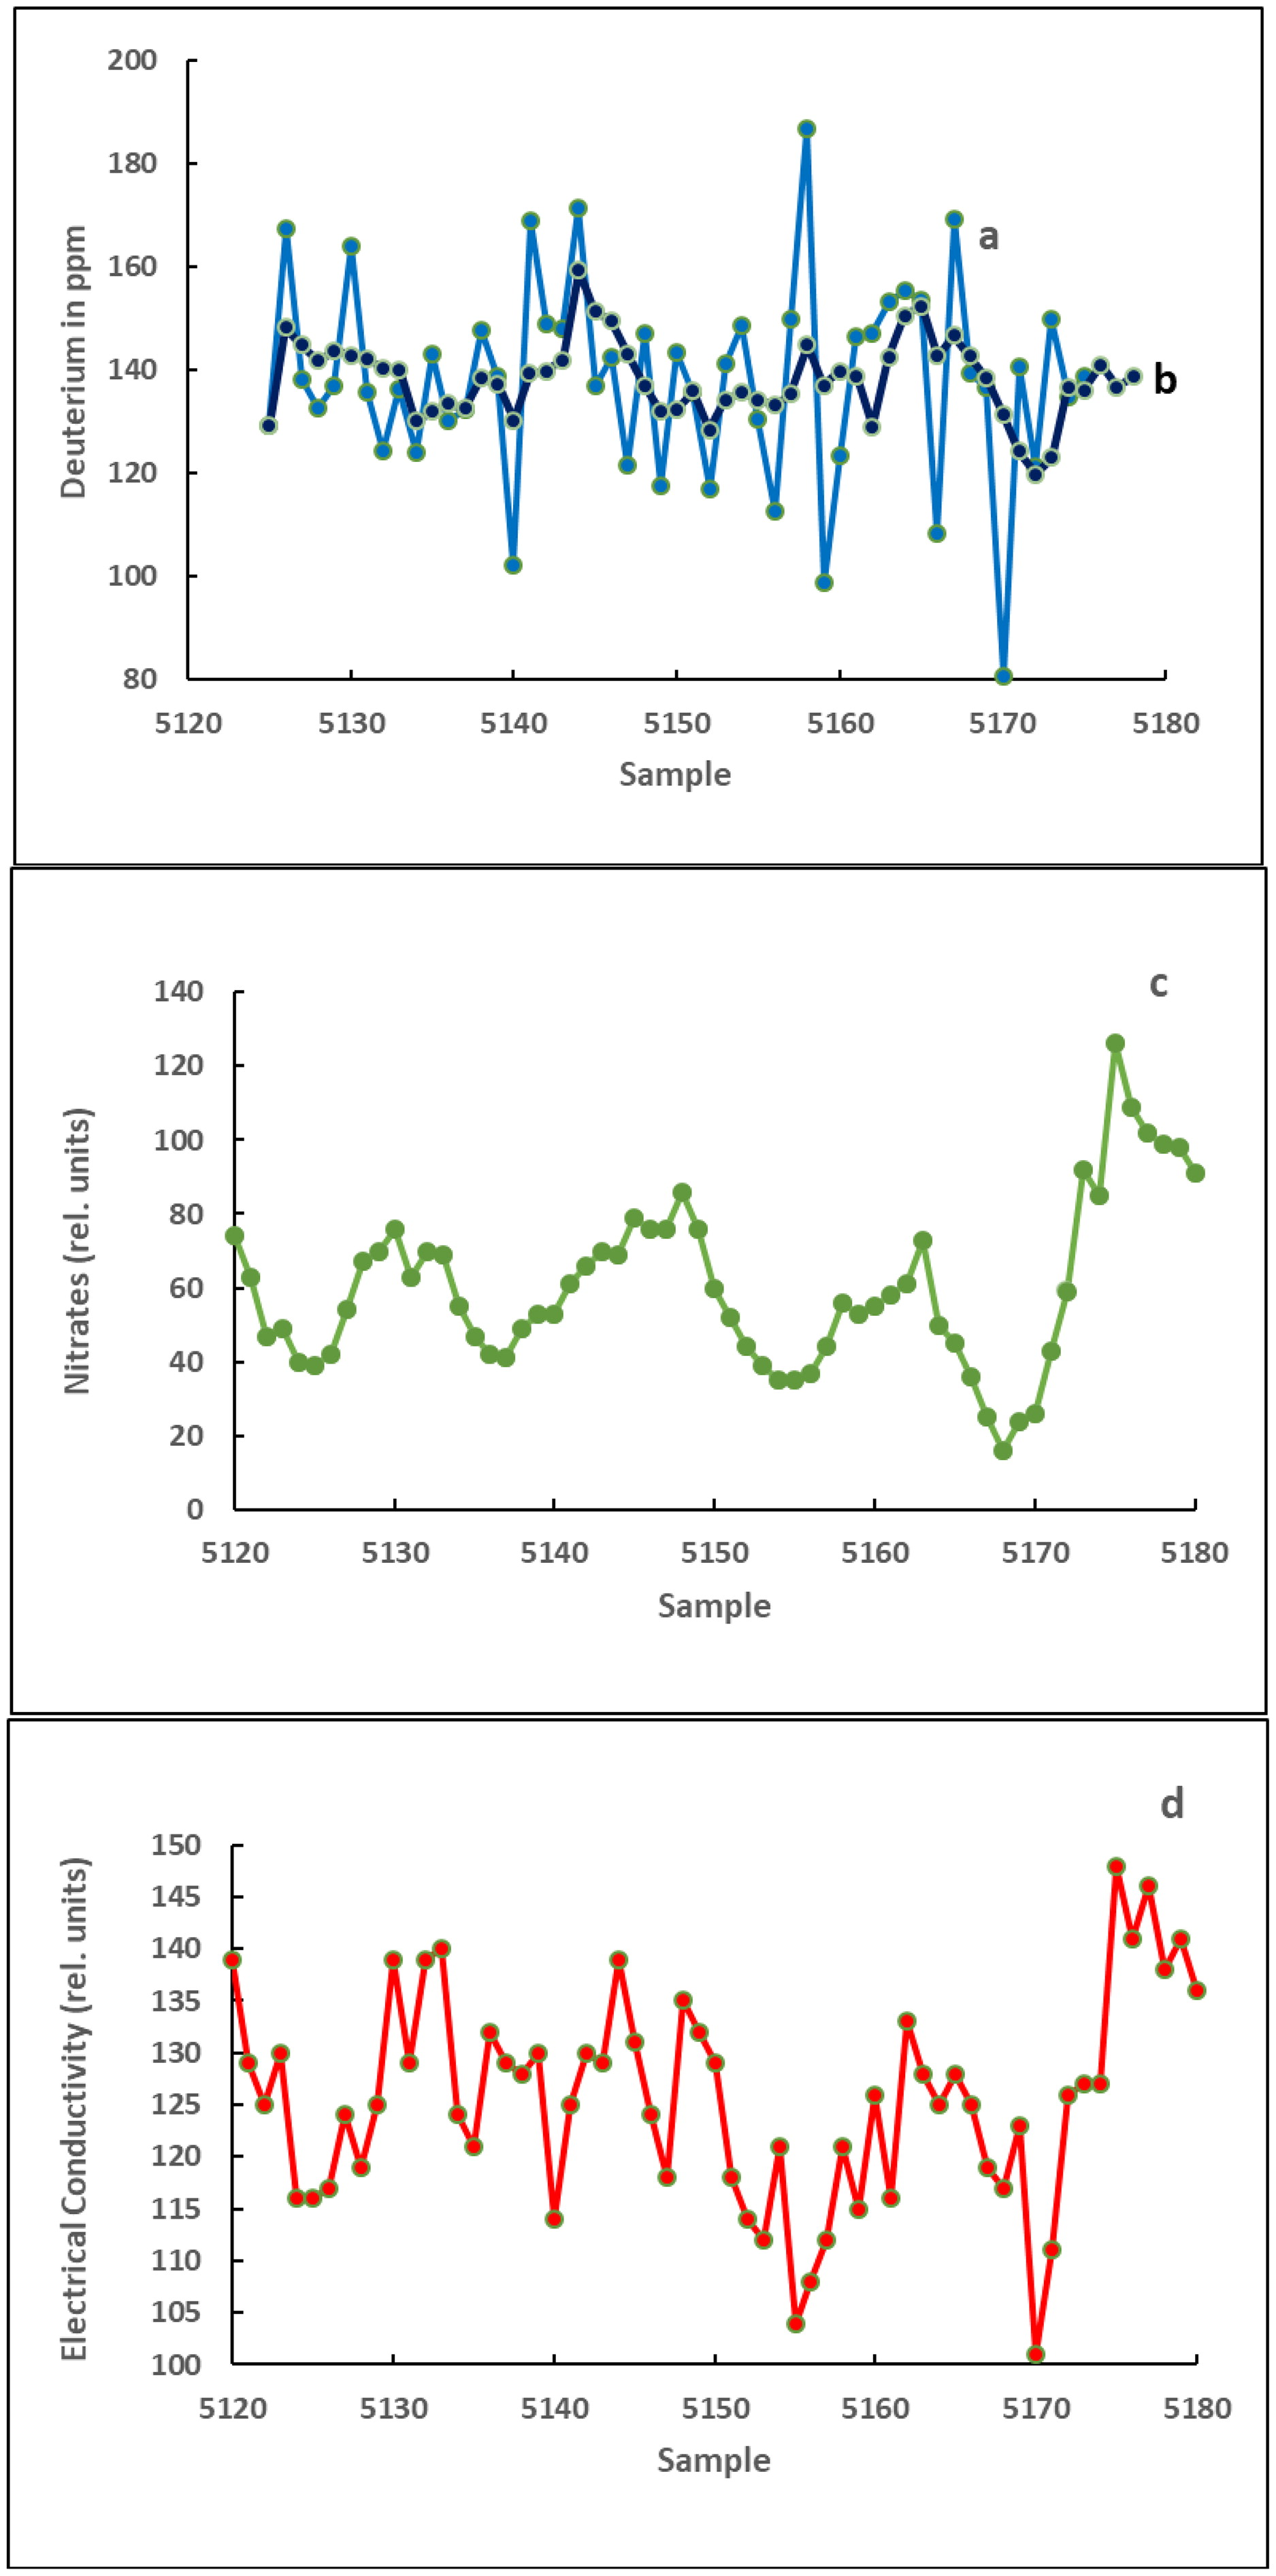
Fig. 1.
The raw data of D/H as deuterium concentrations in ppm are plotted in (a). Superimposed on the D/H data is the three-point moving average (b). Added in the figure are the nitrate concentrations (c) and liquid electrical conductivity (d). All data sets were determined on exactly the same samples. This section of core (sample nos. 5120–5180) represents a depth of about 80.32–81.32 m of a 122-m long core and a total of 7776 samples (Dreschhoff and Zeller, 1994).
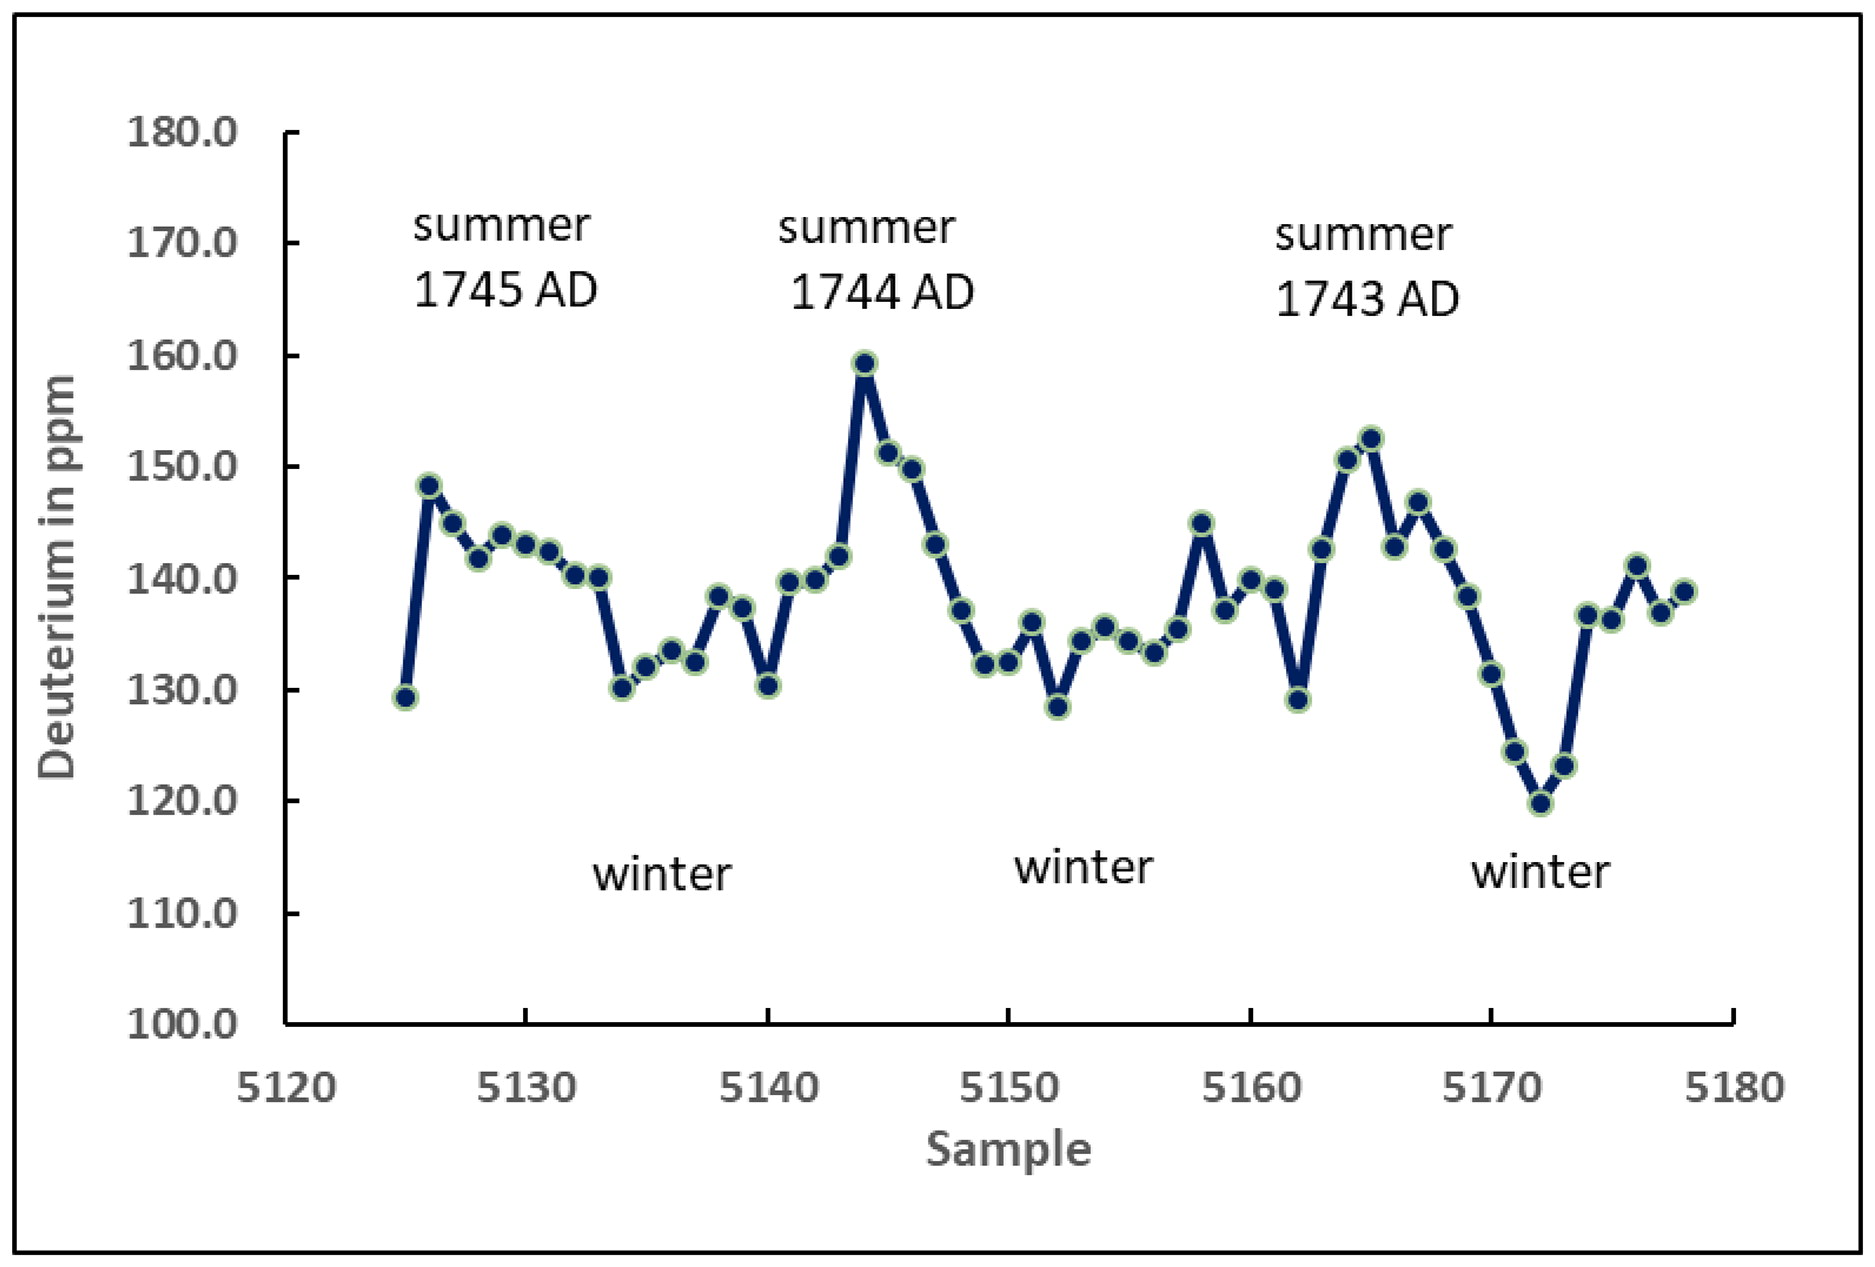
Fig. 2.
The deuterium concentration data are plotted after applying a simple smoothing function (three-point moving average). The assignment of the years is indicated in the plot and is determined from dating the complete core from the surface to the depth of 122 m.