
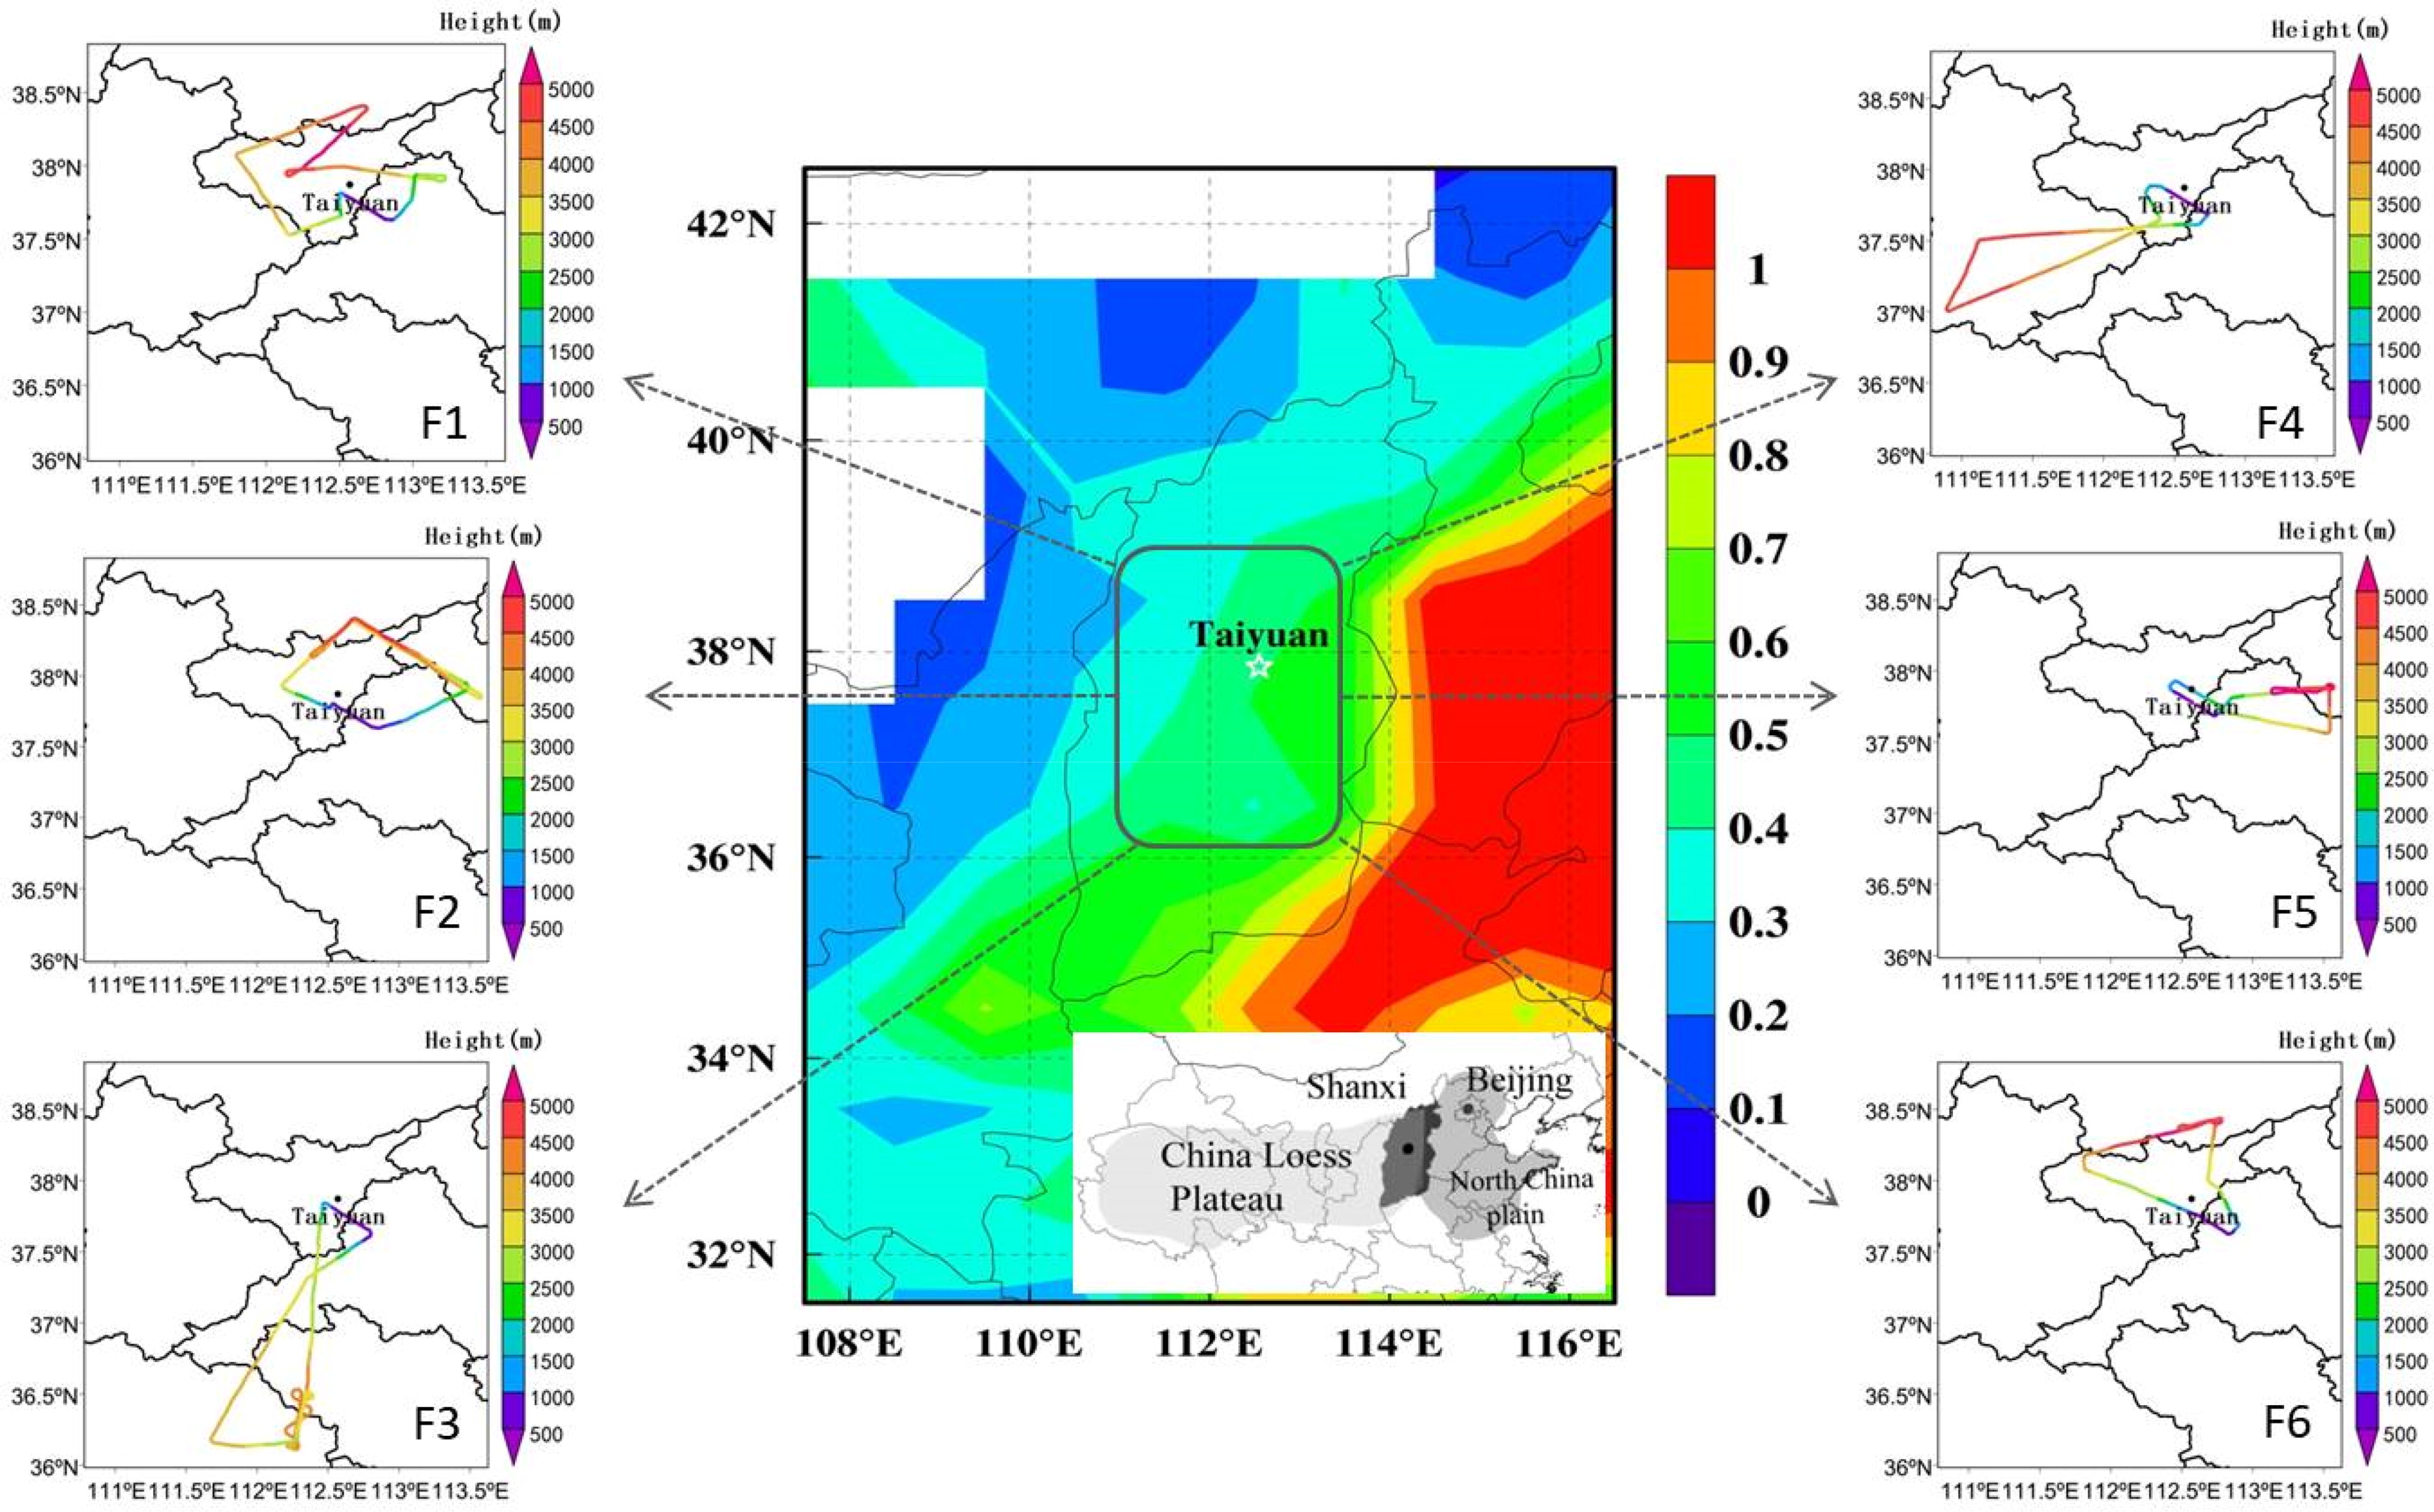
Fig. 1.
Map of Shanxi Province in North China with the six flight tracks. The shaded contour represents the mean distribution of aerosol optical depth during 121–151 days (May 1–May 30) in 2013 obtained from moderate resolution imaging spectroradiometer data, and Taiyuan City is marked with a white star. The inset map shows the location of the observation area in China, and the dark gray-shaded area shows Shanxi Province.
Table 1.
Flight summary (date: yy-mm-dd, time: hh:mm (CST), height: m).
Table 2.
Statistical values of warm clouds and aerosols below and in clouds (height: m, N a: cm−3, N c: cm−3, D c: μm, LWC: g·m−3, STP).
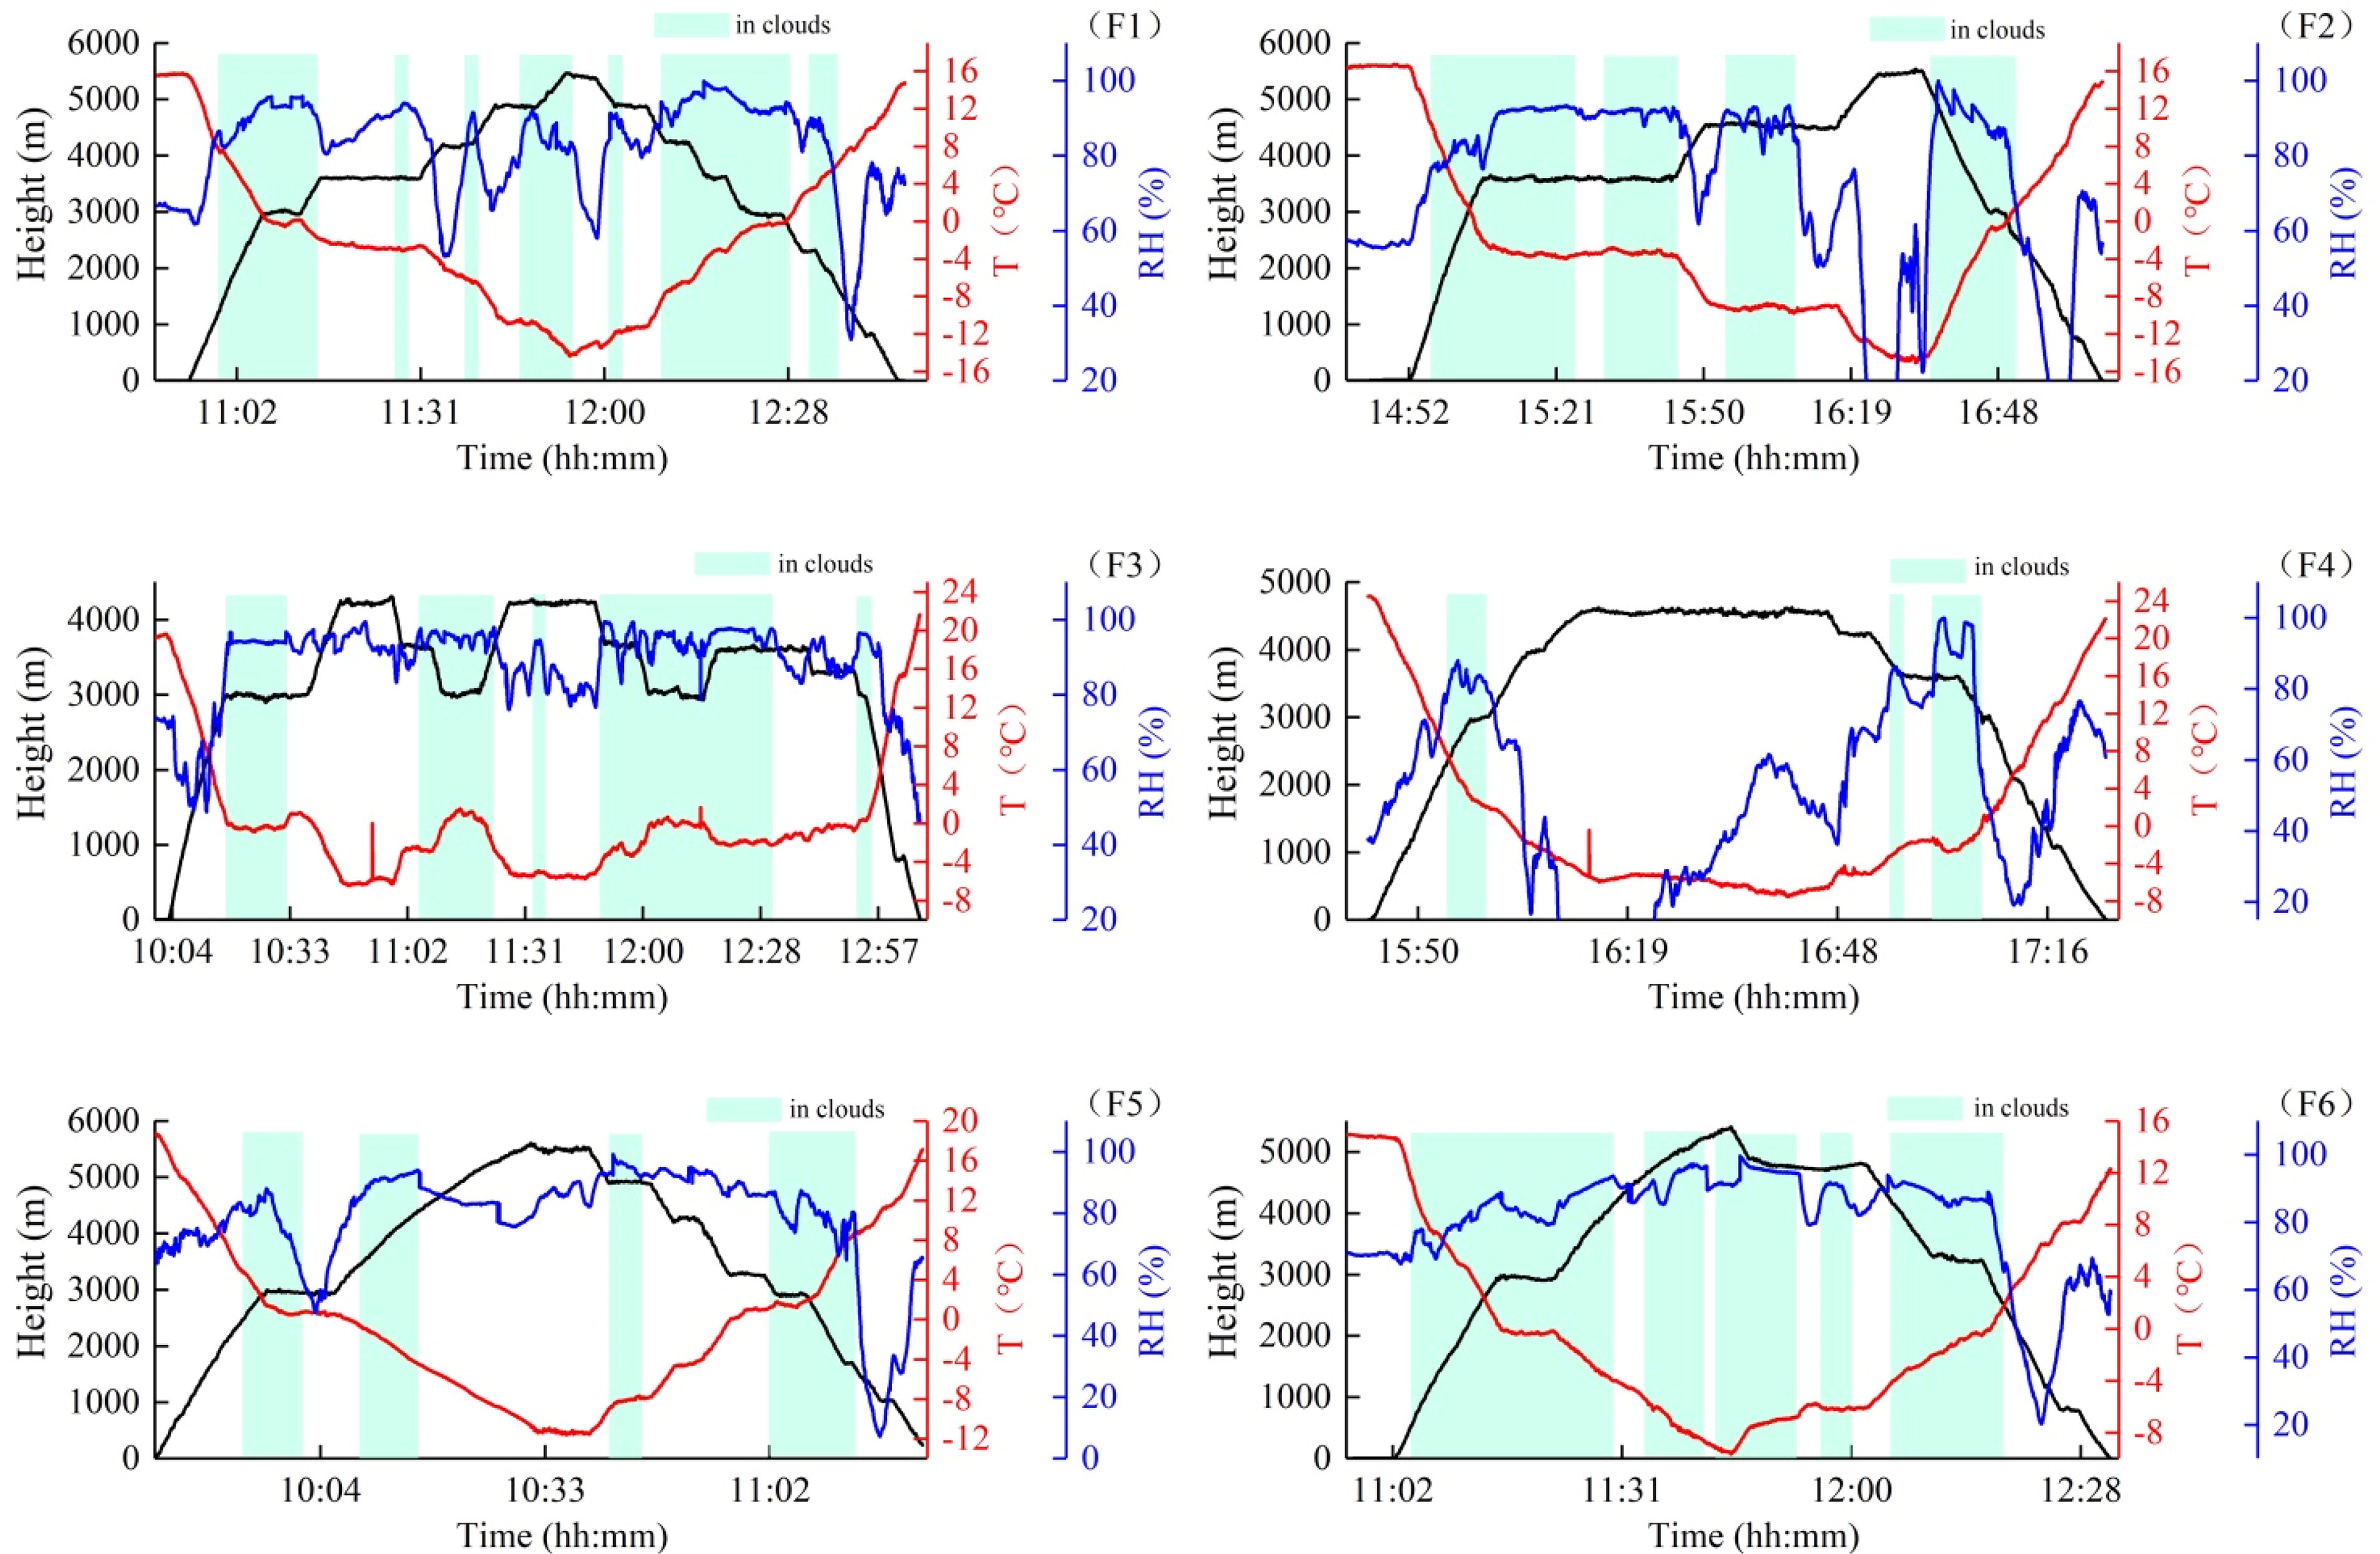
Fig. 2.
Time series of flight height (black line), T (red line), and RH (blue line) from the six aircraft measurements. (The light green shades indicate in clouds data.)
Table 3.
Statistical characteristics of aerosol particles (STP).
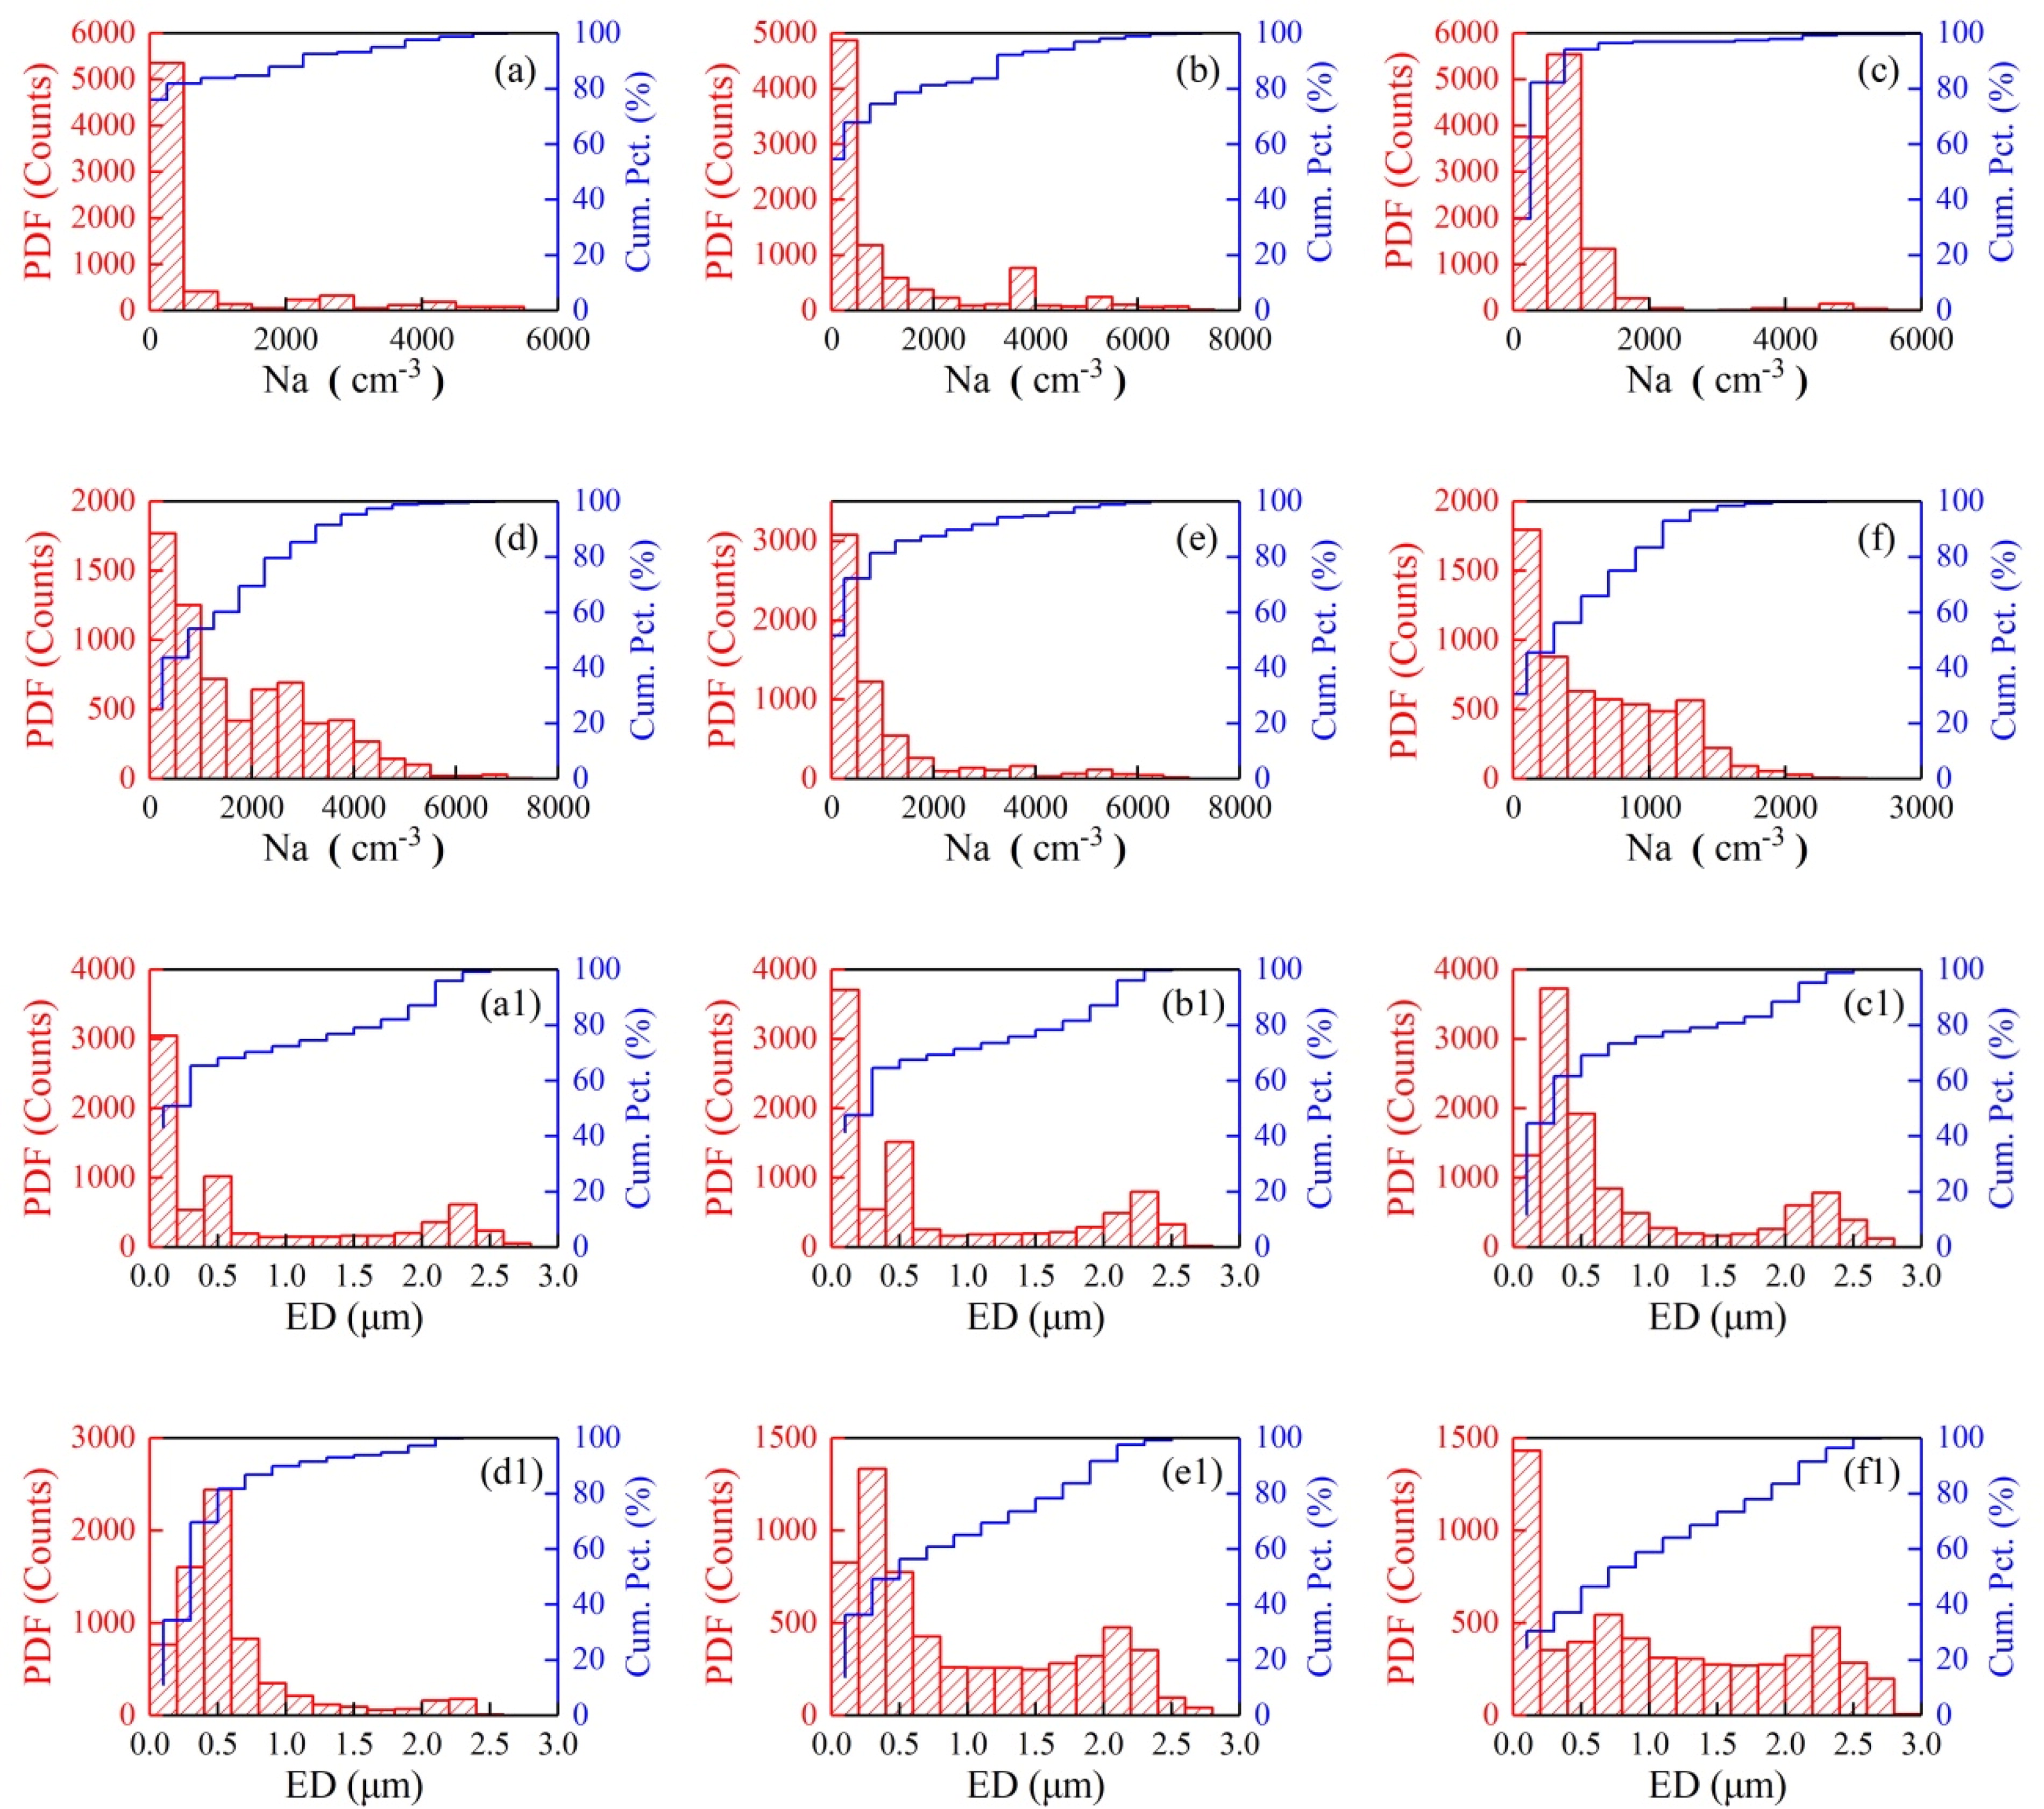
Fig. 3.
The probability distribution function of N a and ED of aerosol particles from the six aircraft measurements.
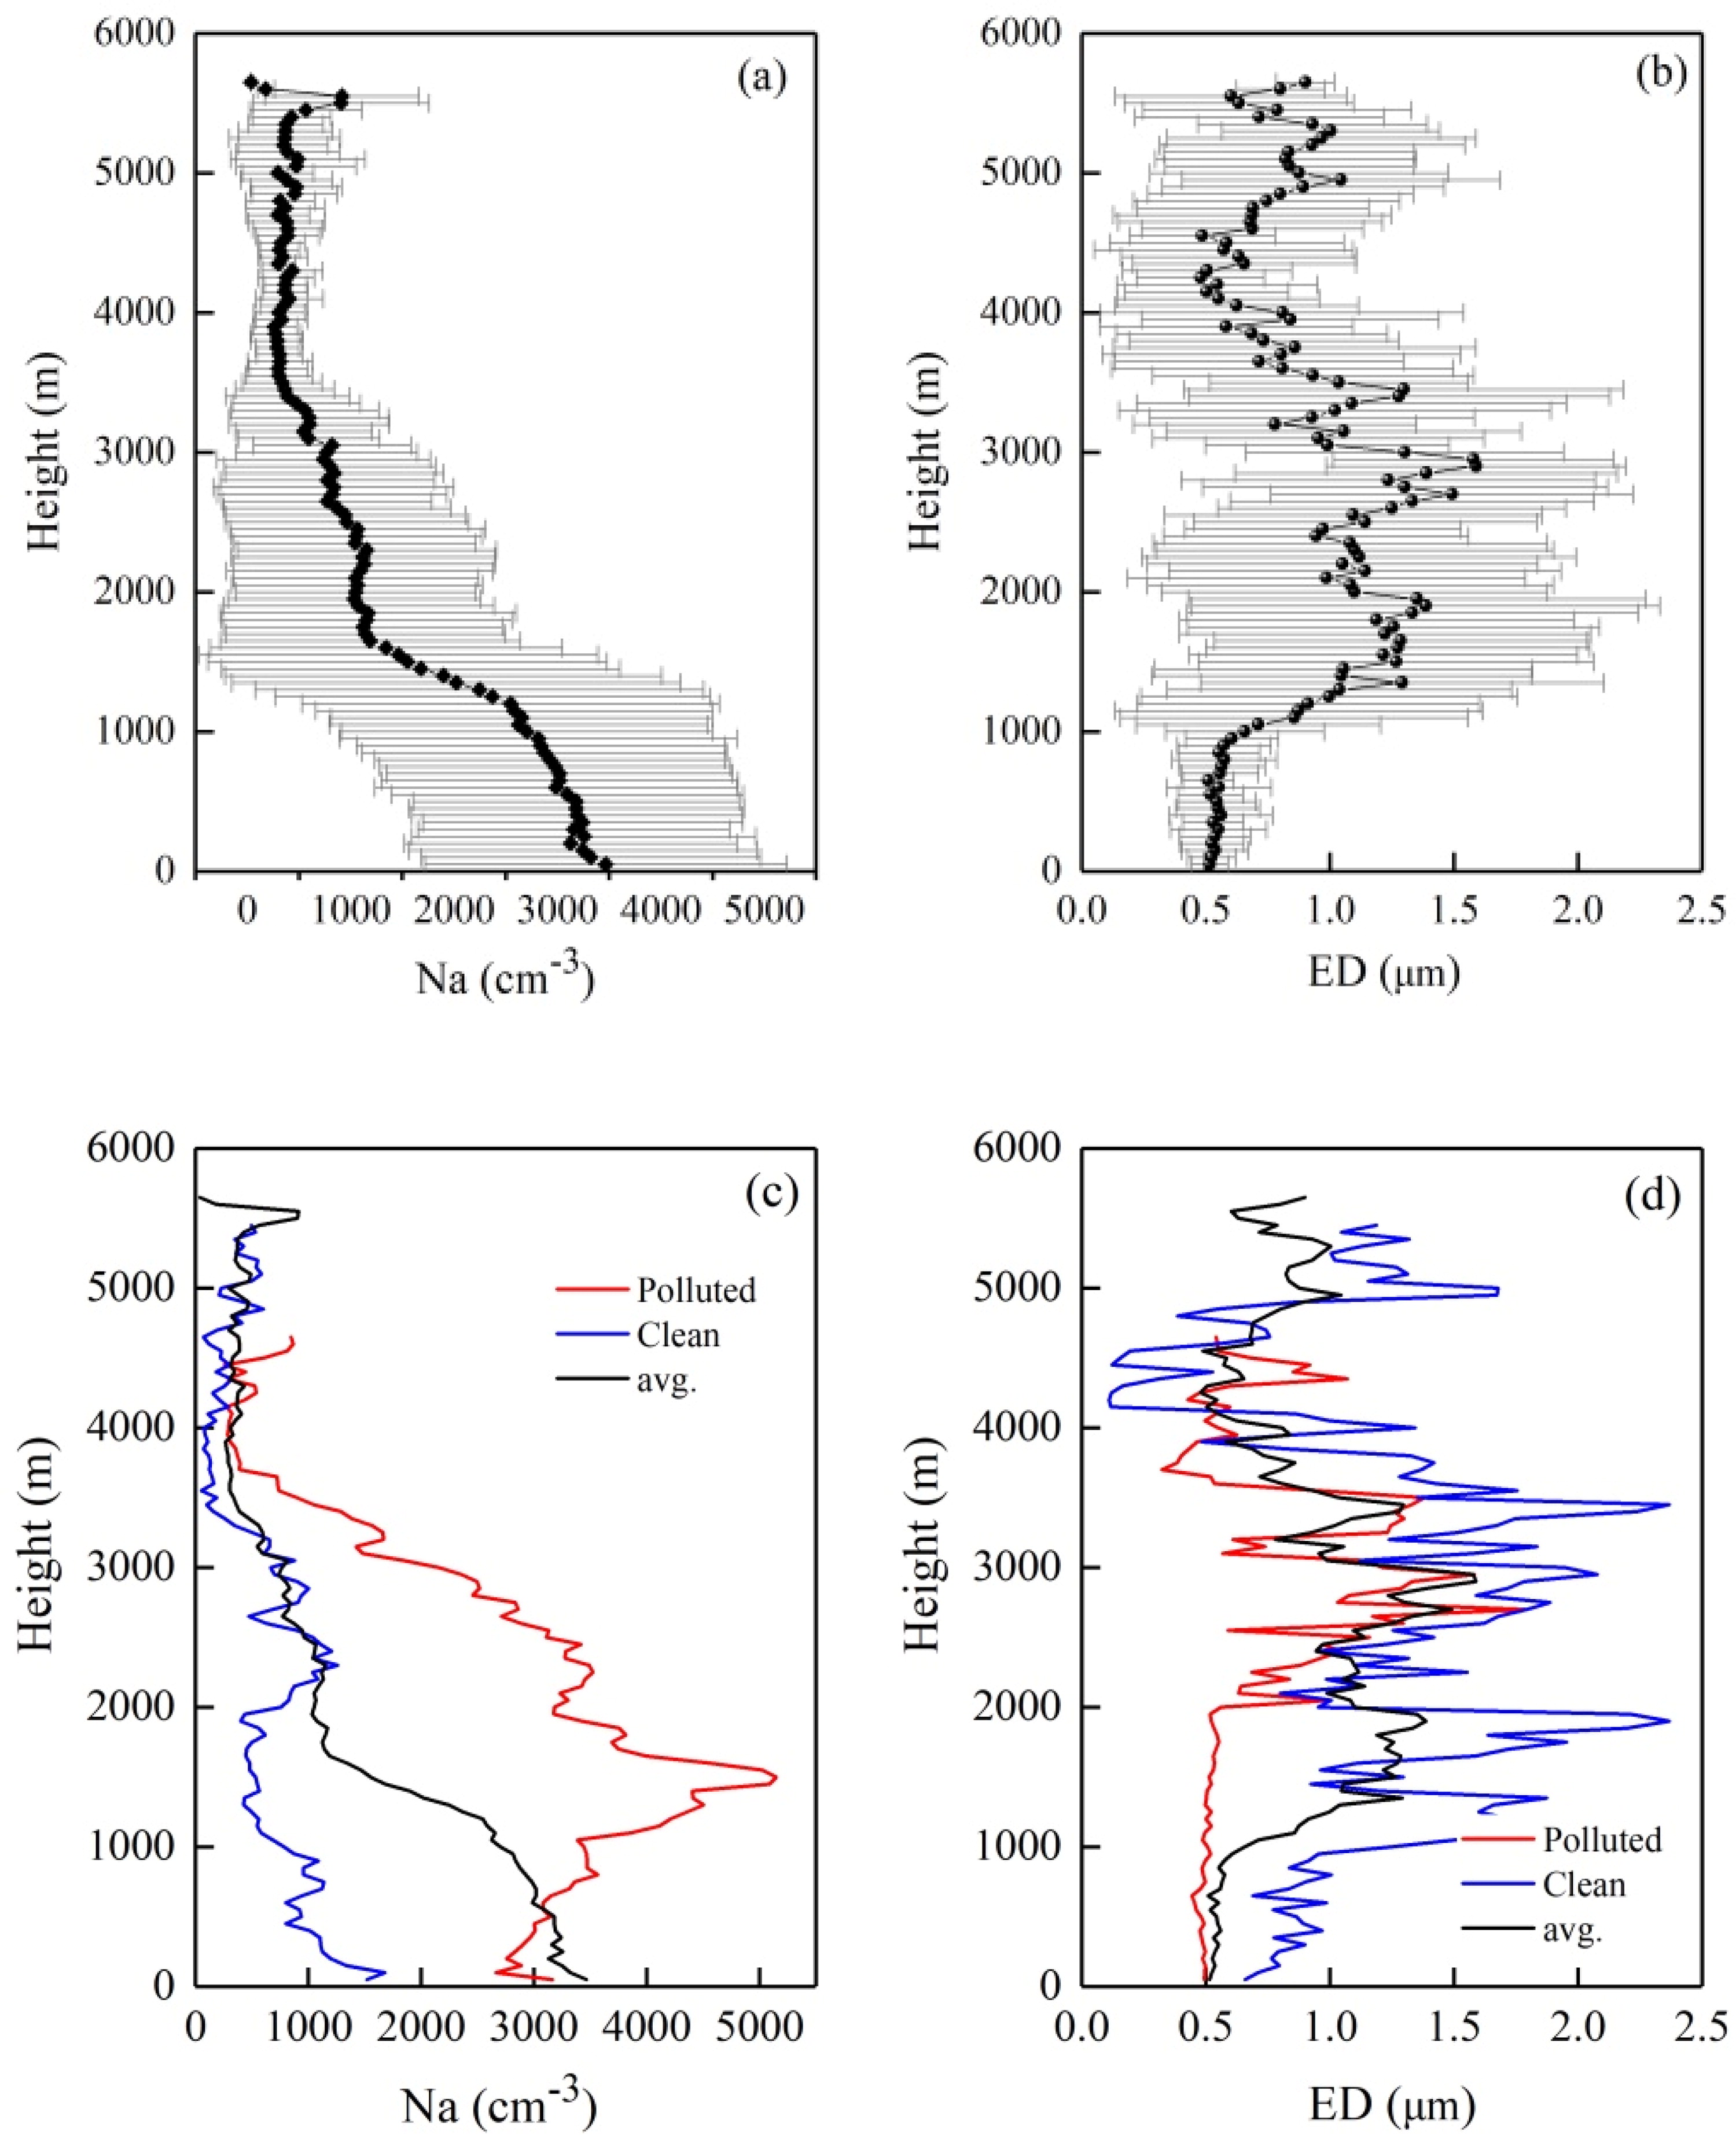
Fig. 4.
Vertical profiles of averaged N a (a) and ED (b) with error bars (standard deviation), and the vertical profiles of N a (c), and ED (d) in relatively clean and polluted weather conditions.
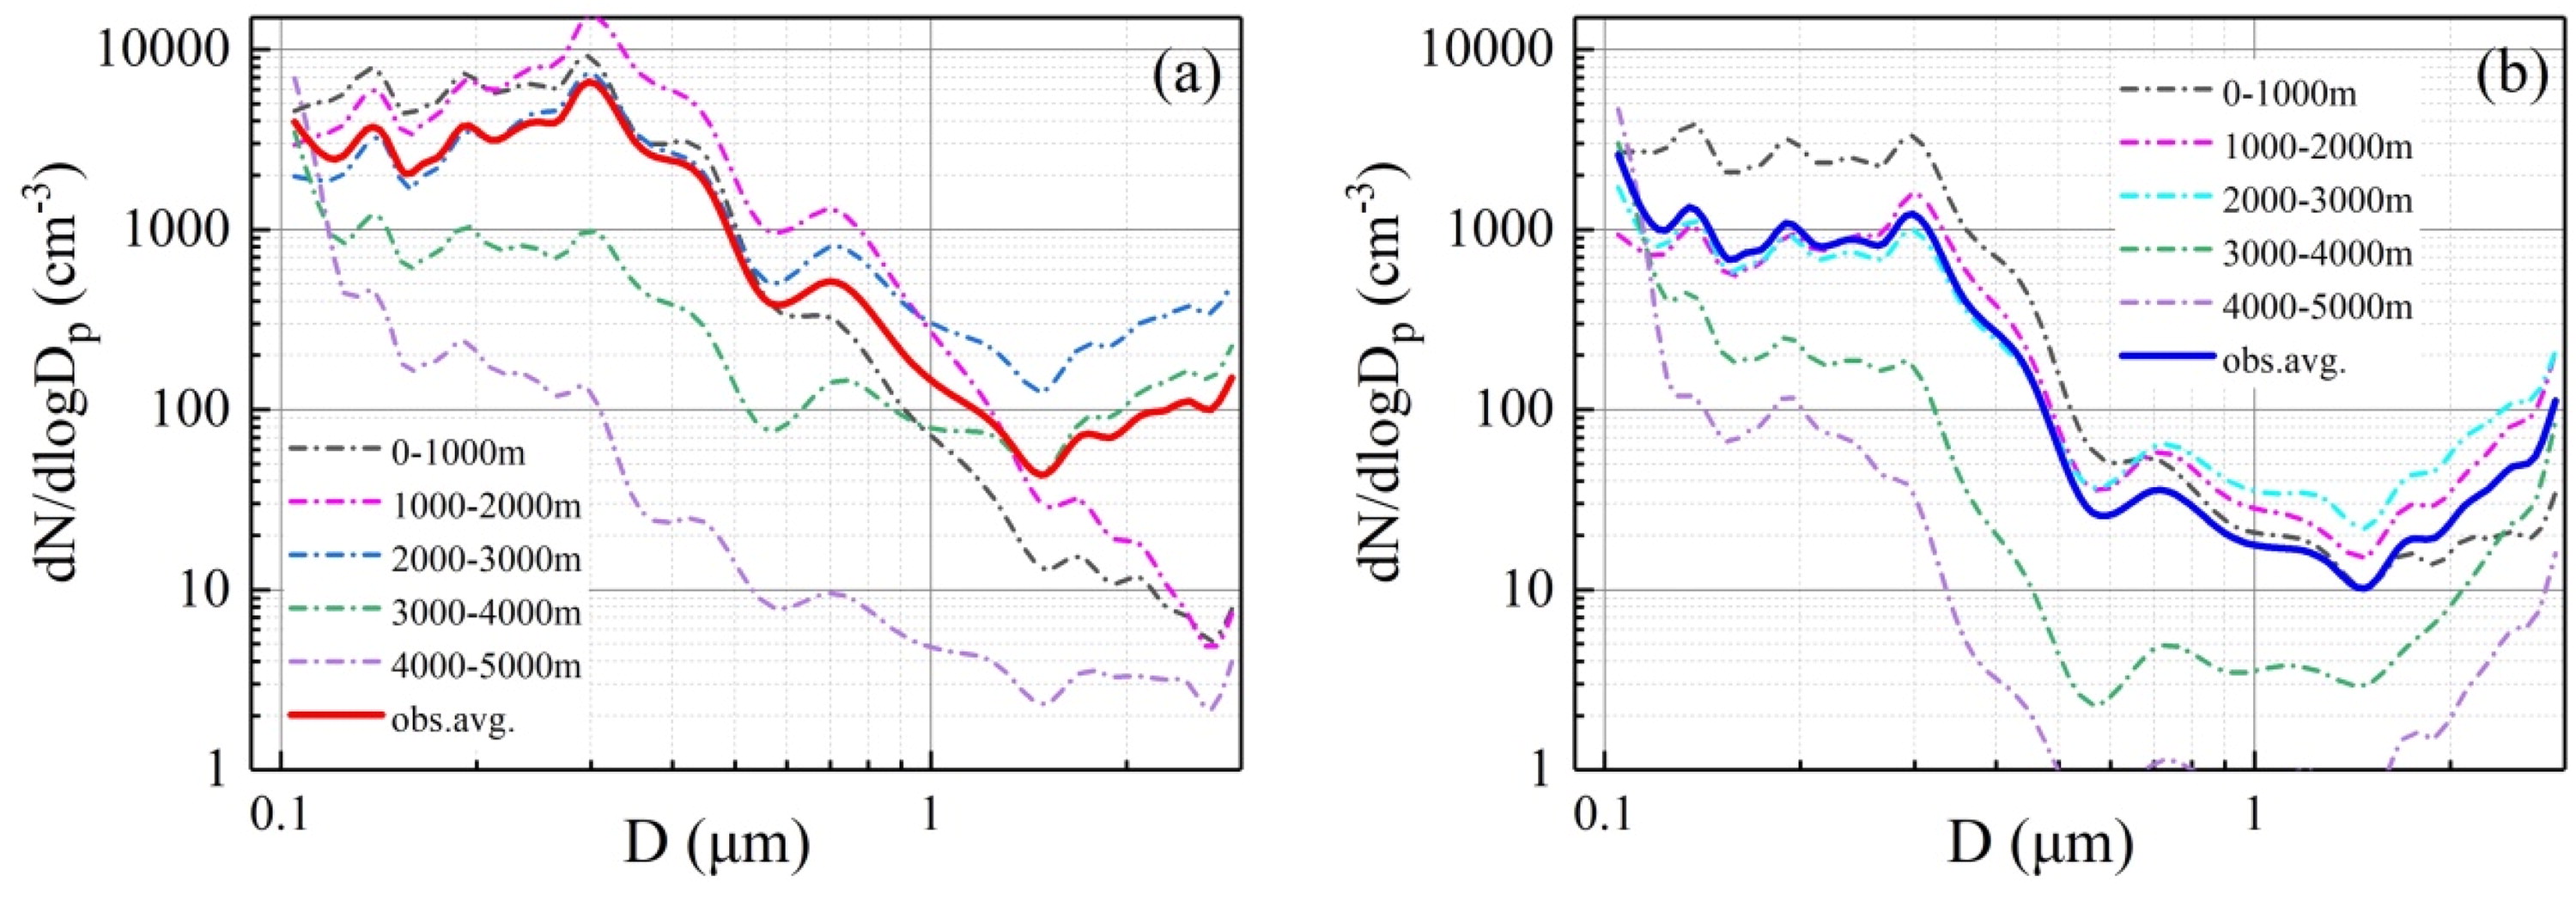
Fig. 5.
Size distributions of aerosol particles on relatively polluted (a) and clean (b) weather conditions. The different coloured dashed lines are the average particle size distributions in different height ranges (0–1000 m, 1000–2000 m, 2000–3000 m, 3000–4000 m, 4000–5000 m), and the think solid red and blue lines show the average particle size distributions from the whole flights of F4 (a) and F6 (b), relatively.
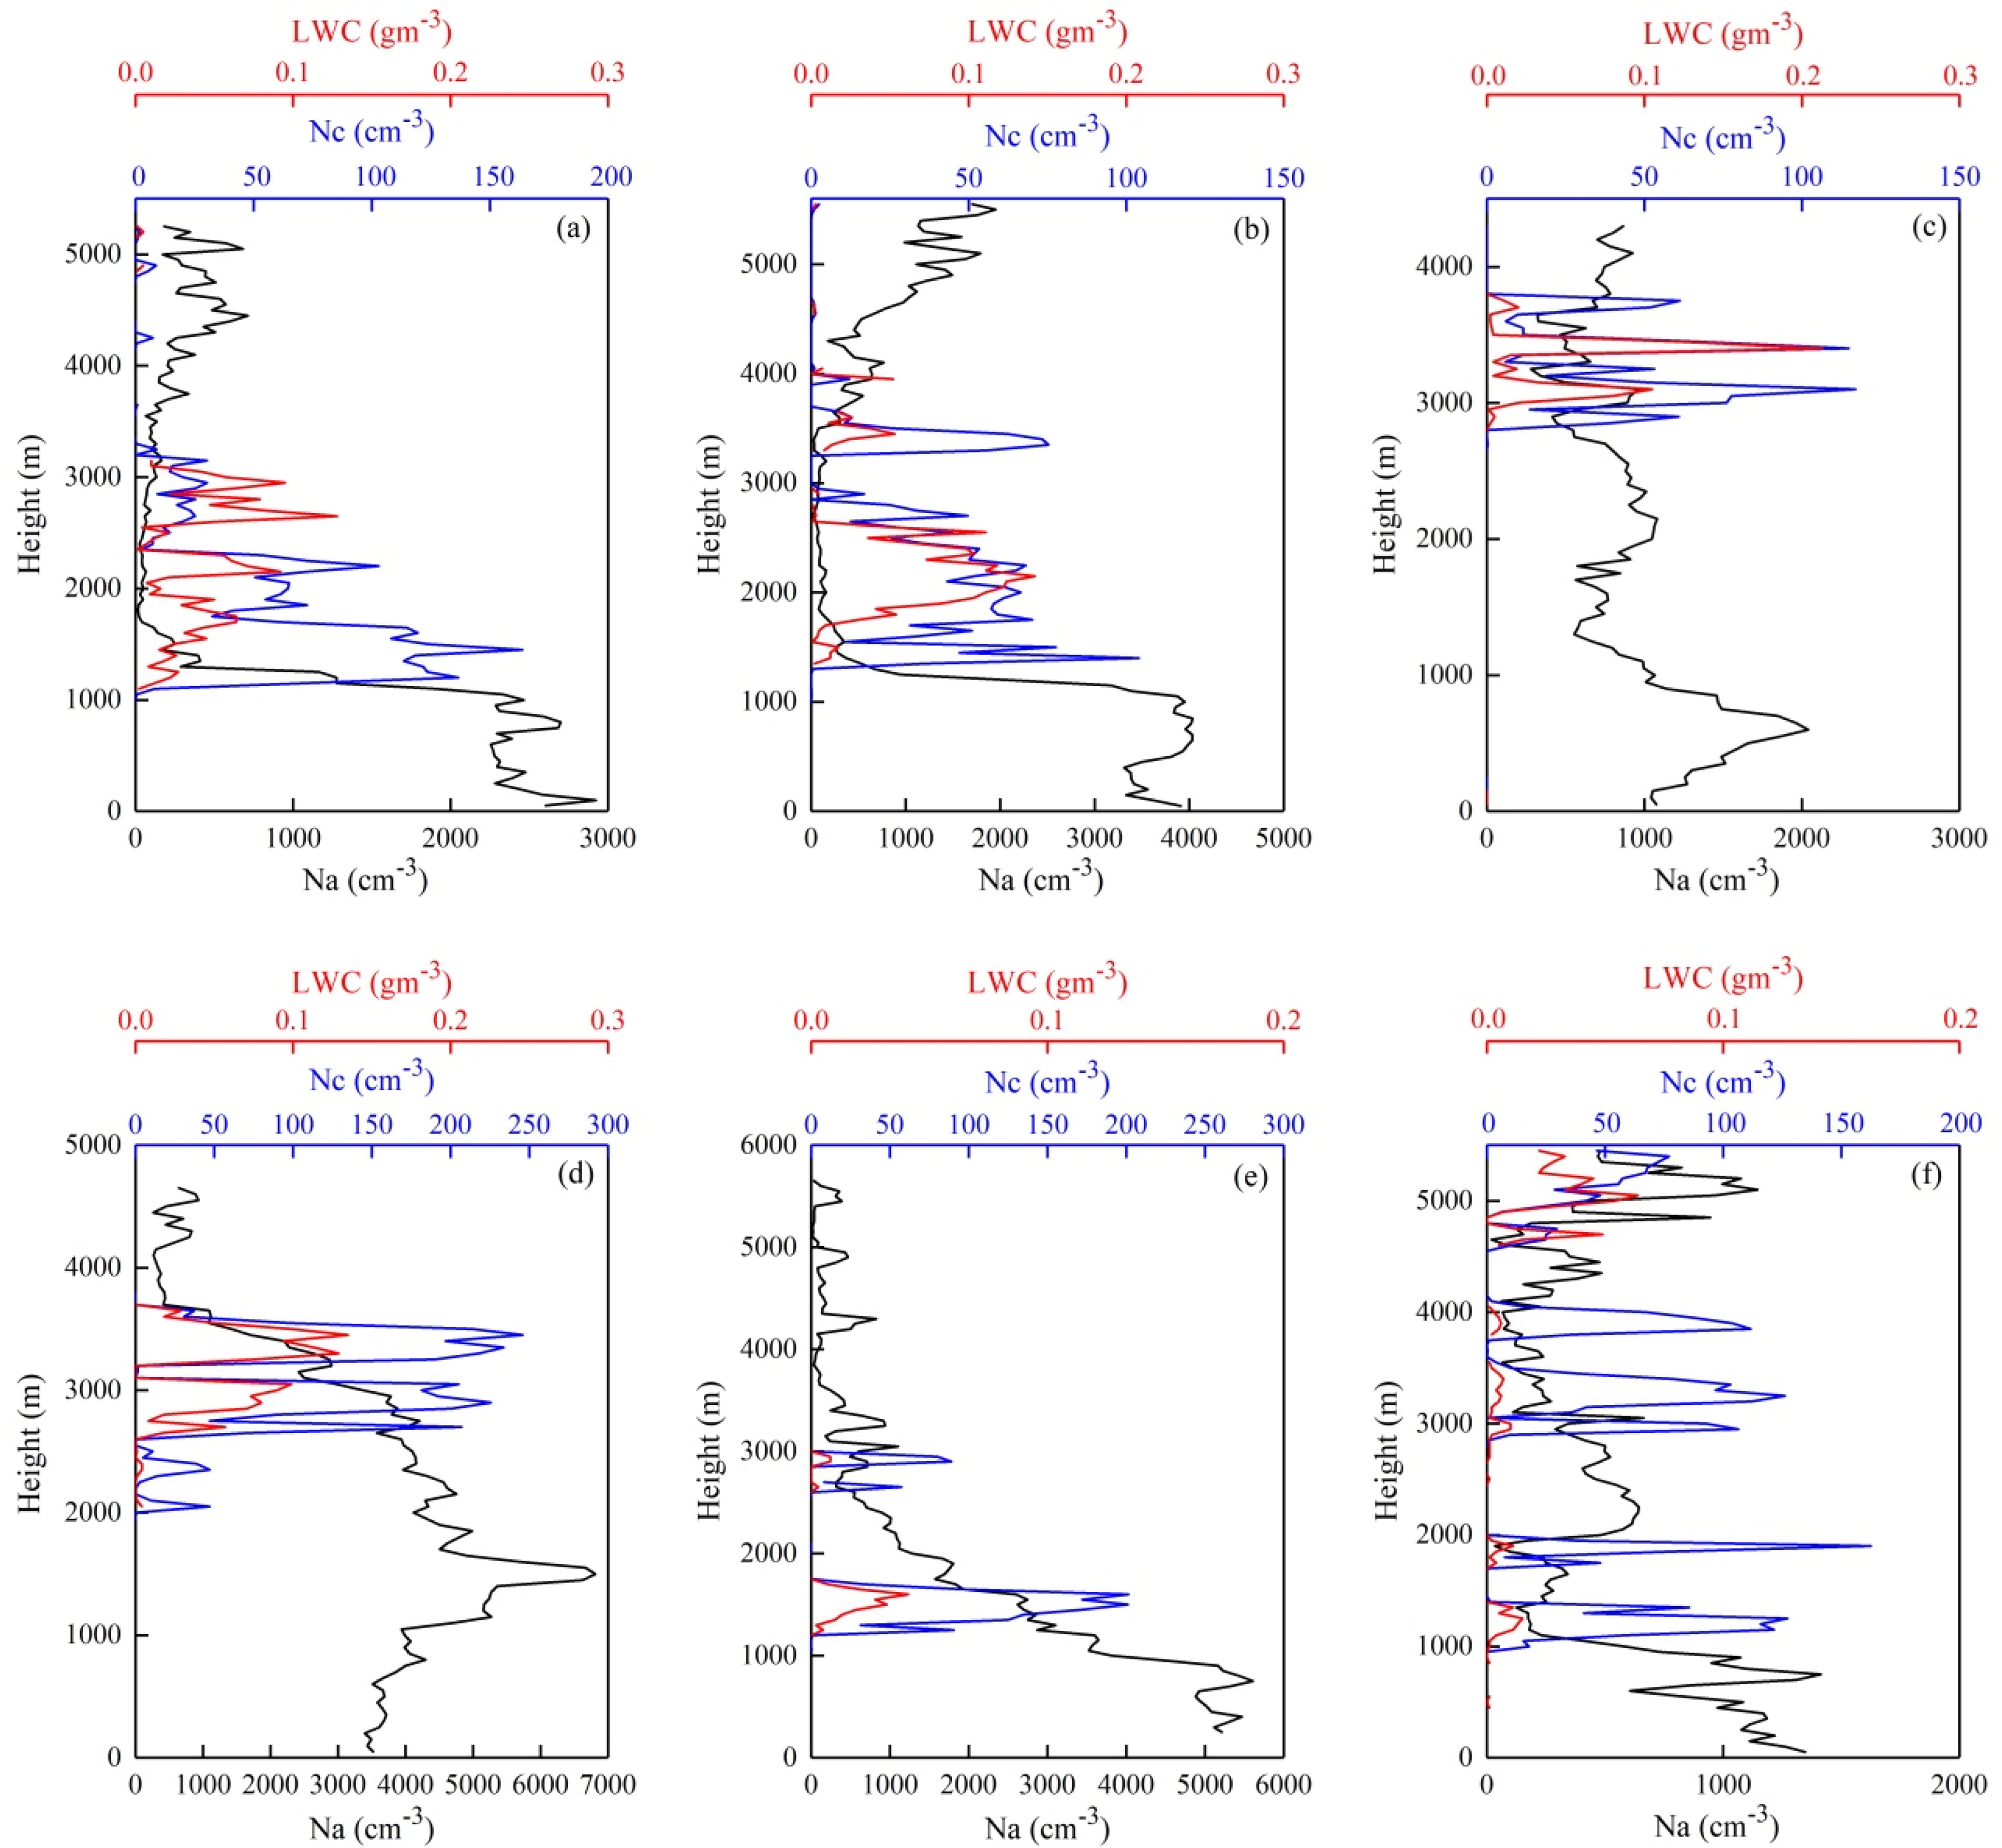
Fig. 6.
Vertical distribution of N a, N c, and LWC (a, b, and f were from the airplane ascent period and c, d, and e were from the descent period).
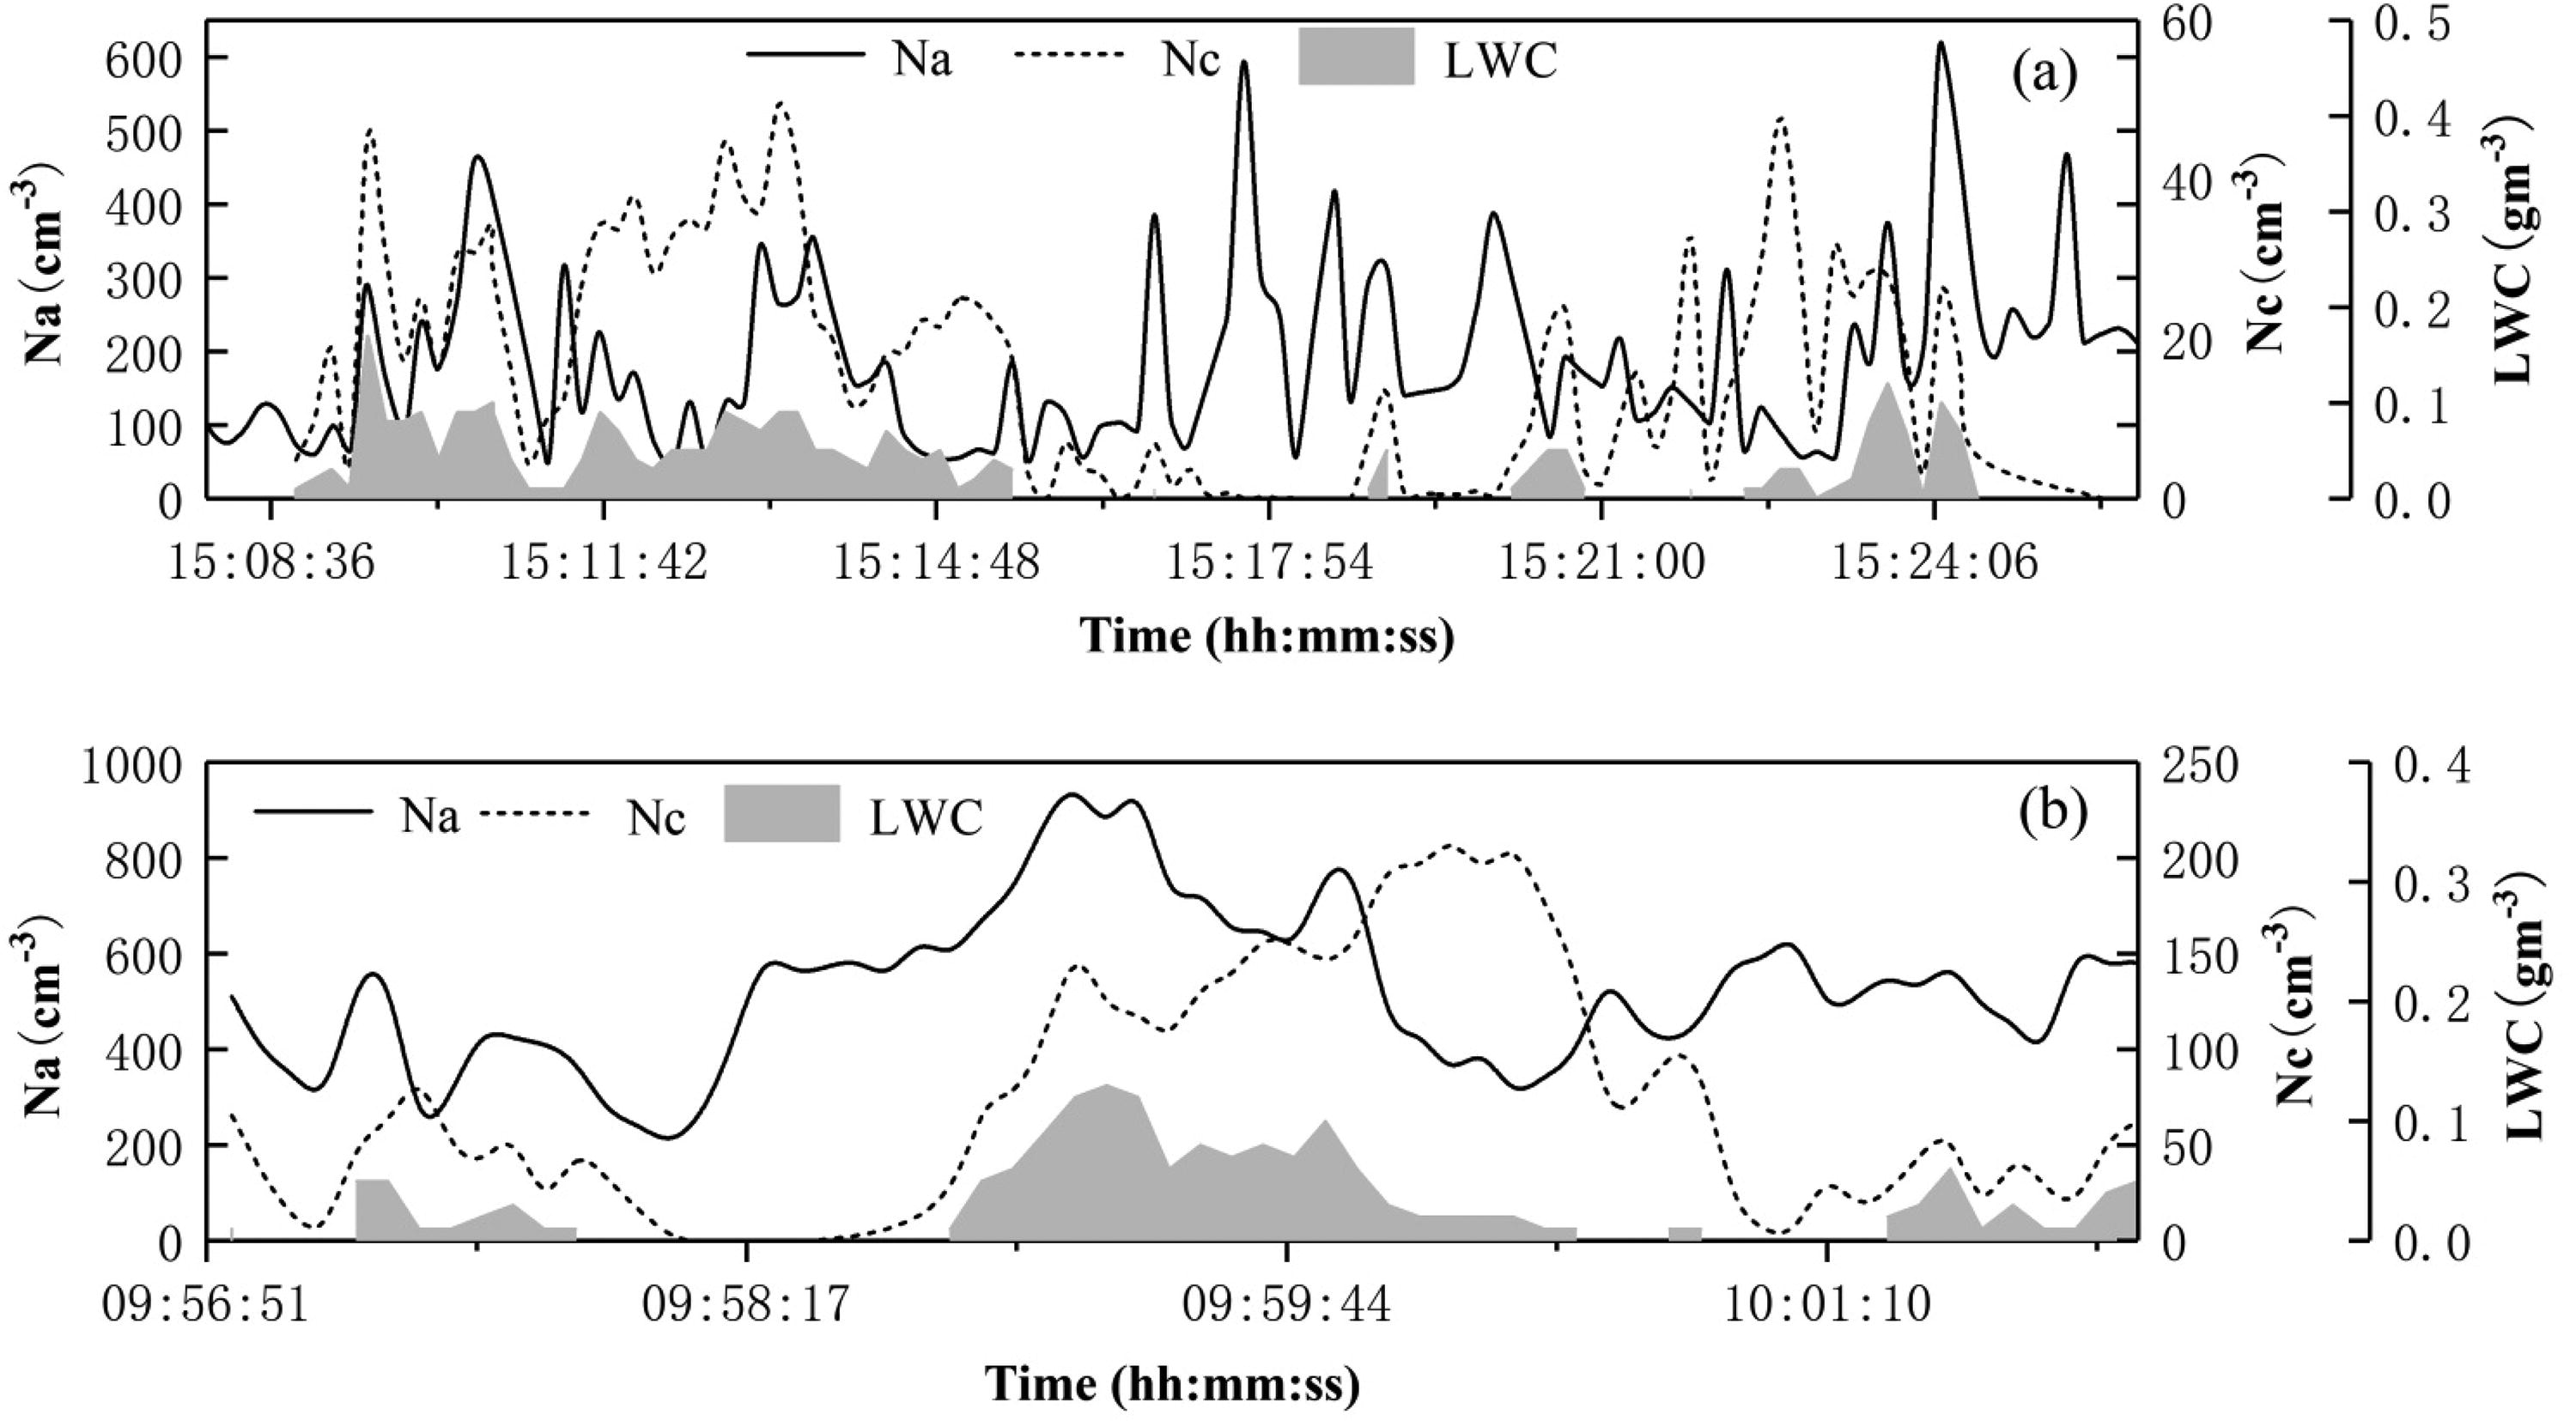
Fig. 7.
Horizontal distribution of N a, N c, and LWC.
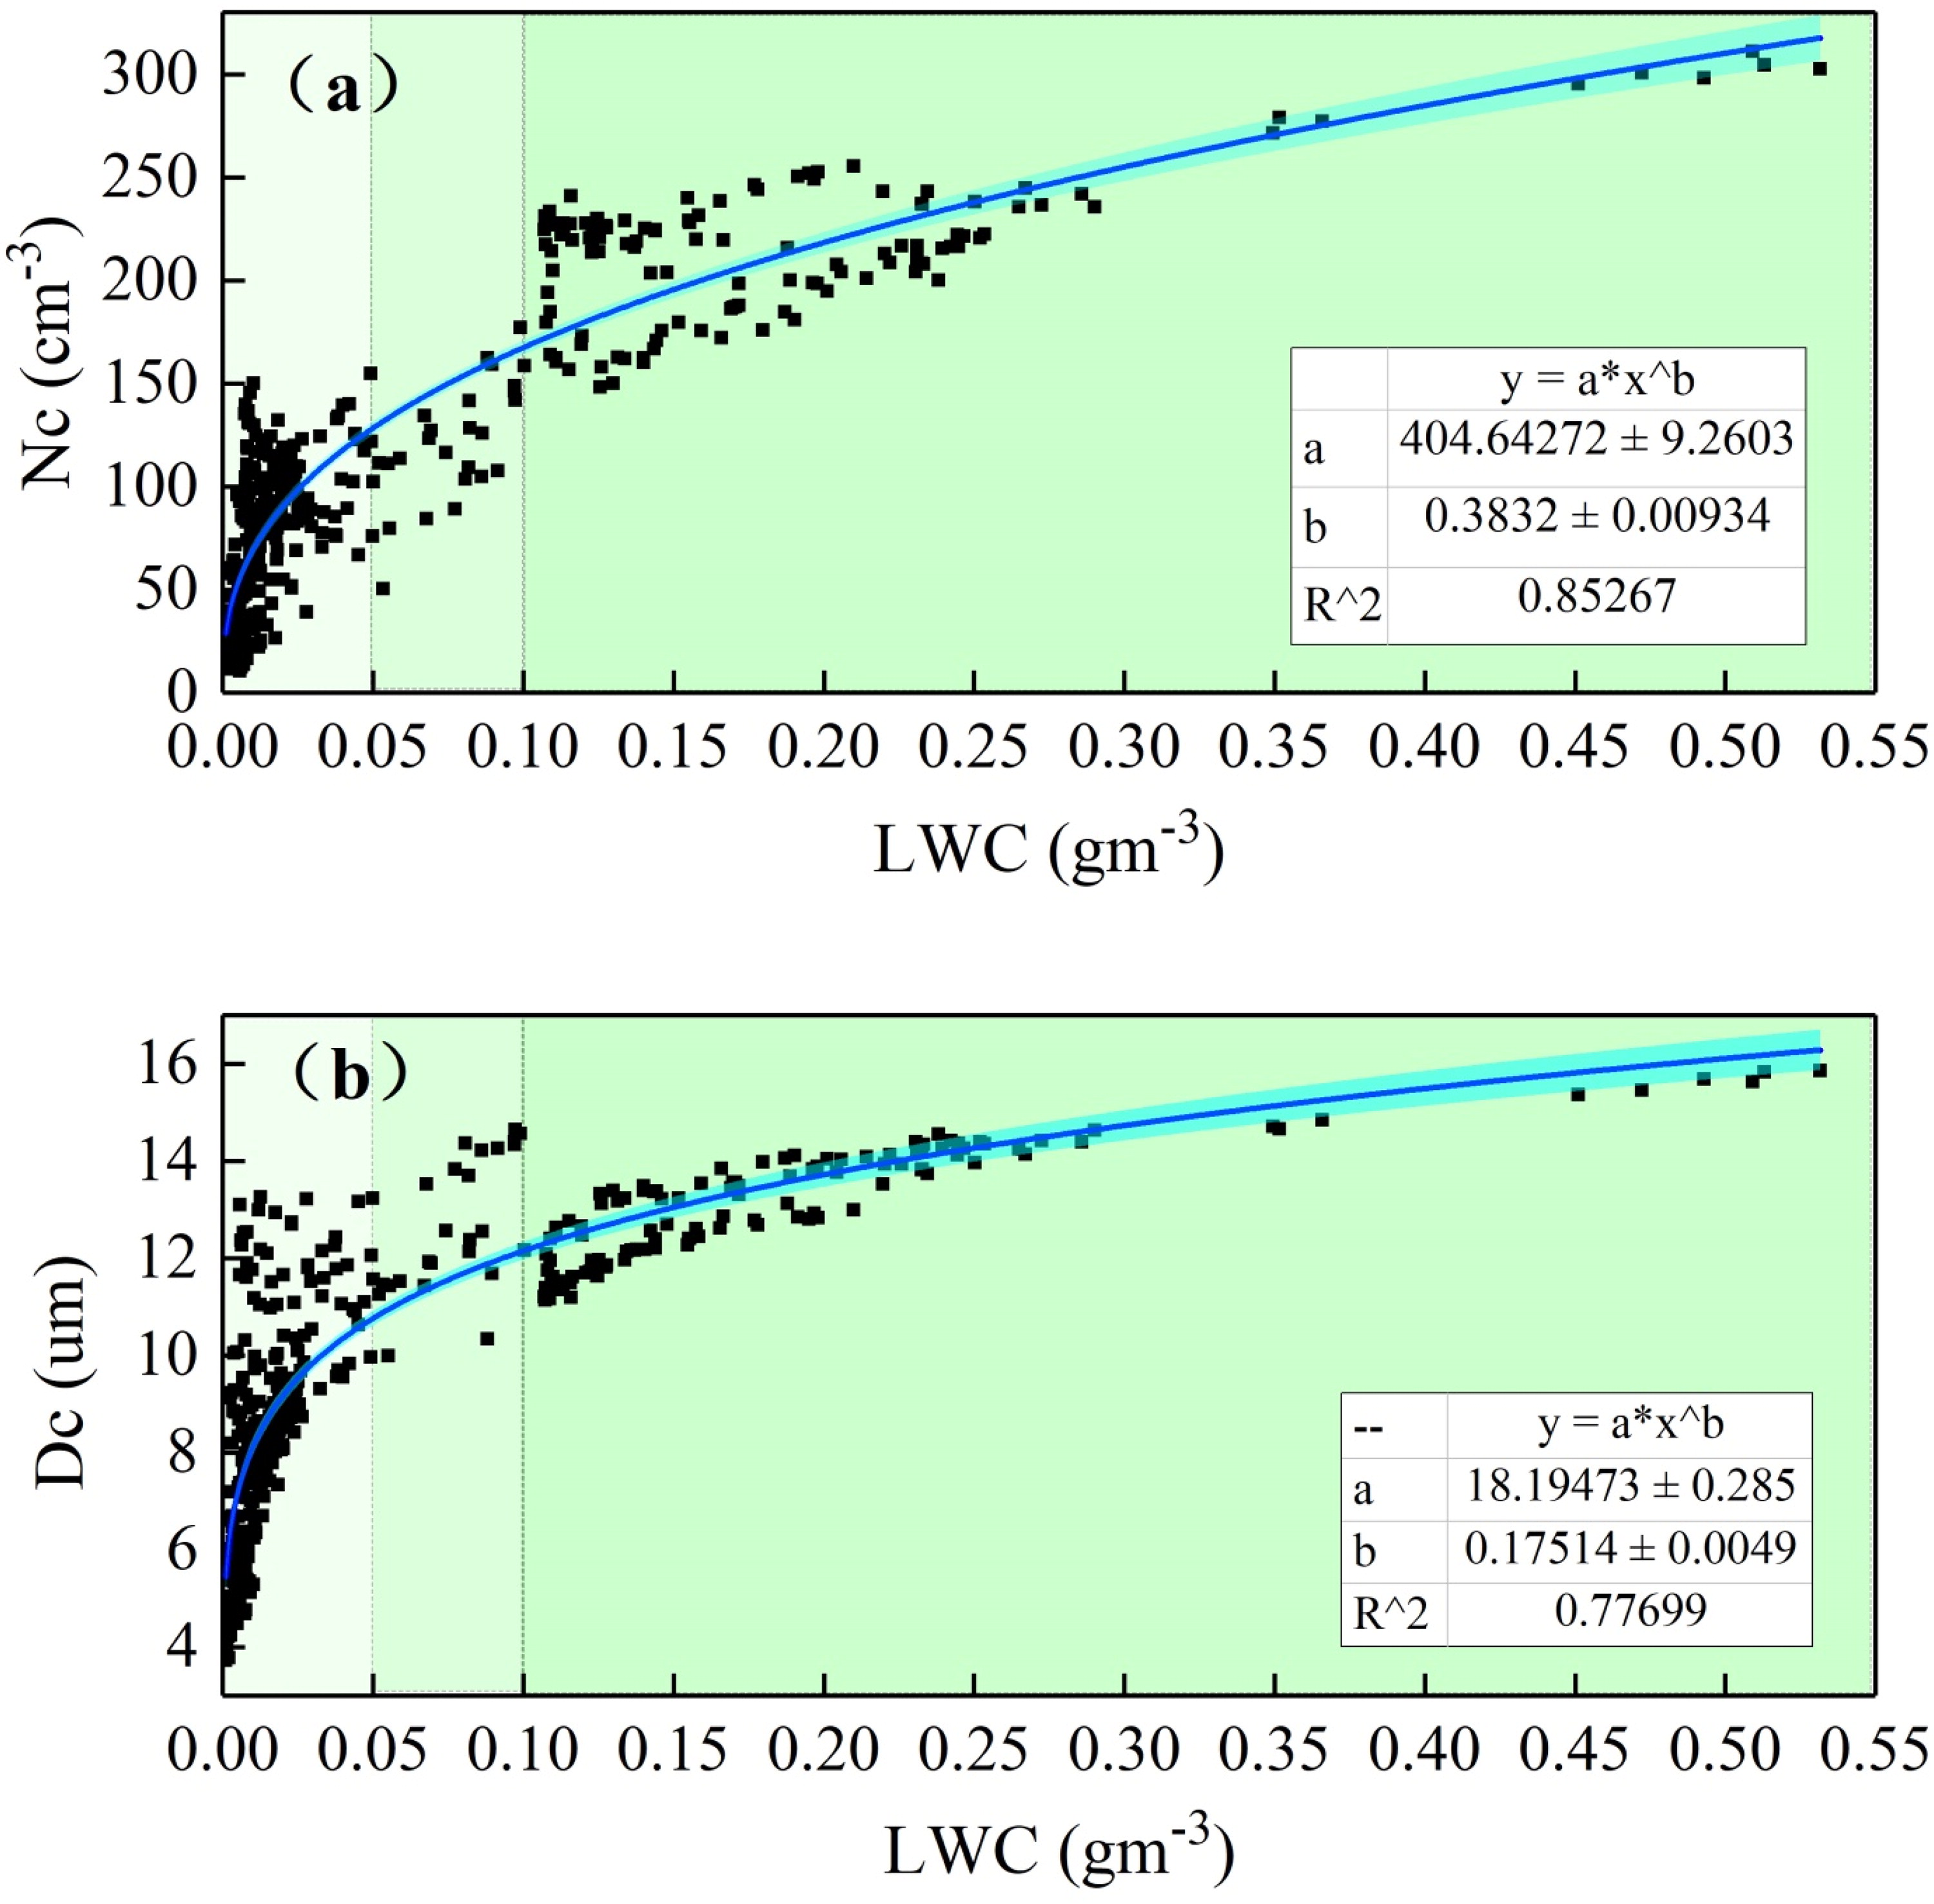
Fig. 8.
Relationships between N c (a) and D c (b) at different LWC ranges under low aerosol loading conditions.
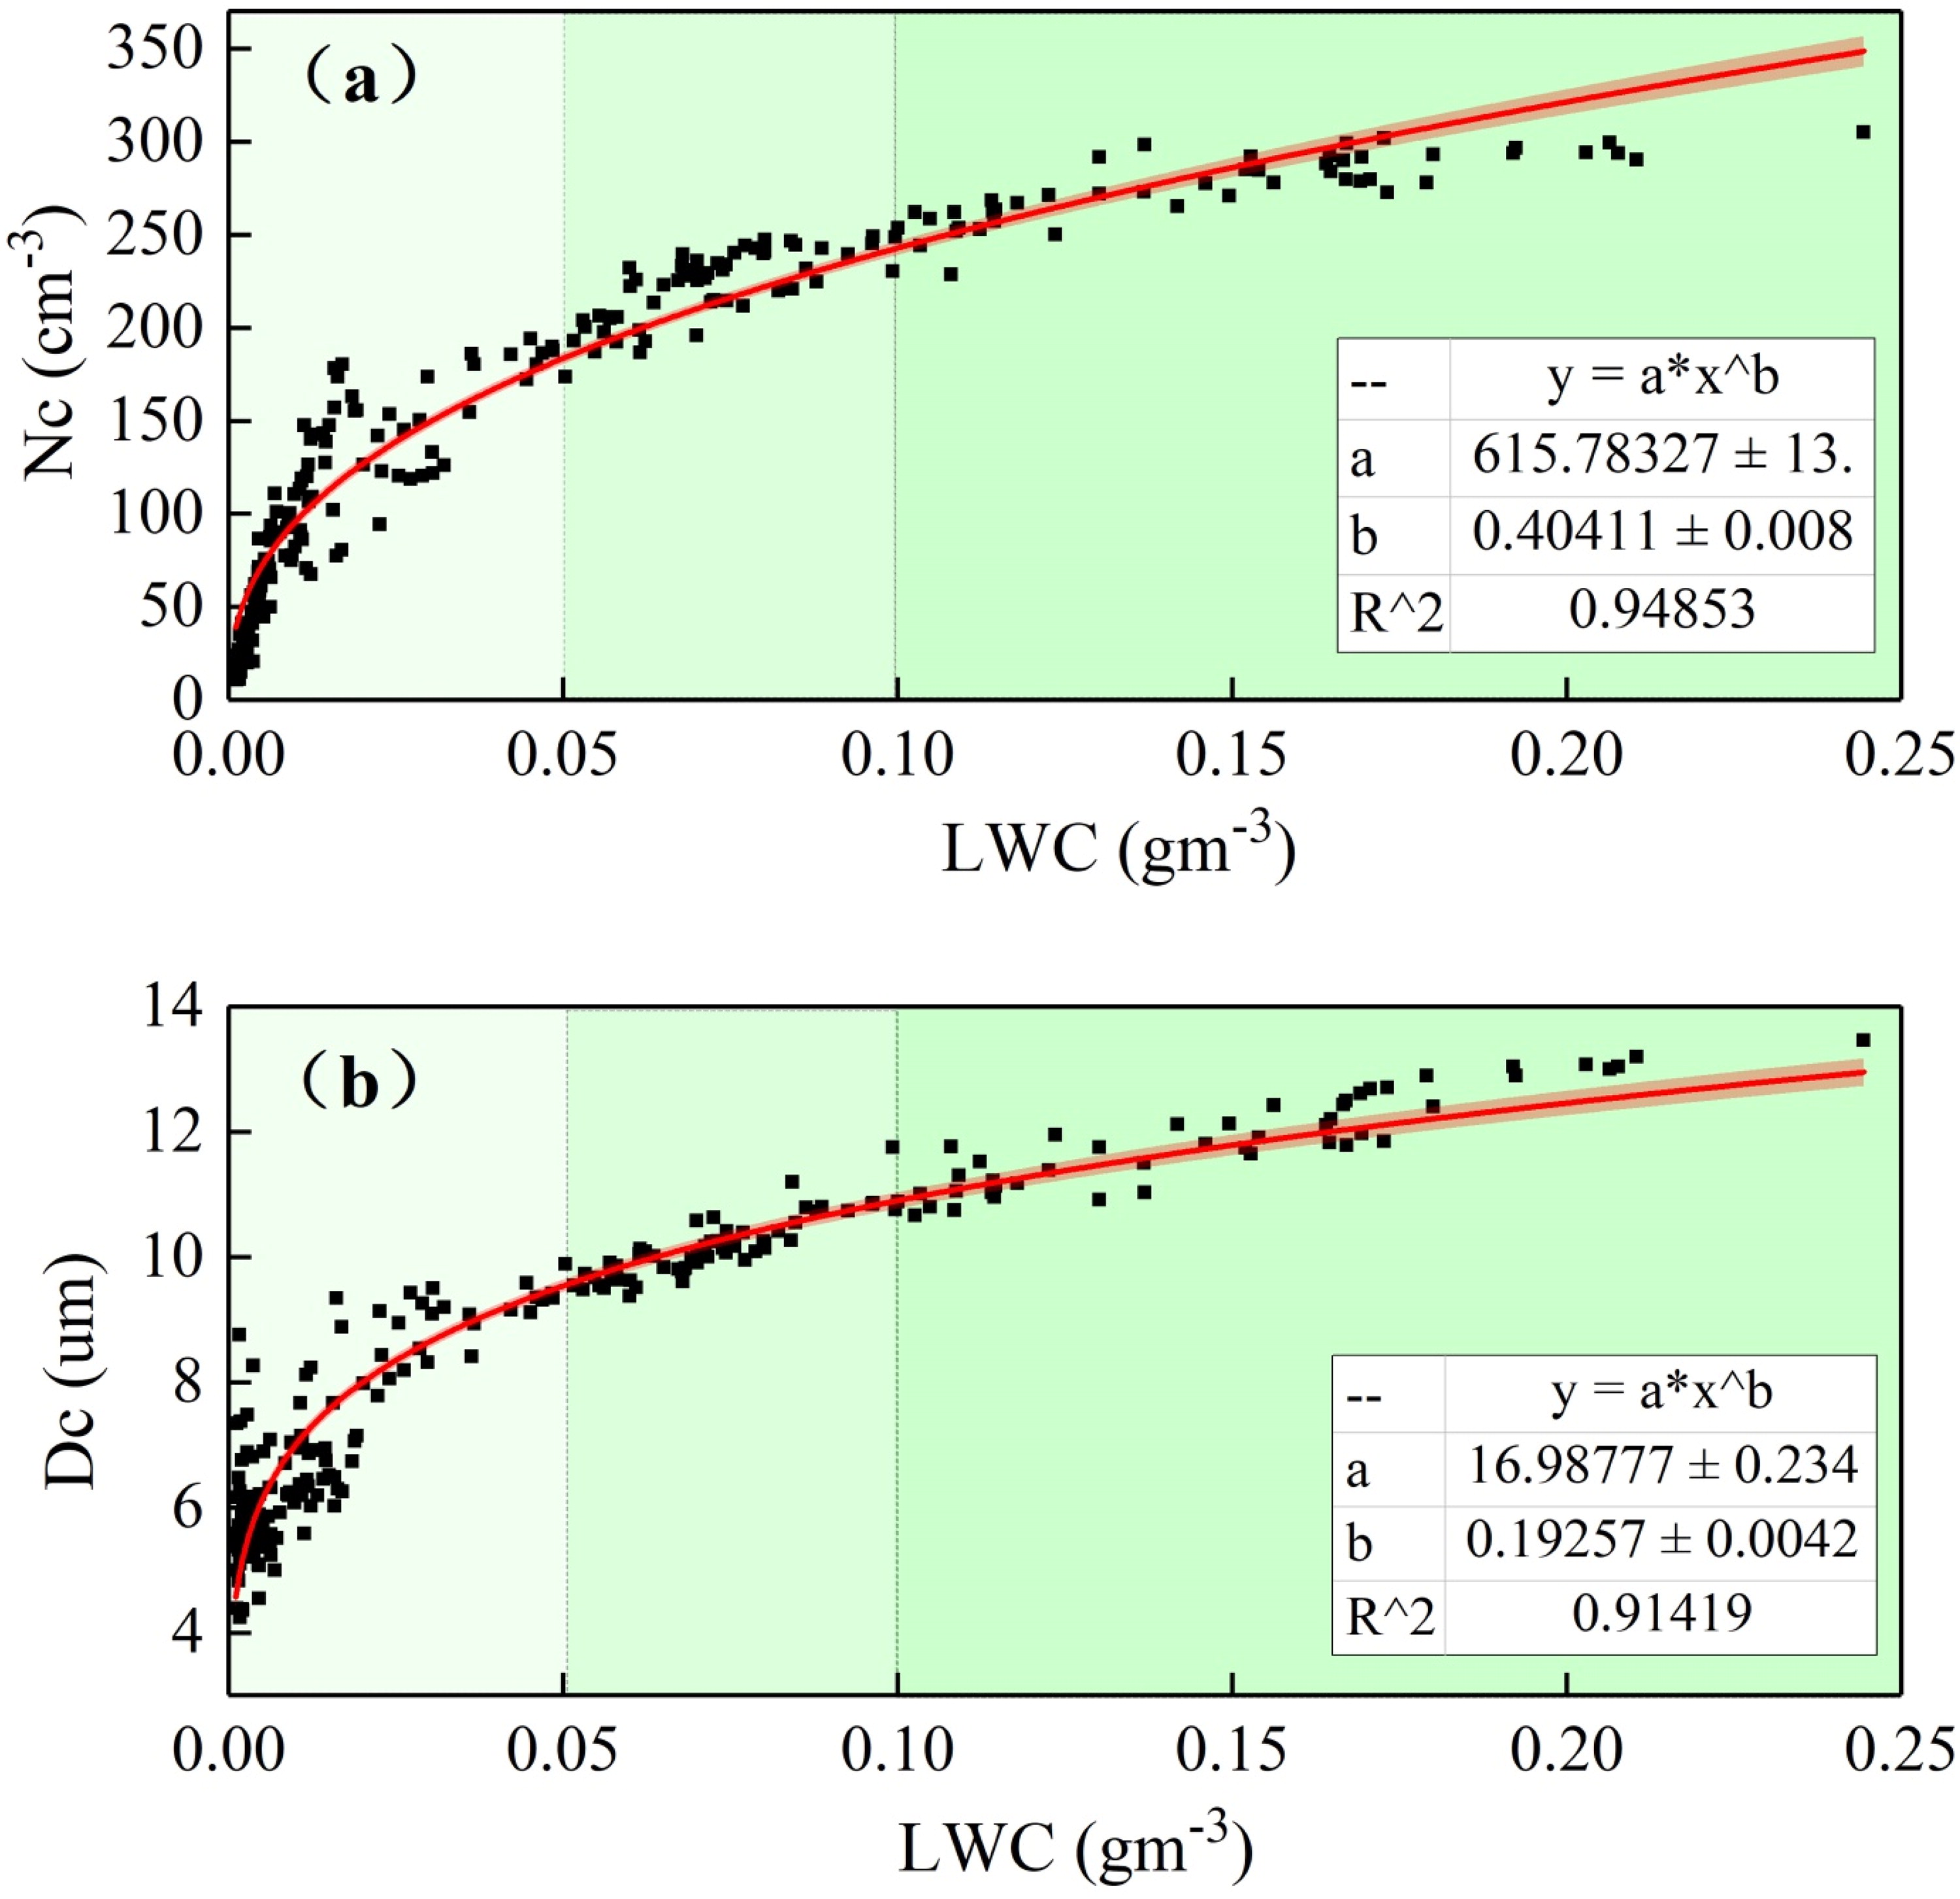
Fig. 9.
Relationships between N c (a) and D c (b) at different LWC ranges under high aerosol loading conditions.
Table 4.
Mean values of N c and D c under different LWCs for each flight (N c: cm−3, D c: μm, LWC: g·m−3, STP).
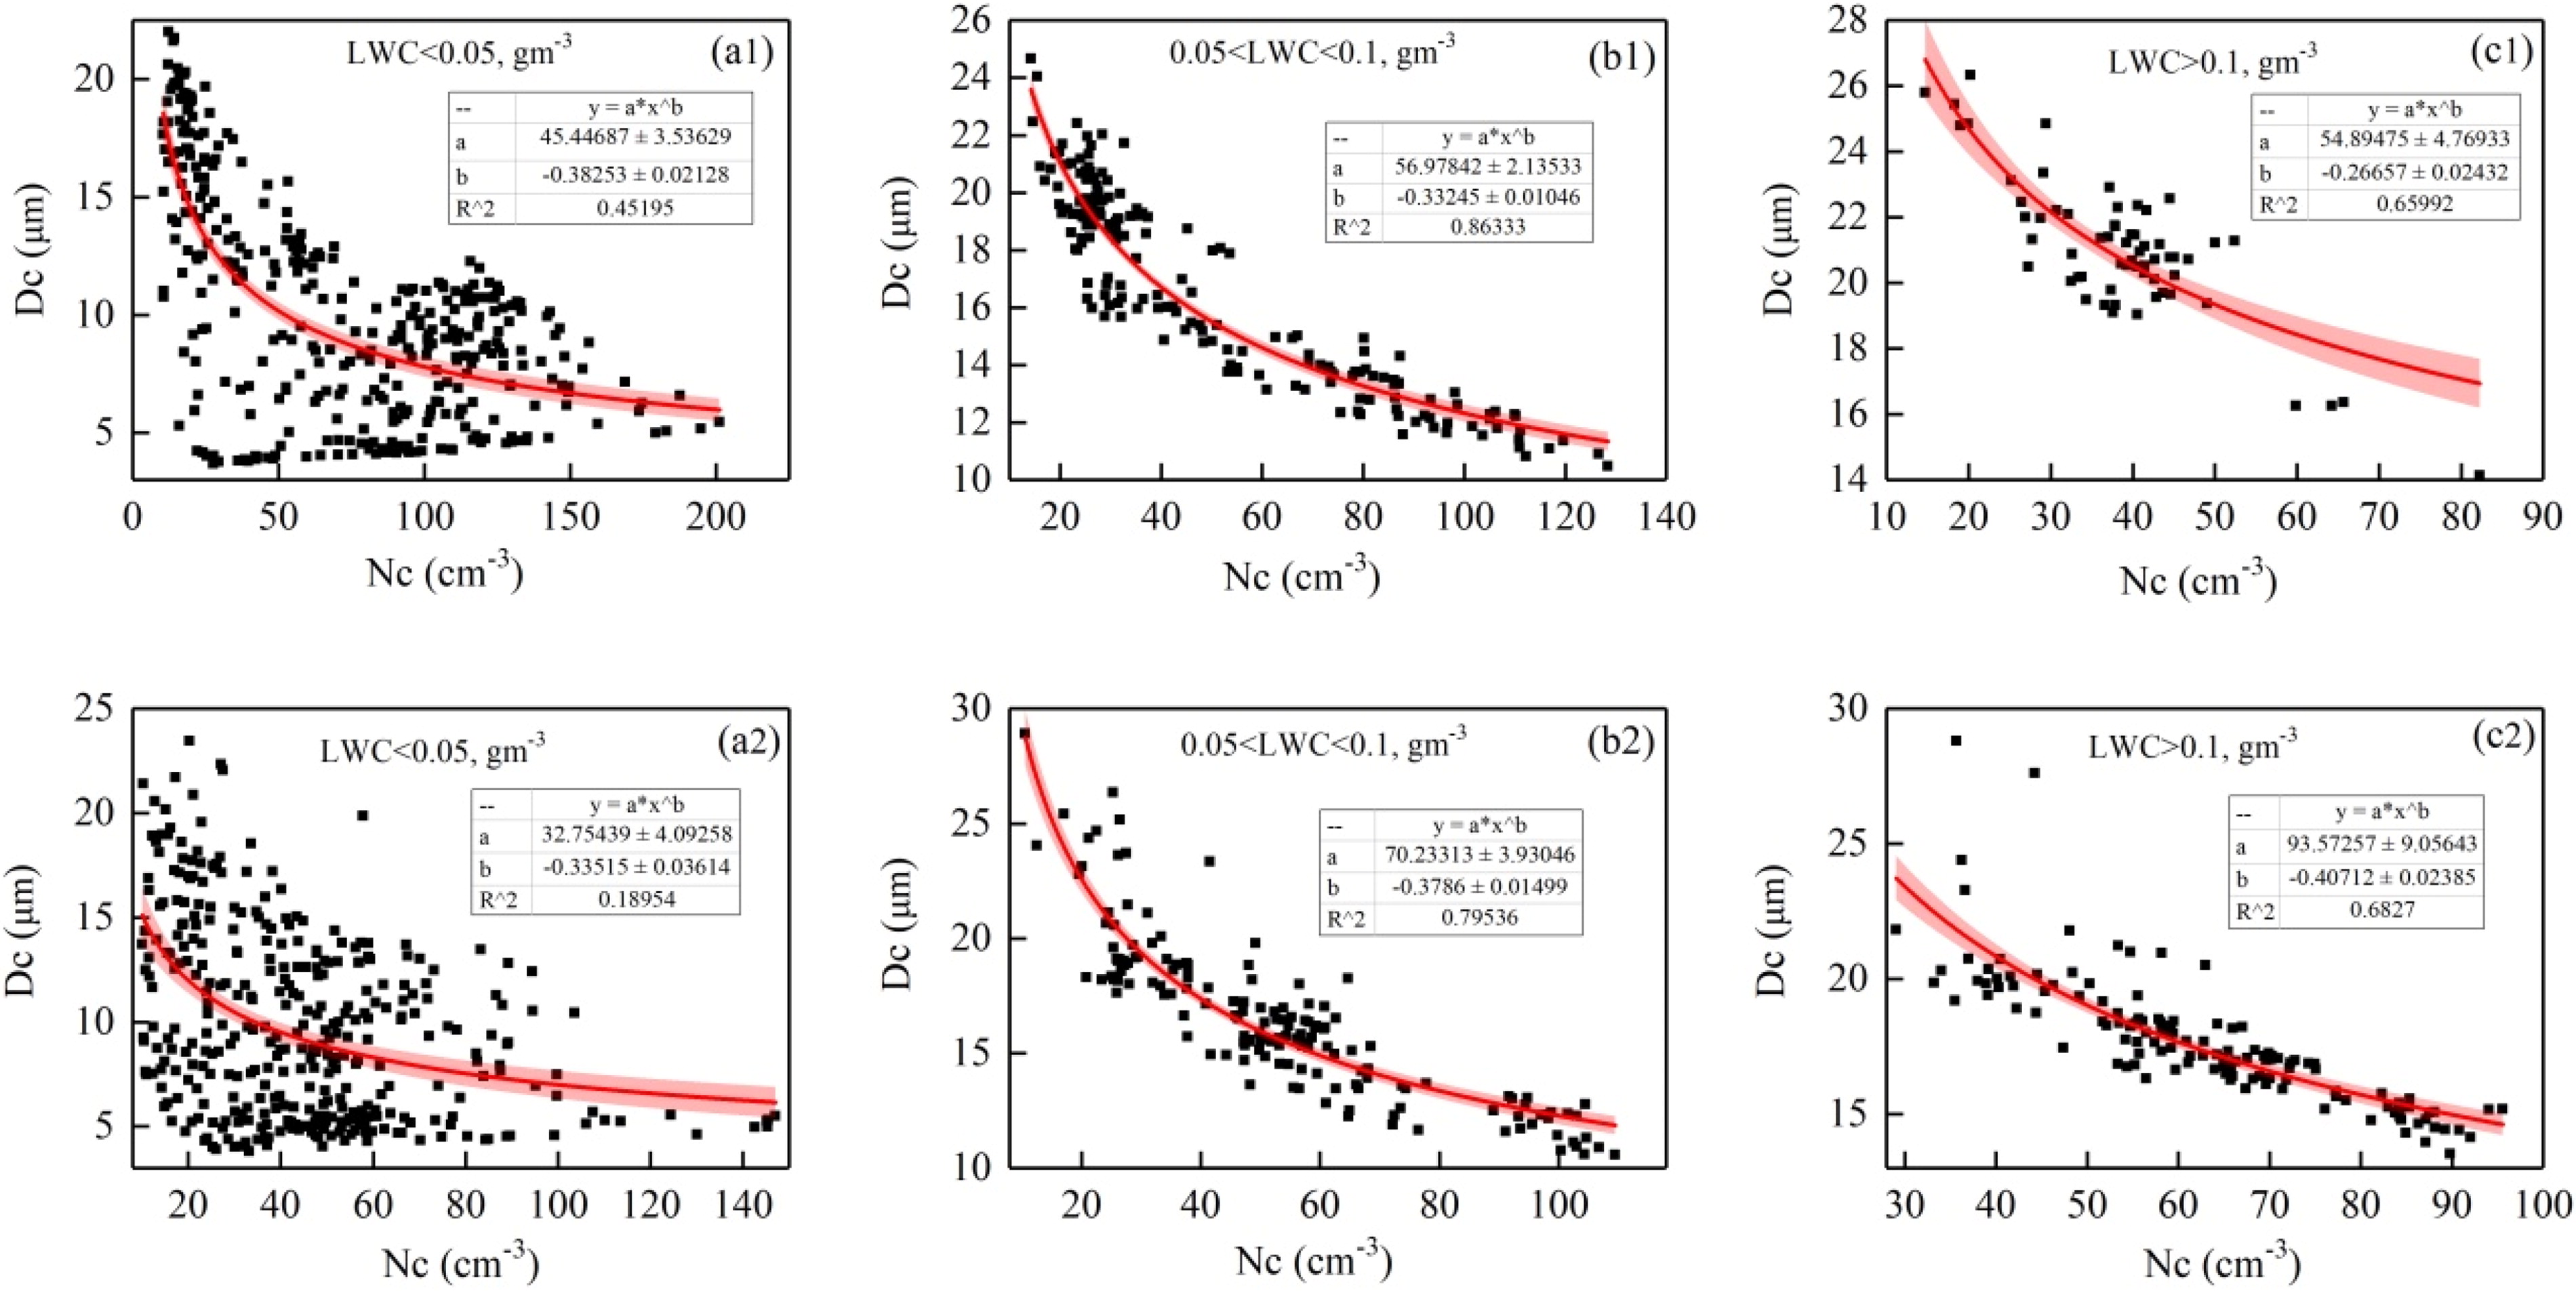
Fig. 10.
Two cases of N c and D c under three LWC ranges of <0.05, 0.05–0.1, and >0.1 g·m−3 in the same cloud system. (Case 1: a1, b1, and c1; Case 2: a2, b2, and c2).
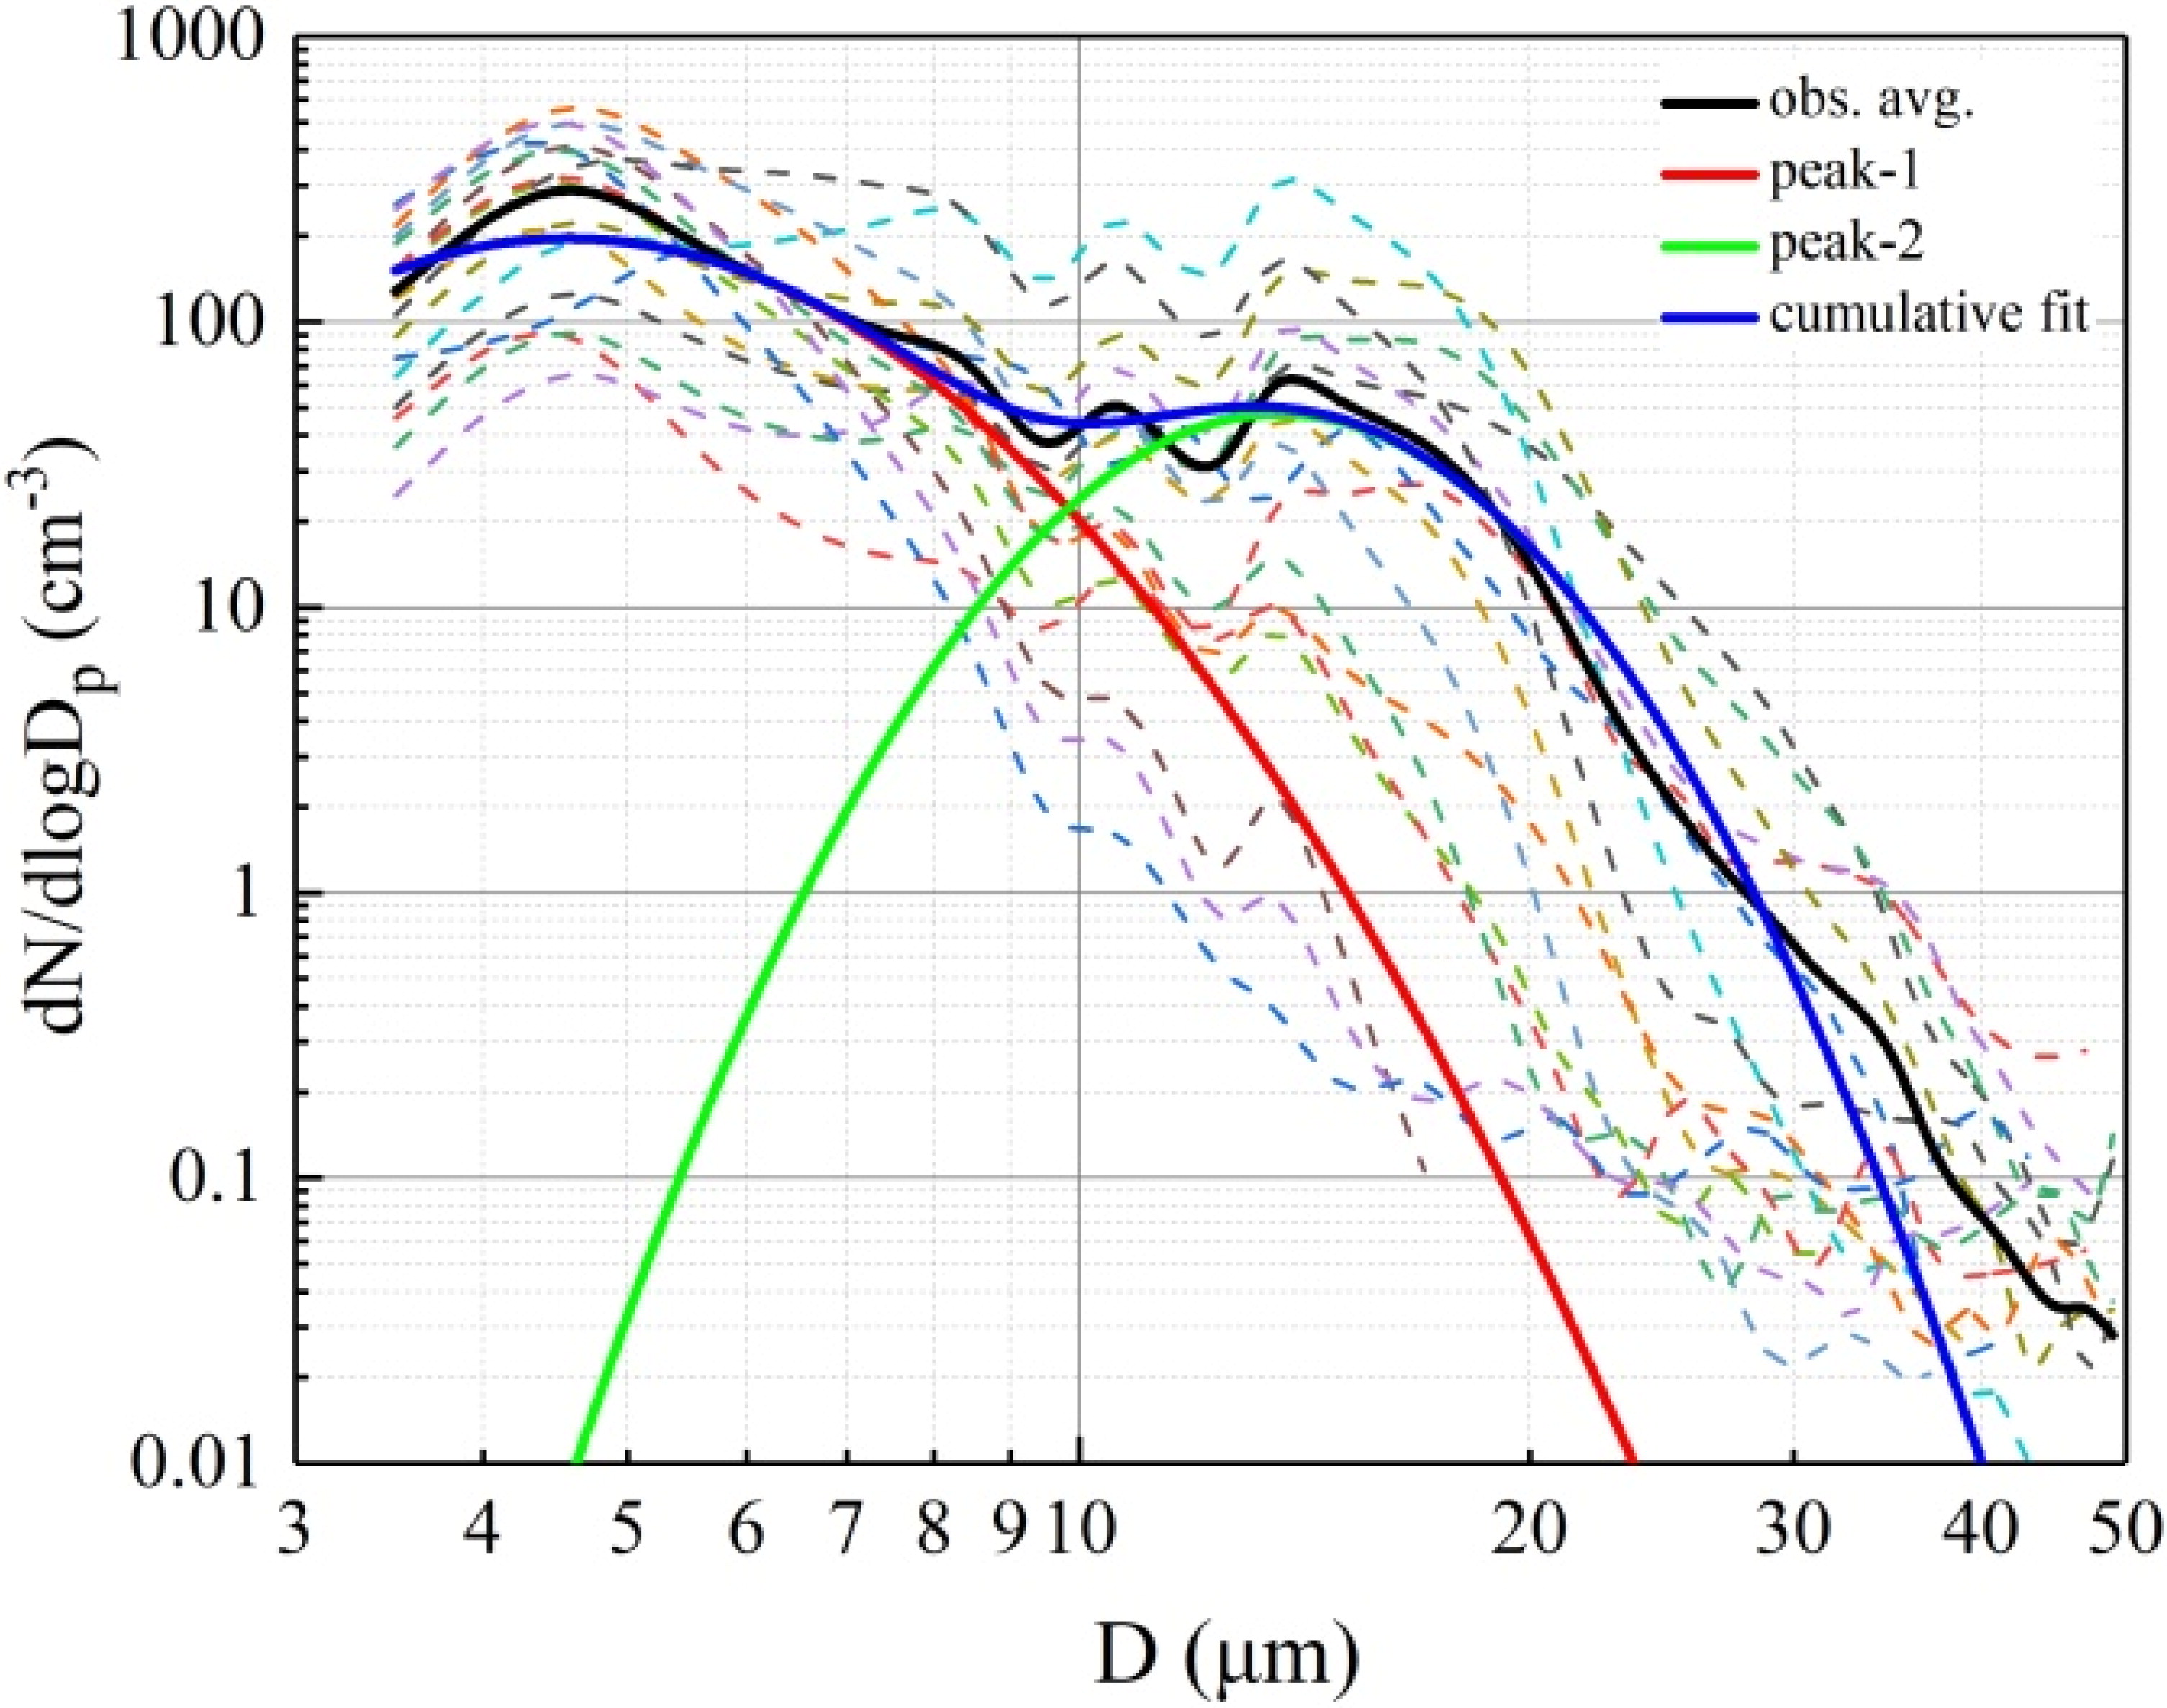
Fig. 11.
The cloud droplet size distributions of all detected clouds from six flights (the different coloured dashed lines are droplet size distributions from each cloud system, the thick deep purple line shows the mean state of the cloud droplet size distribution, and red and green lines show the lognormal fits of two modes to the mean cloud droplet spectrum).