
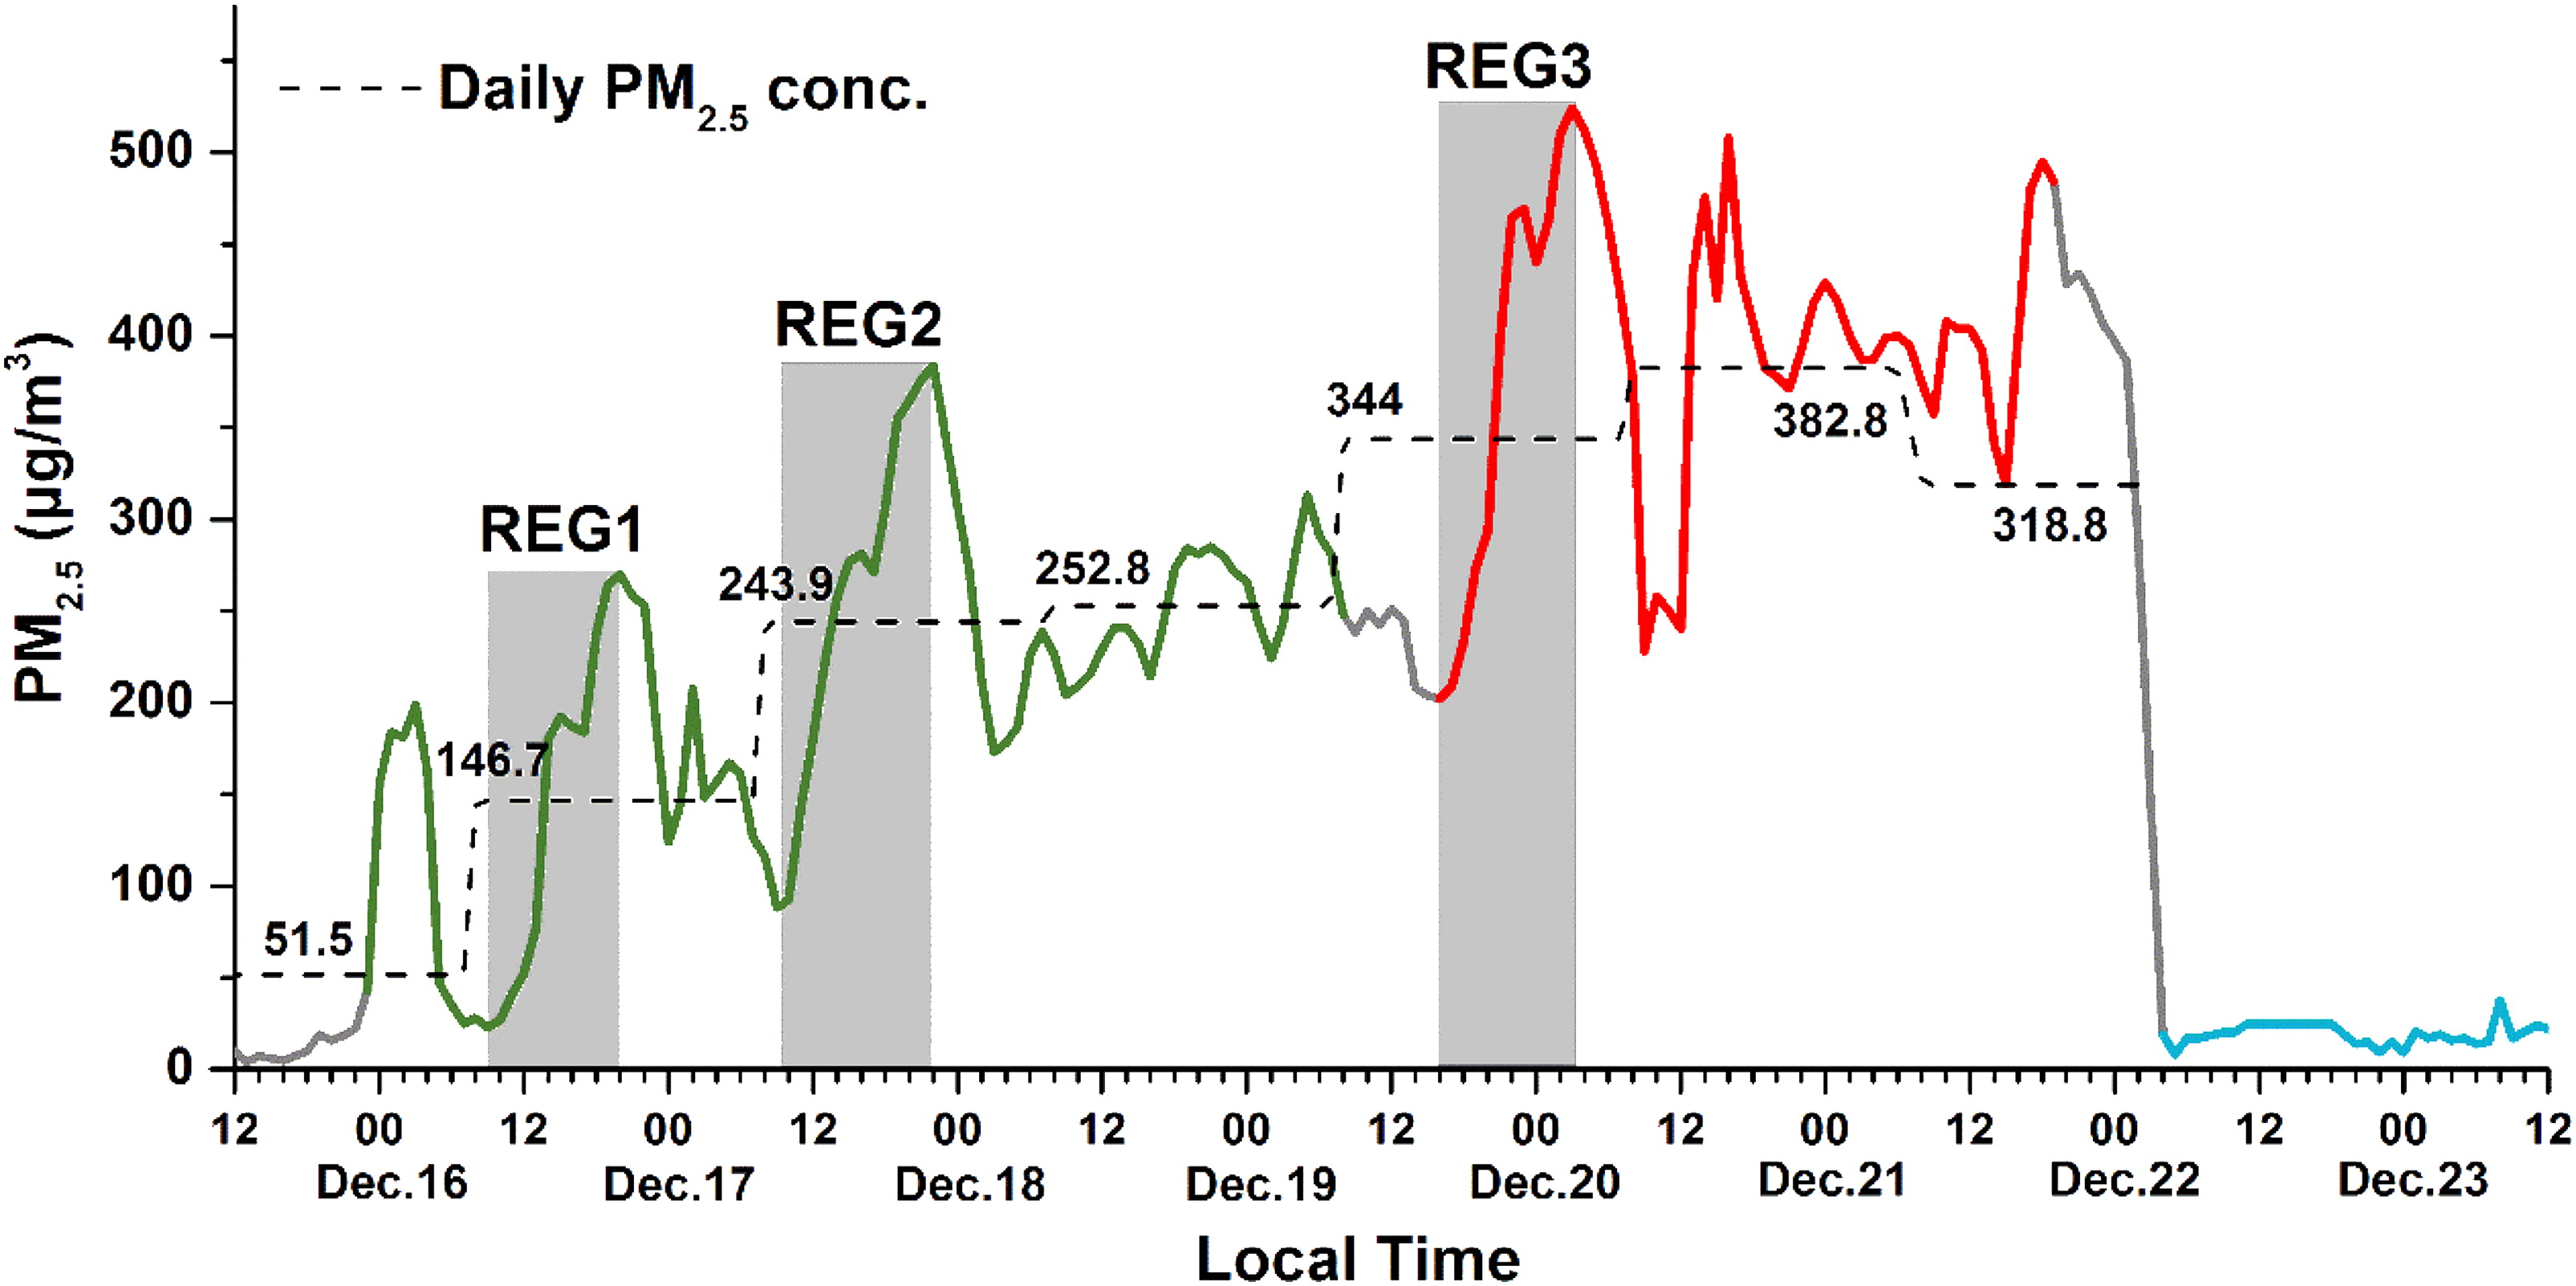
Fig. 1.
Time series of the PM2.5 mass concentration in Beijing on 15–23 December 2016. The green, red, and blue lines correspond to the PM2.5 data in the pollution transport stage (TS), pollution cumulative stage (CS) and clean stage (Clean), respectively. The dashed line corresponds to the daily mean PM2.5 mass concentration (calculated from 8:00 am to 7:00 am in the following day). The data in the gray boxes were selected to represent the explosive growth (REG) processes.
Table 1.
Average mass concentration (µg m−3) of PM2.5, major water-soluble ions, and trace gases during the pollution transport stage (TS), pollution cumulative stage (CS), and clean stage (Clean).
Table 2.
Duration and increase rate of the PM2.5 mass concentration in REG1, REG2, and REG3.
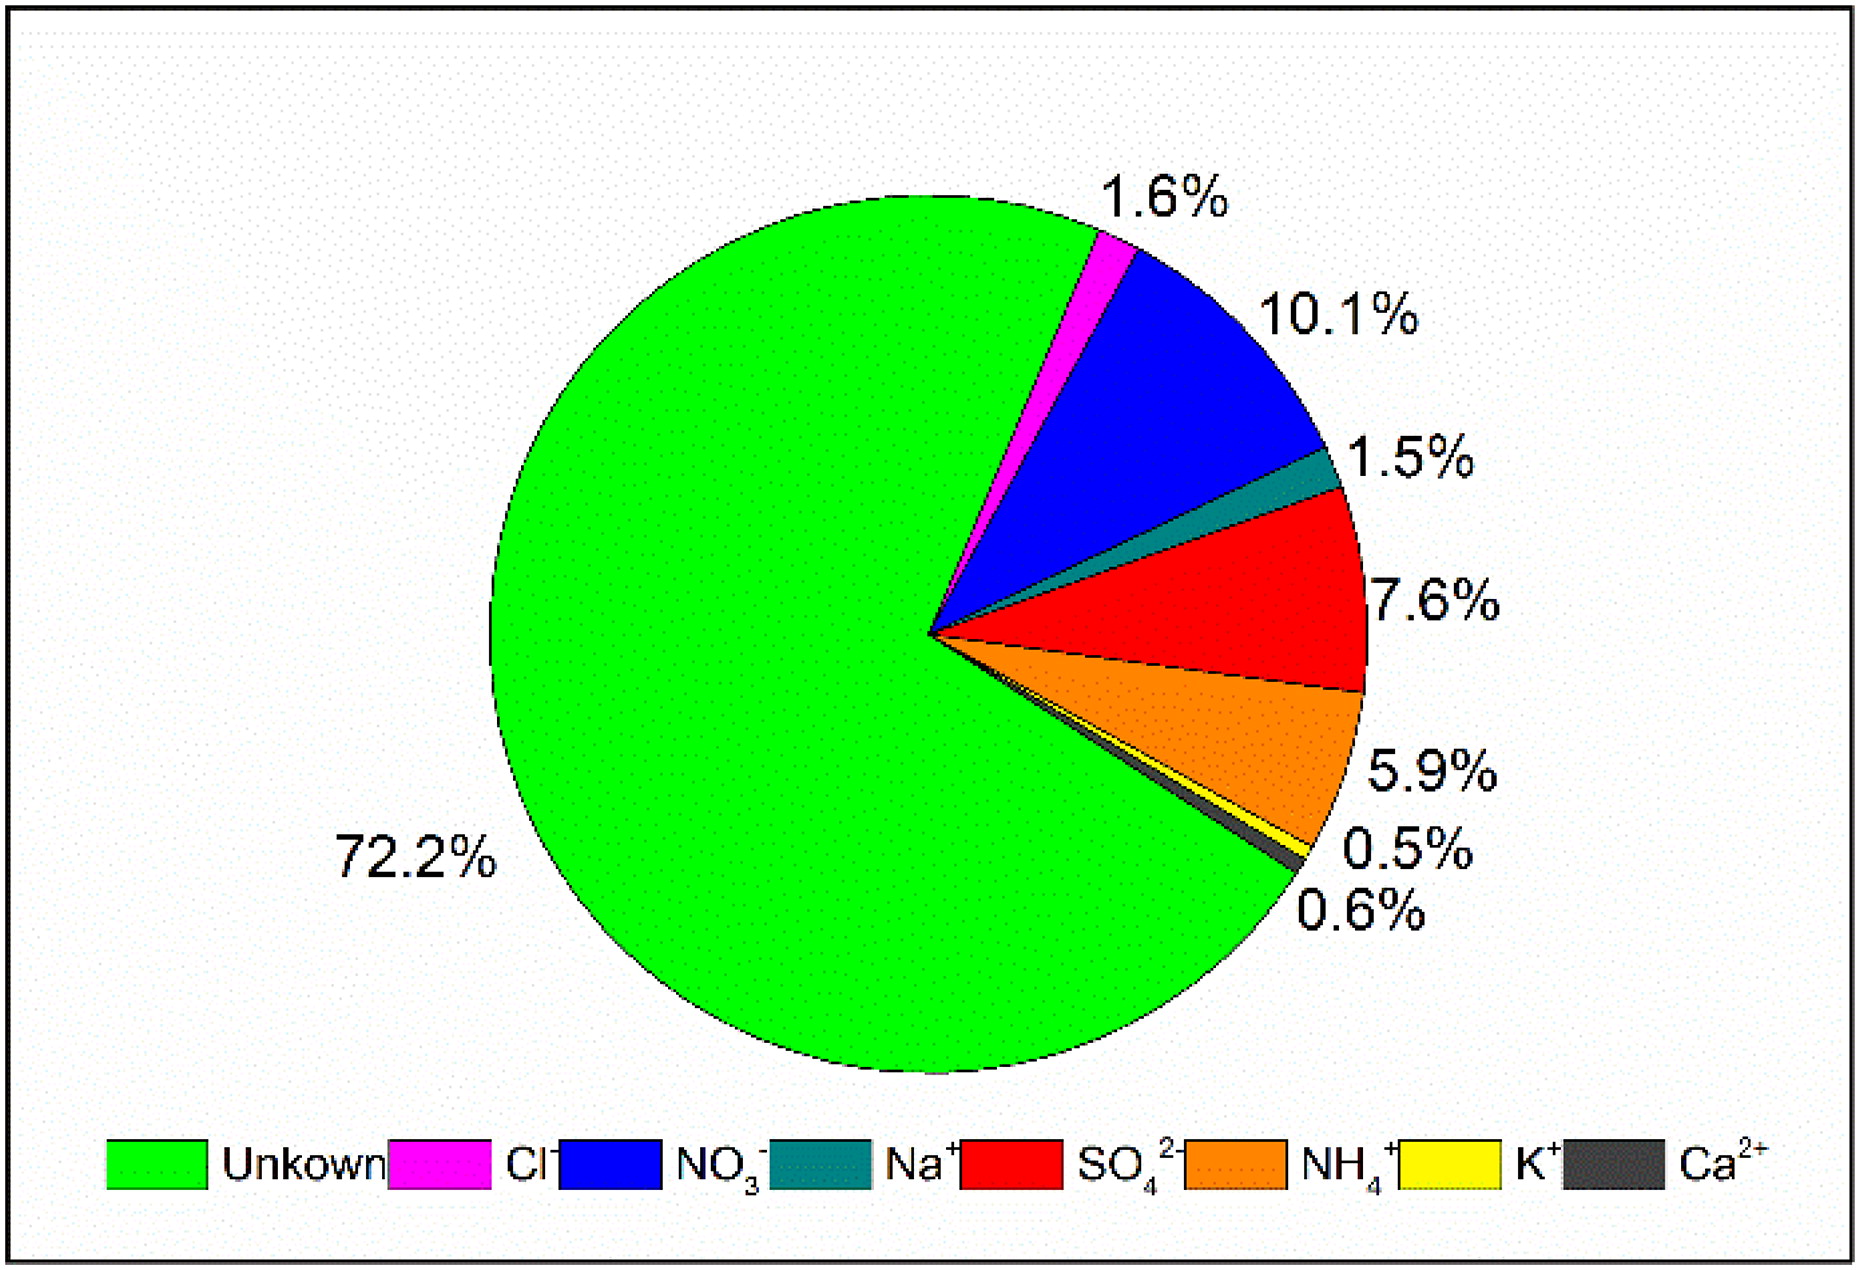
Fig. 2.
Mass fractions of water-soluble inorganic ions in PM2.5 during HPE on 15–22 December 2016 in Beijing.
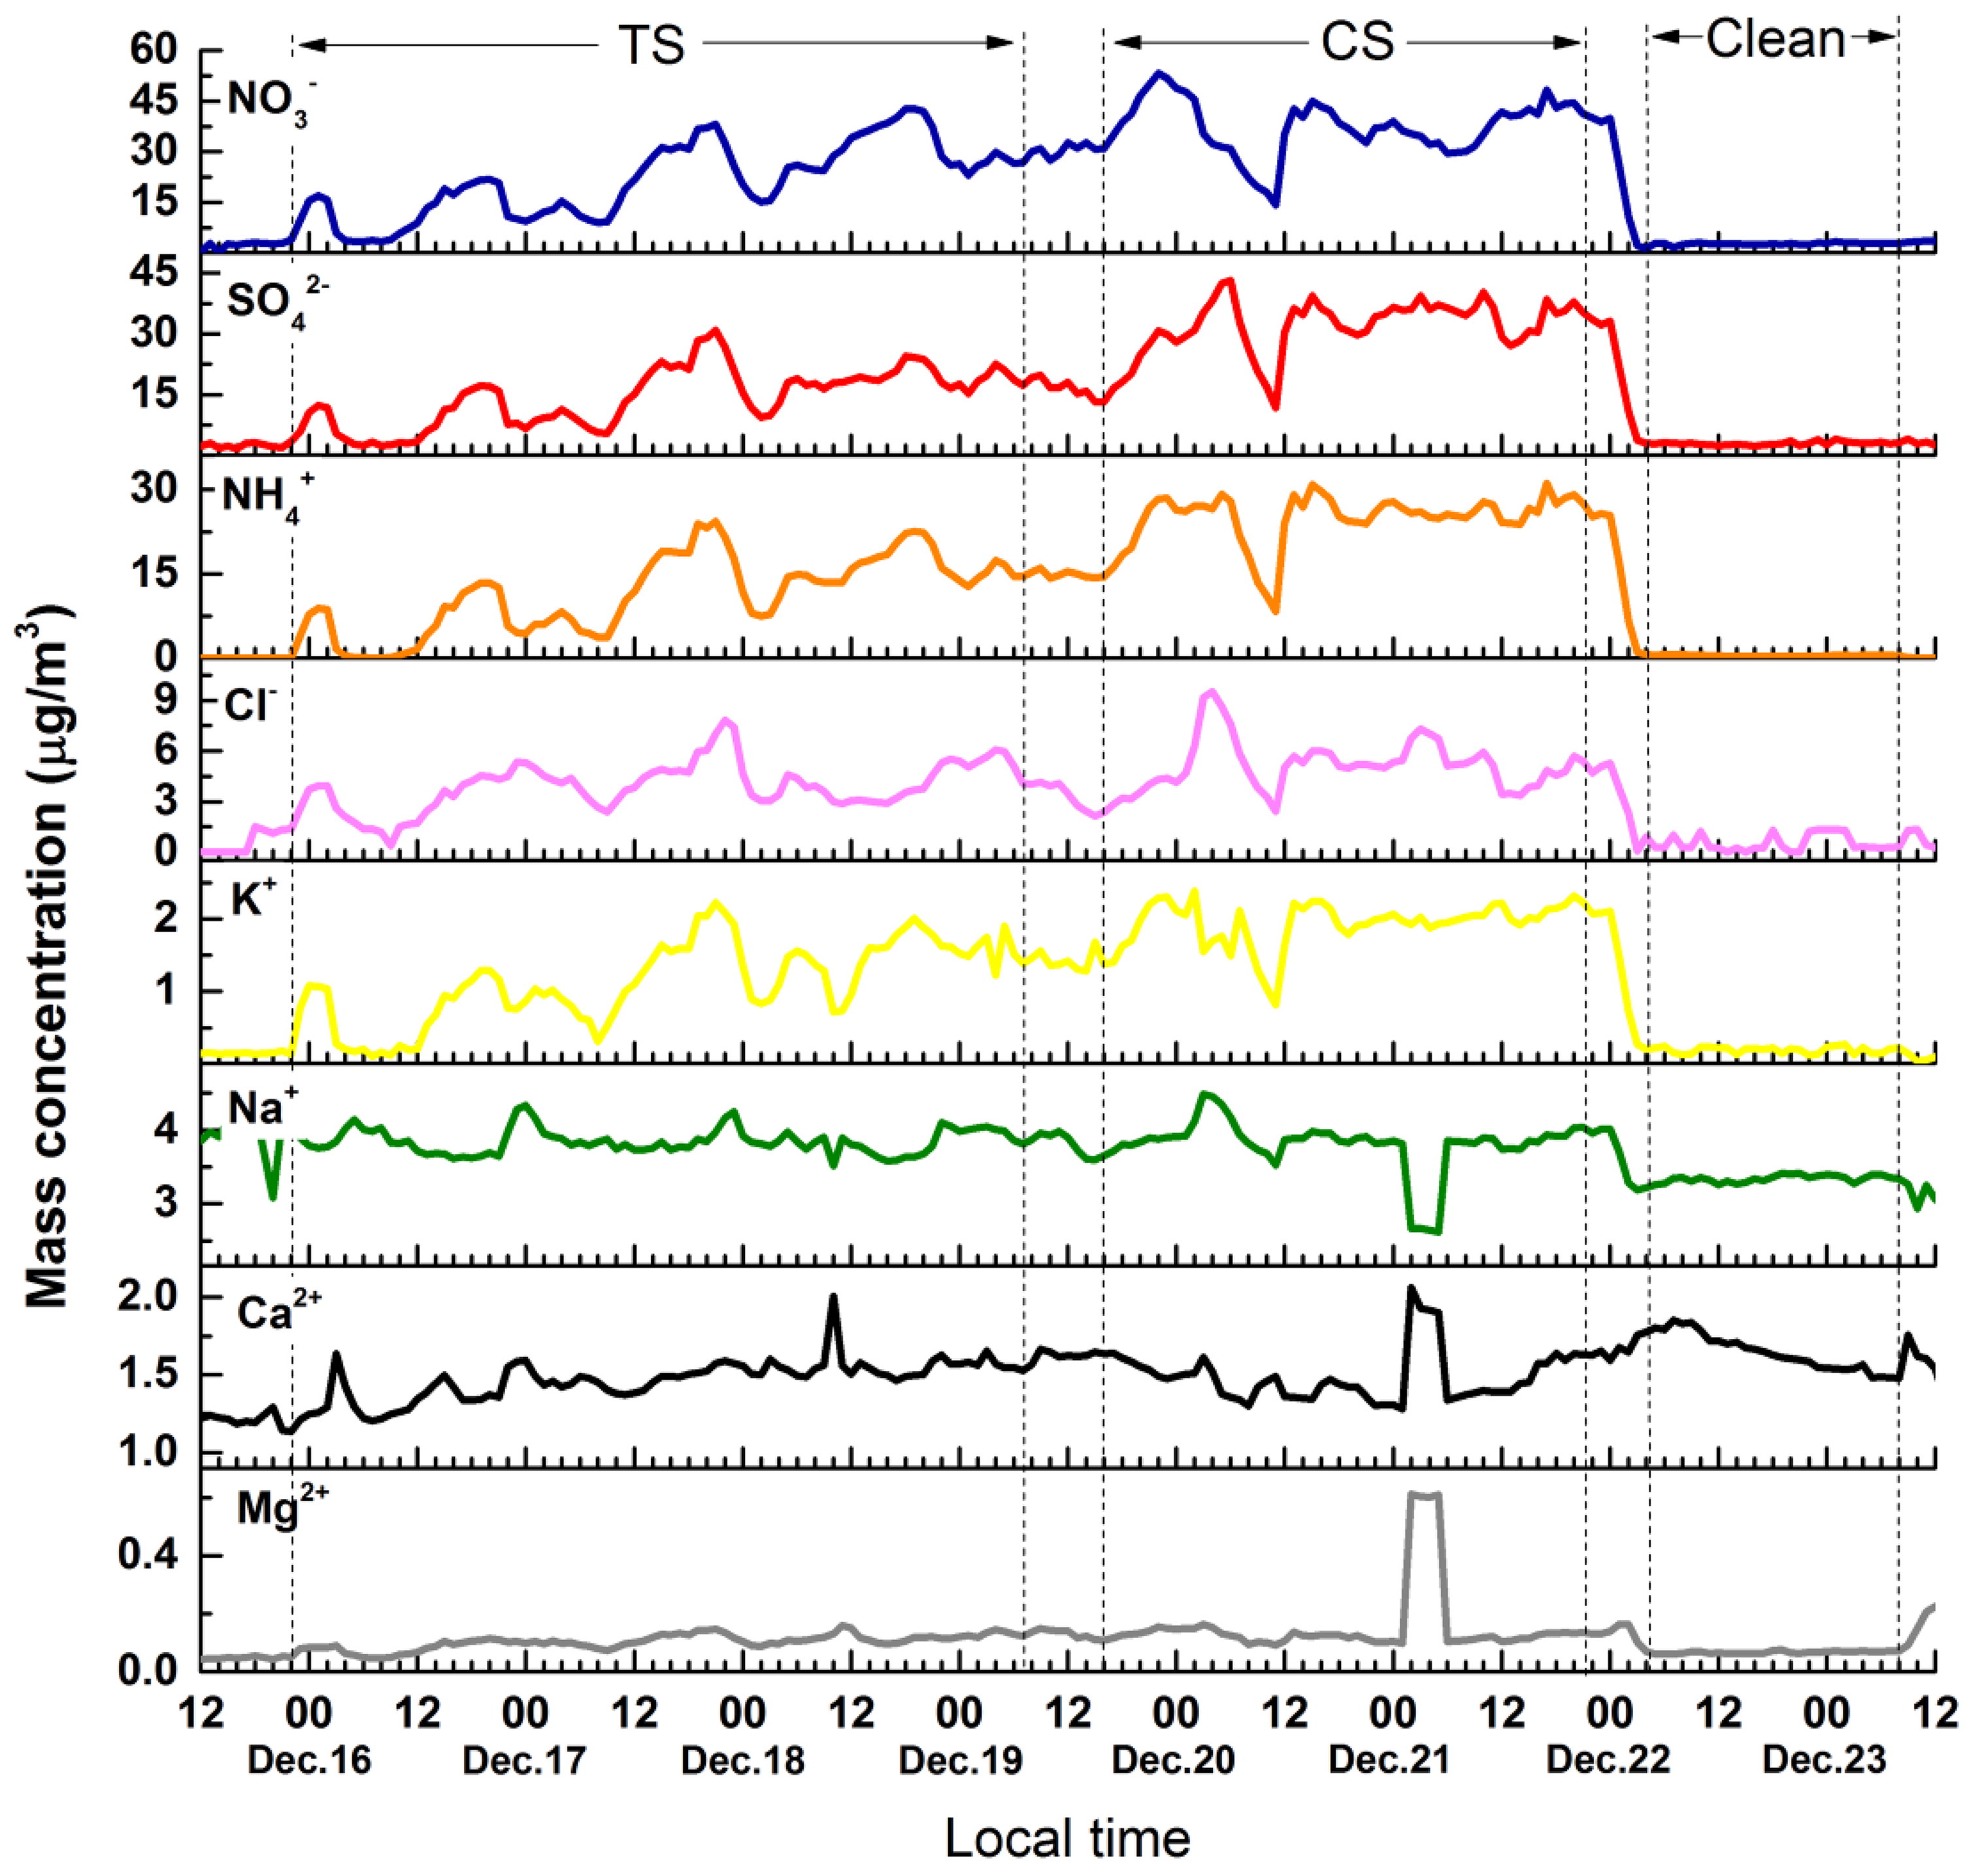
Fig. 3.
Temporal variations of major water-soluble inorganic ions in PM2.5.
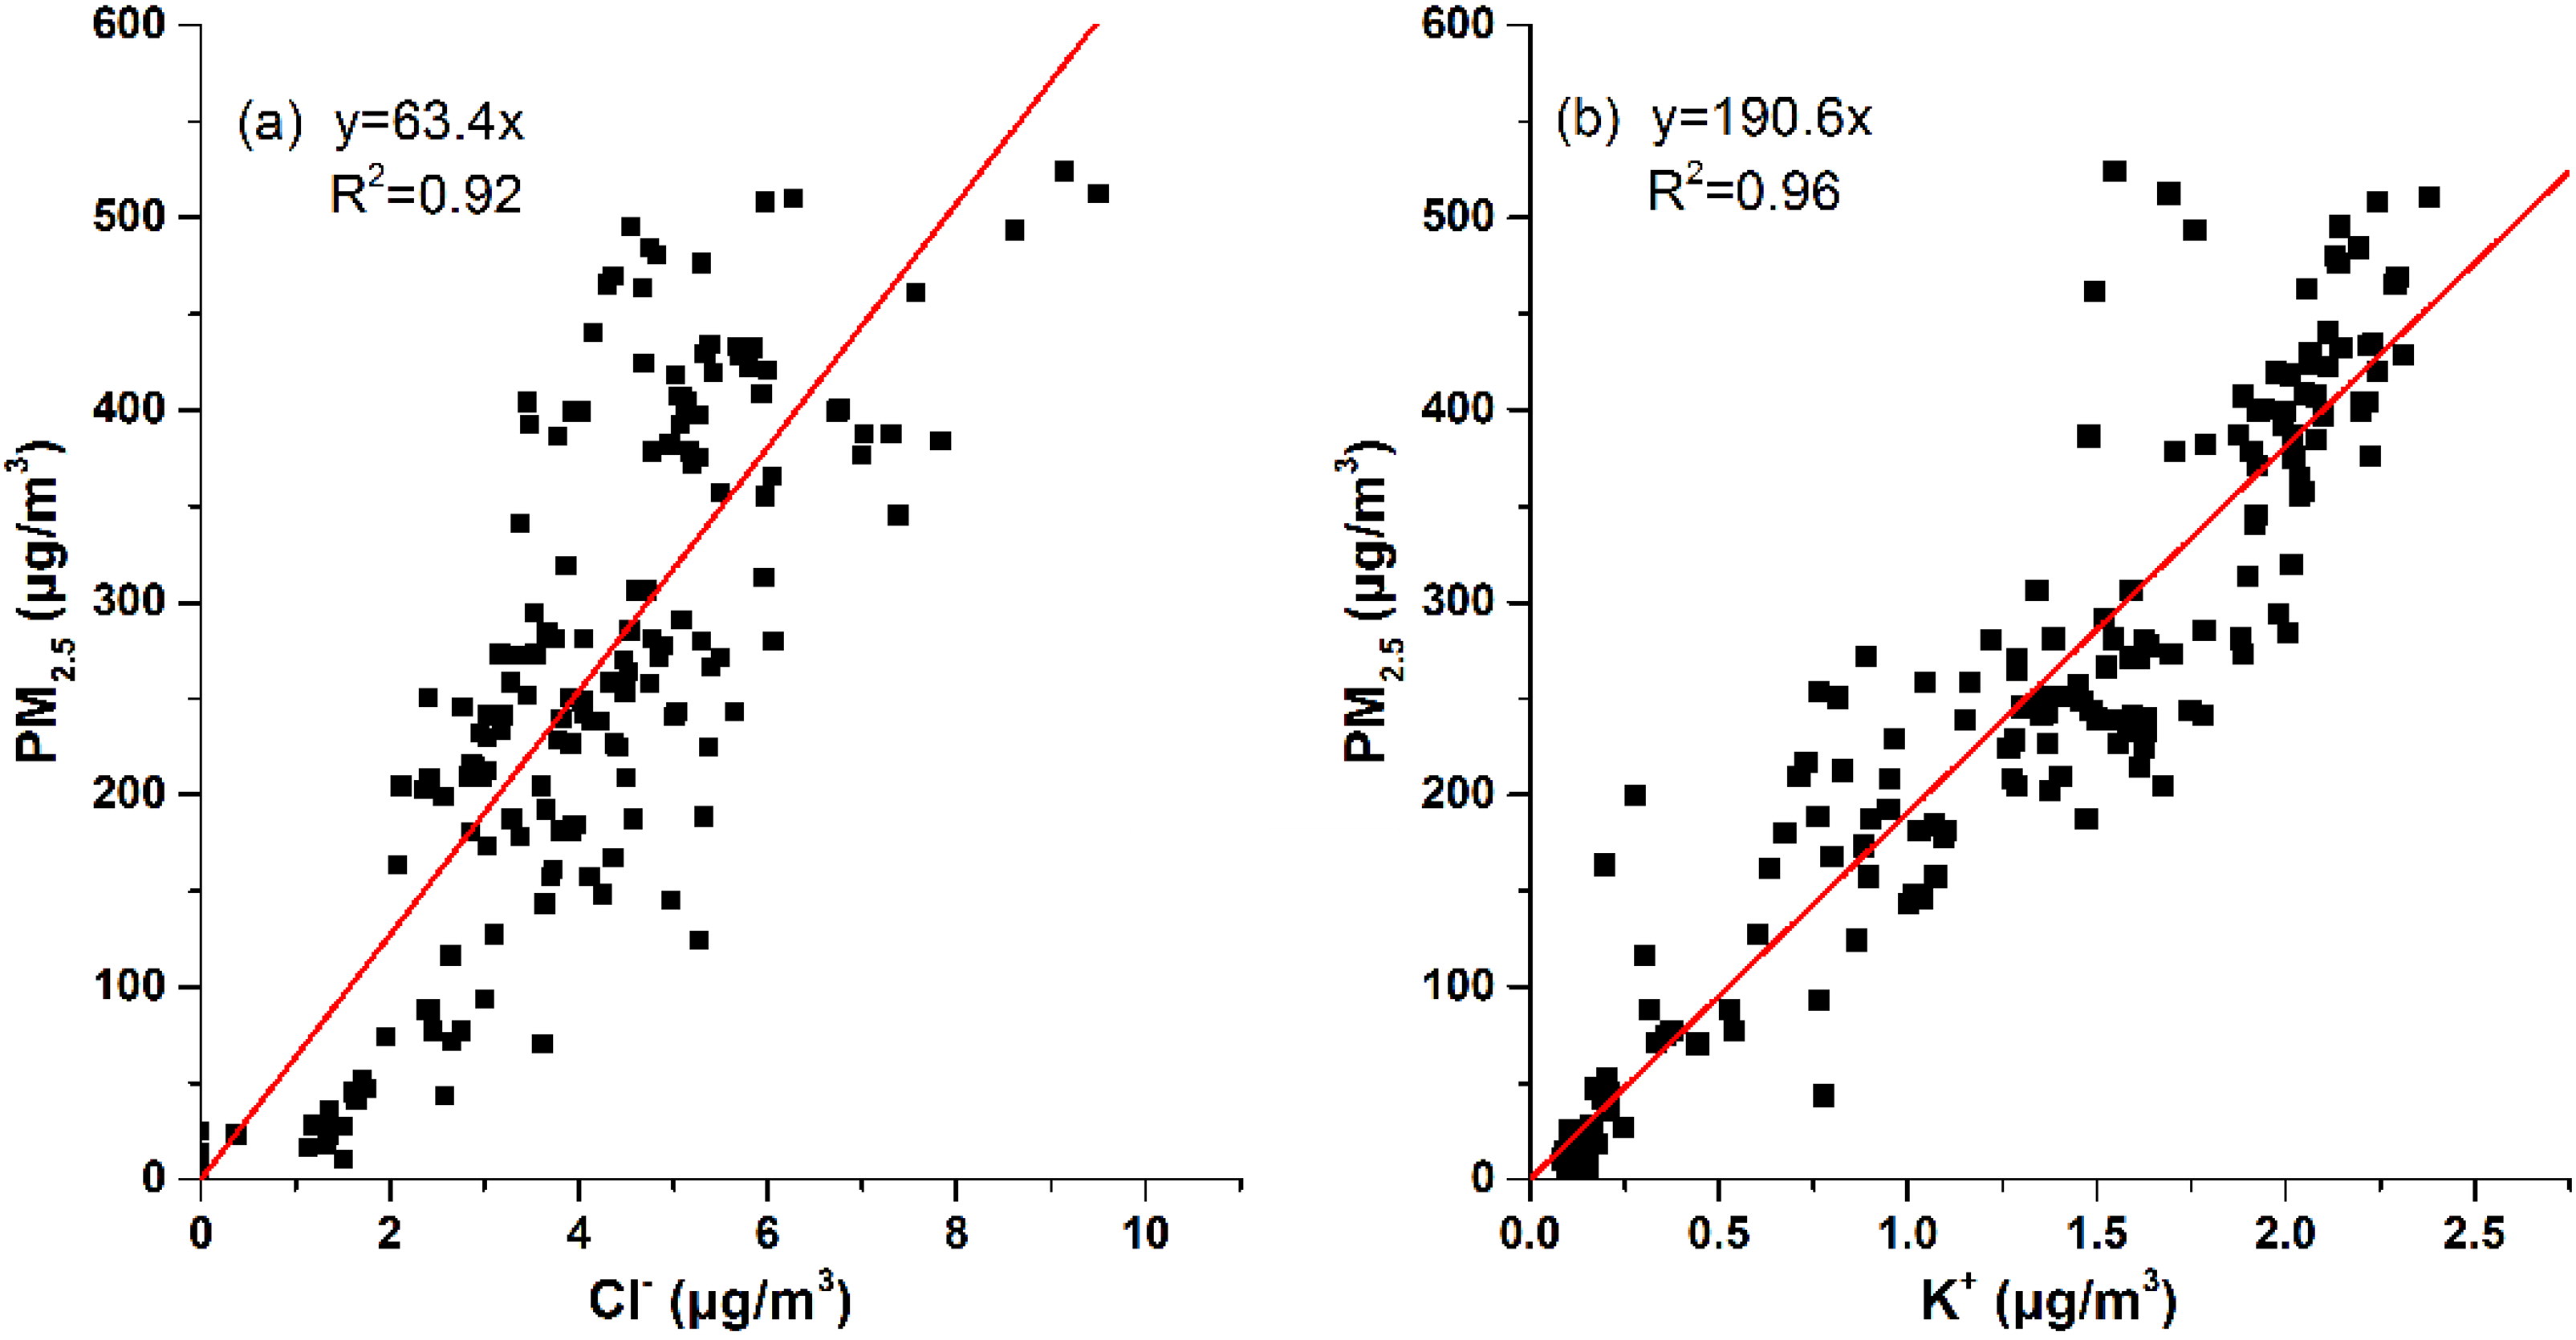
Fig. 4.
Correlation between PM2.5 and (a) Cl–, (b) K+ during the HPE on 15–22 December 2016 in Beijing.
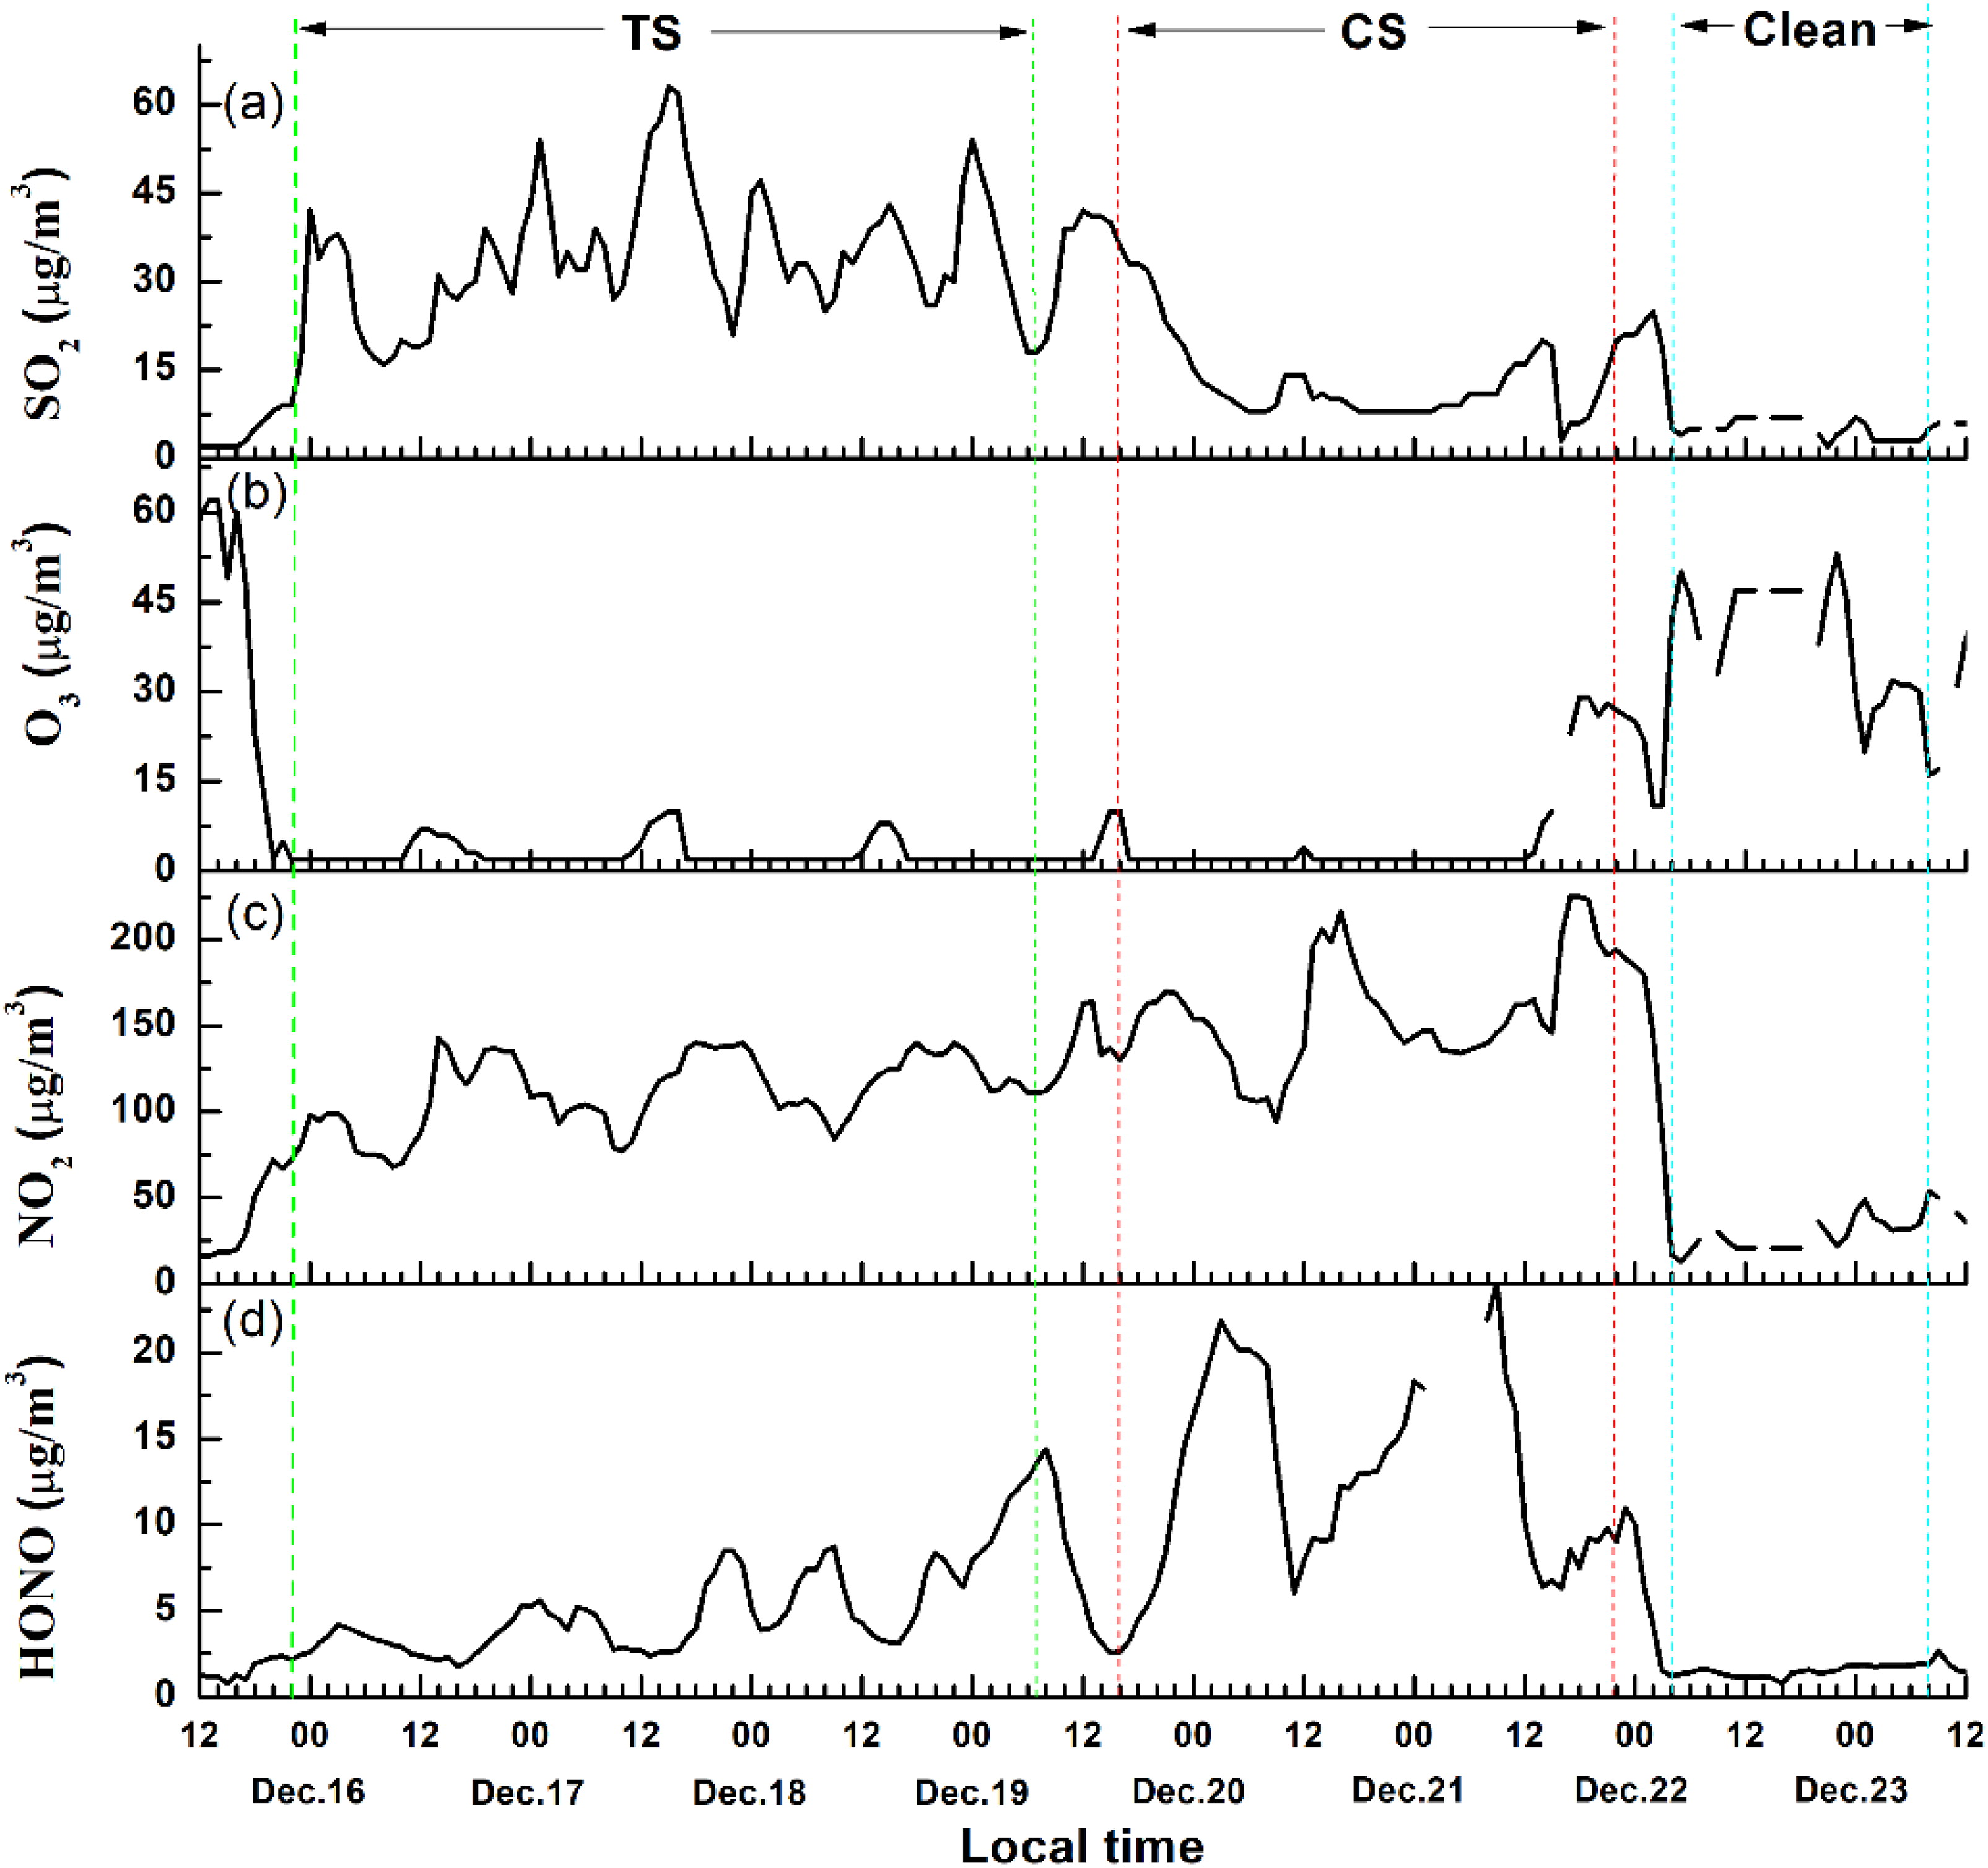
Fig. 5.
Temporal variations of the mass concentrations of gaseous SO2, O3, NO2, and HONO during the observation period.
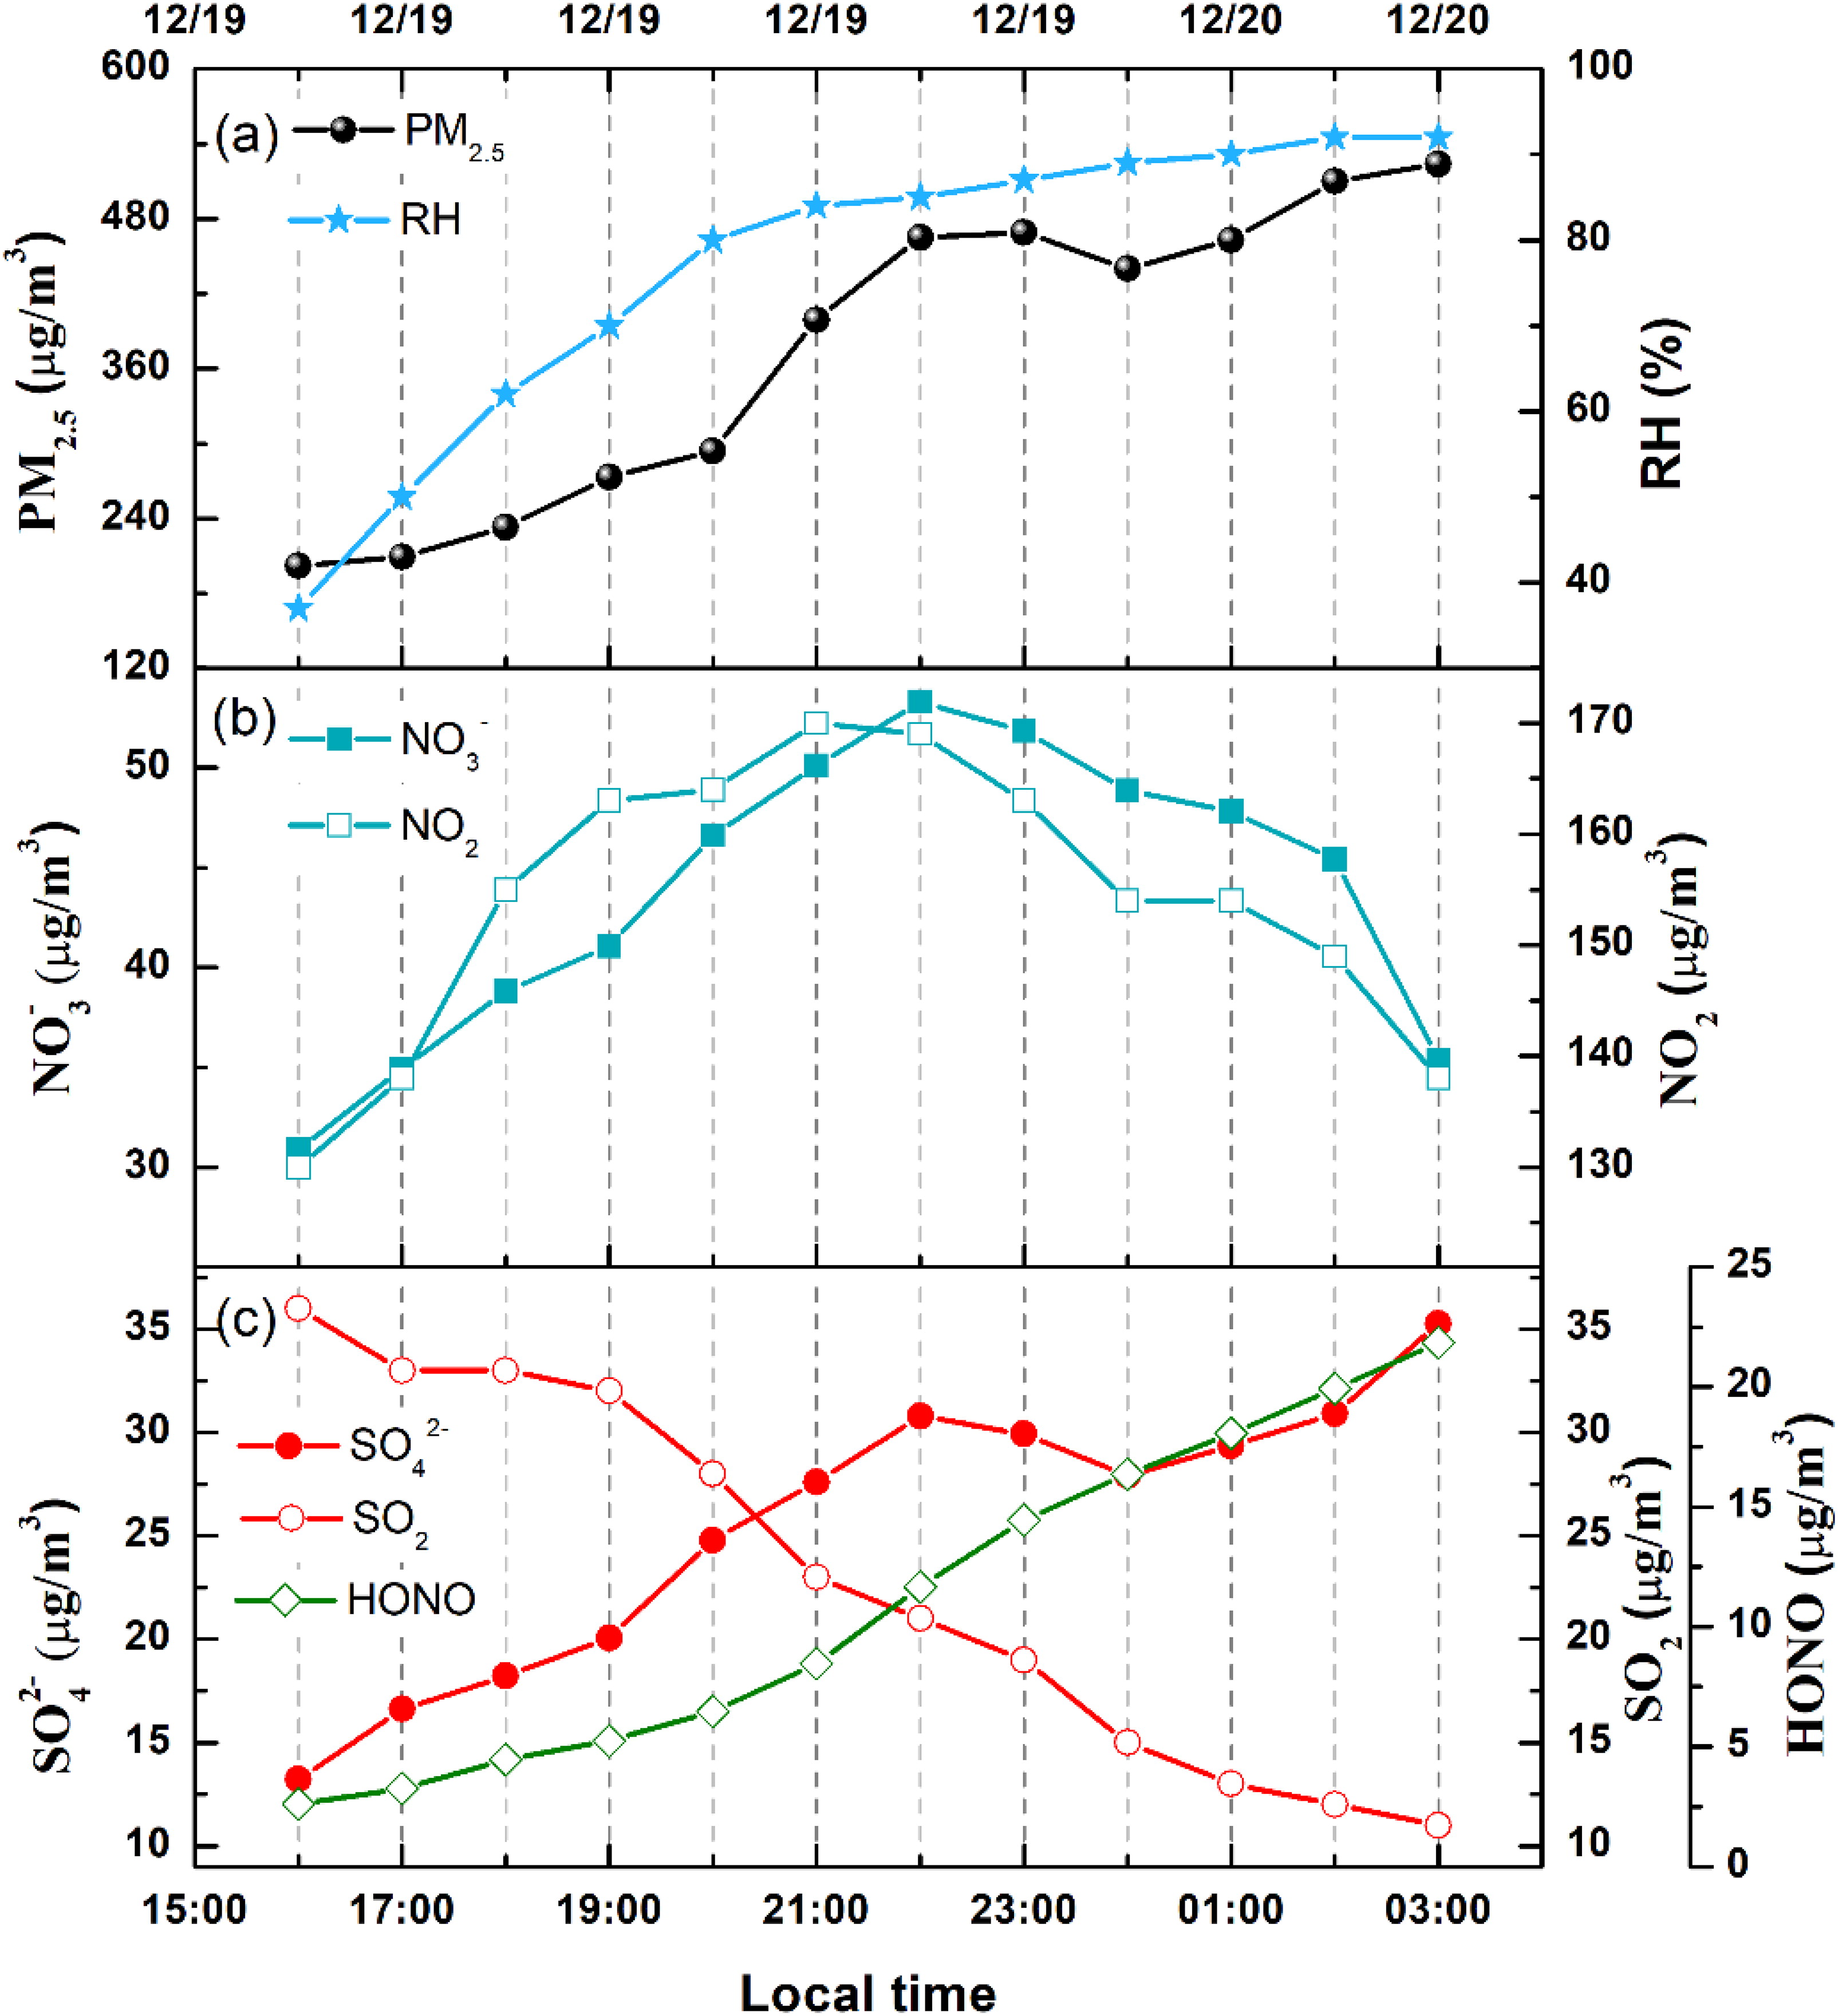
Fig. 6.
Time series for the (a) PM2.5 mass concentration and ambient RH, (b) nitrate and nitrogen dioxide, (c) sulfate, sulfur dioxide, and HONO in REG3.
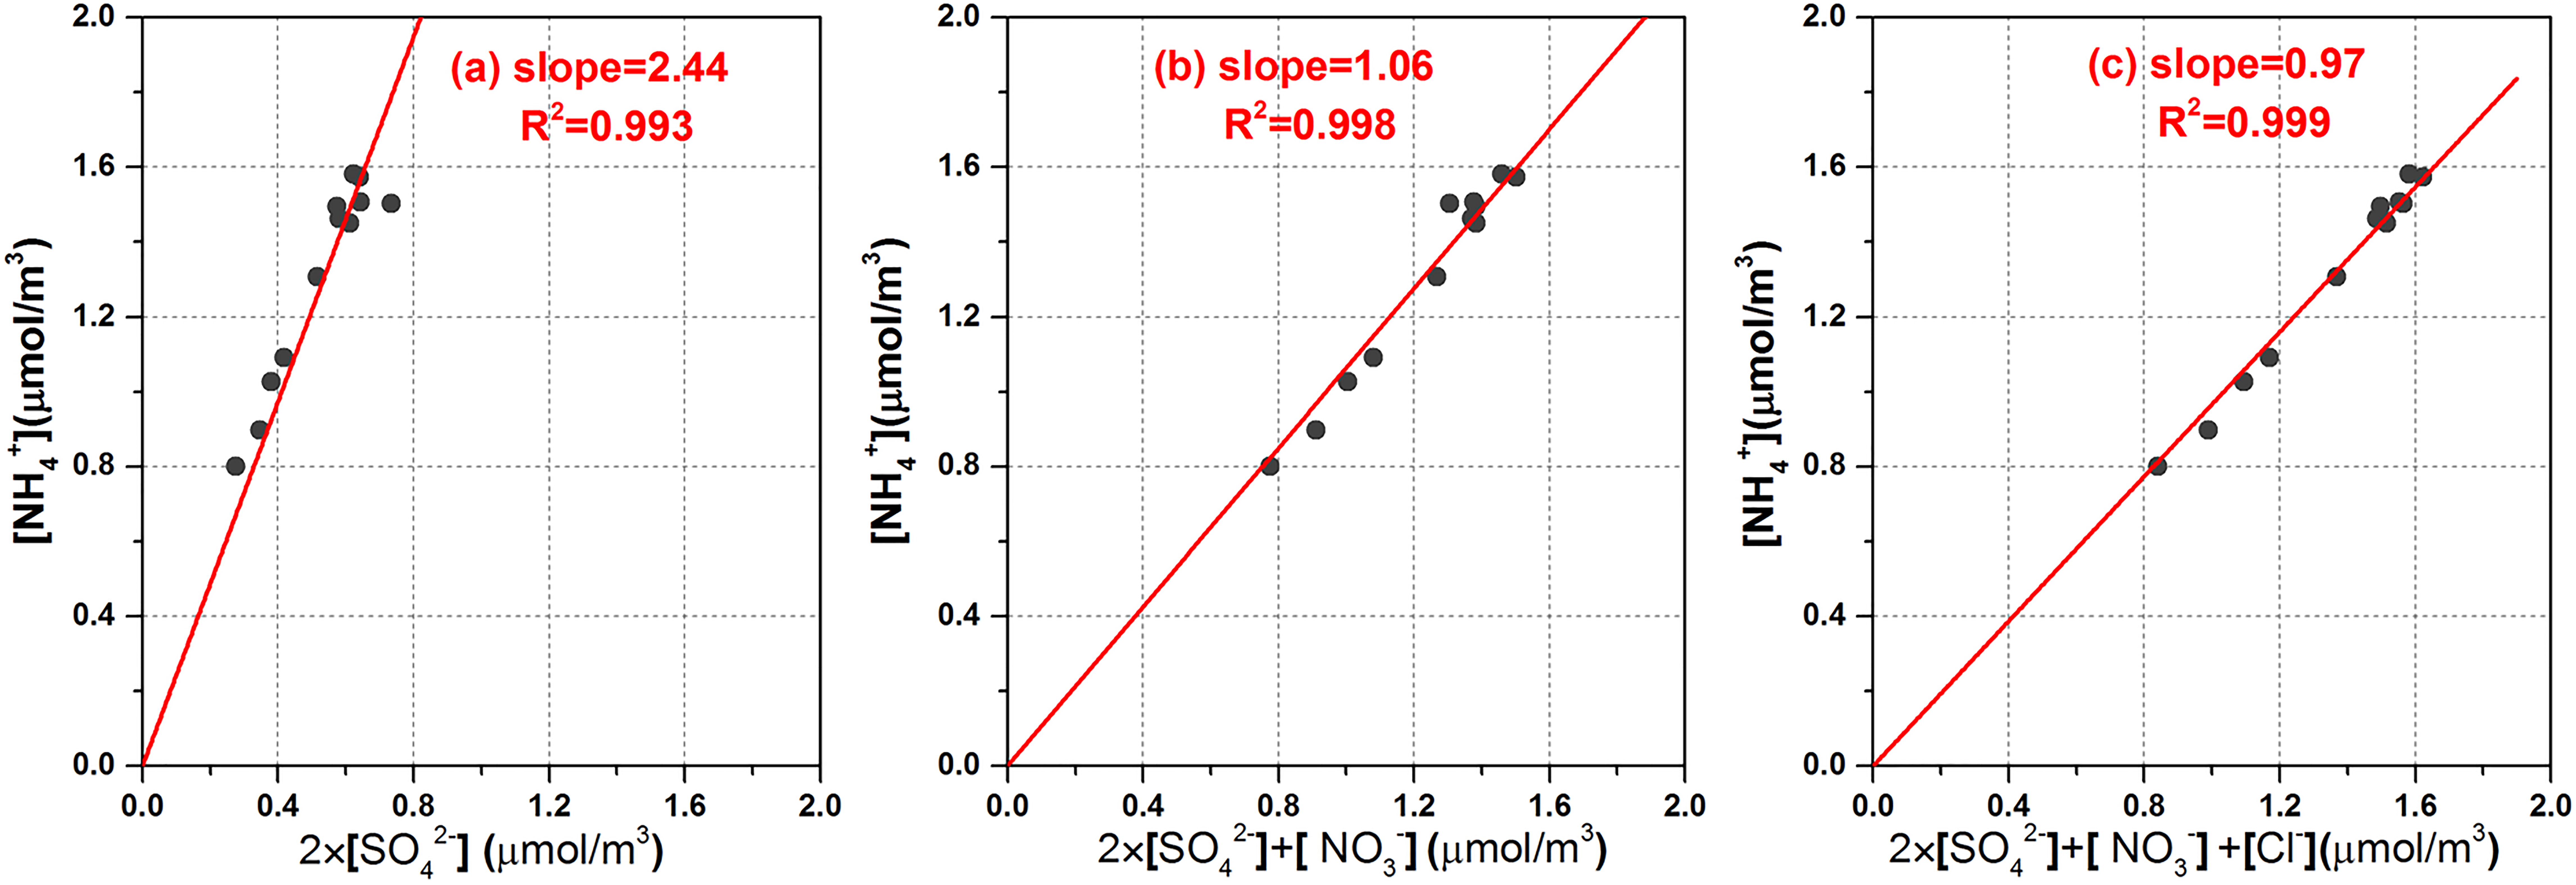
Fig. 7.
Scatter plots of particulate [NH4 +] against 2 × [SO4 2–], 2 × [SO4 2–] + [NO3 –], 2 × [SO4 2–] + [NO3 –] + [Cl–] in REG 3. [] refers to molar concentration.
Table 3.
Deliquescence relative humidity for (NH4)2SO4, NH4NO3, and NH4Cl in REG3.
[i] aThe values were originated from reference (Fountoukis and Nenes, 2007).
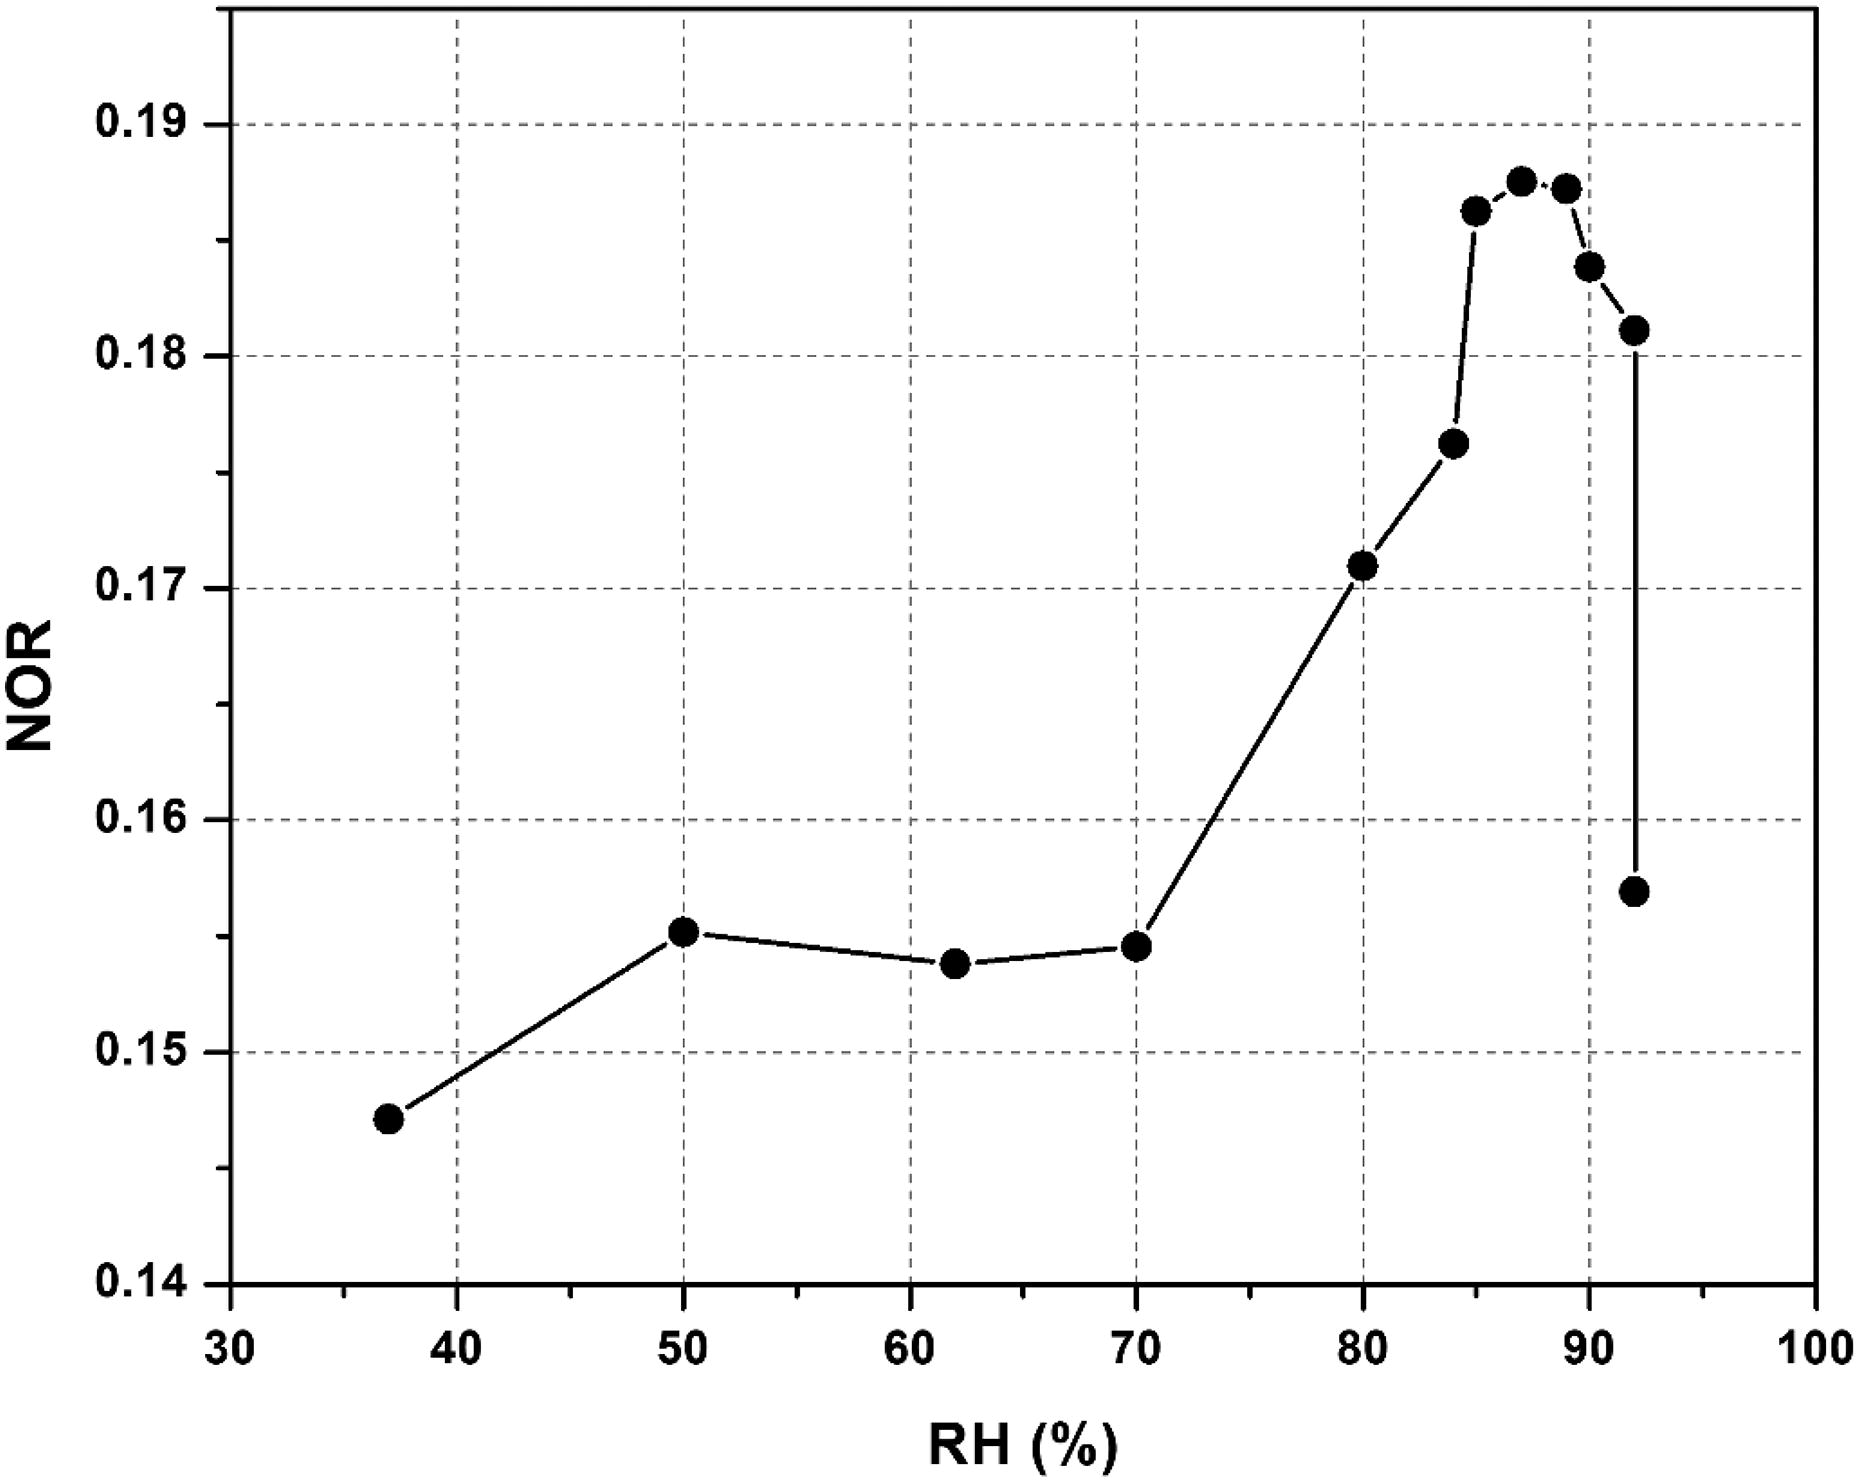
Fig. 8.
The relationship between the NOR and the RH in the REG3.
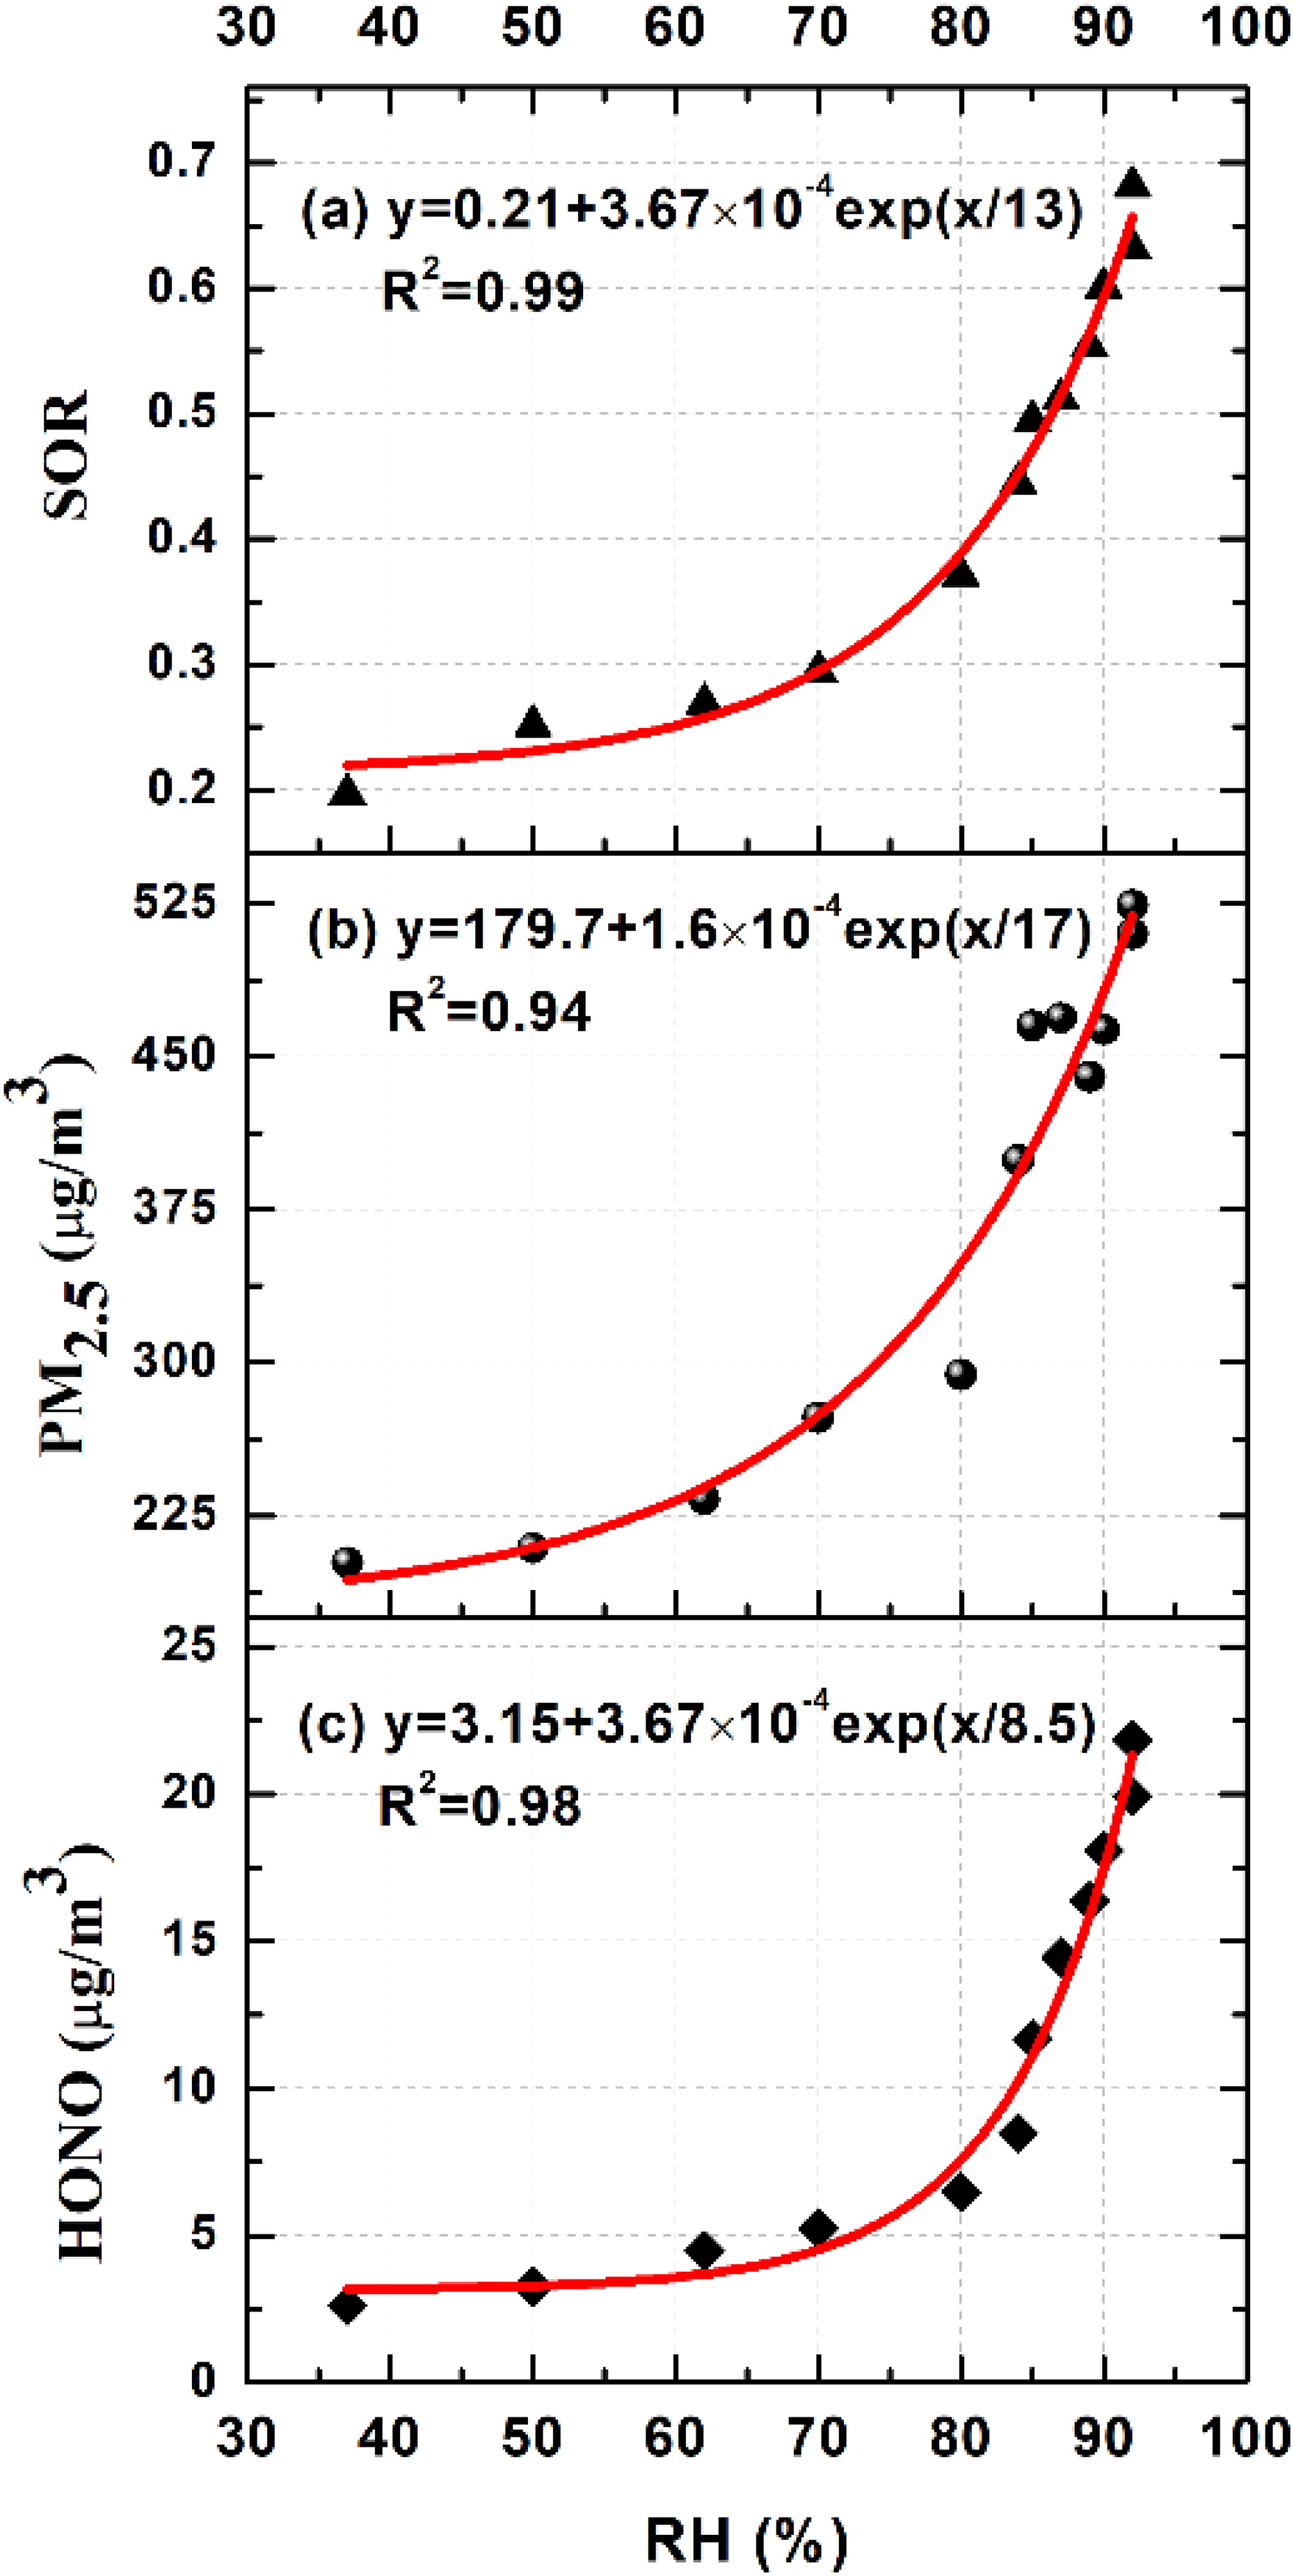
Fig. 9.
Relationship between RH and (a) SOR, (b) PM2.5, and (c) HONO in REG 3.
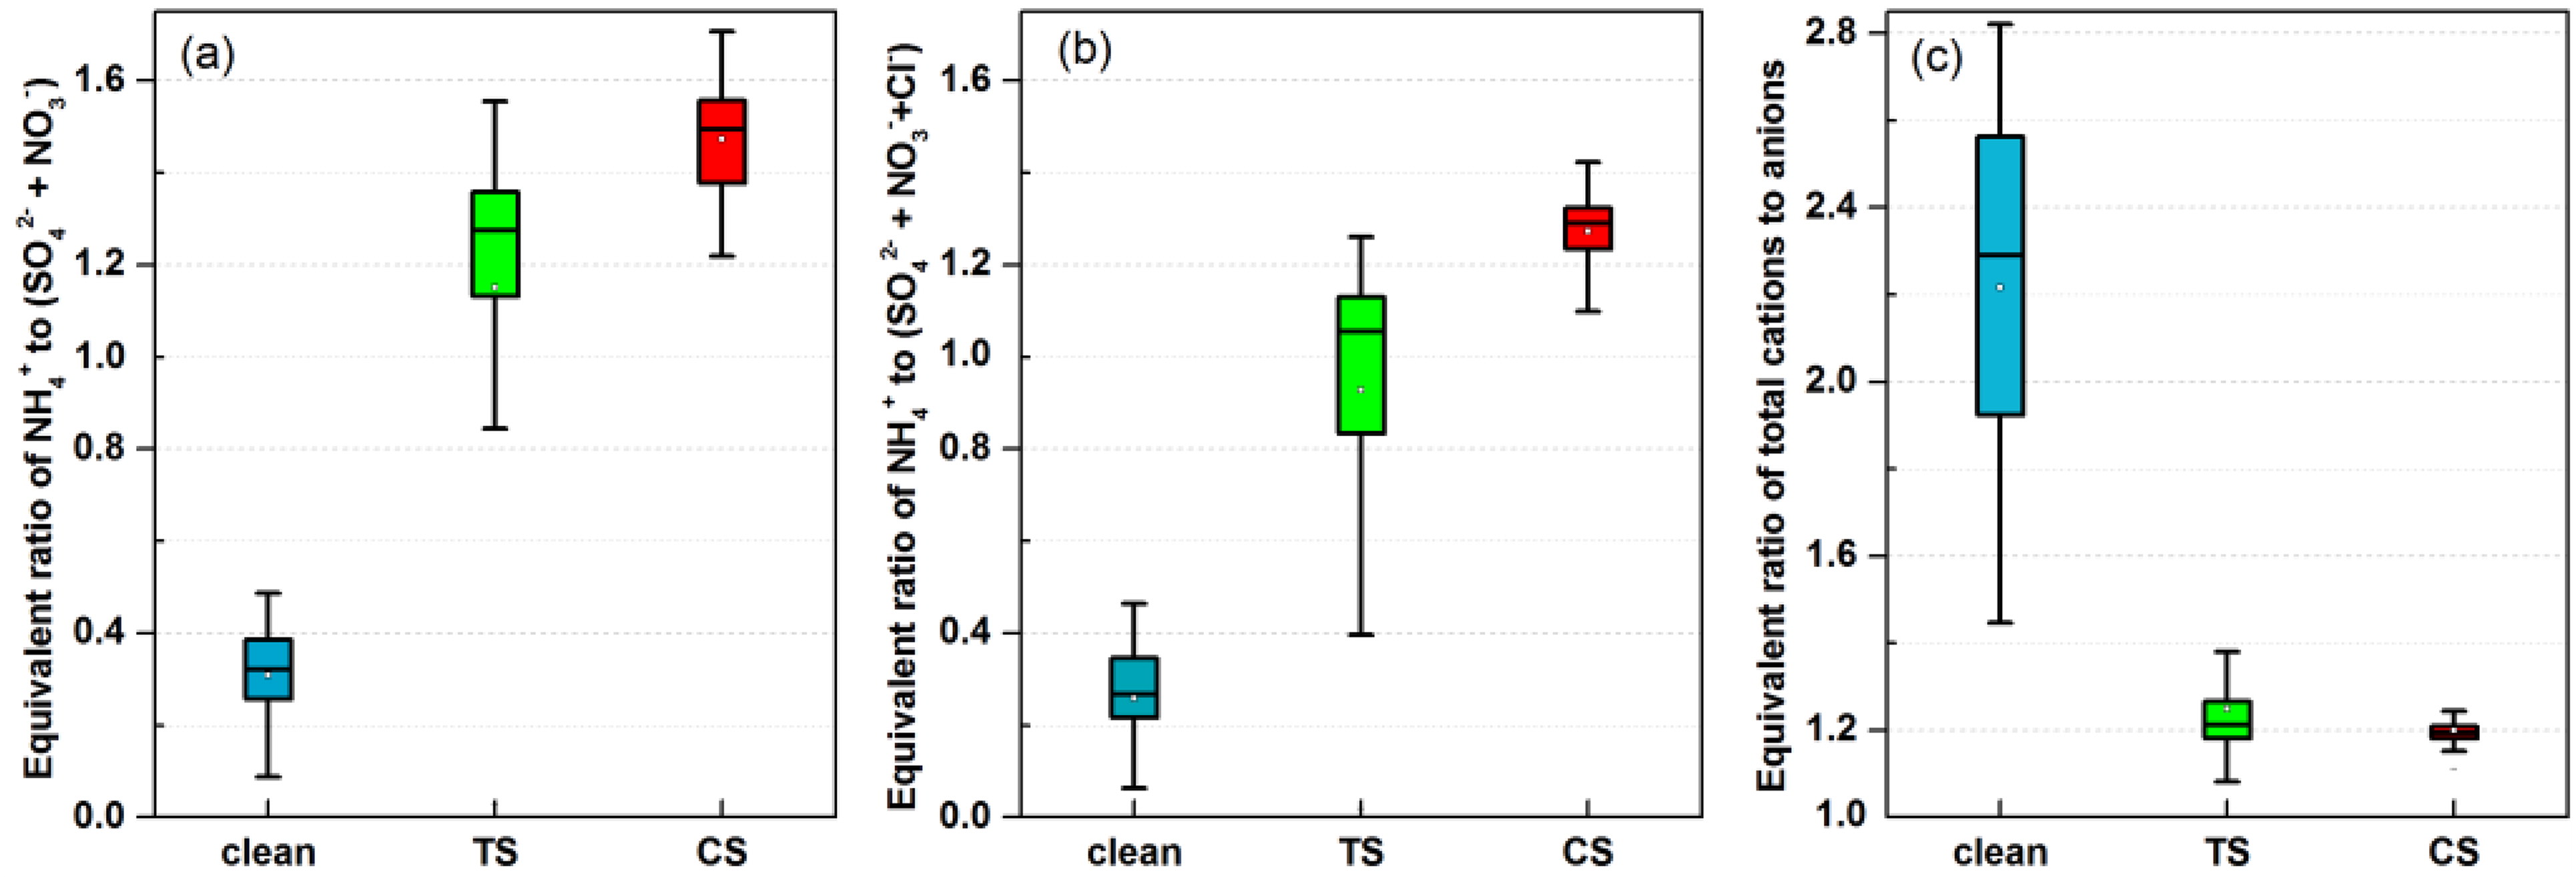
Fig. 10.
Equivalent ratio of (a) ammonium (NH4 +) to the sum of SO4 2− and NO3 –, (b) NH4 + to the sum of SO4 2−, NO3 −, and Cl−, (c) total cations to anions in PM2.5. The top and bottom of the vertical line for each box correspond to the 95th and 5th percentiles, respectively. While the top, middle, and bottom horizontal lines of the box mark the 75th, 50th, and 25th percentiles of the data range. The white dot in each box represents the mean value.