
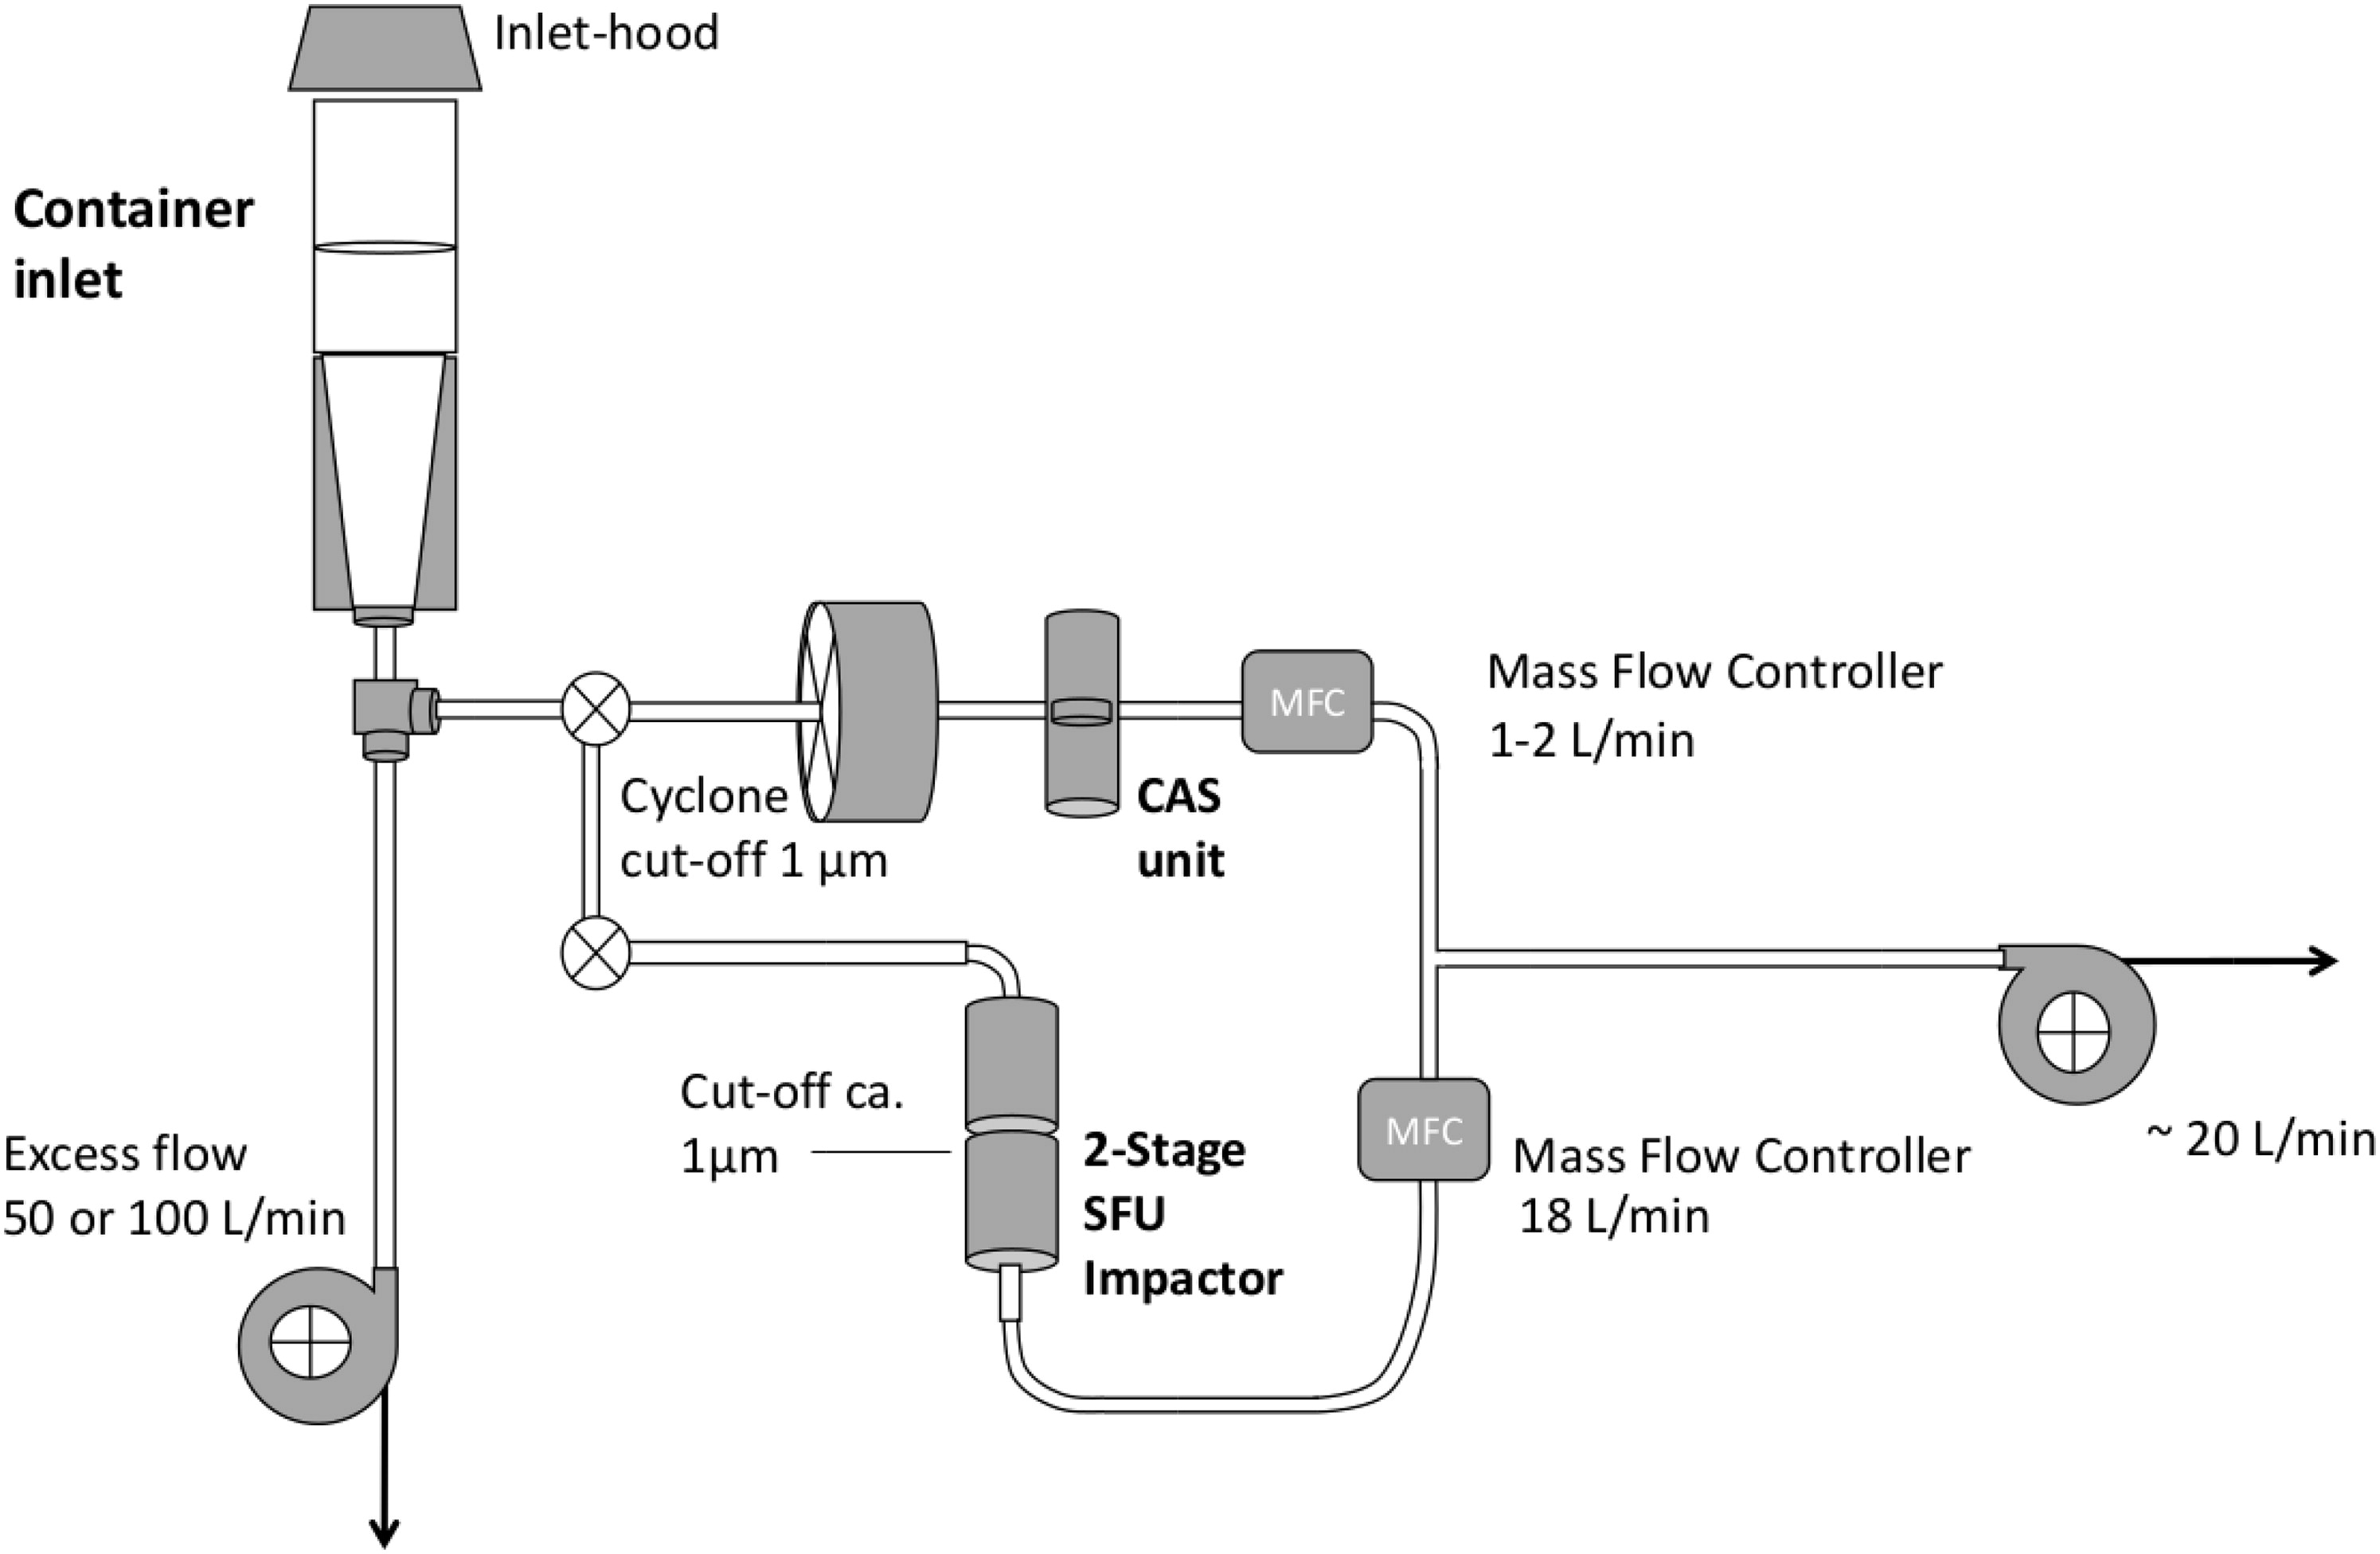
Fig. 1.
Schematic arrangement of samplers. CAS unit: 35 mm Nuclepore filter cassette. 2-Stage SFU impactor: 47 mm; open-faced 2-stage filter sampler with ∼1 µm cut size. Inset in the top-right shows a photo of the set-up of the CAS and SFU sampling lines.
Table 1.
Concentration of BC and selected cations and anions (ng m−3) at the Zeppelin observatory during the study period (01 January 2015 to 31 December 2015).
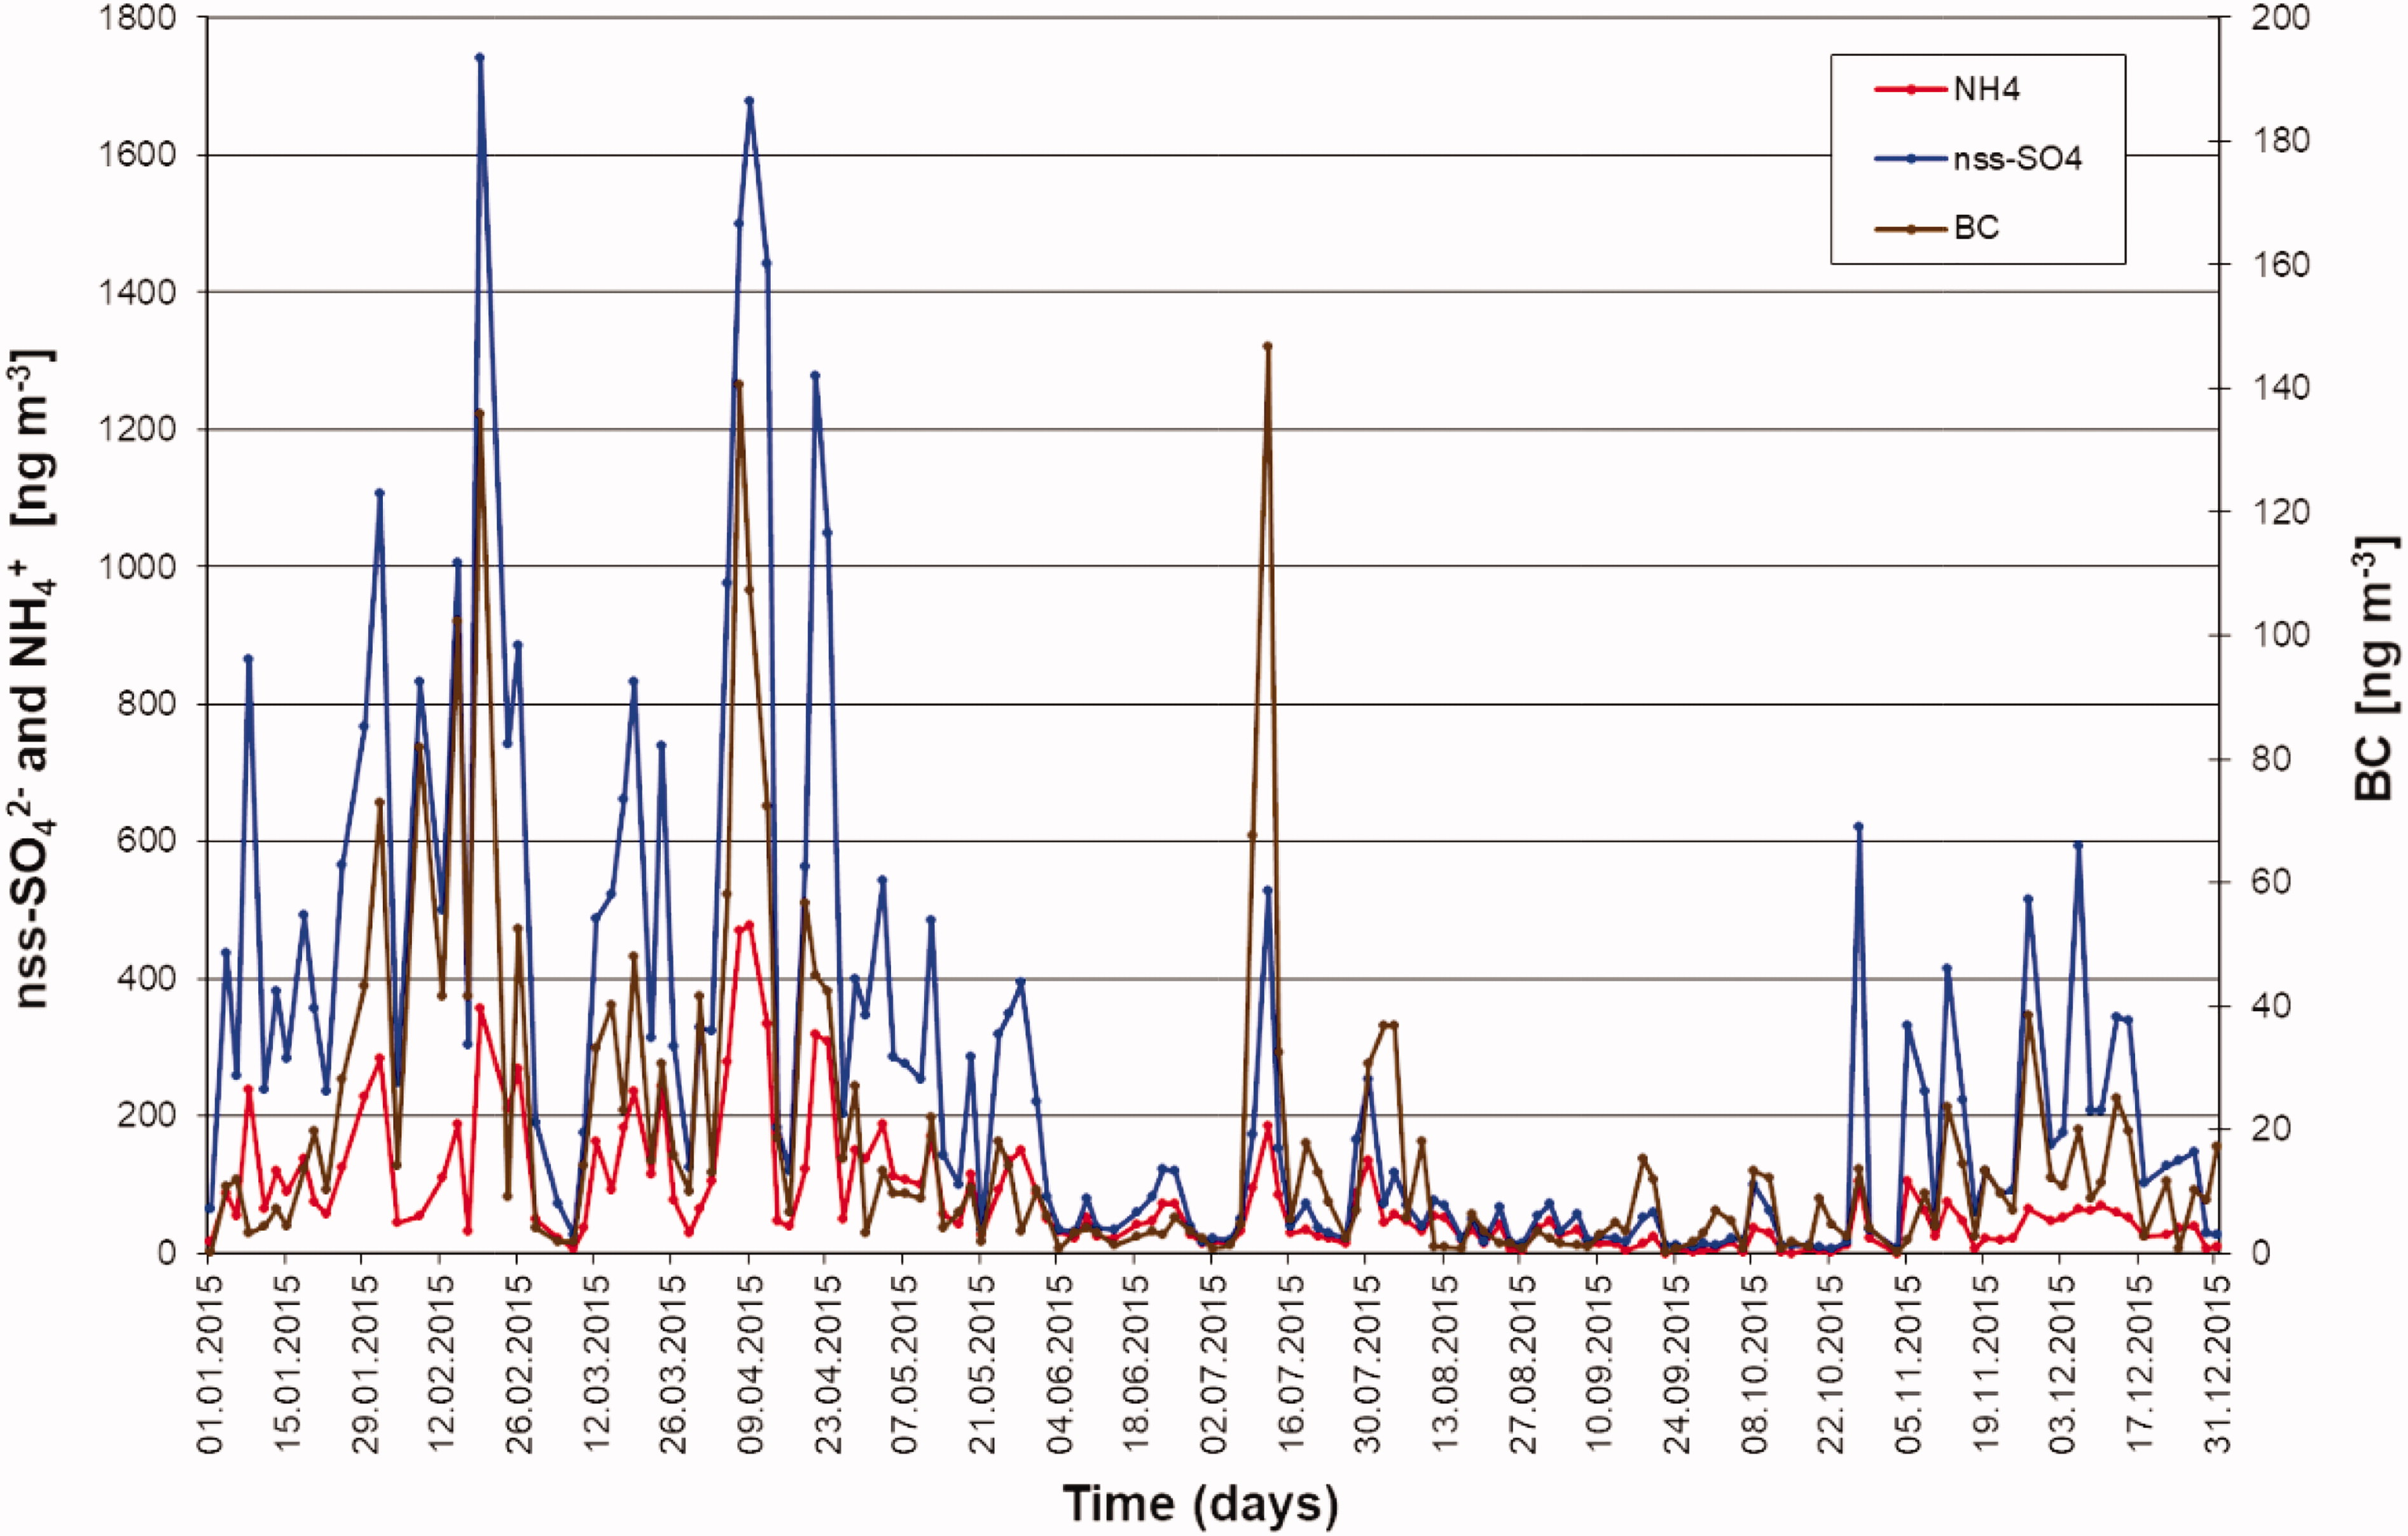
Fig. 2.
Concentrations of NH4 + (red line), nss-SO4 2− (blue line), and BC (brown line, second y-axis) measured during 2015 at the Zeppelin observatory.
Table 2.
Source attribution from the PMF analysis to the annual mean PM1 of 2015.
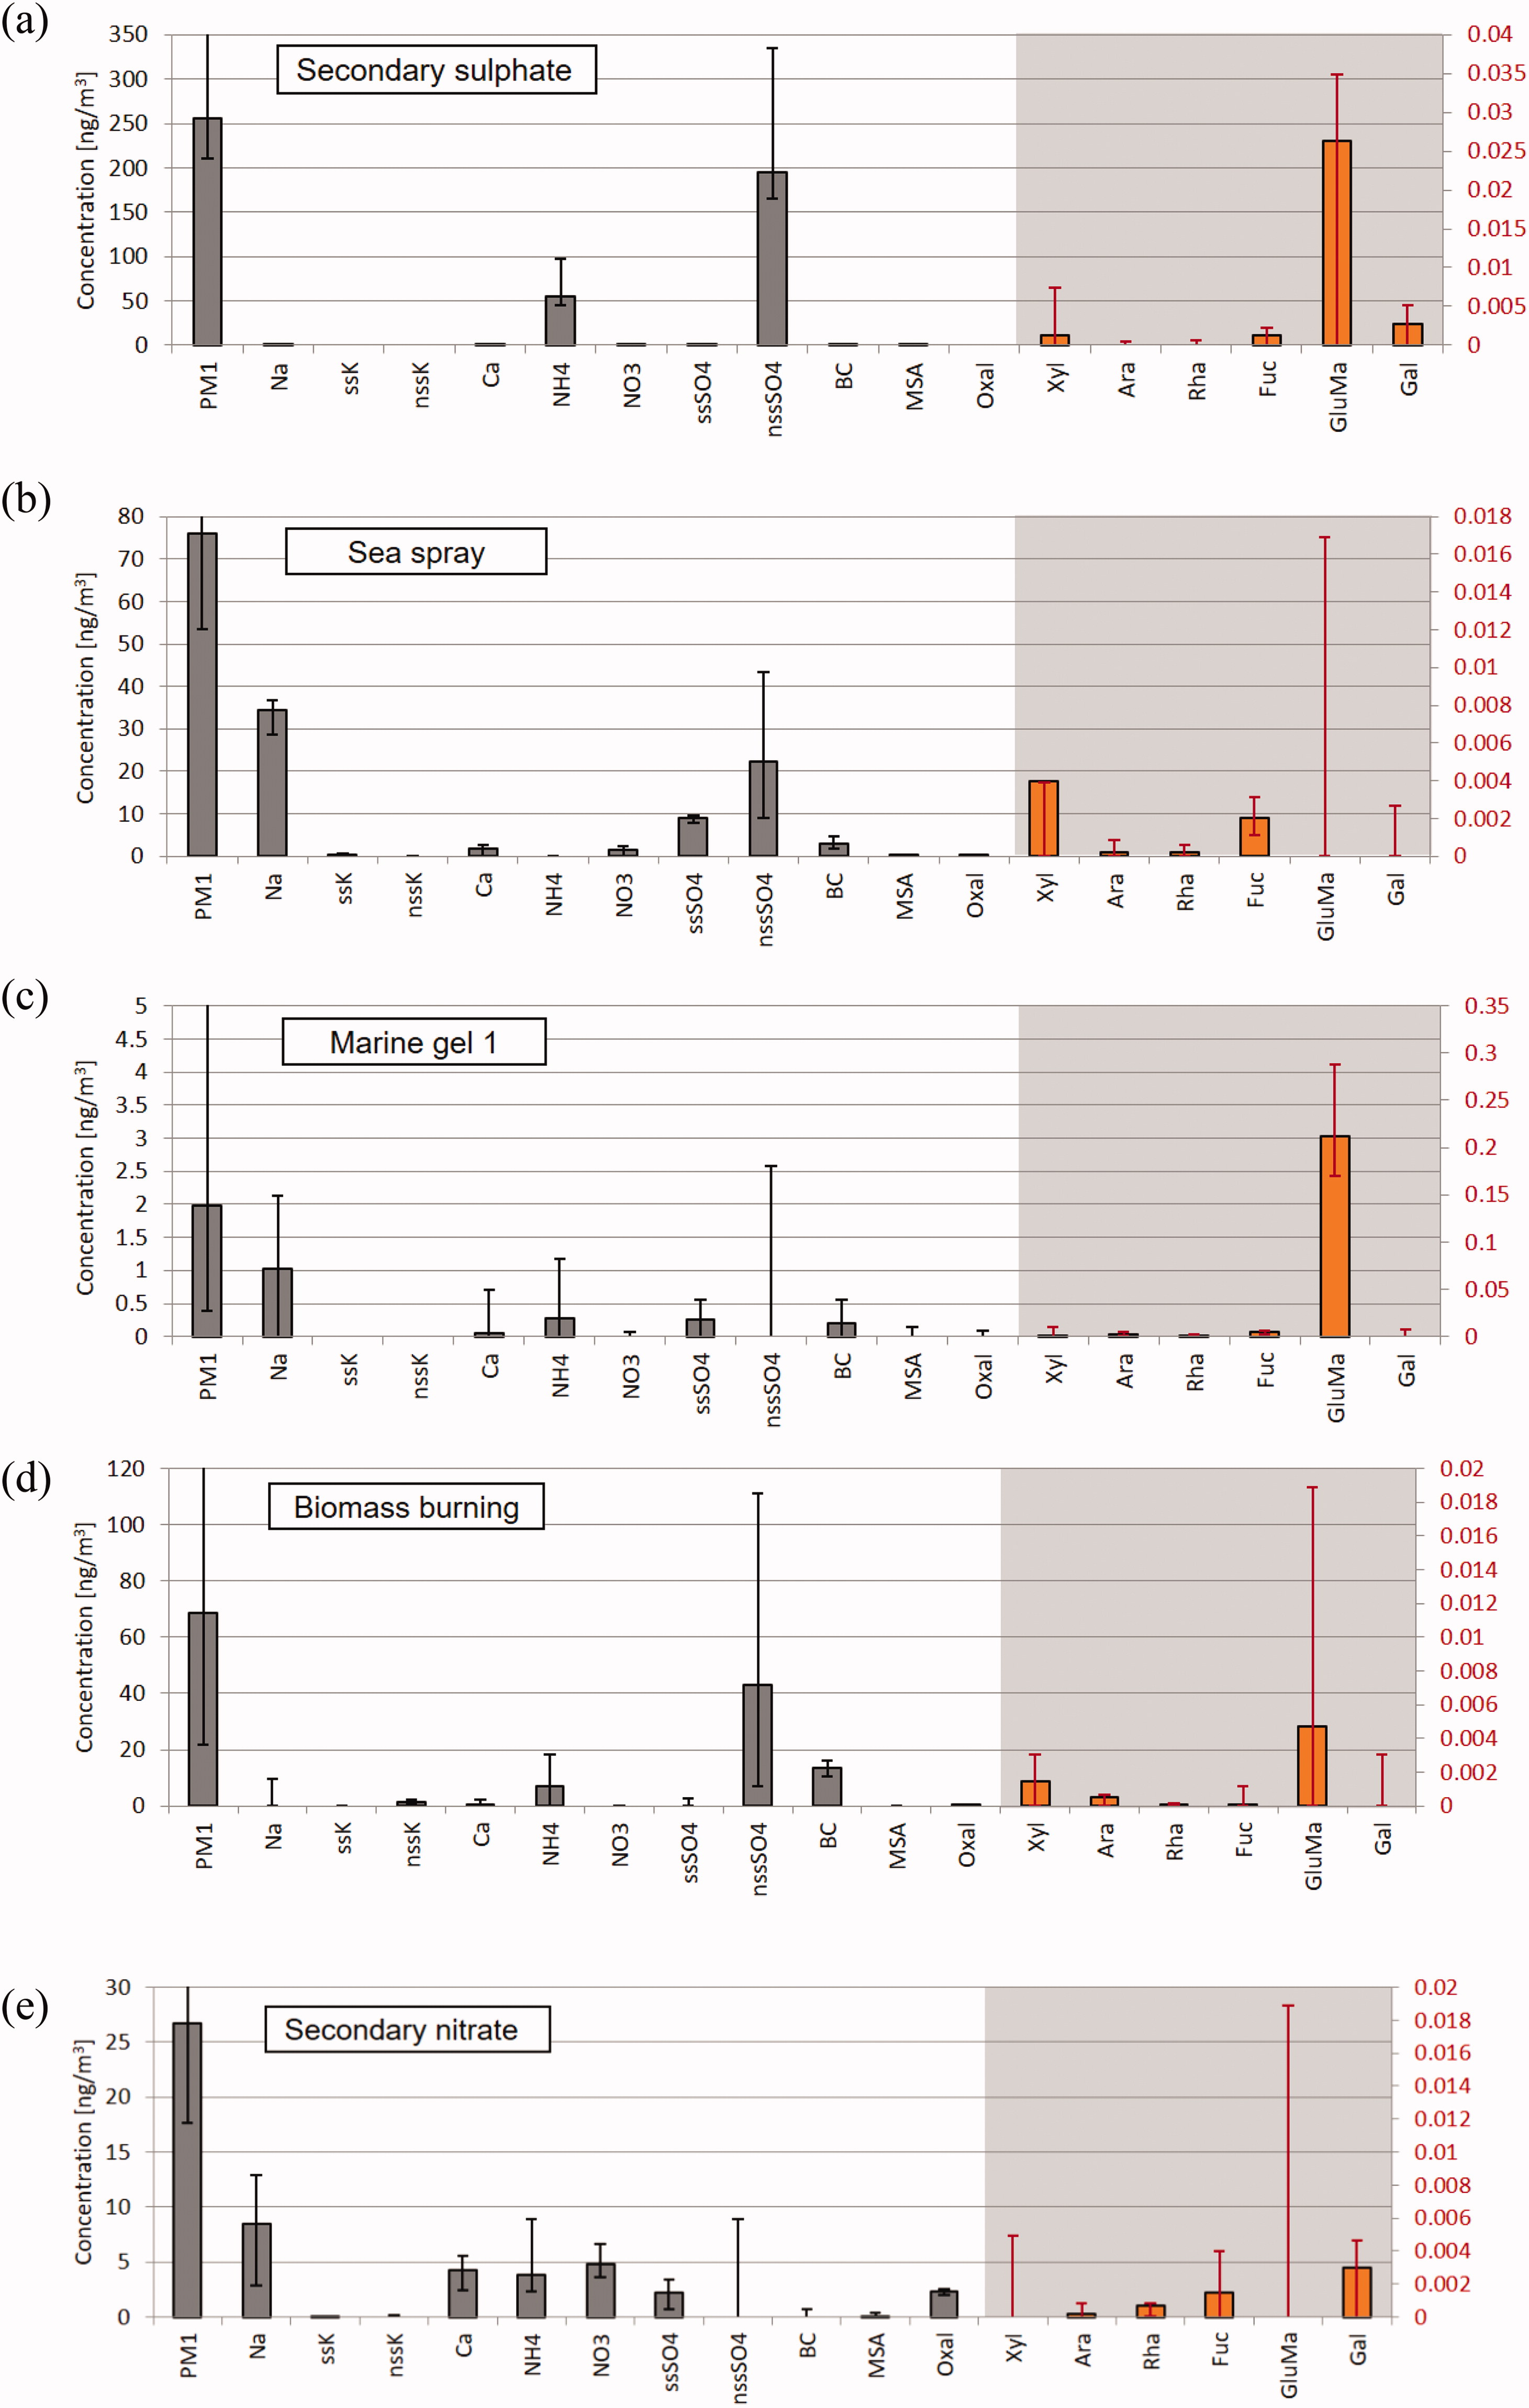
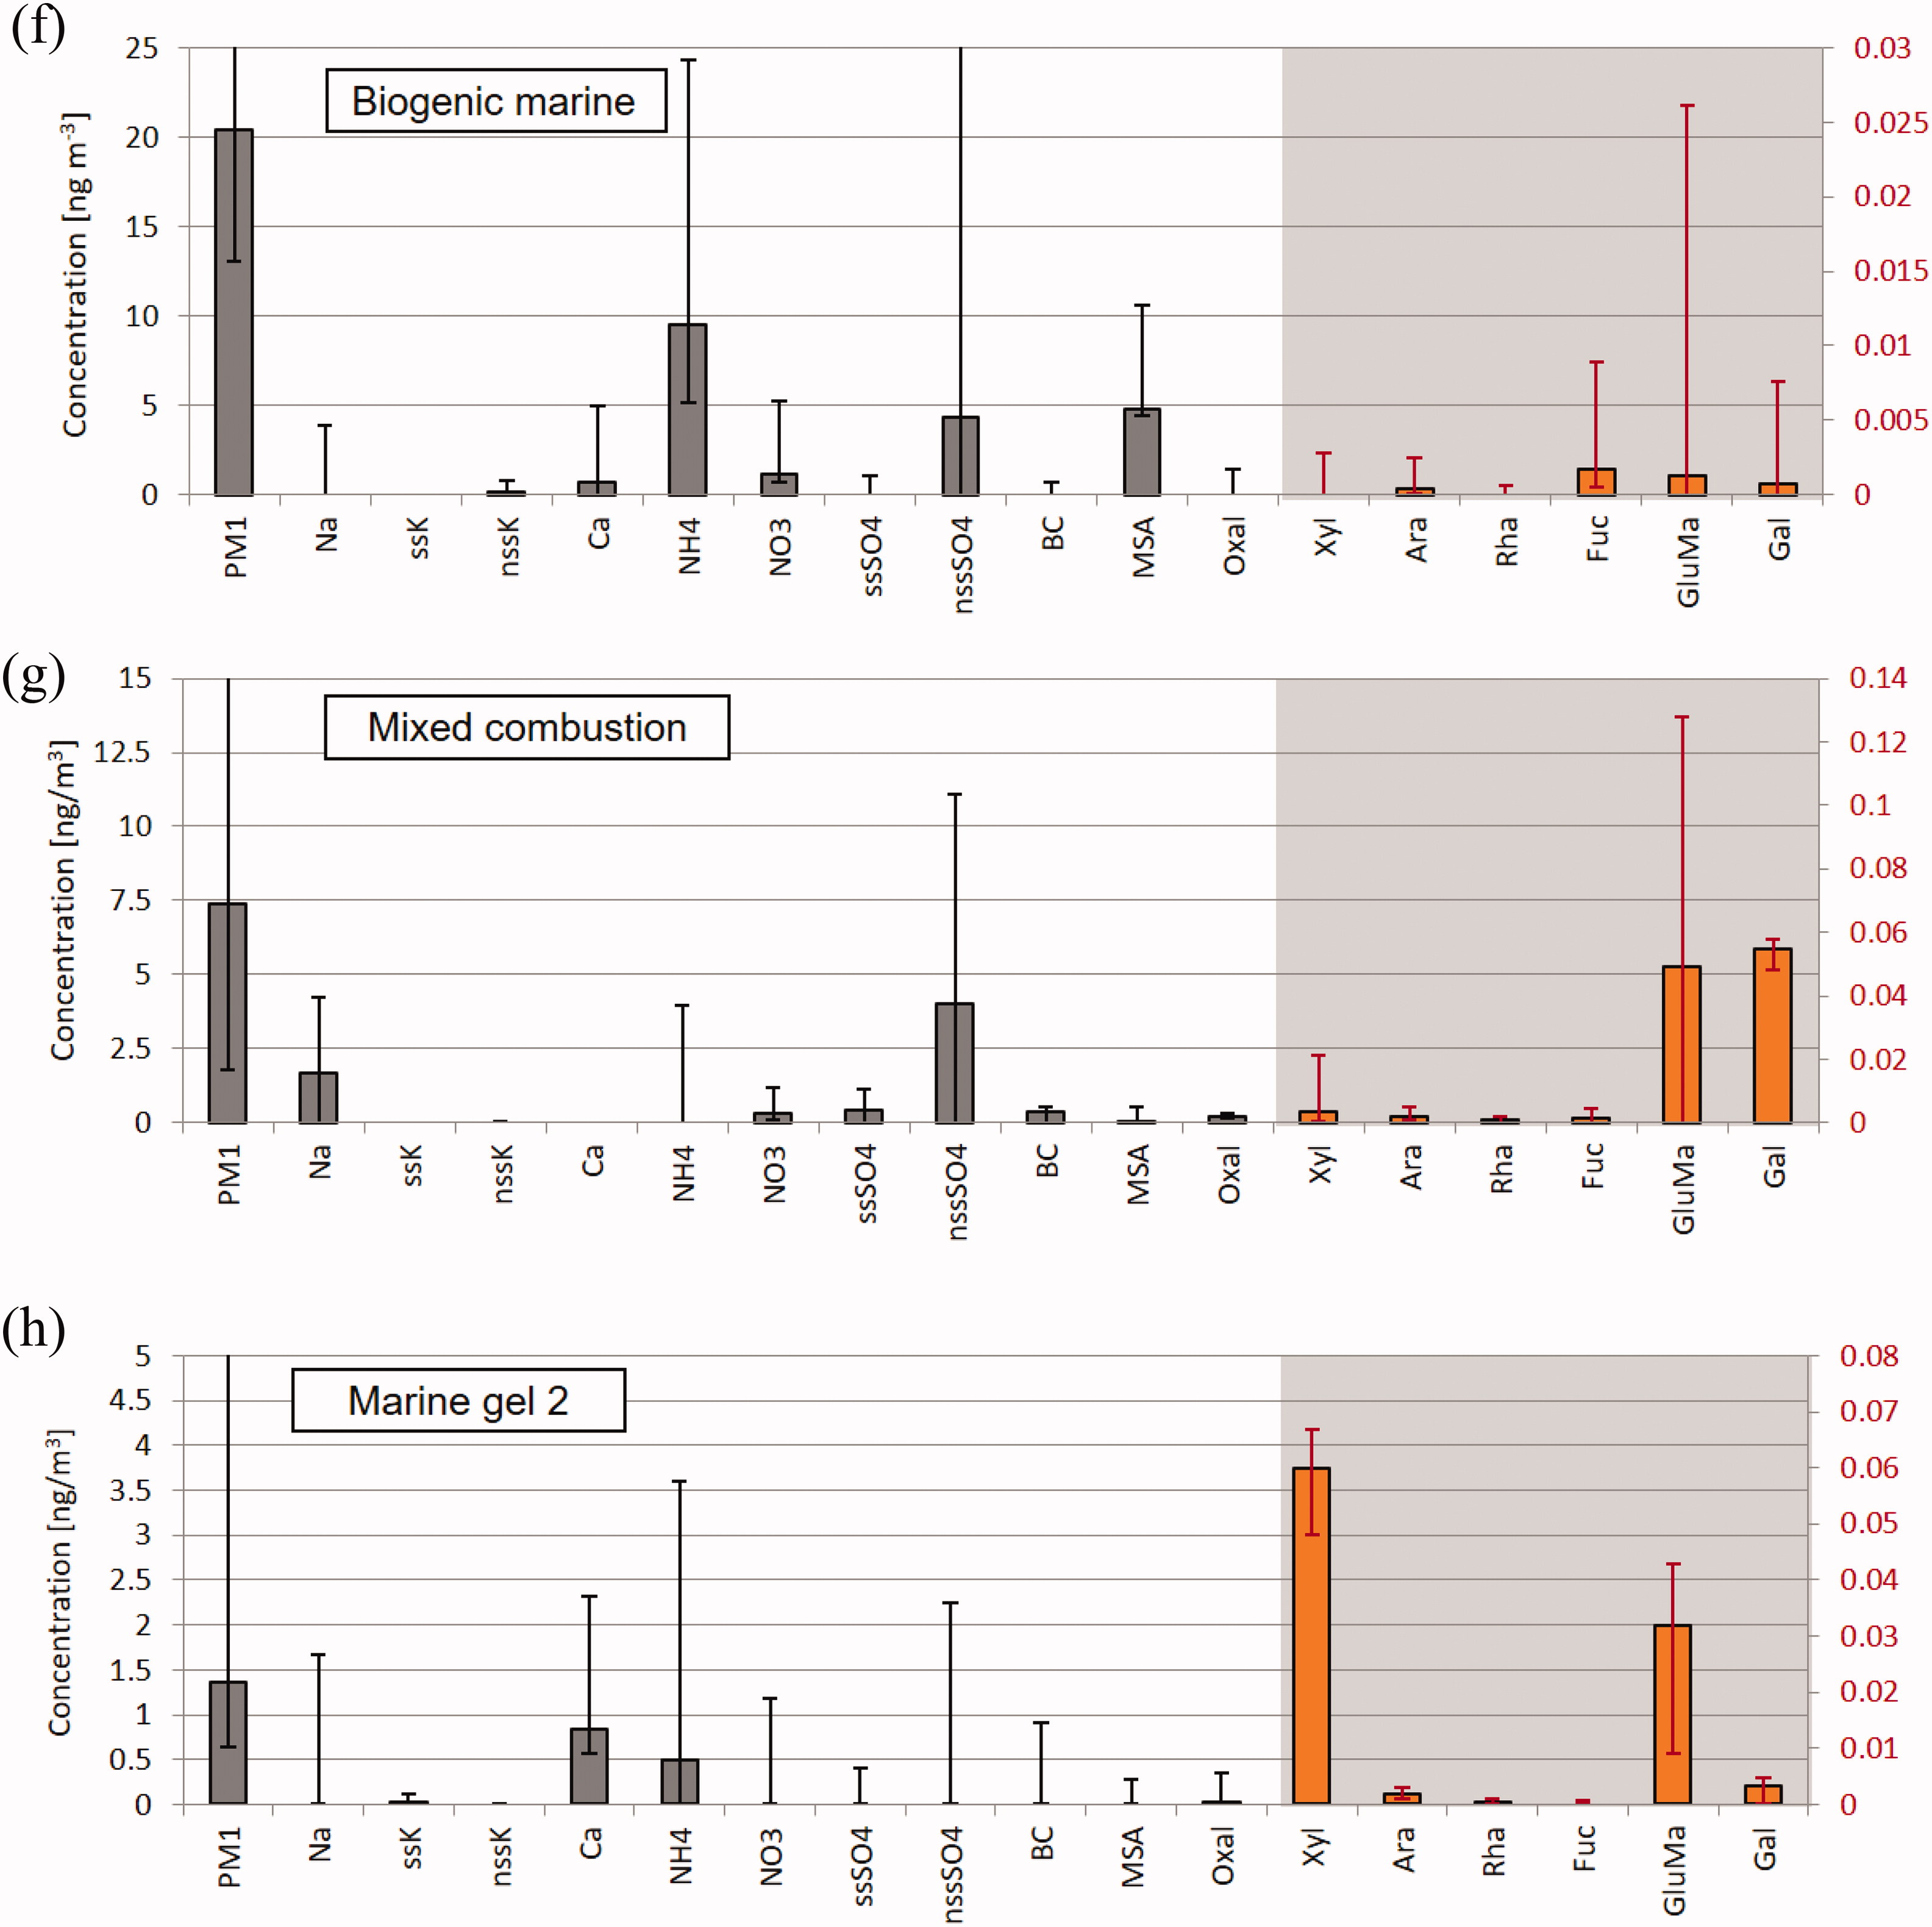
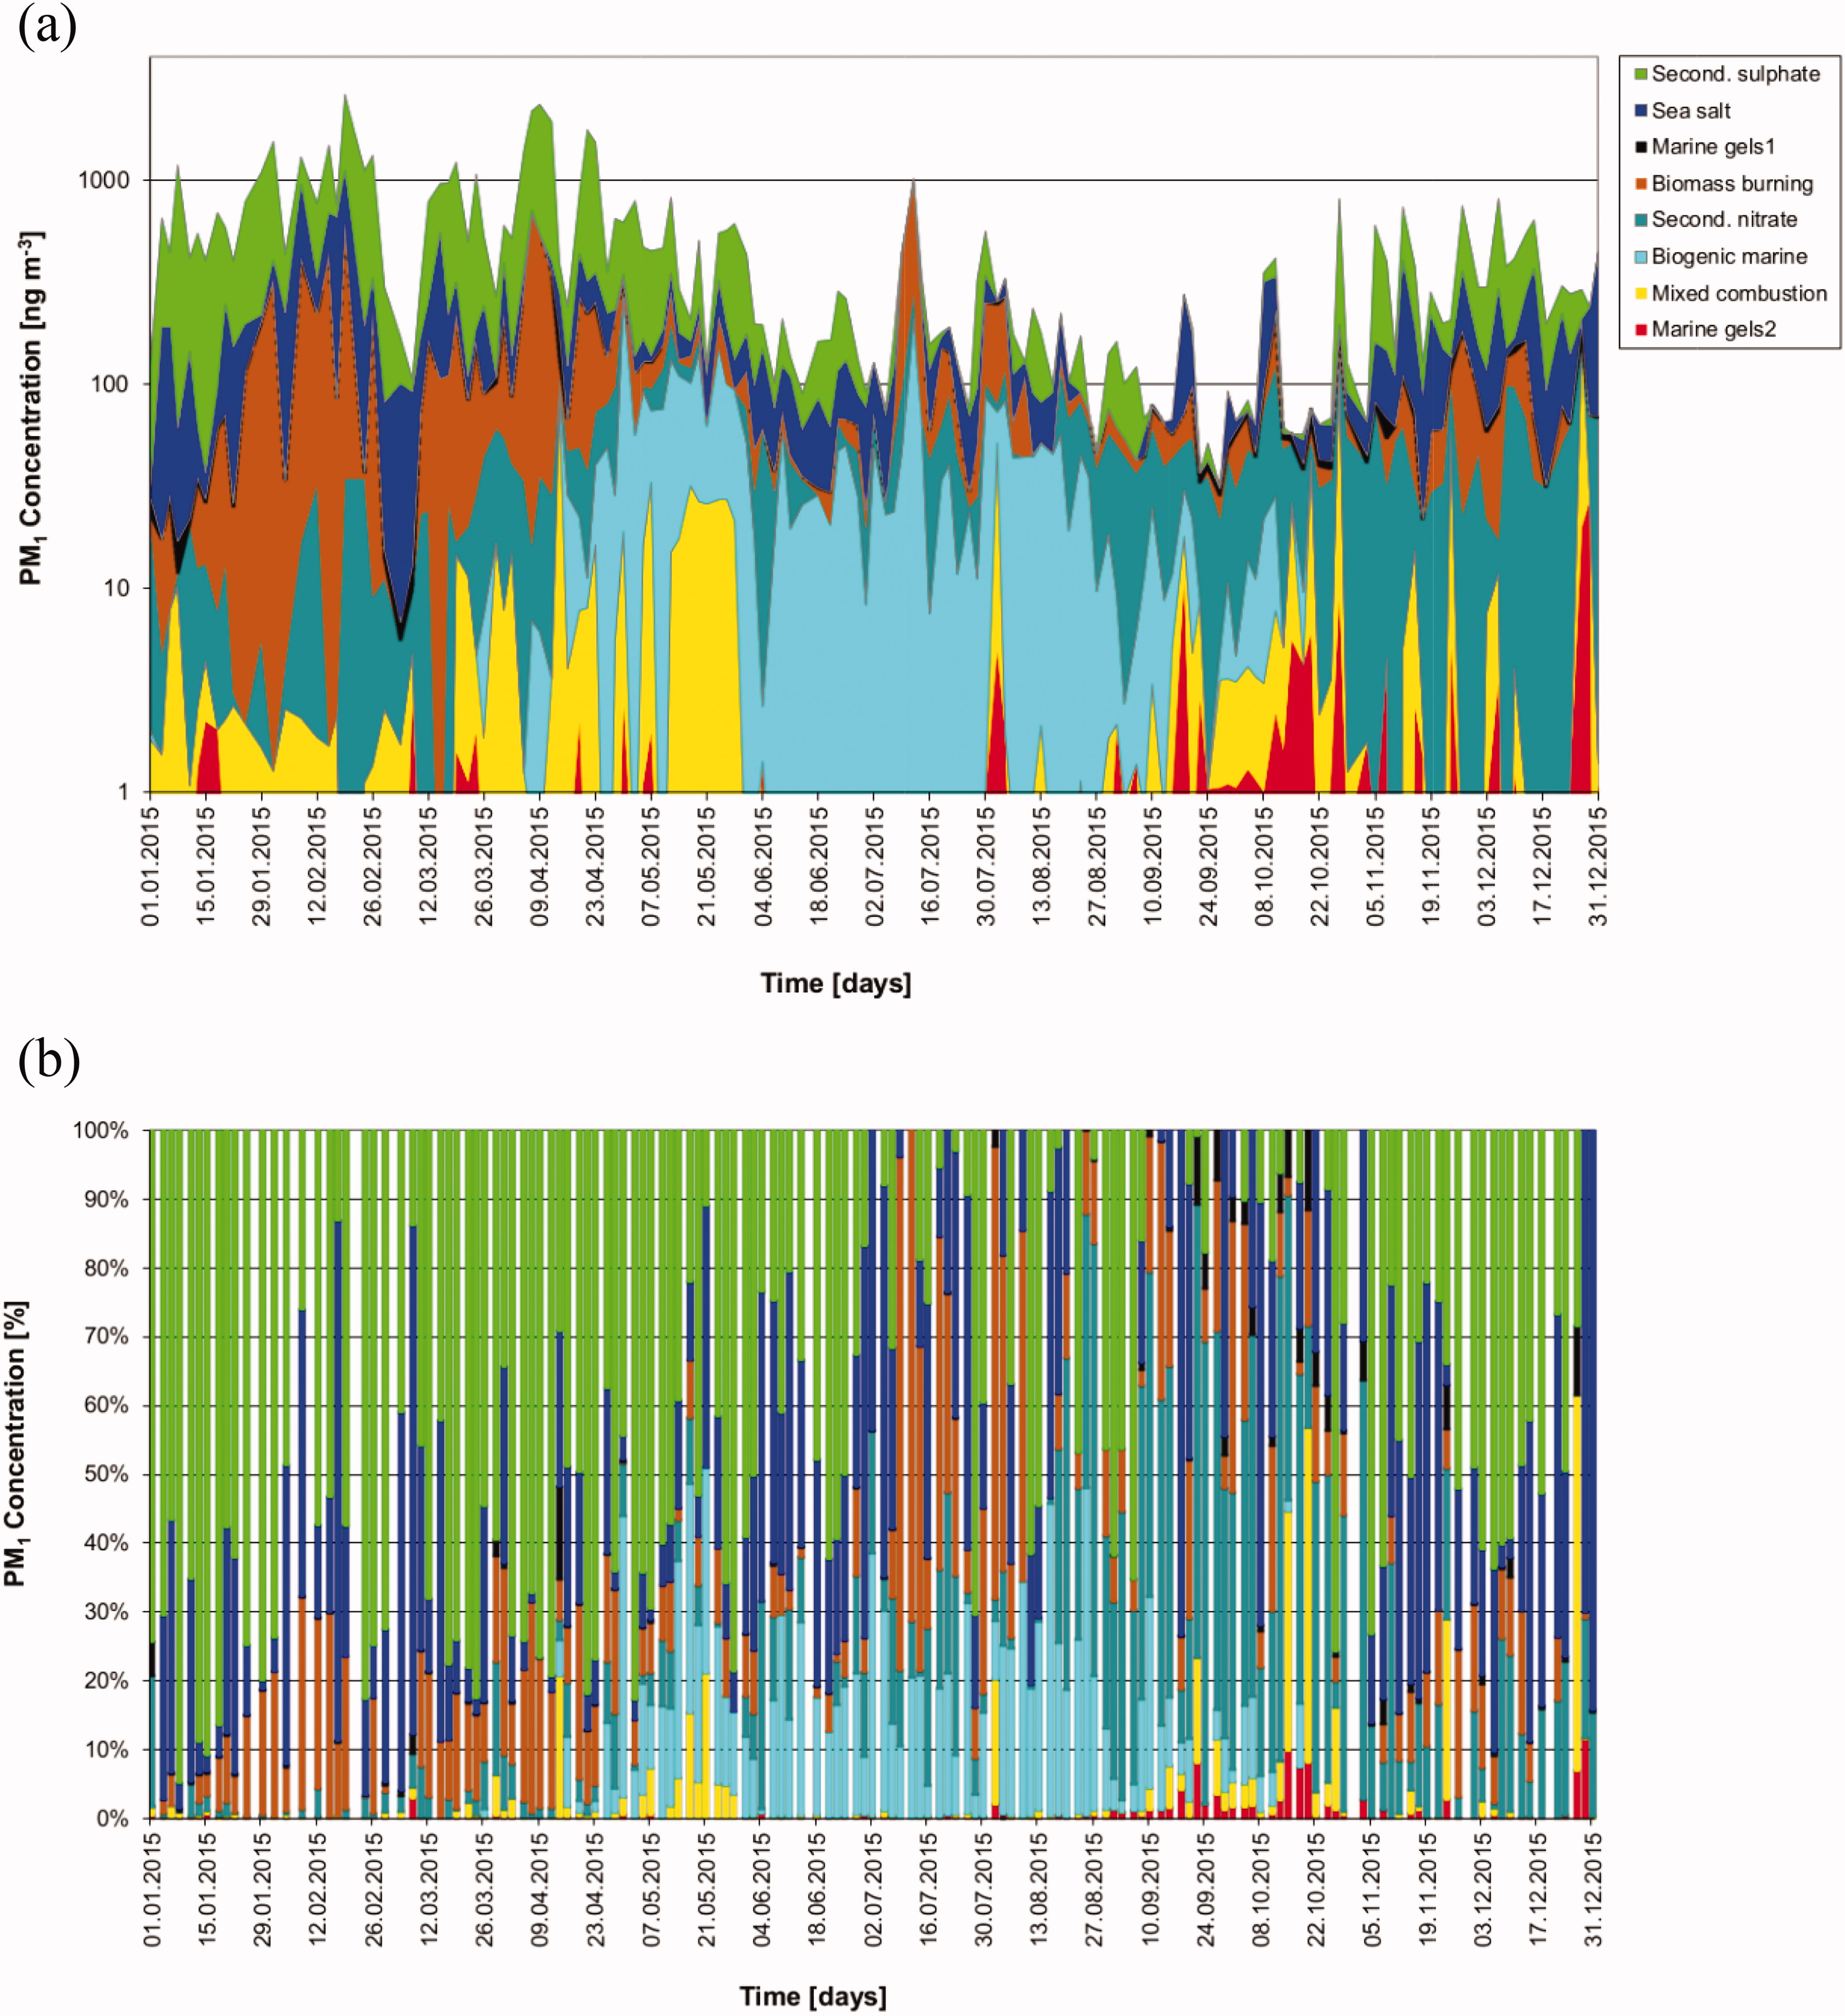
Fig. 4.
Seasonal variation of the factor contributions to PM1 at Mt. Zeppelin according to the PMF 8-factor solution for the samples in 2015: (a) cumulative source contribution of PMF factors to PM1 concentrations and (b) percentage source contribution of PMF factors to PM1 concentrations. Note the logarithmic scale of the y-axis in figure part (a). White vertical lines in figure part (b) represent sampling gaps.
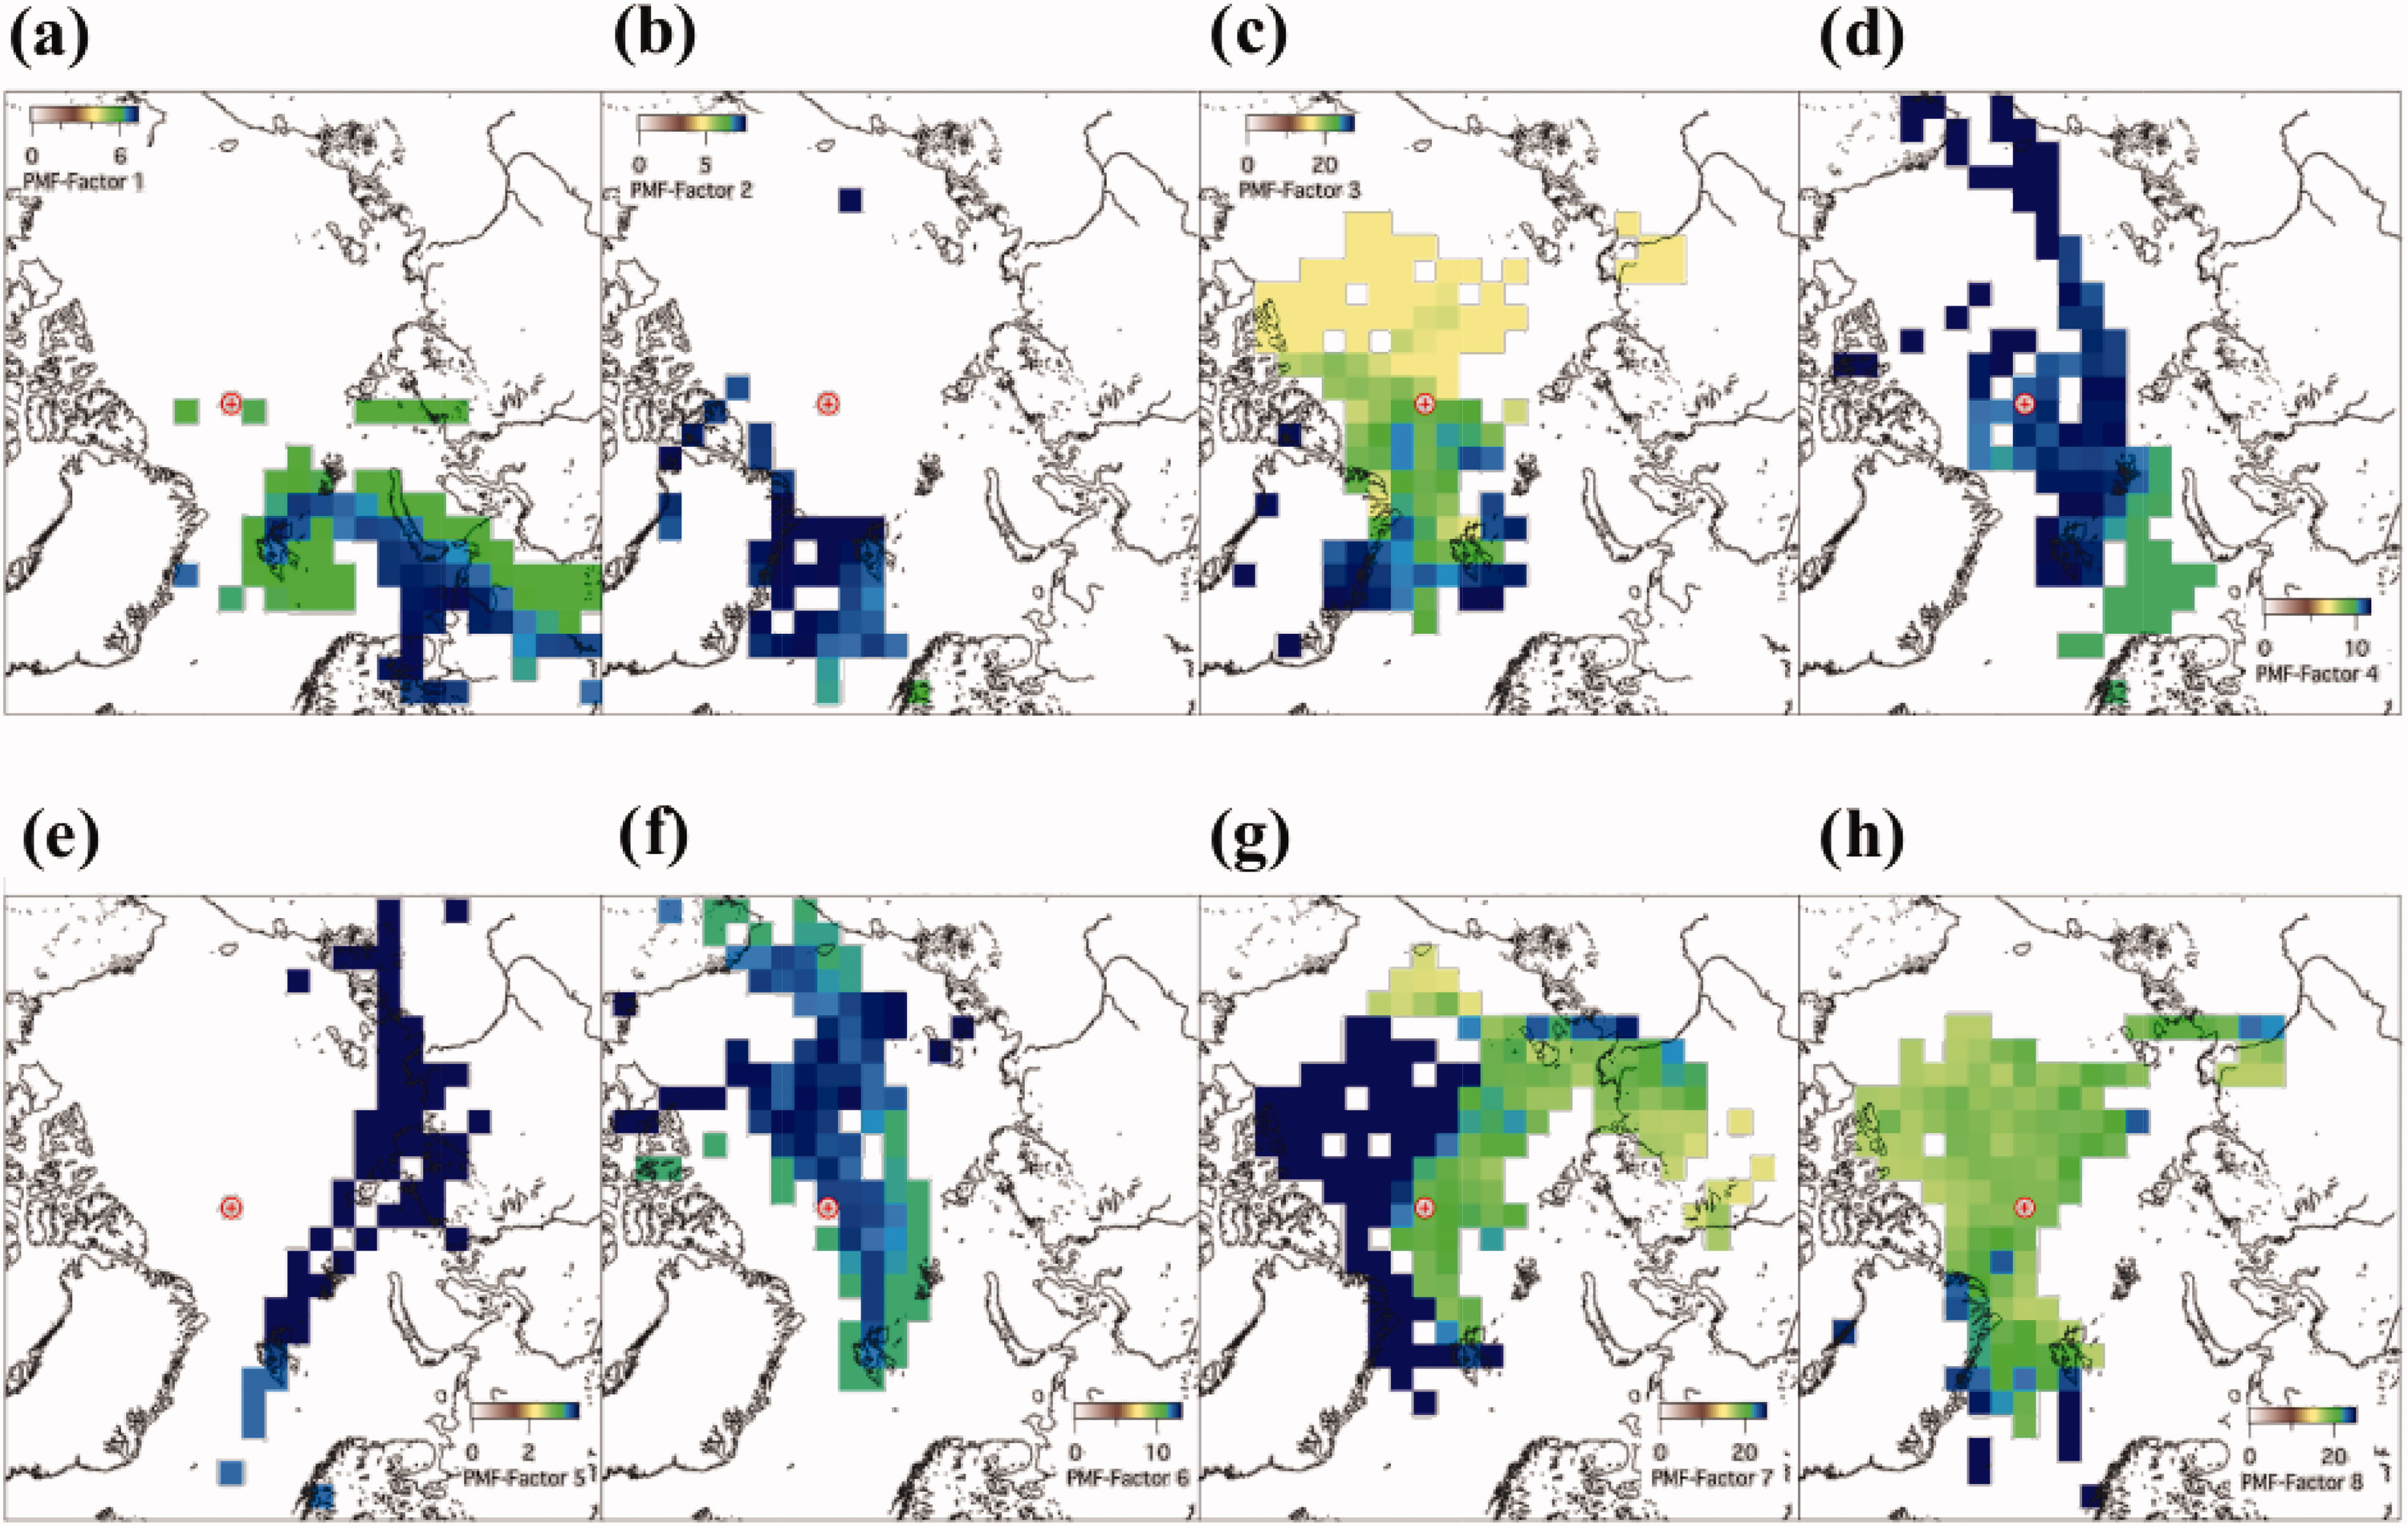
Fig. 5.
Maps of potential source distributions of the aerosol sources identified by the 8-factor PMF solution and 5-day back trajectories. Top row: Factors 1–4; bottom row: Factors 5–8. The colour scales of the individual maps are adjusted to the peak values of the respective PMF-factors: (a) Factor 1 [Regional background secondary sulphate], (b) Factor 2 [Sea spray], (c) Factor 3 [Marine gel type 1], (d) Factor 4 [Biomass burning], (e) Factor 5 [Regional background secondary nitrate], (f) Factor 6 [Secondary biogenic marine], (g) Factor 7 [Mixed combustion], and (h) Factor 8 [Marine gel type 2]. Only geo-cells with ≥60 trajectory hits per cell are shown. The red symbol indicates the North Pole.
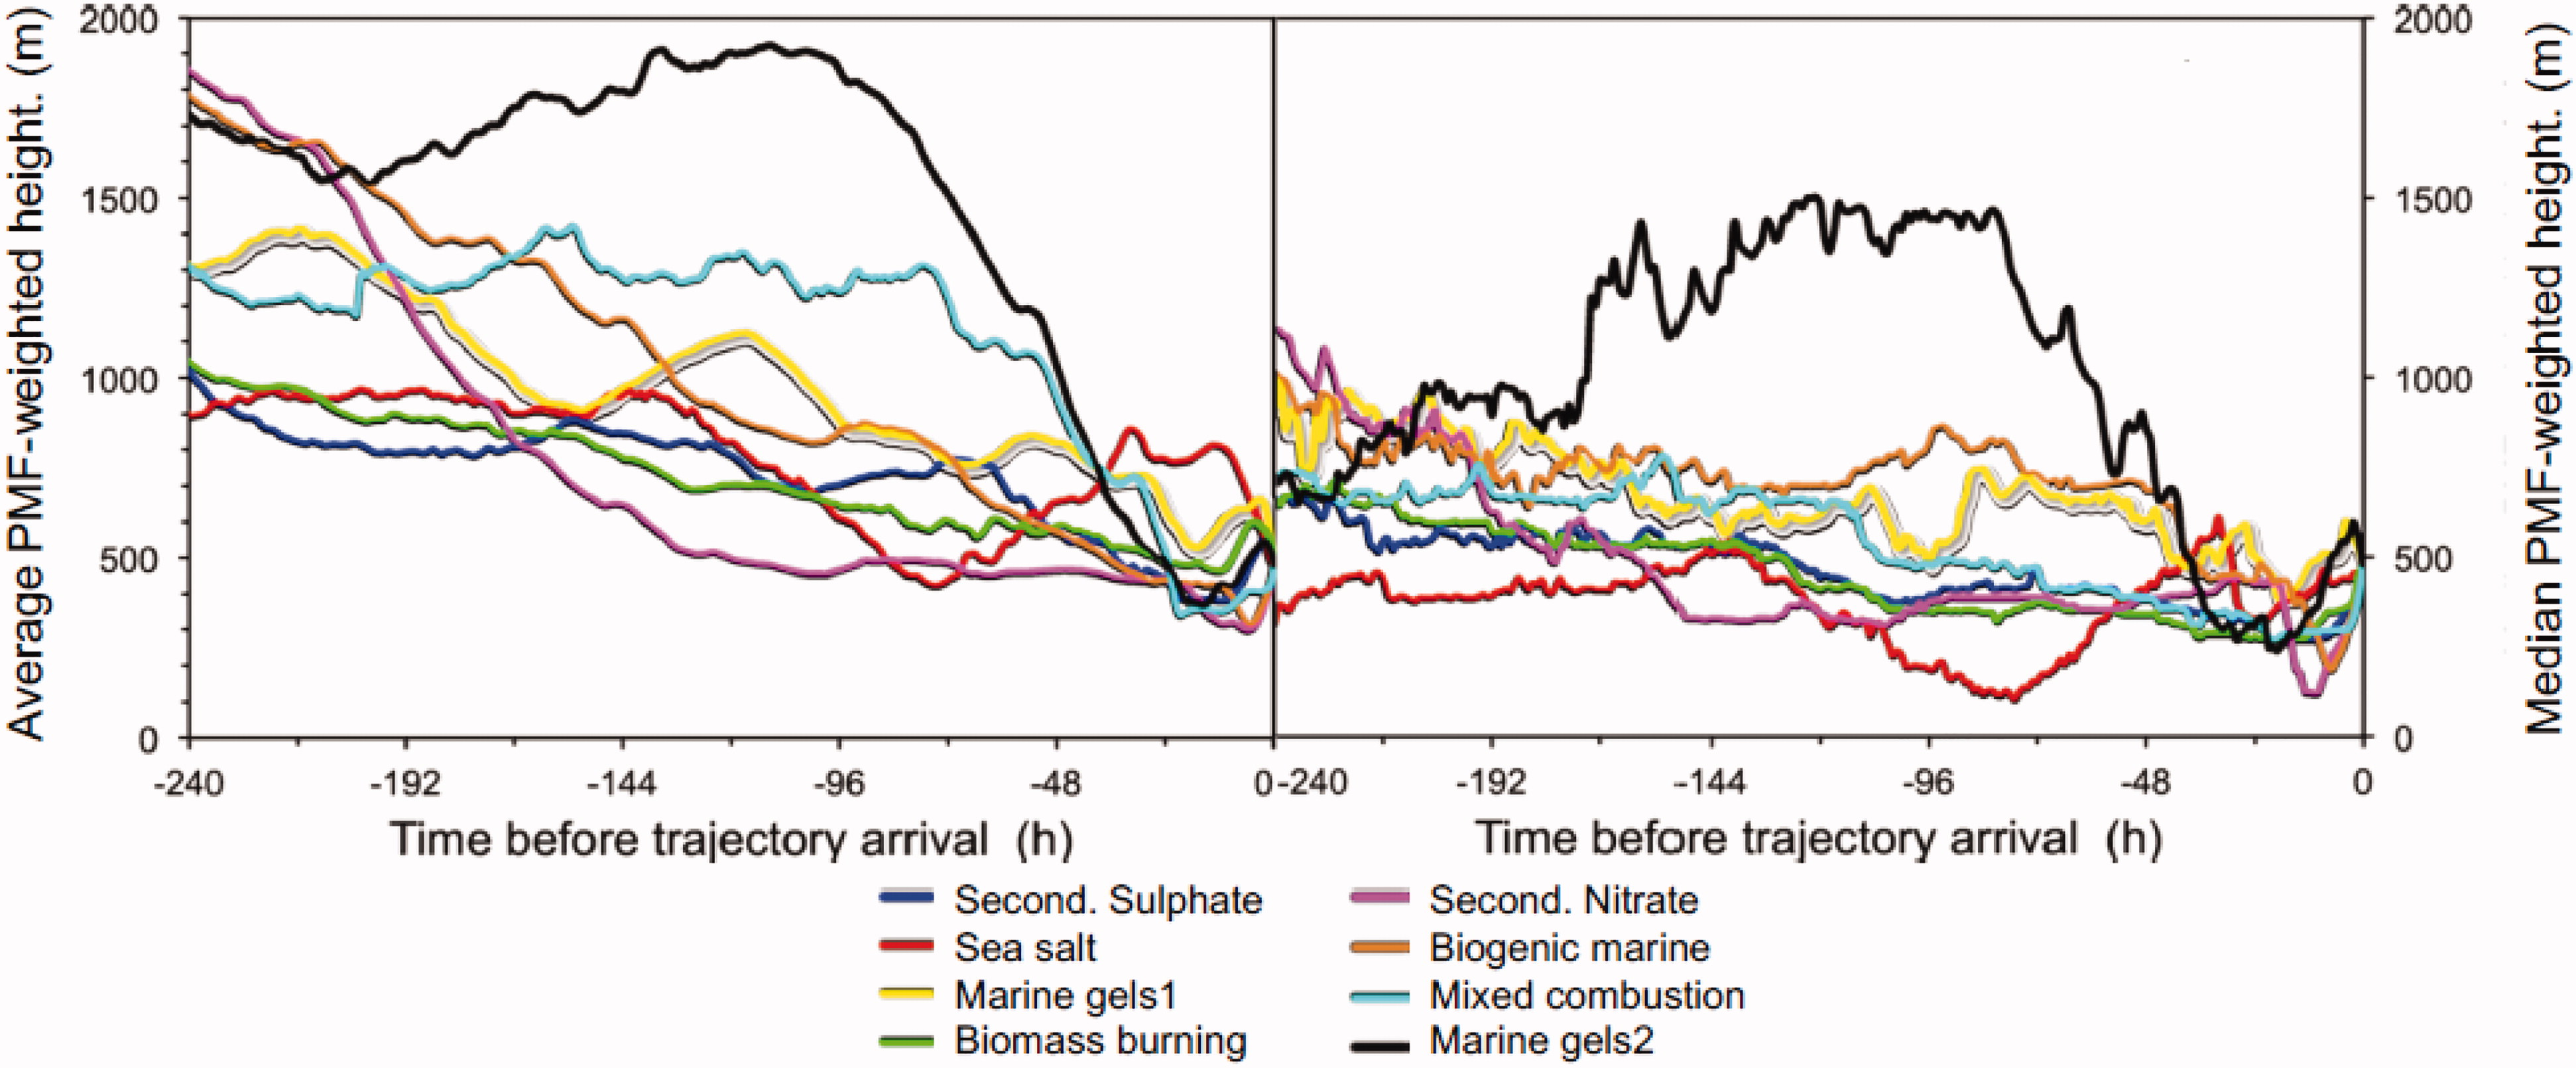
Fig. 6.
Left: Average PMF-weighted trajectory heights during 240 h before air mass arrival at the receptor site at 474 m a.s.l., related to the maps in Fig. 5; right: PMF-weighted 50 percentiles trajectory heights.
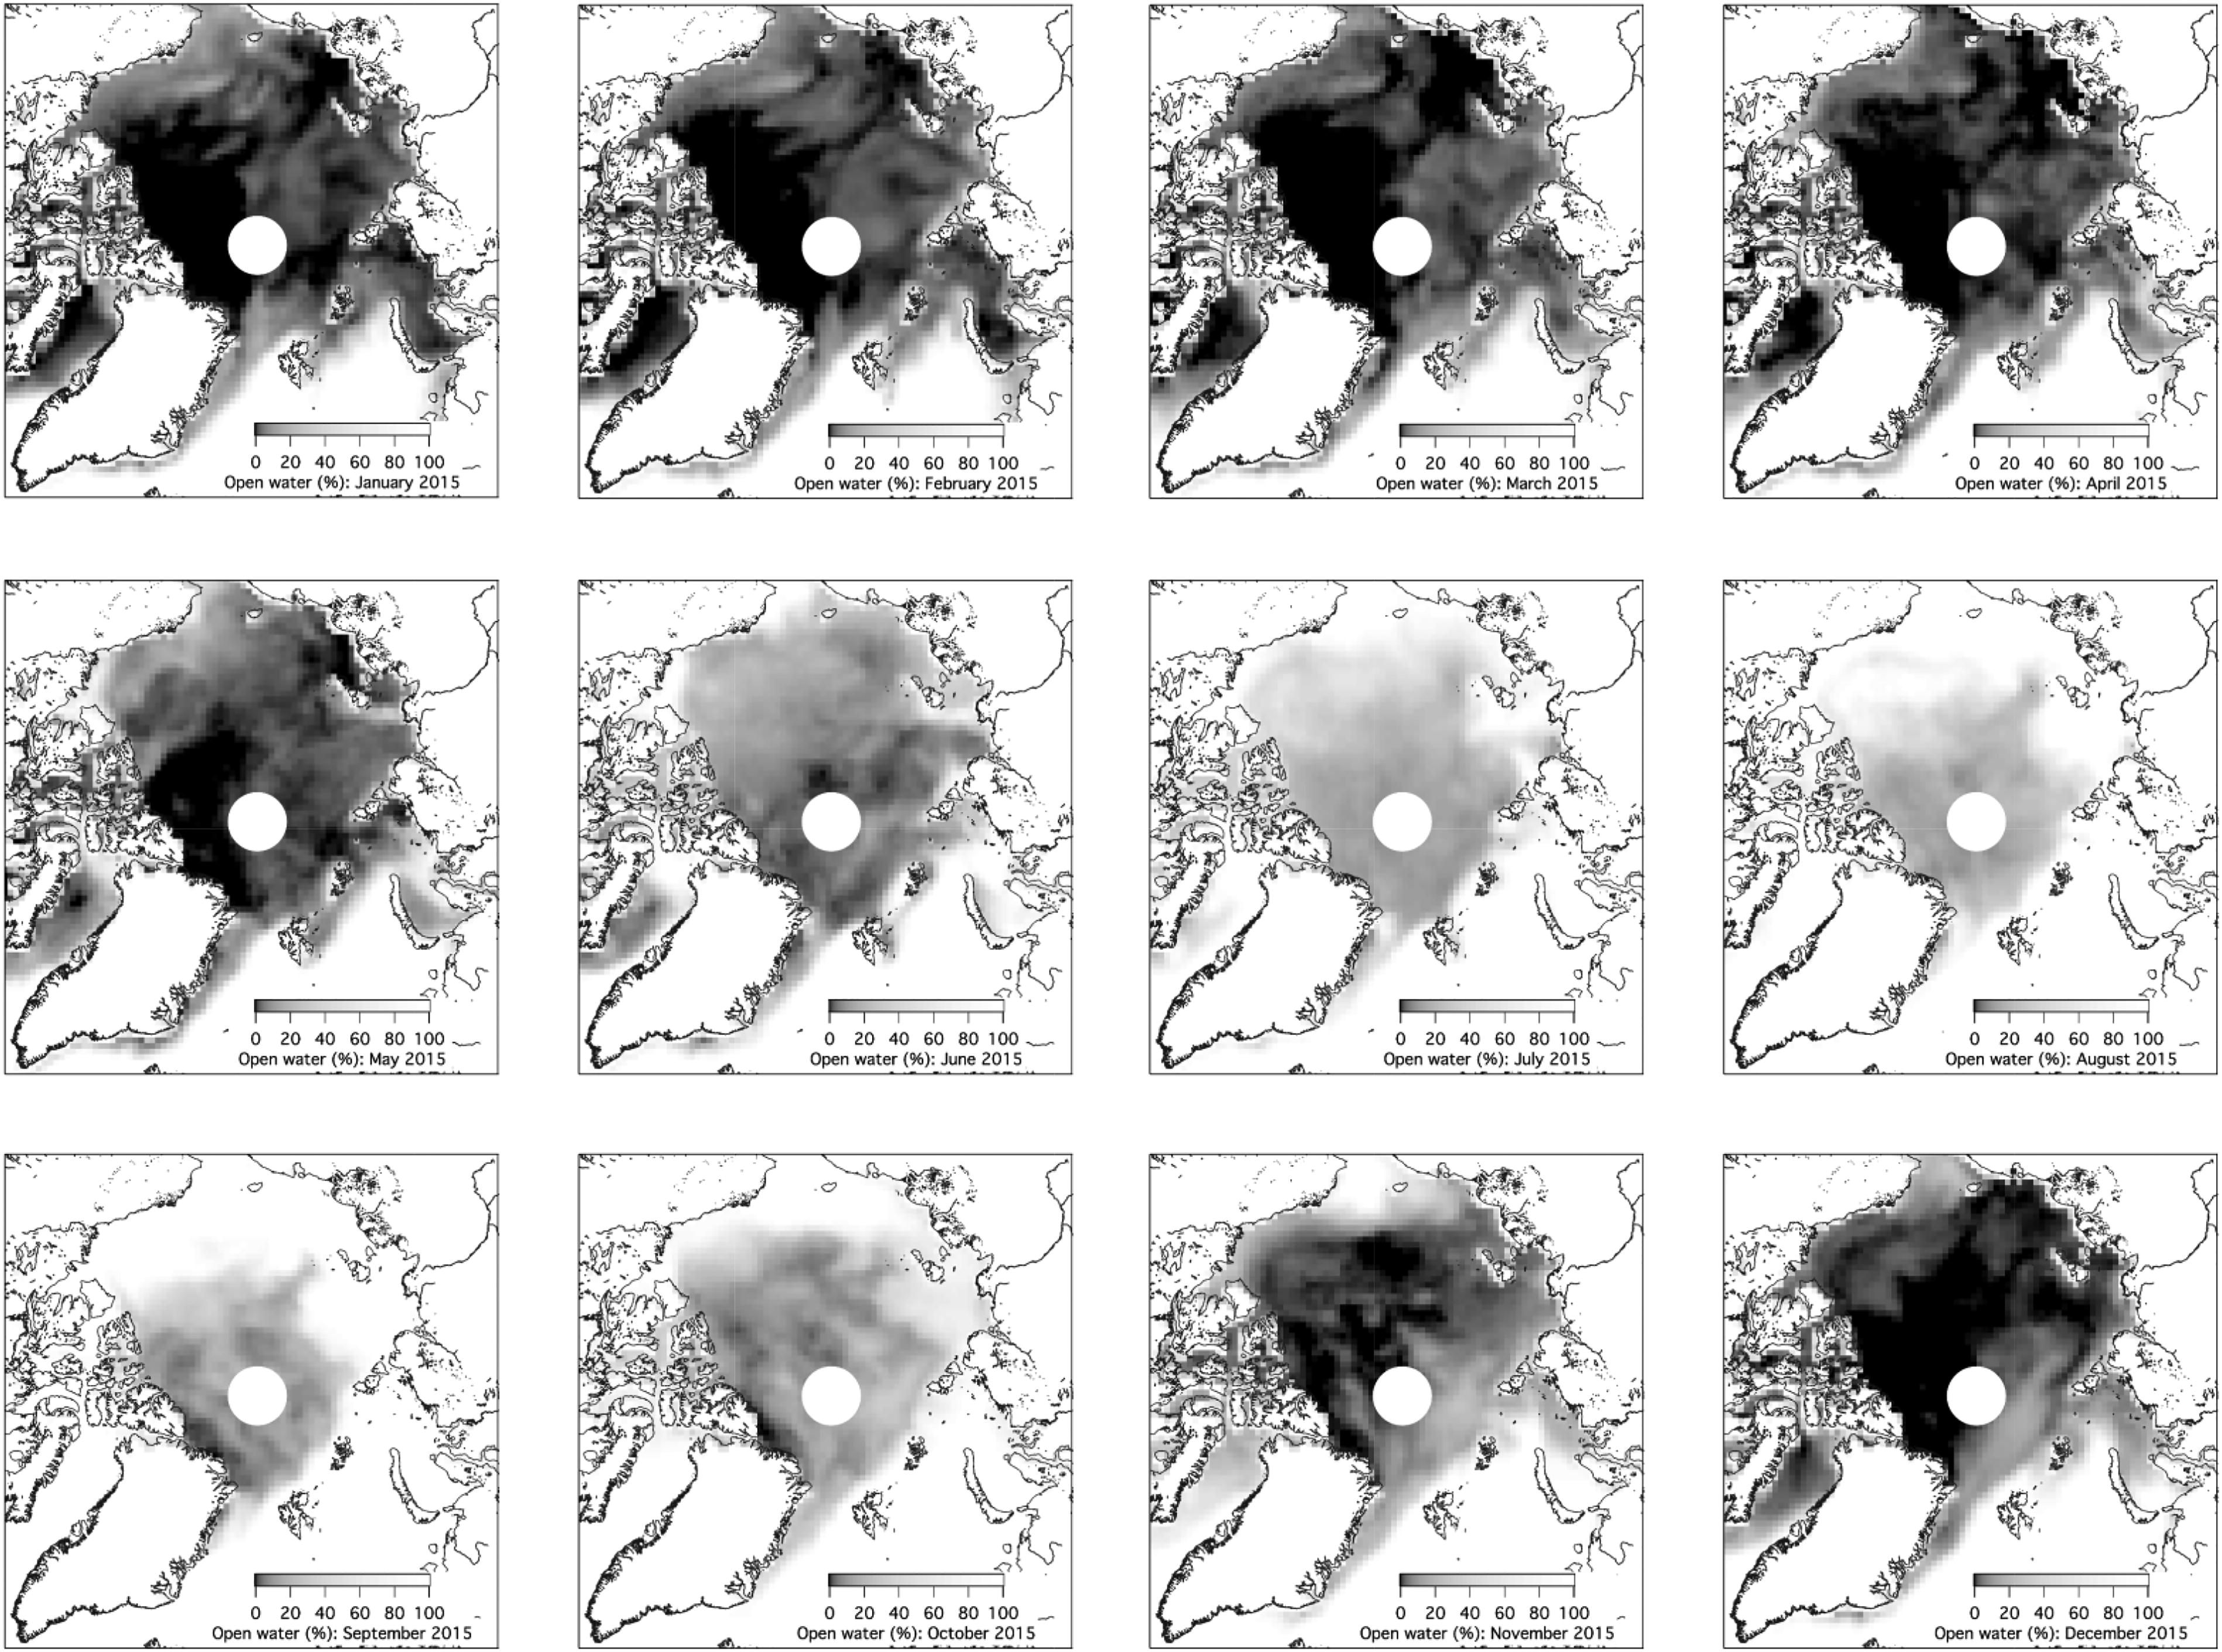
Fig. 7.
Maps of average monthly open water of the Arctic Ocean, from January to December 2015. Grey colour scale: 0% open water (white), 100%: fully ice covered (black). The white circle indicates the data void near the pole that is caused by the satellite orbits.
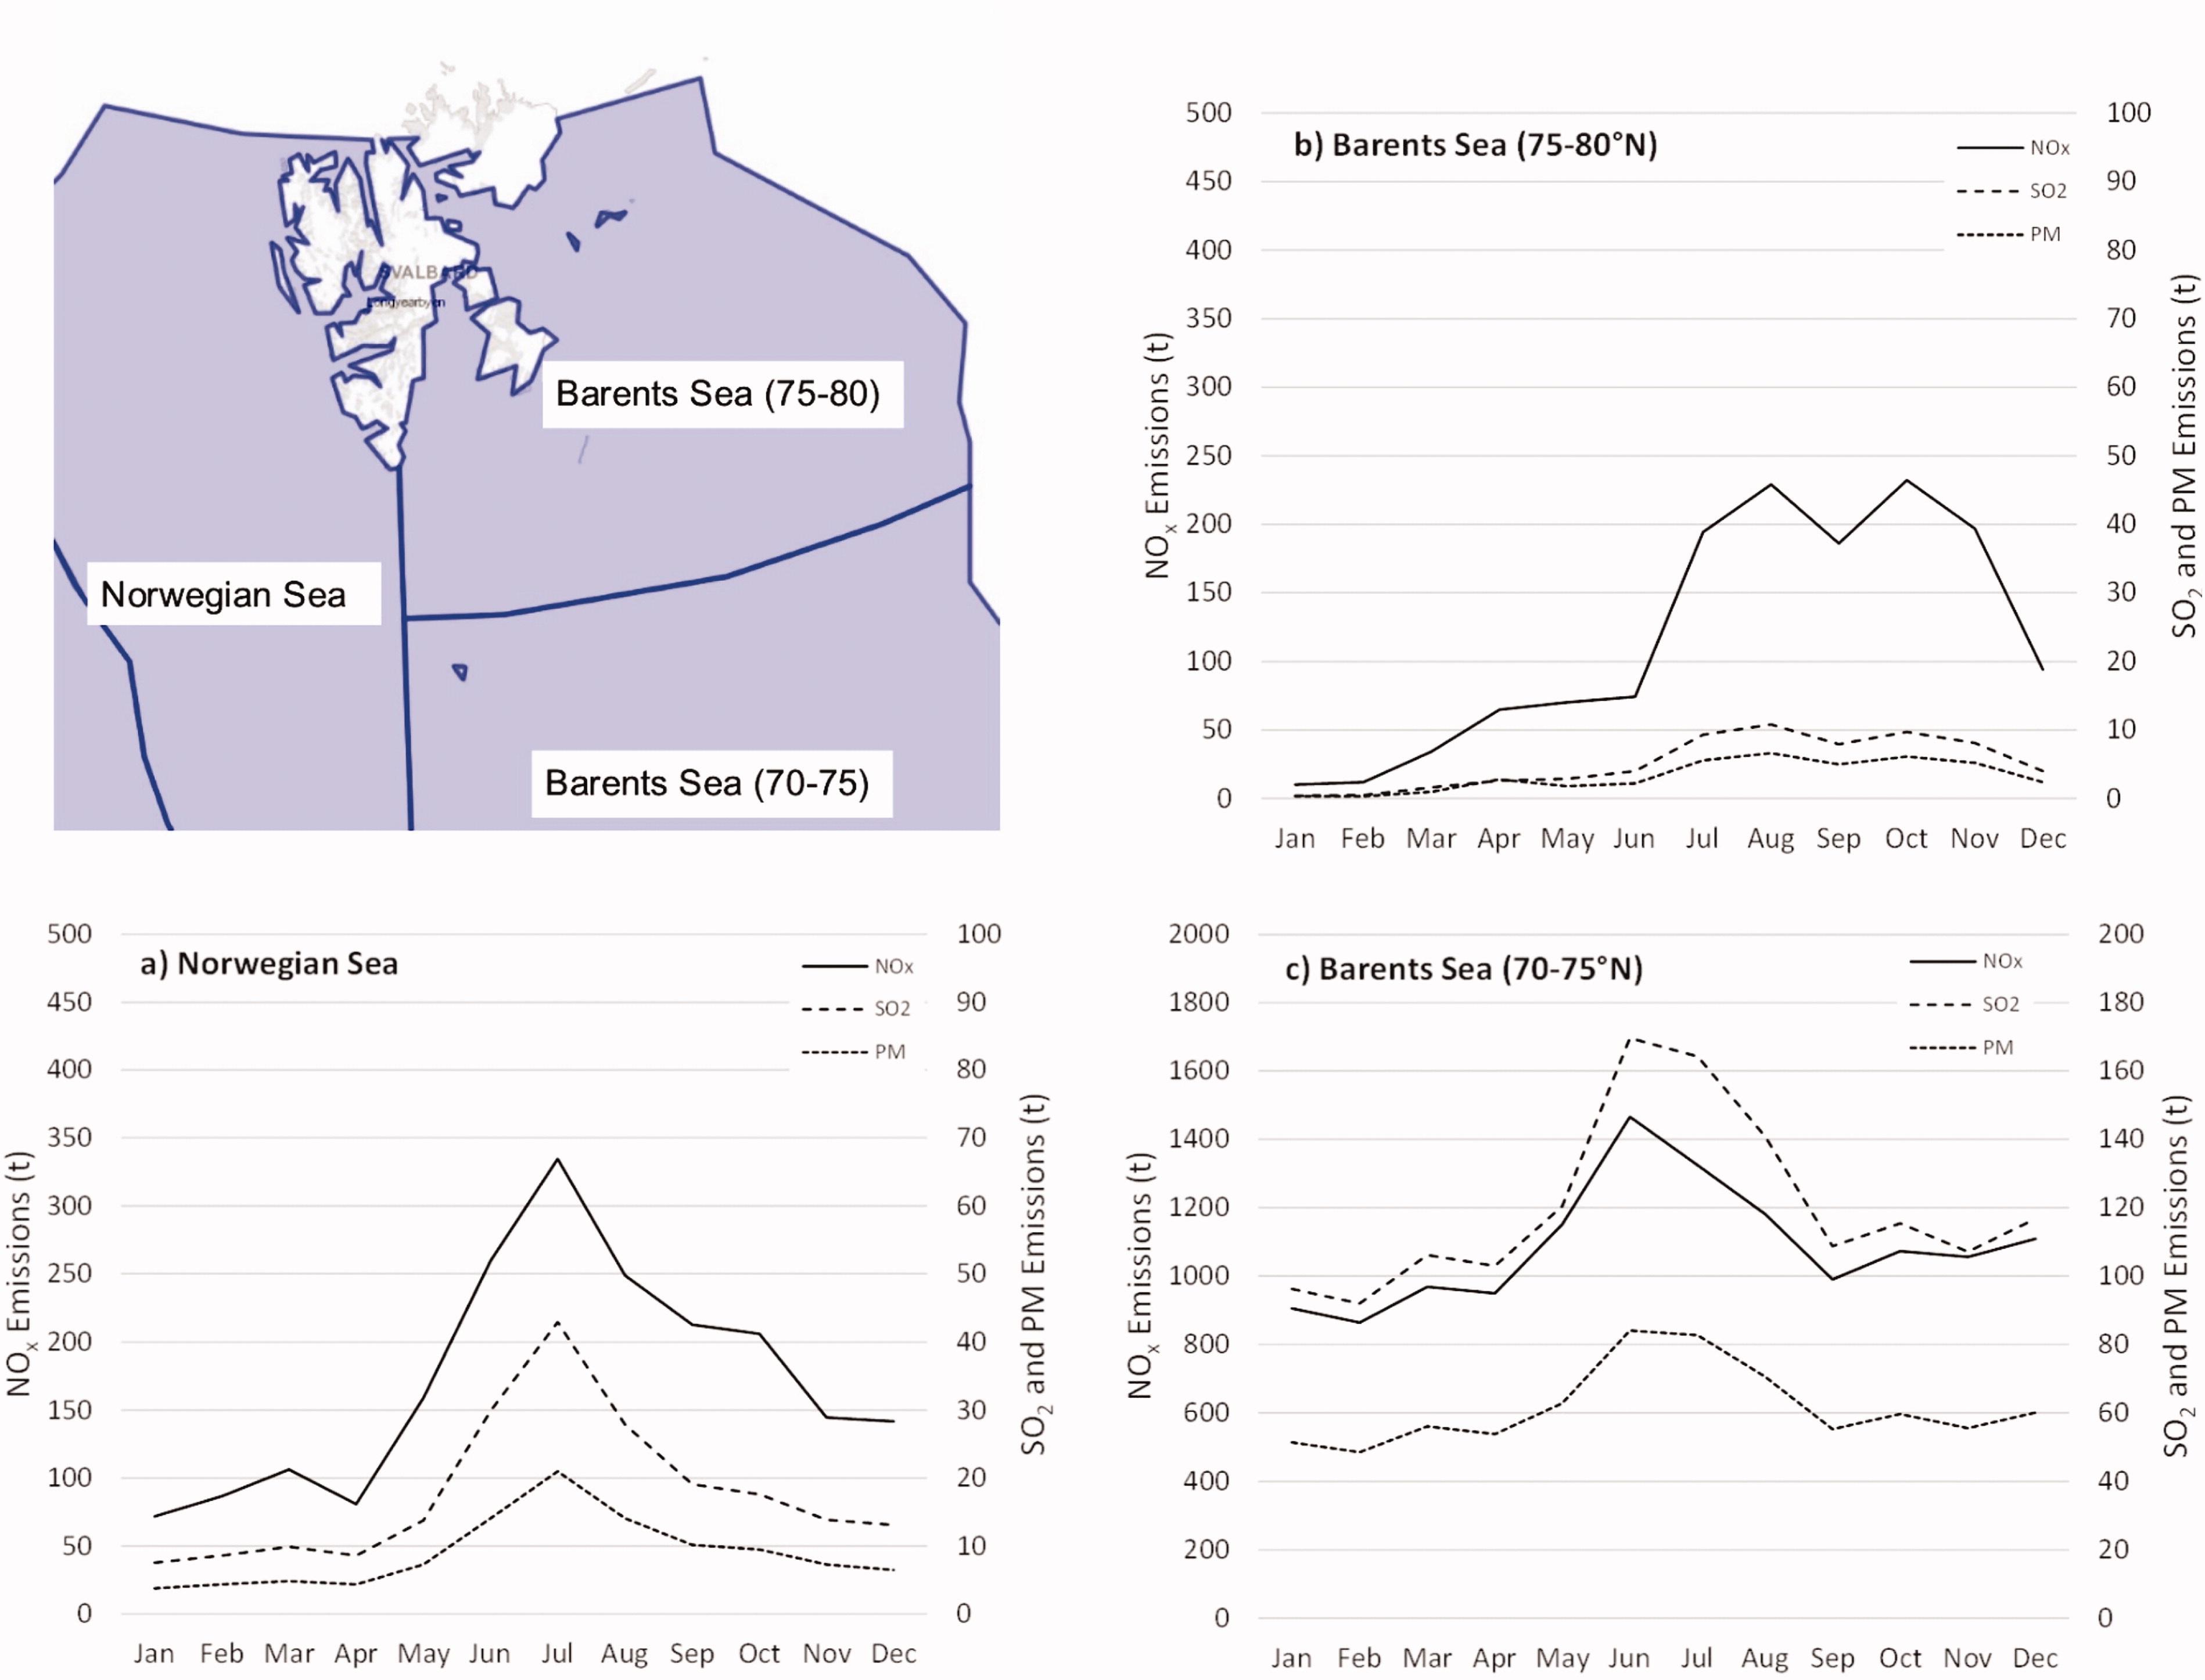
Fig. 8.
Shipping emission totals of NOX, SO2 and PM of the ship fleet in the Norwegian Sea and Barents Sea in the months of 2015: (a) Norwegian Sea, (b) Barents Sea (75–80° N) and (c) Barents Sea (70–75° N). The geographic map in the top-left part of the figures shows the division of seas around Svalbard for shipping.