
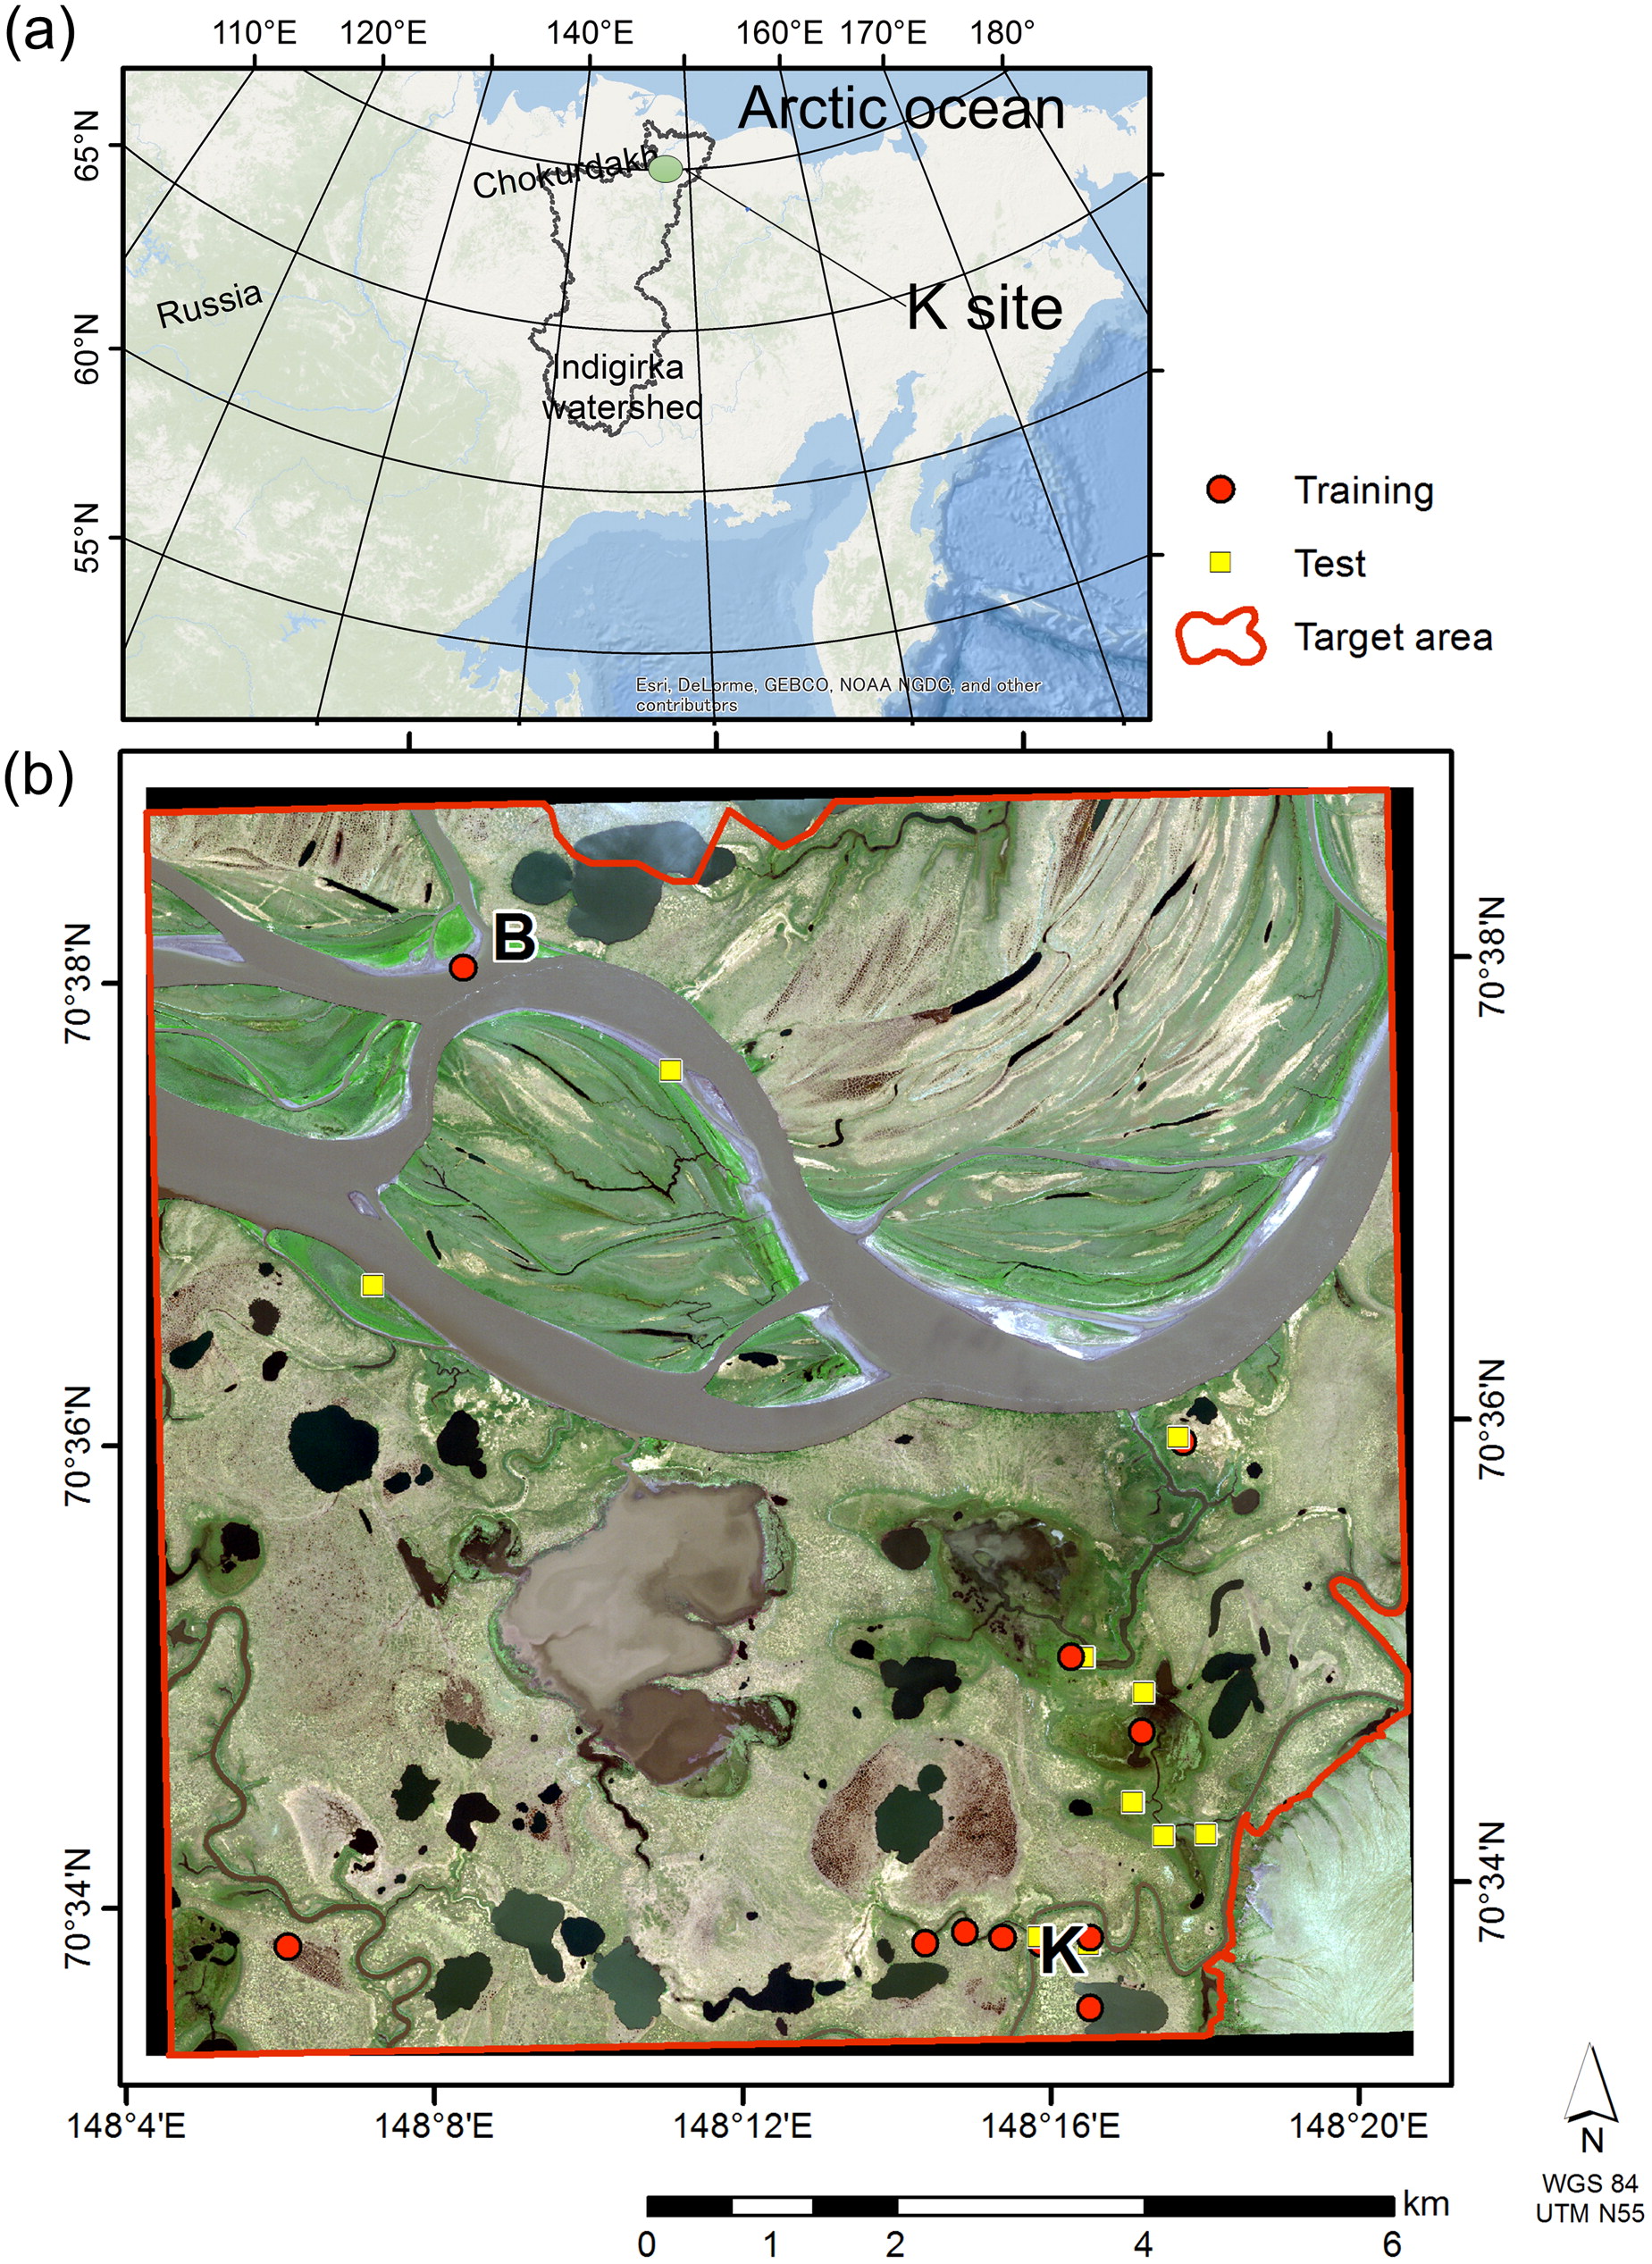
Fig. 1.
(a) Regional and (b) Local position of the study site. The Indigirka lowland is located in the north area of the watershed (Google Maps). WorldView-2 satellite image covered an area of 10 × 10 km (true colour). The main branch of the Indigirka River lies in the upper part of the image. The locations of the Kodac site (K), B site (B), local surveyed plot for training (circle) and test pixels (rectangular) are plotted on the map. Each survey point contains 3–4 quadrats for vegetation surveys. Vegetation was mapped within a target area (red line) without hills and cloudy areas.
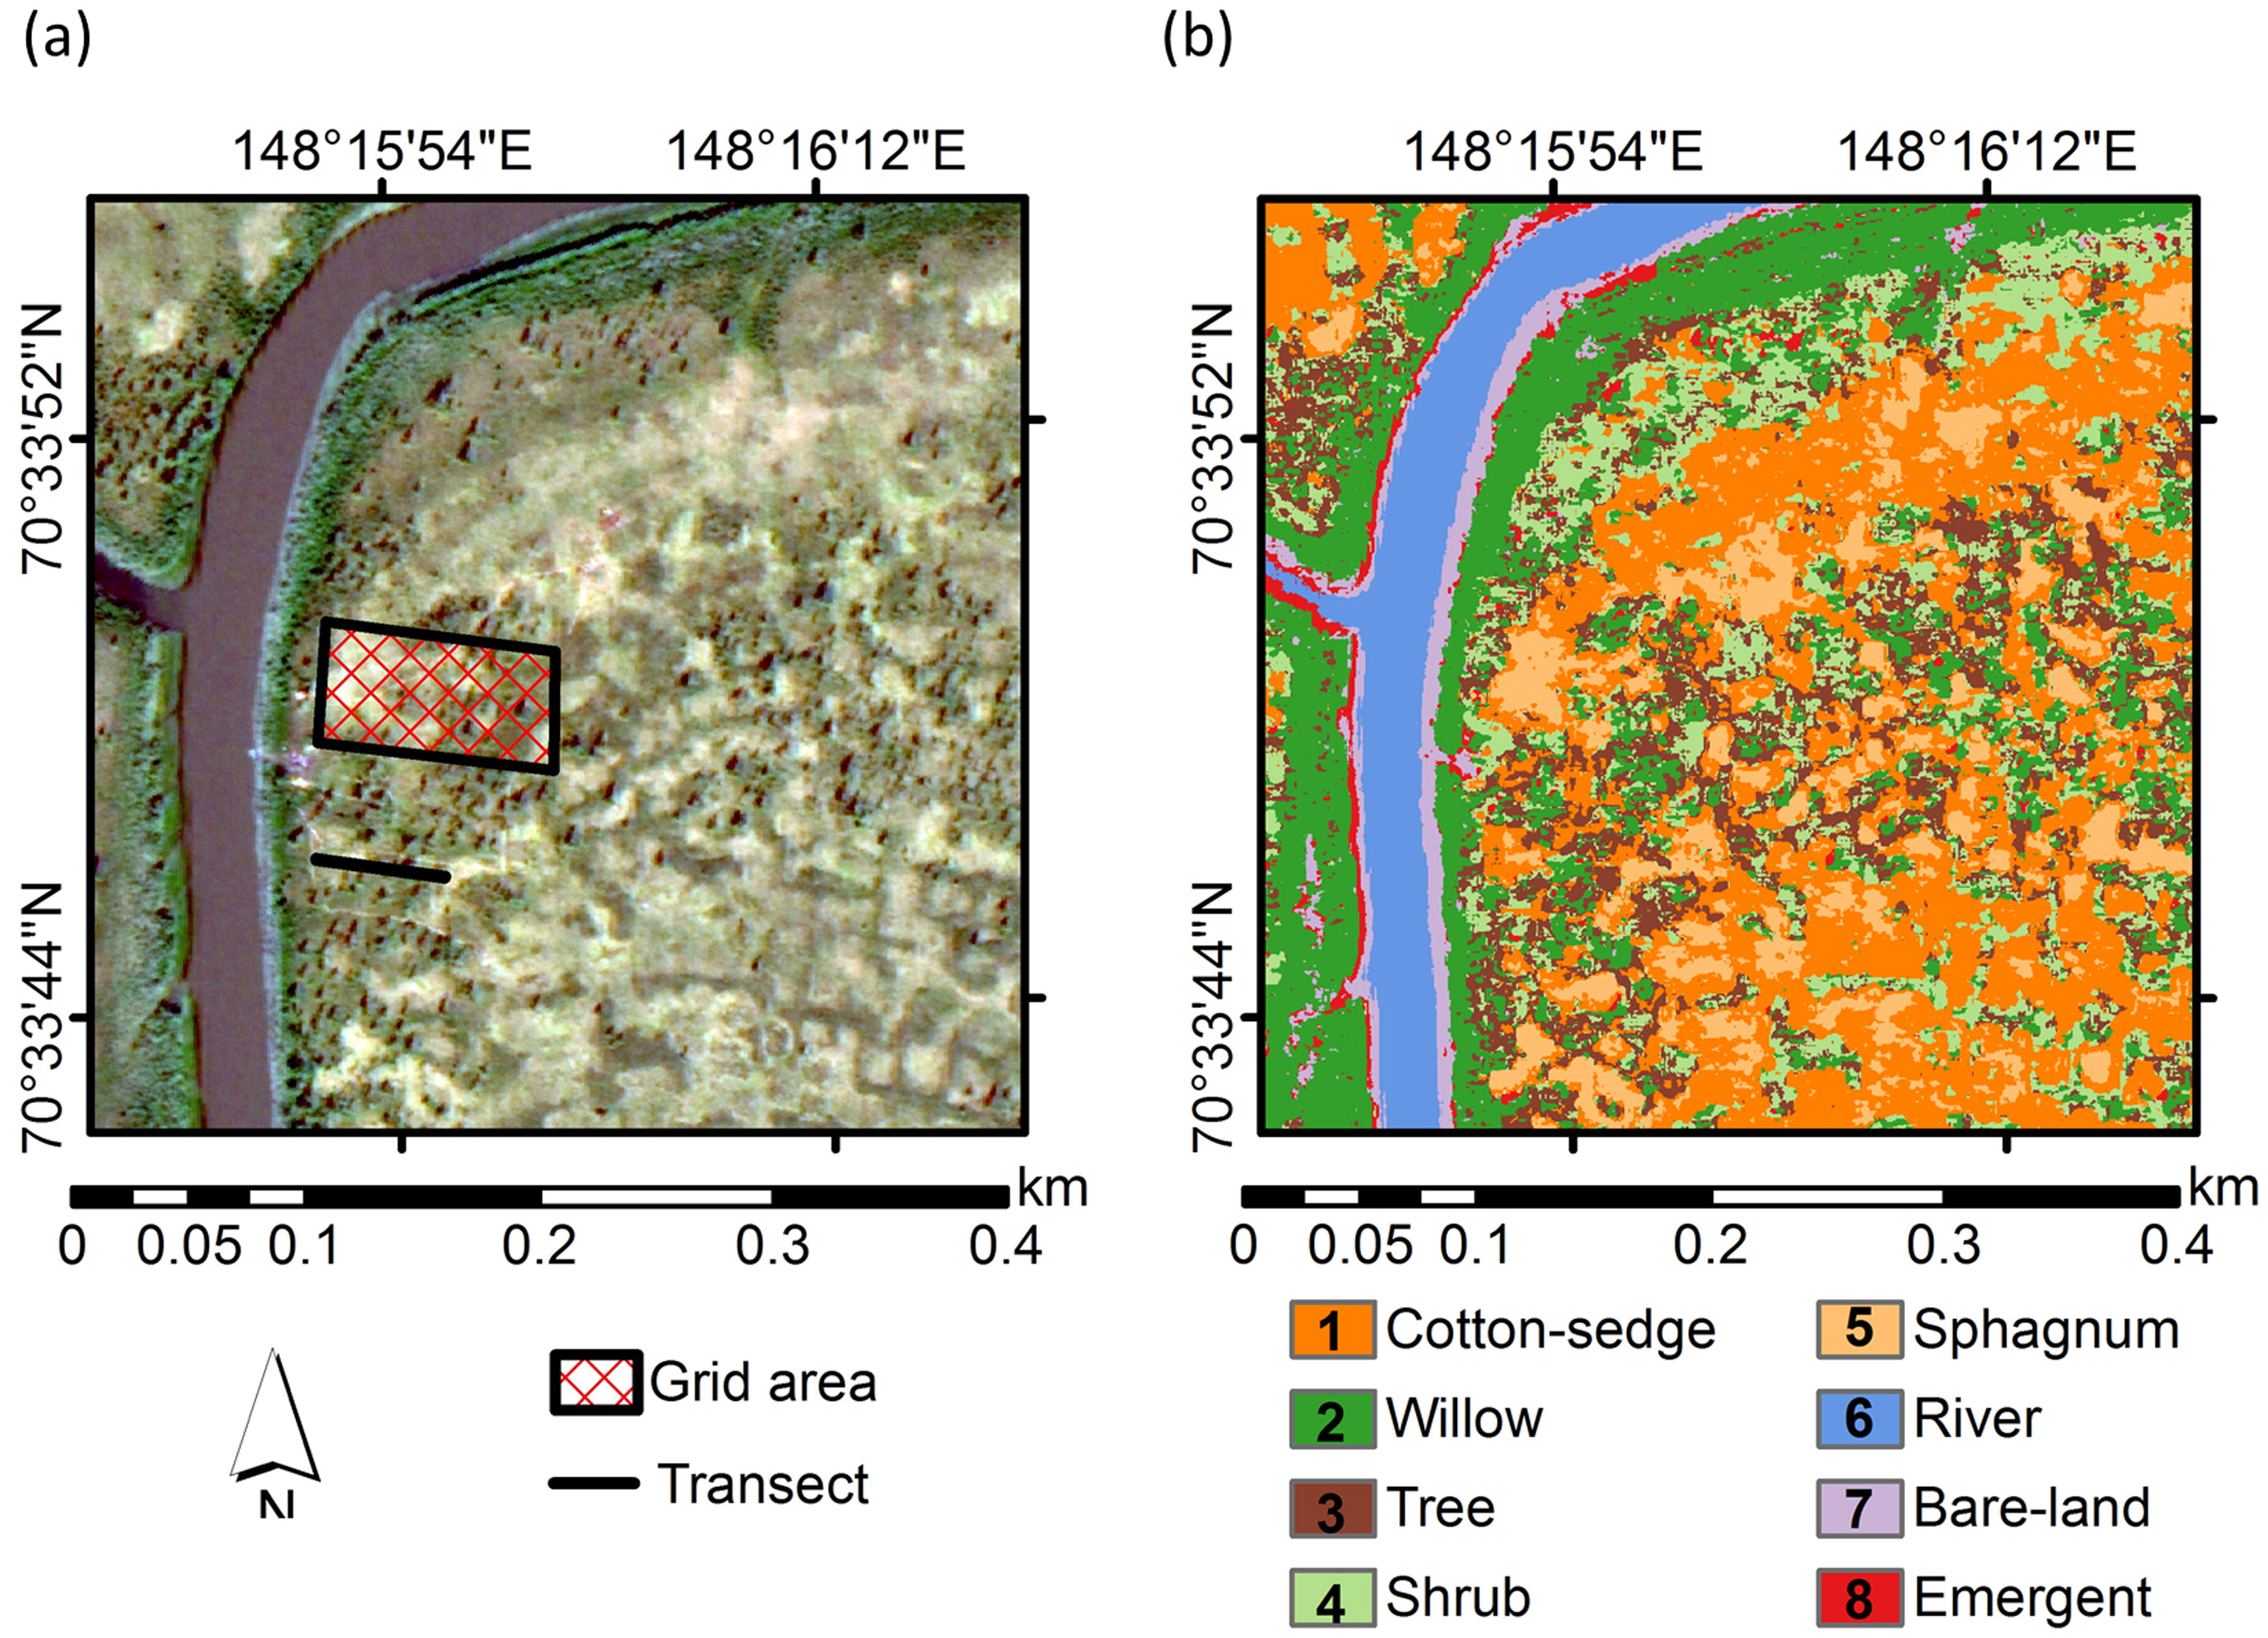
Fig. 2.
(a) True colour image and (b) vegetation map showing nine vegetation classes on the site scale (400 × 400 m) at site K (Kodac). The lake class does not appear at this scale, and therefore the map was covered by eight classes only, as shown in (b).
Table 3.
Methane emissions at the local scale were calculated using the observed CH4 flux, and the area of each vegetation class obtained from the vegetation map. In situ CH4 flux (230 observation in total) was observed from 3 July to 9 August 2009–2016. The sedge-dominated wetland contributes 70% of total emissions.
[i] aMethane flux observed by the calculation of the average of chamber-measured values. Data shown are averages ± standard error (SE), with the repeated number of total flux measurements (N) and the observation days (Days).
[ii] bRiver methane flux was estimated from river dissolved CH4 concentrations and transfer velocity (Supplementary Material: Text S1, Fig. S7).
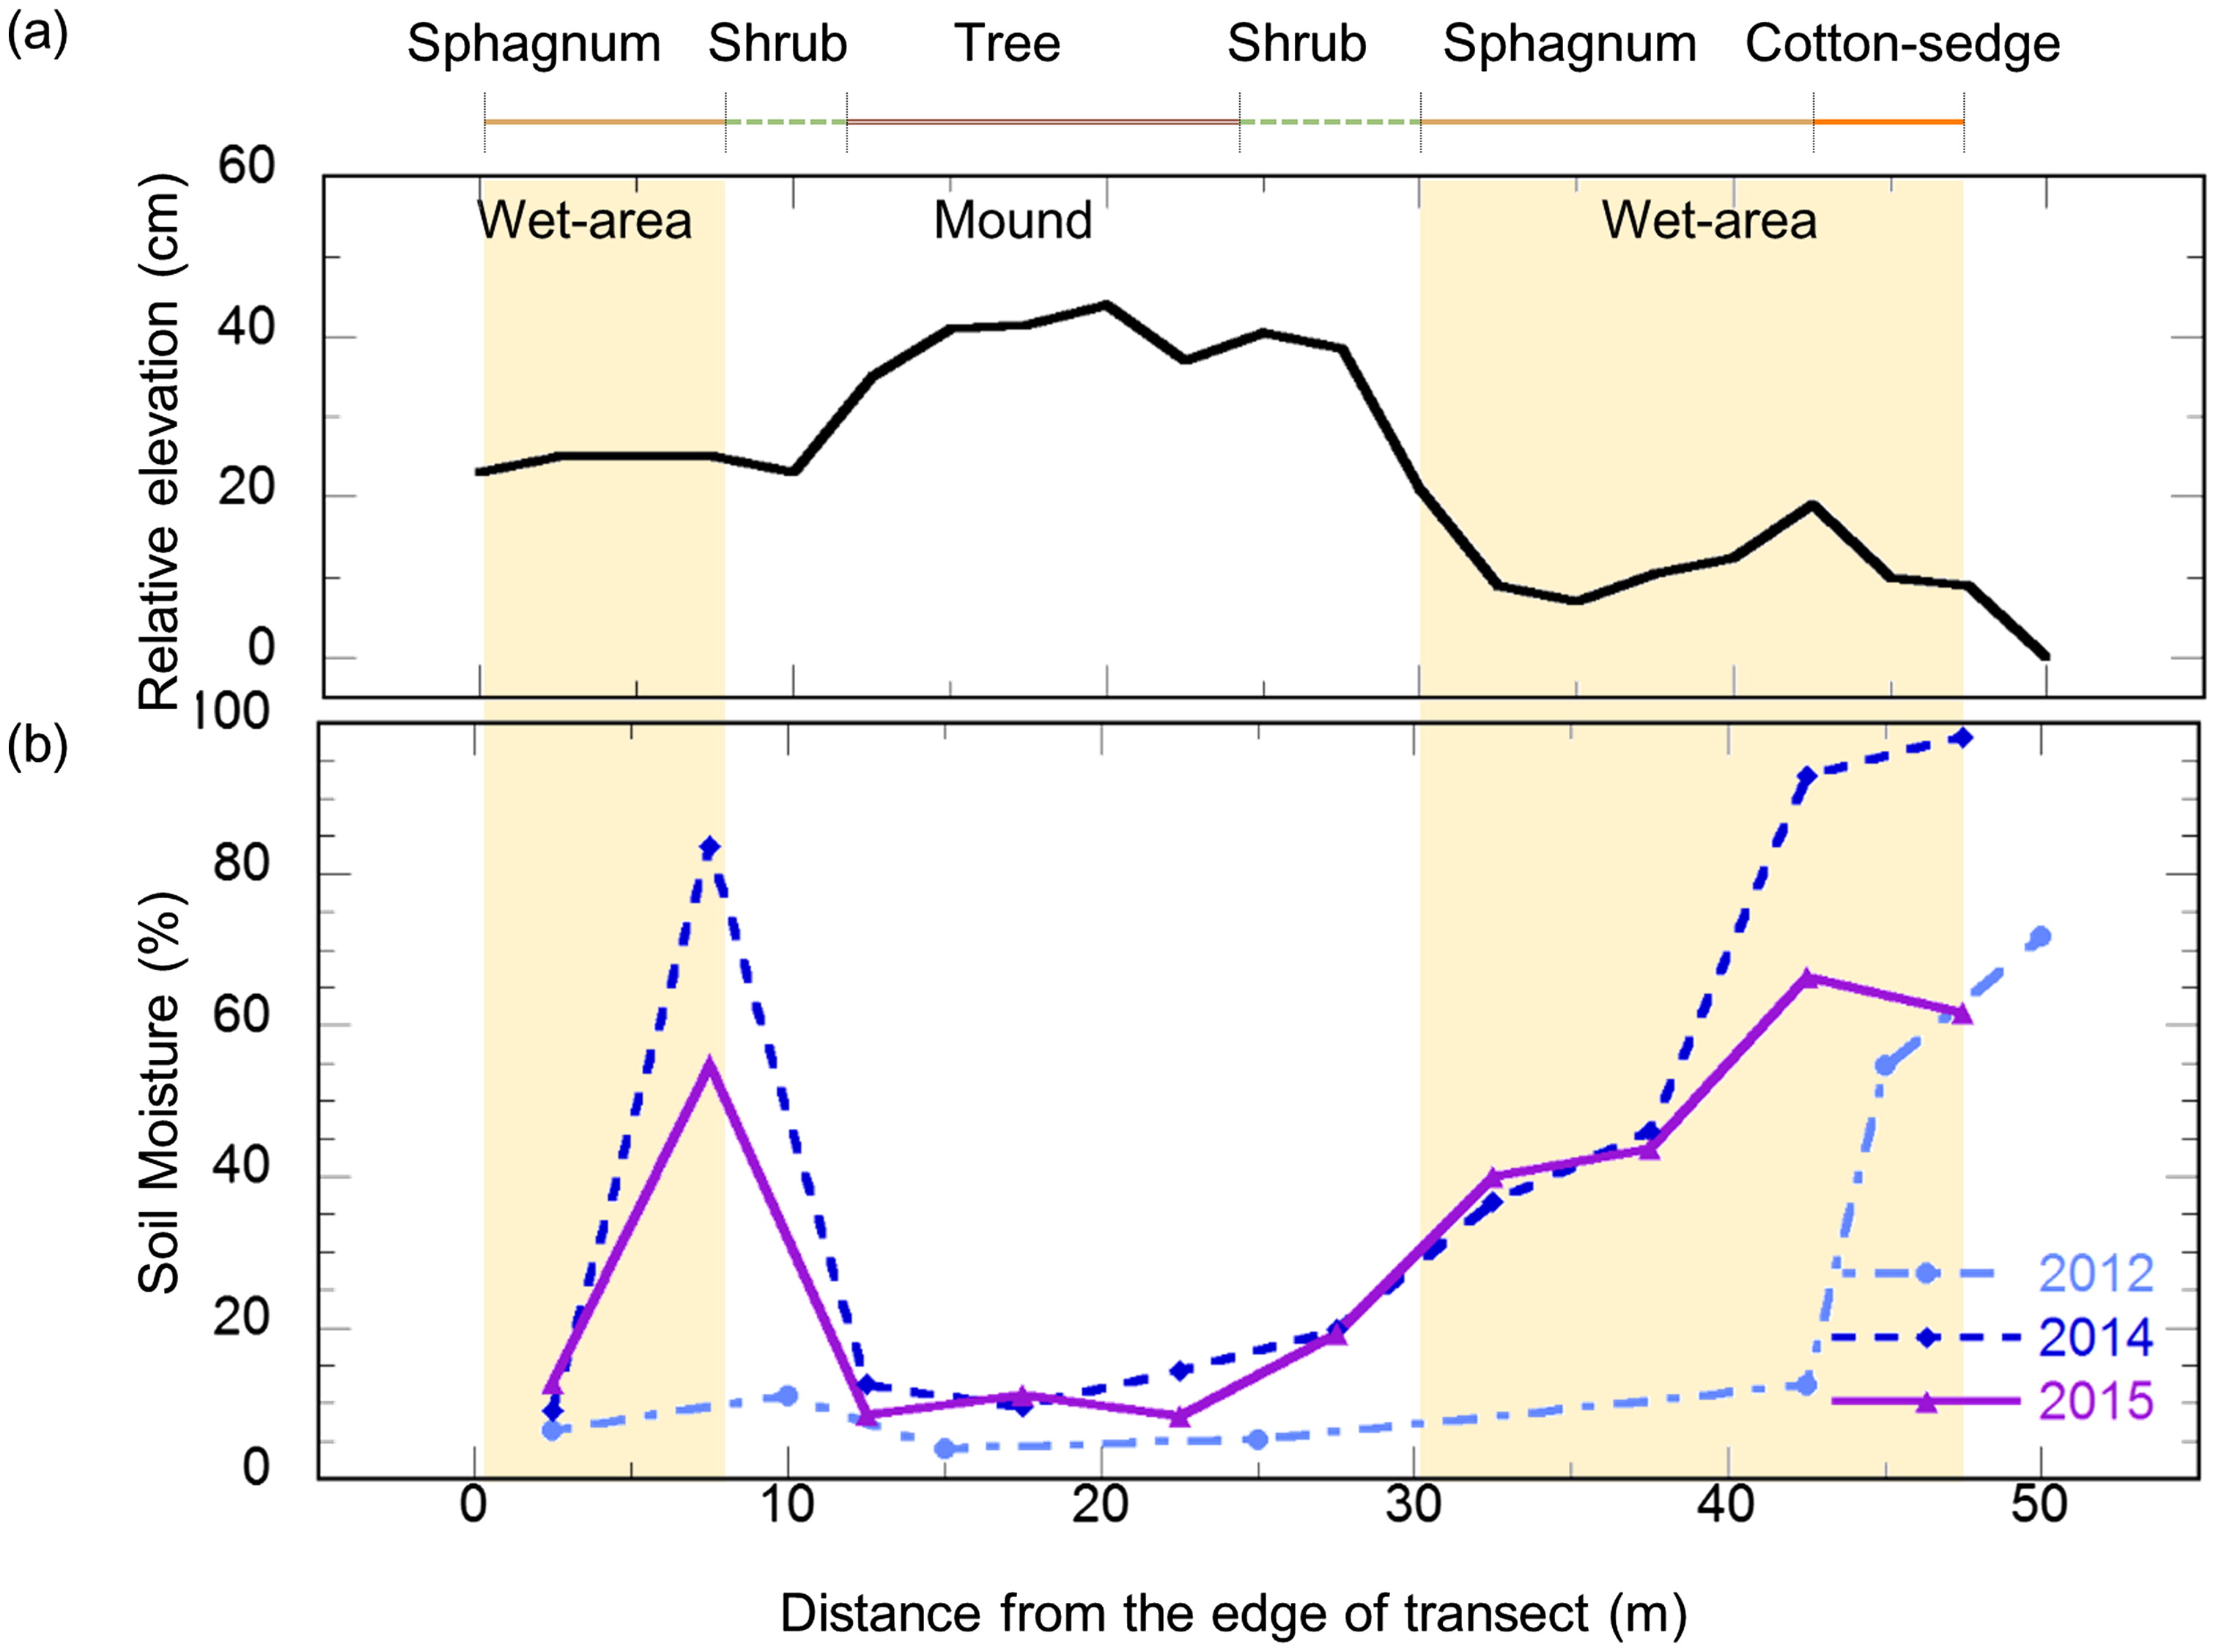
Fig. 3.
Vegetation, relative elevation (a) and soil moisture (b) along a 50-m transect. Soil moisture was measured as the averaged volumetric water content at the surface (0–8 cm) by time domain reflectance on 12 July 2012, 15 July 2014 and 12 July 2015. Sphagnum spp. and cotton-sedge areas are hatched to illustrate potential CH4 sources.
Table 1.
Classes assigned by visual observation and final classes based on satellite image mapping. Plant species composition classes corresponding to microtopographies were categorised into six classes. Because of the similarity of species compositions, structures and spectral features of satellite images among the shrub-dry, shrub-wet and dry-tussock classes, and between the willow and alder classes, these classes were combined into the shrub class and the willow class, respectively. Bare-land, river and lake classes were added, whereupon the landscape was finally grouped into nine classes.
Table 2.
Area and coverage of classification at the site scale (400 × 400 m).
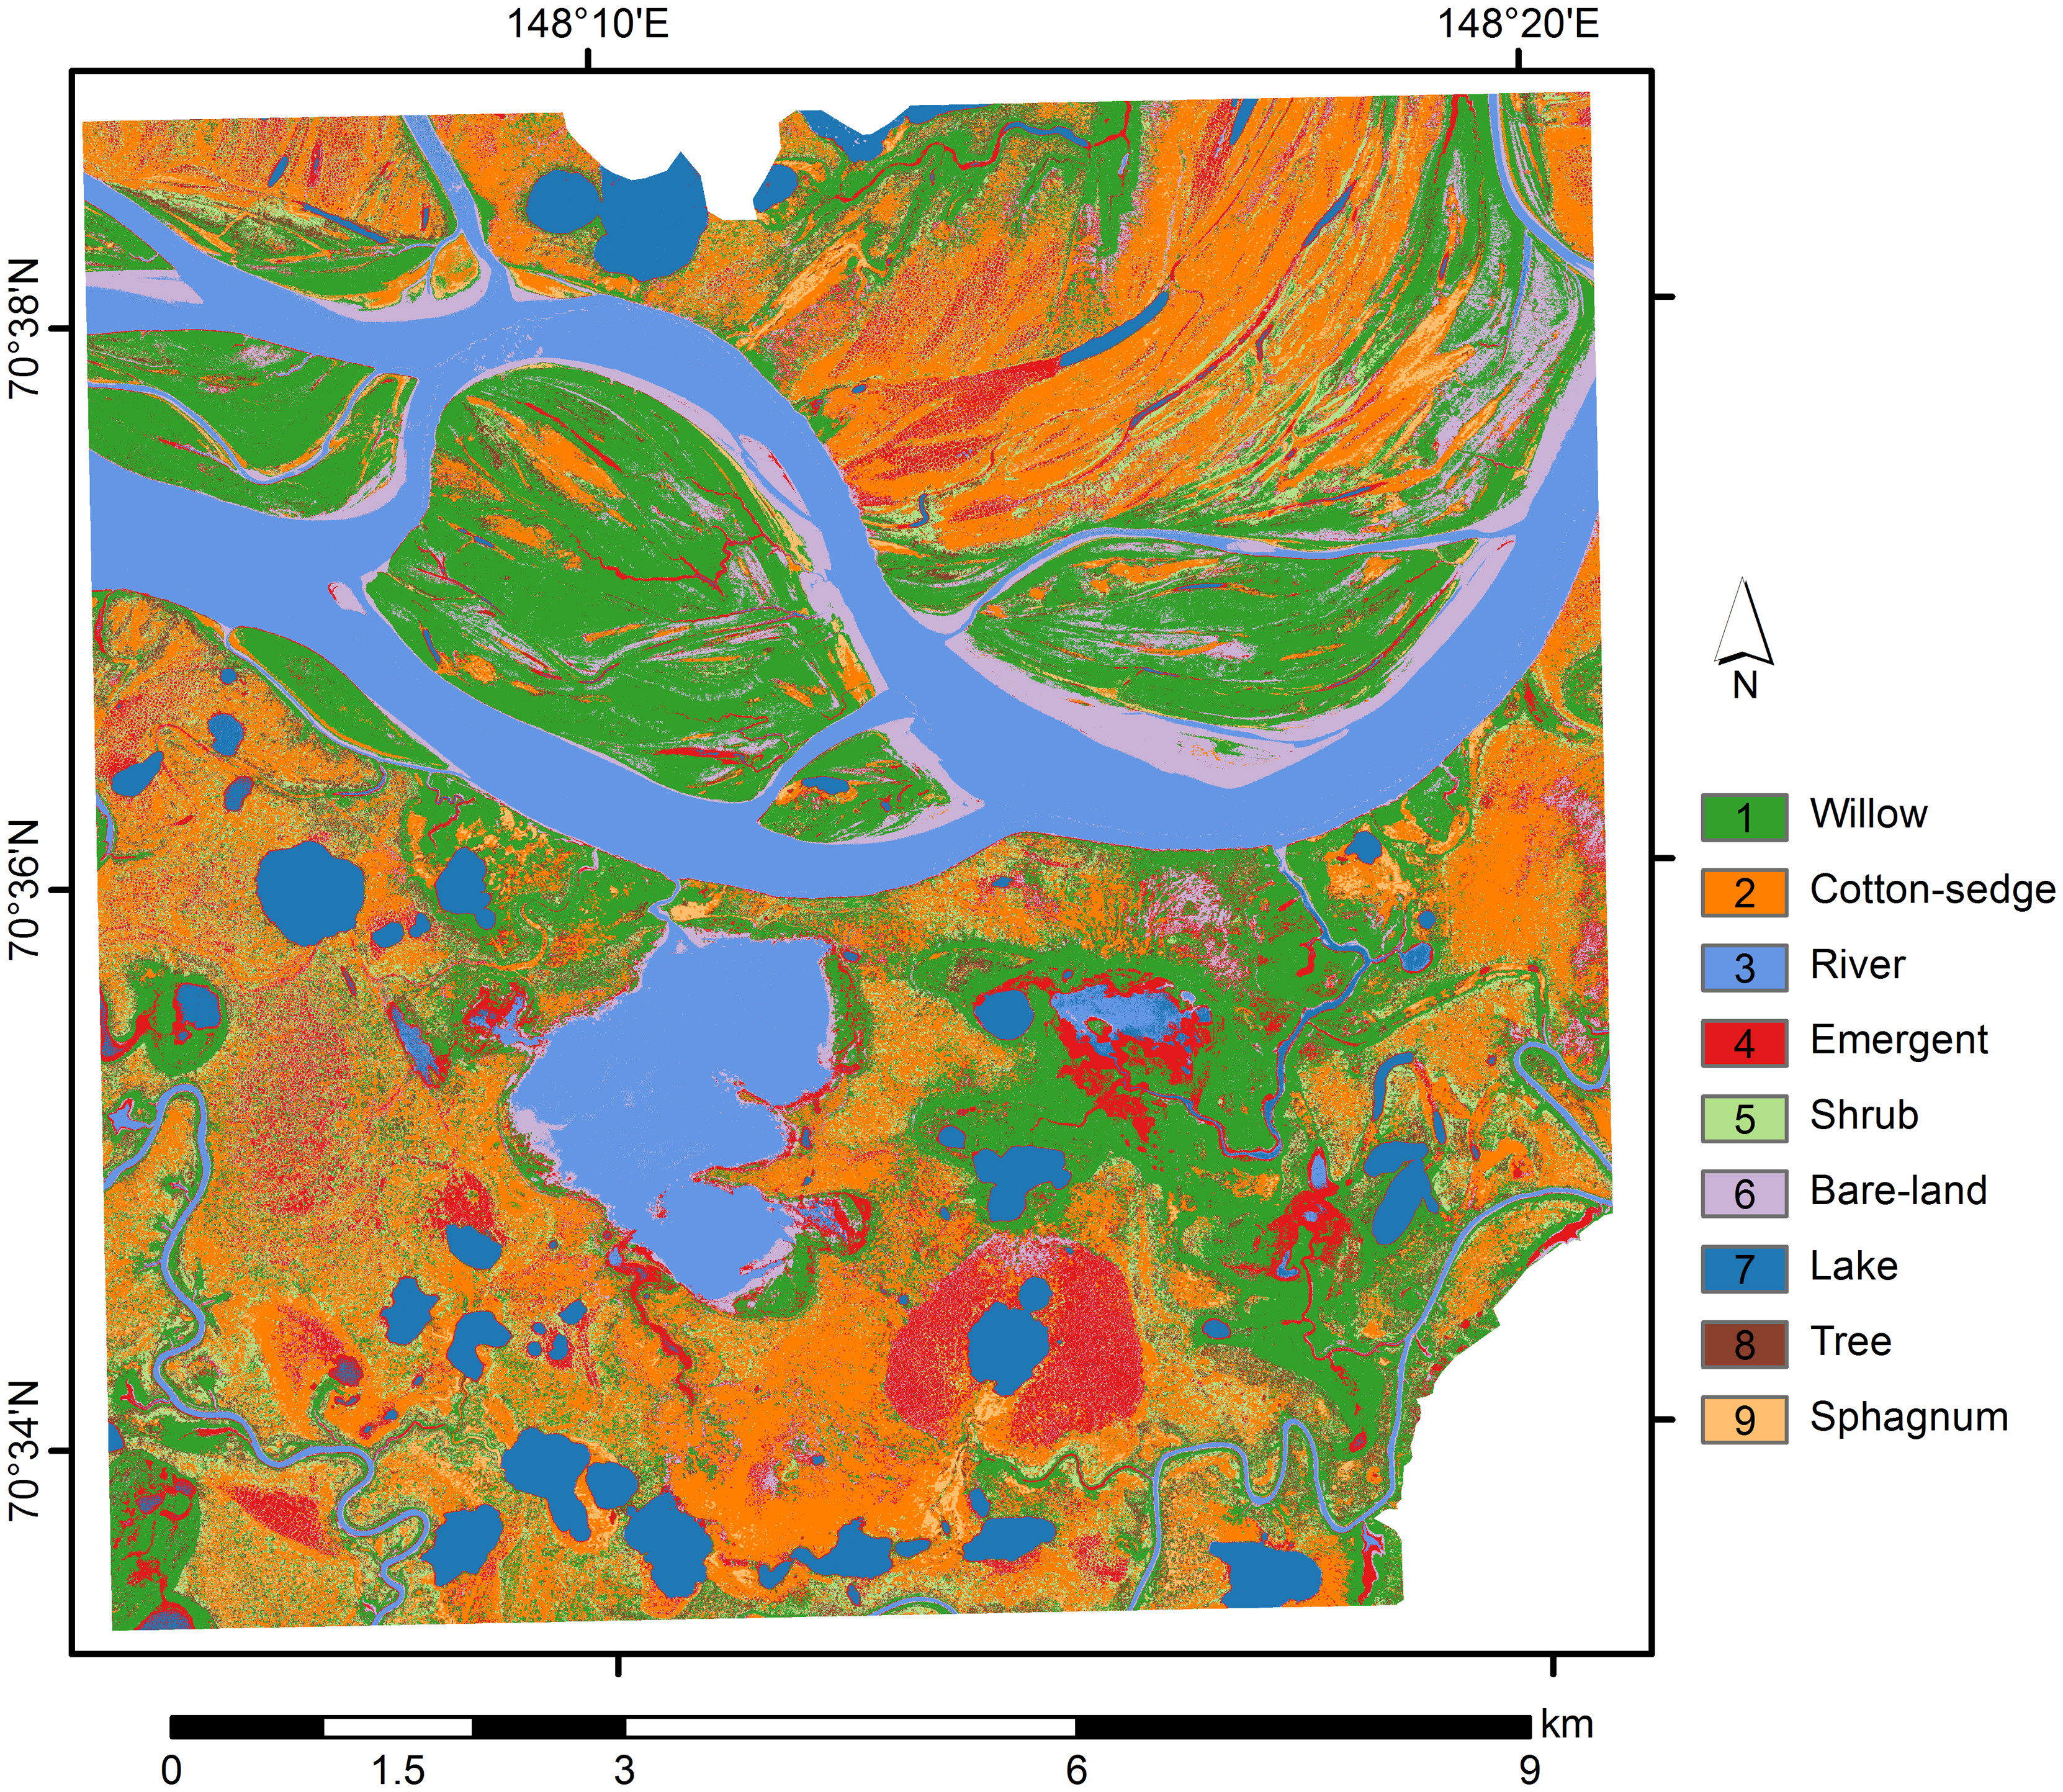
Fig. 4.
Vegetation map showing the nine classes at the local scale (10 × 10 km) obtained by the MLC-DTC (maximum-likelihood classification and decision tree classification combined) method.
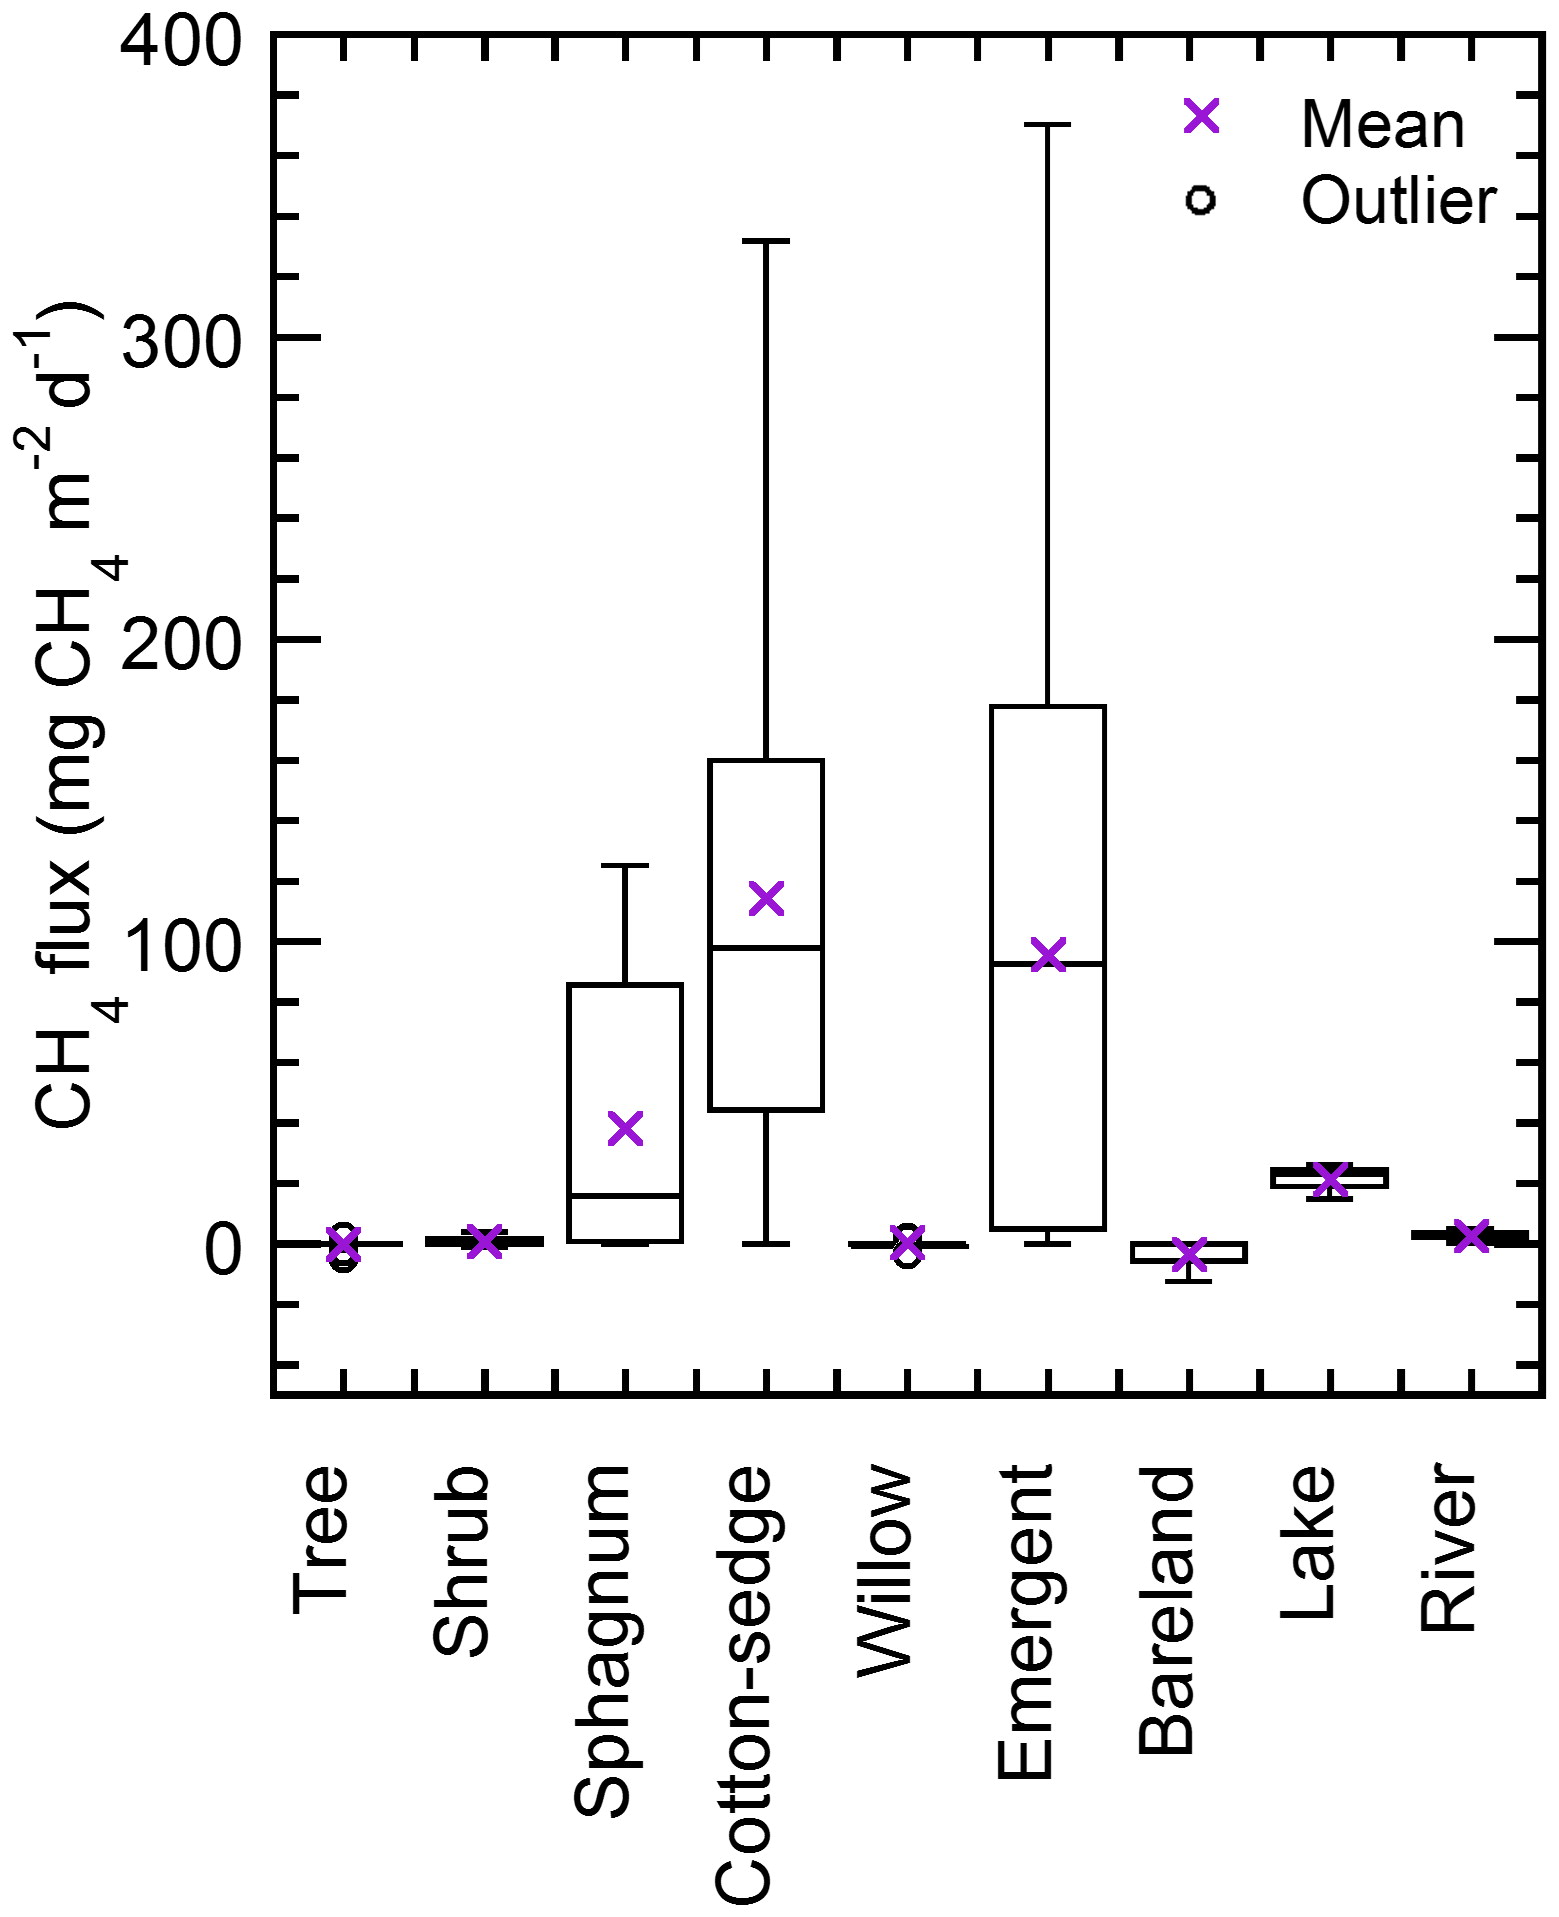
Fig. 5.
In situ CH4 flux measured by the chamber method in 2009–2016 during the summer growing season (3 July–9 August 2009–16, n (total) = 230). Only river CH4 flux was derived from dissolved CH4 concentration using the diffusive fraction with the transfer velocity method. Details are shown in Text S1 and Fig. S7.