
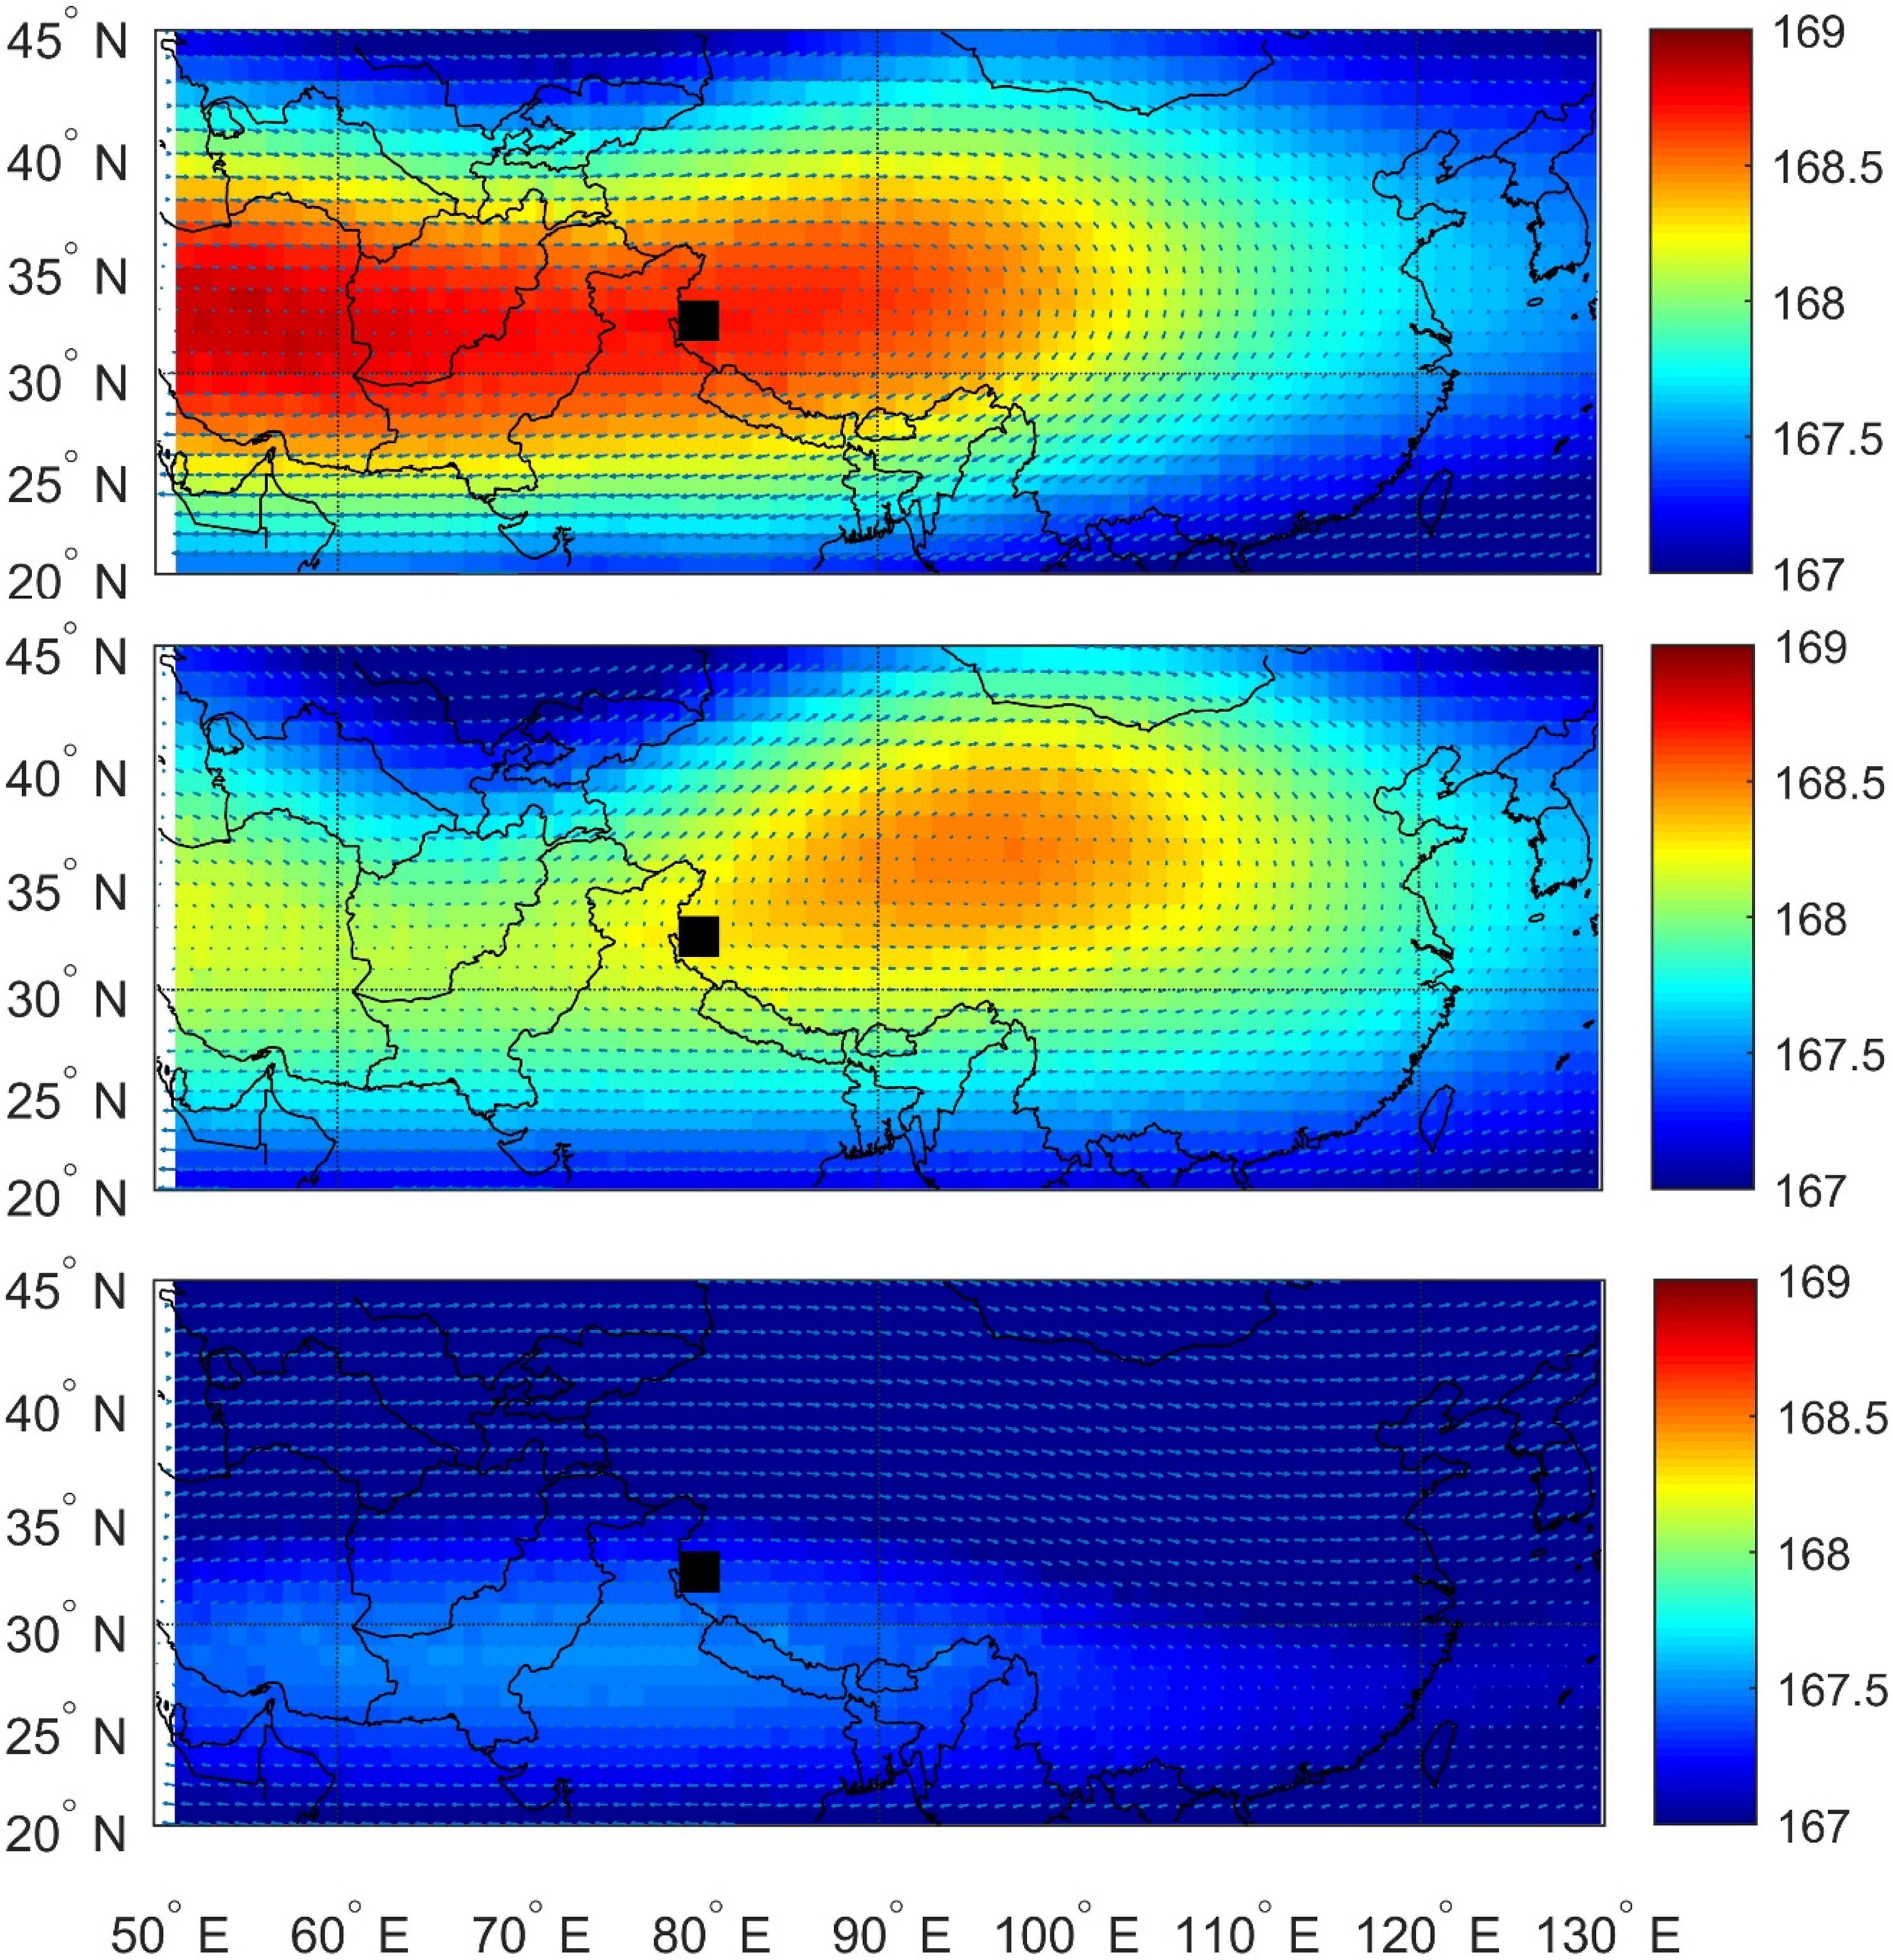
Fig. 1.
The distribution of monthly averaged geopotential height (in gpm) and wind field at 100 hPa over central Asia in (a) July, (b) August, and (c) September. The observation site is indicated by a black square.
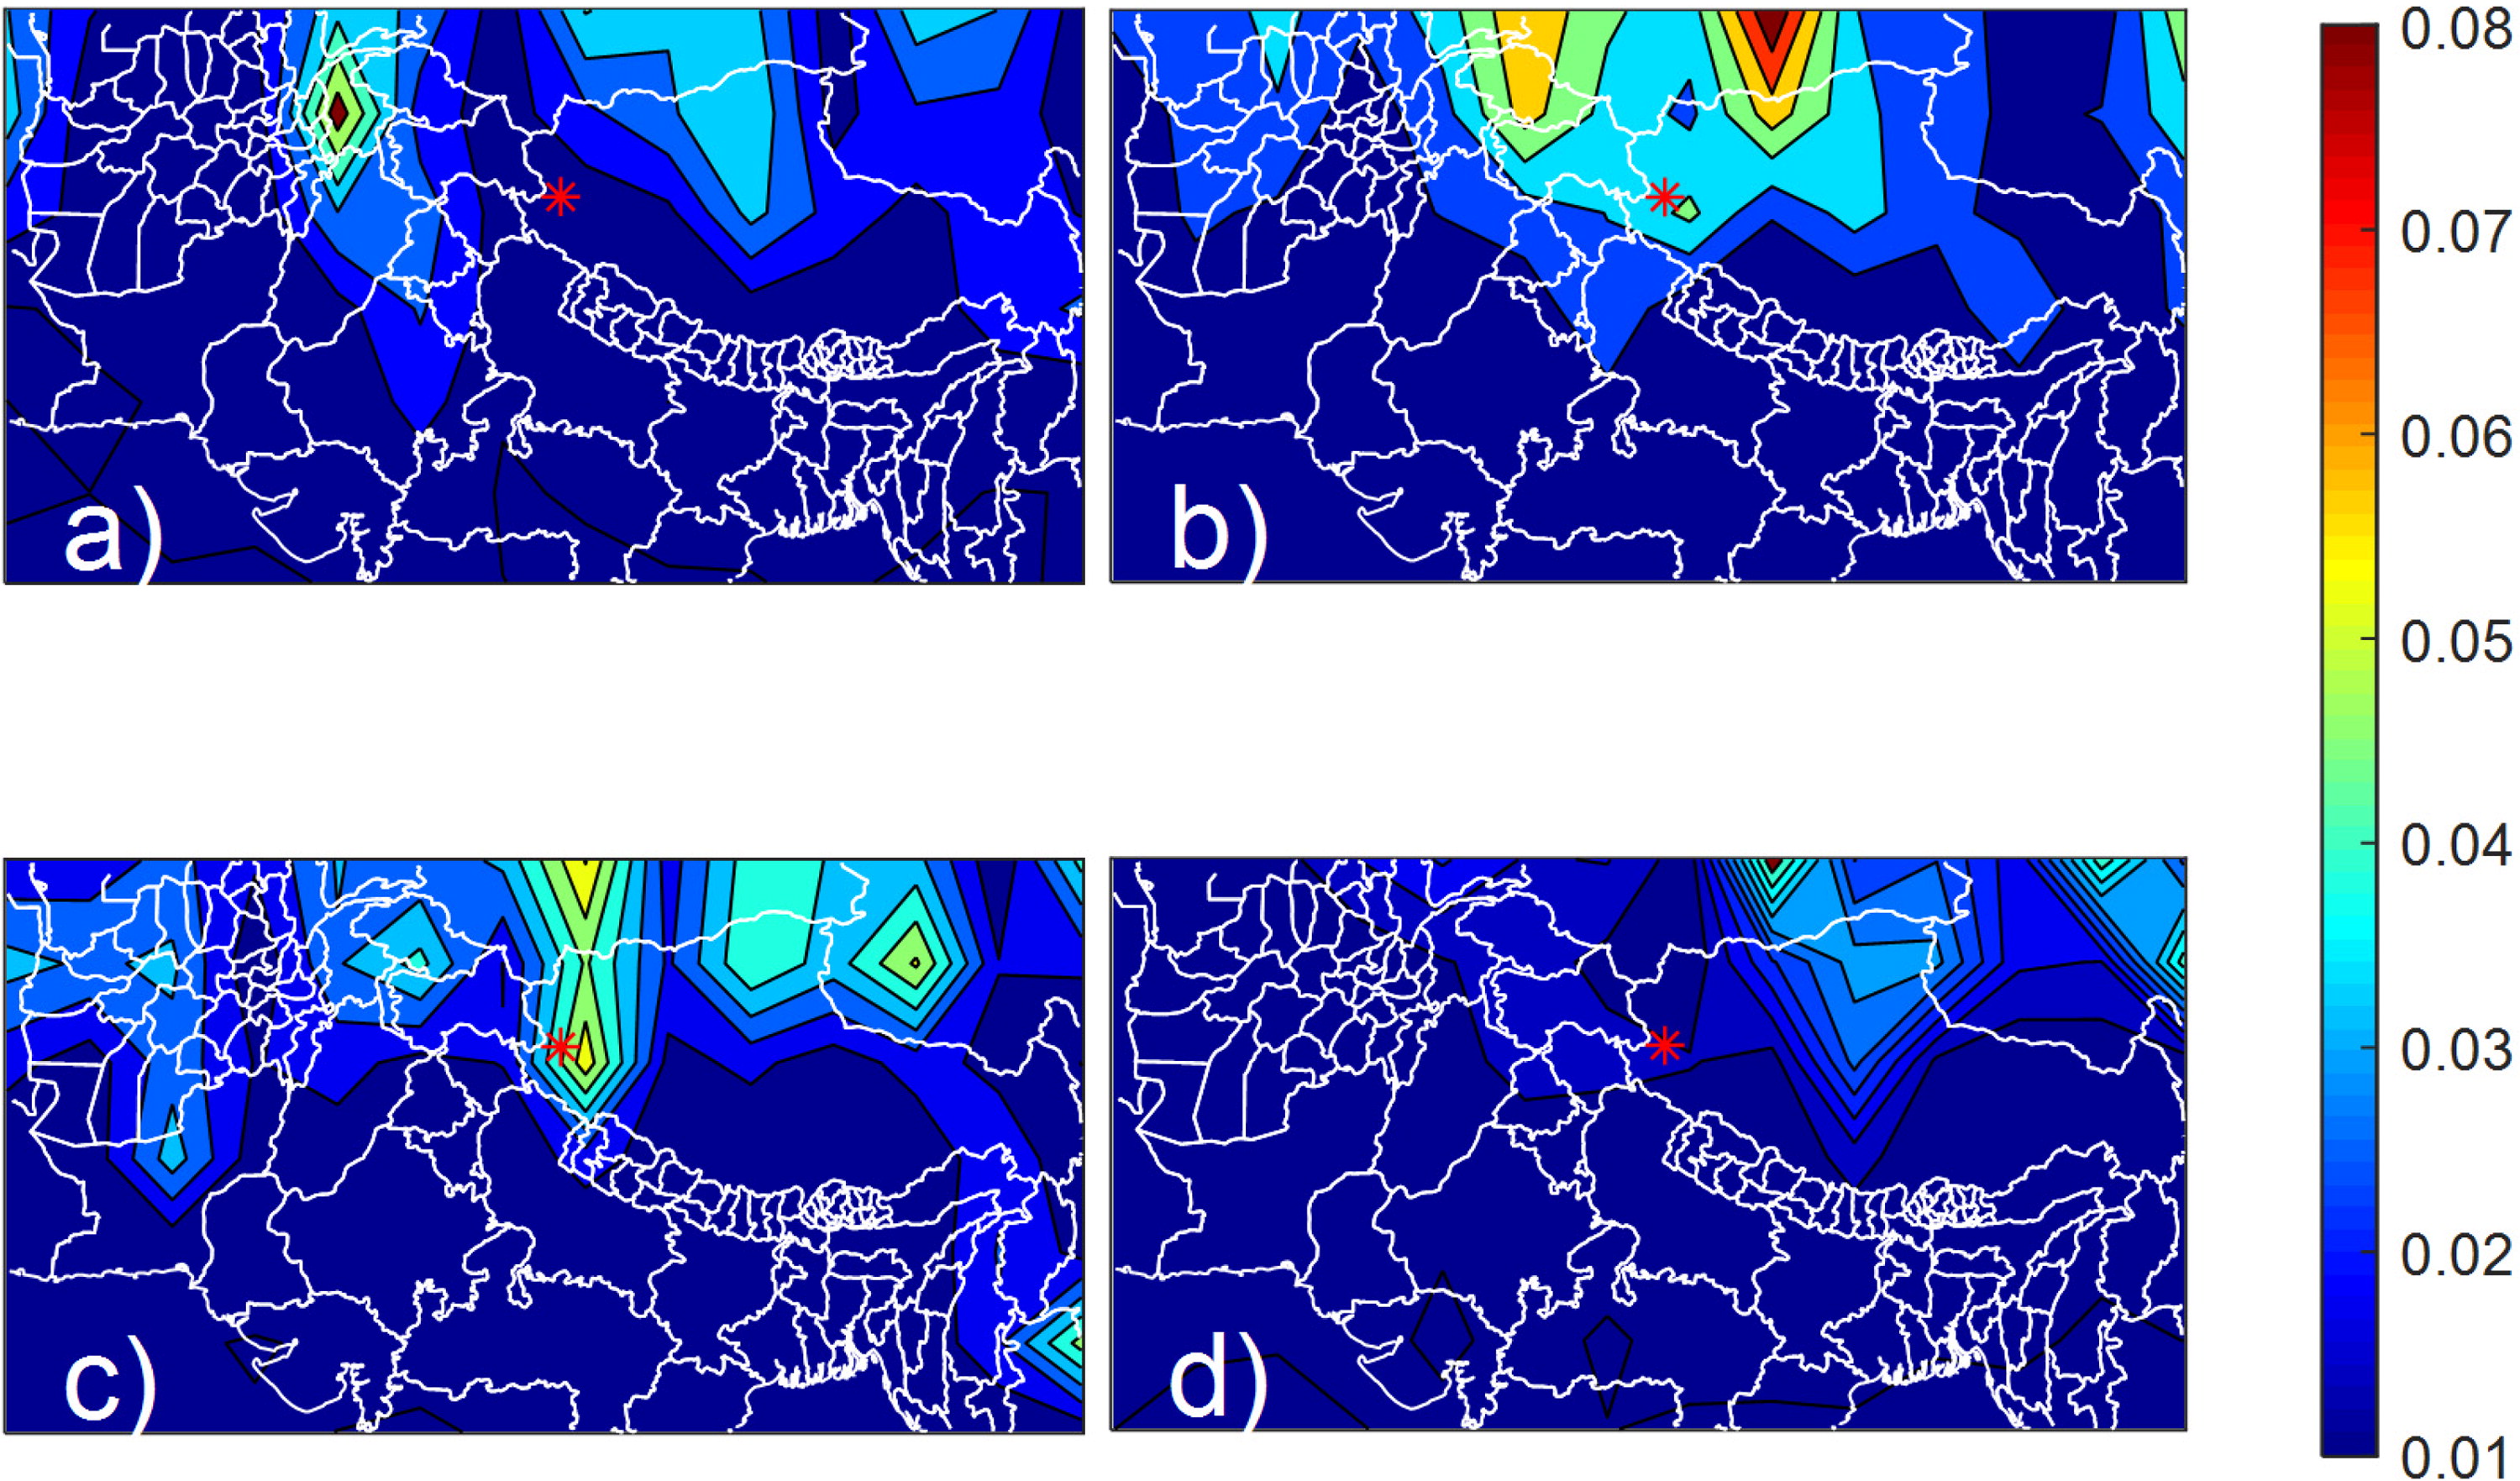
Fig. 2.
The distribution of the monthly averaged total aerosol backscatter (sr−1) from CALIPSO measurements over central Asia between 8.2 and 20.2 km altitude in (a) June, (b) July, (c) August, and (d) September. The observation site is indicated by a red asterisk.
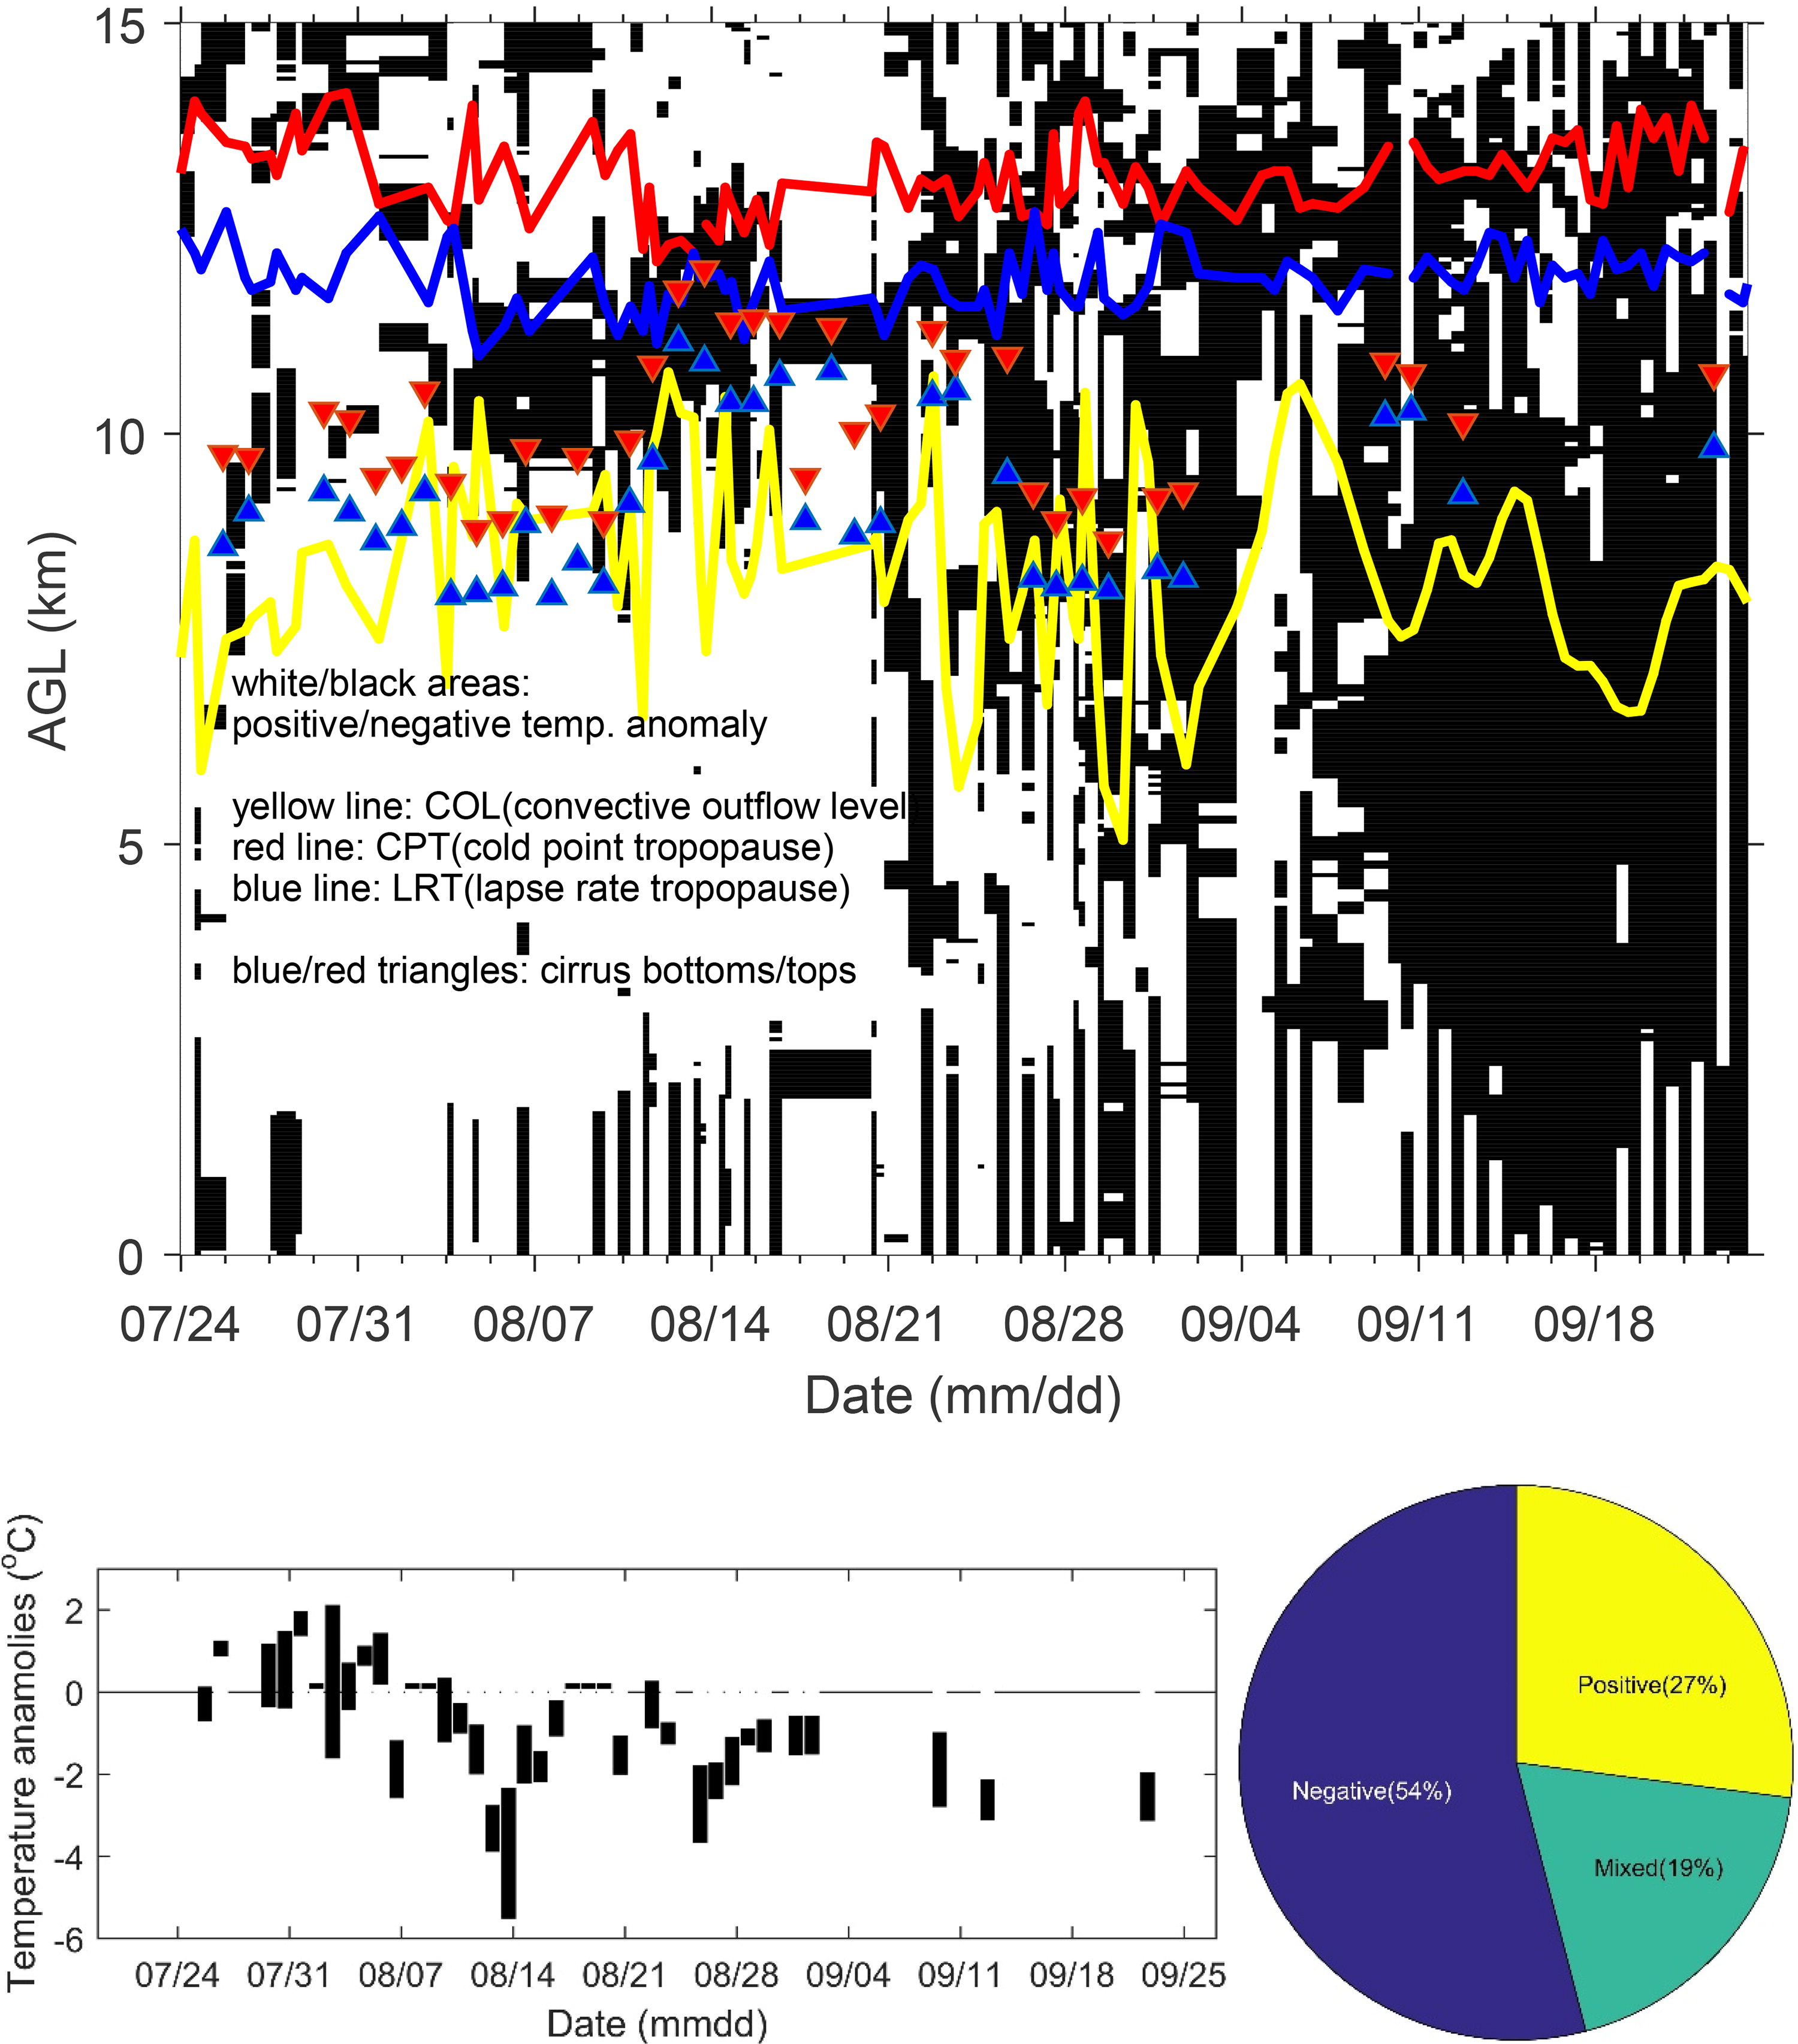
Fig. 3.
(a) Deviation field from the average temperature of the radiosondes in the summer of 2016. The white and black areas correspond to positive and negative deviations from the average temperature, respectively. The blue and red triangles are the observed bottoms and tops of cirrus clouds, respectively, and the red, blue, and yellow lines correspond to CPT (Cold Point Tropopause), LRT (Lapse rate Tropopause), and COL (Convective Outflow Level) altitudes, respectively. (b) Temporal variation of temperature deviation within cirrus clouds. (c) The attribution of temperature deviation proportions.
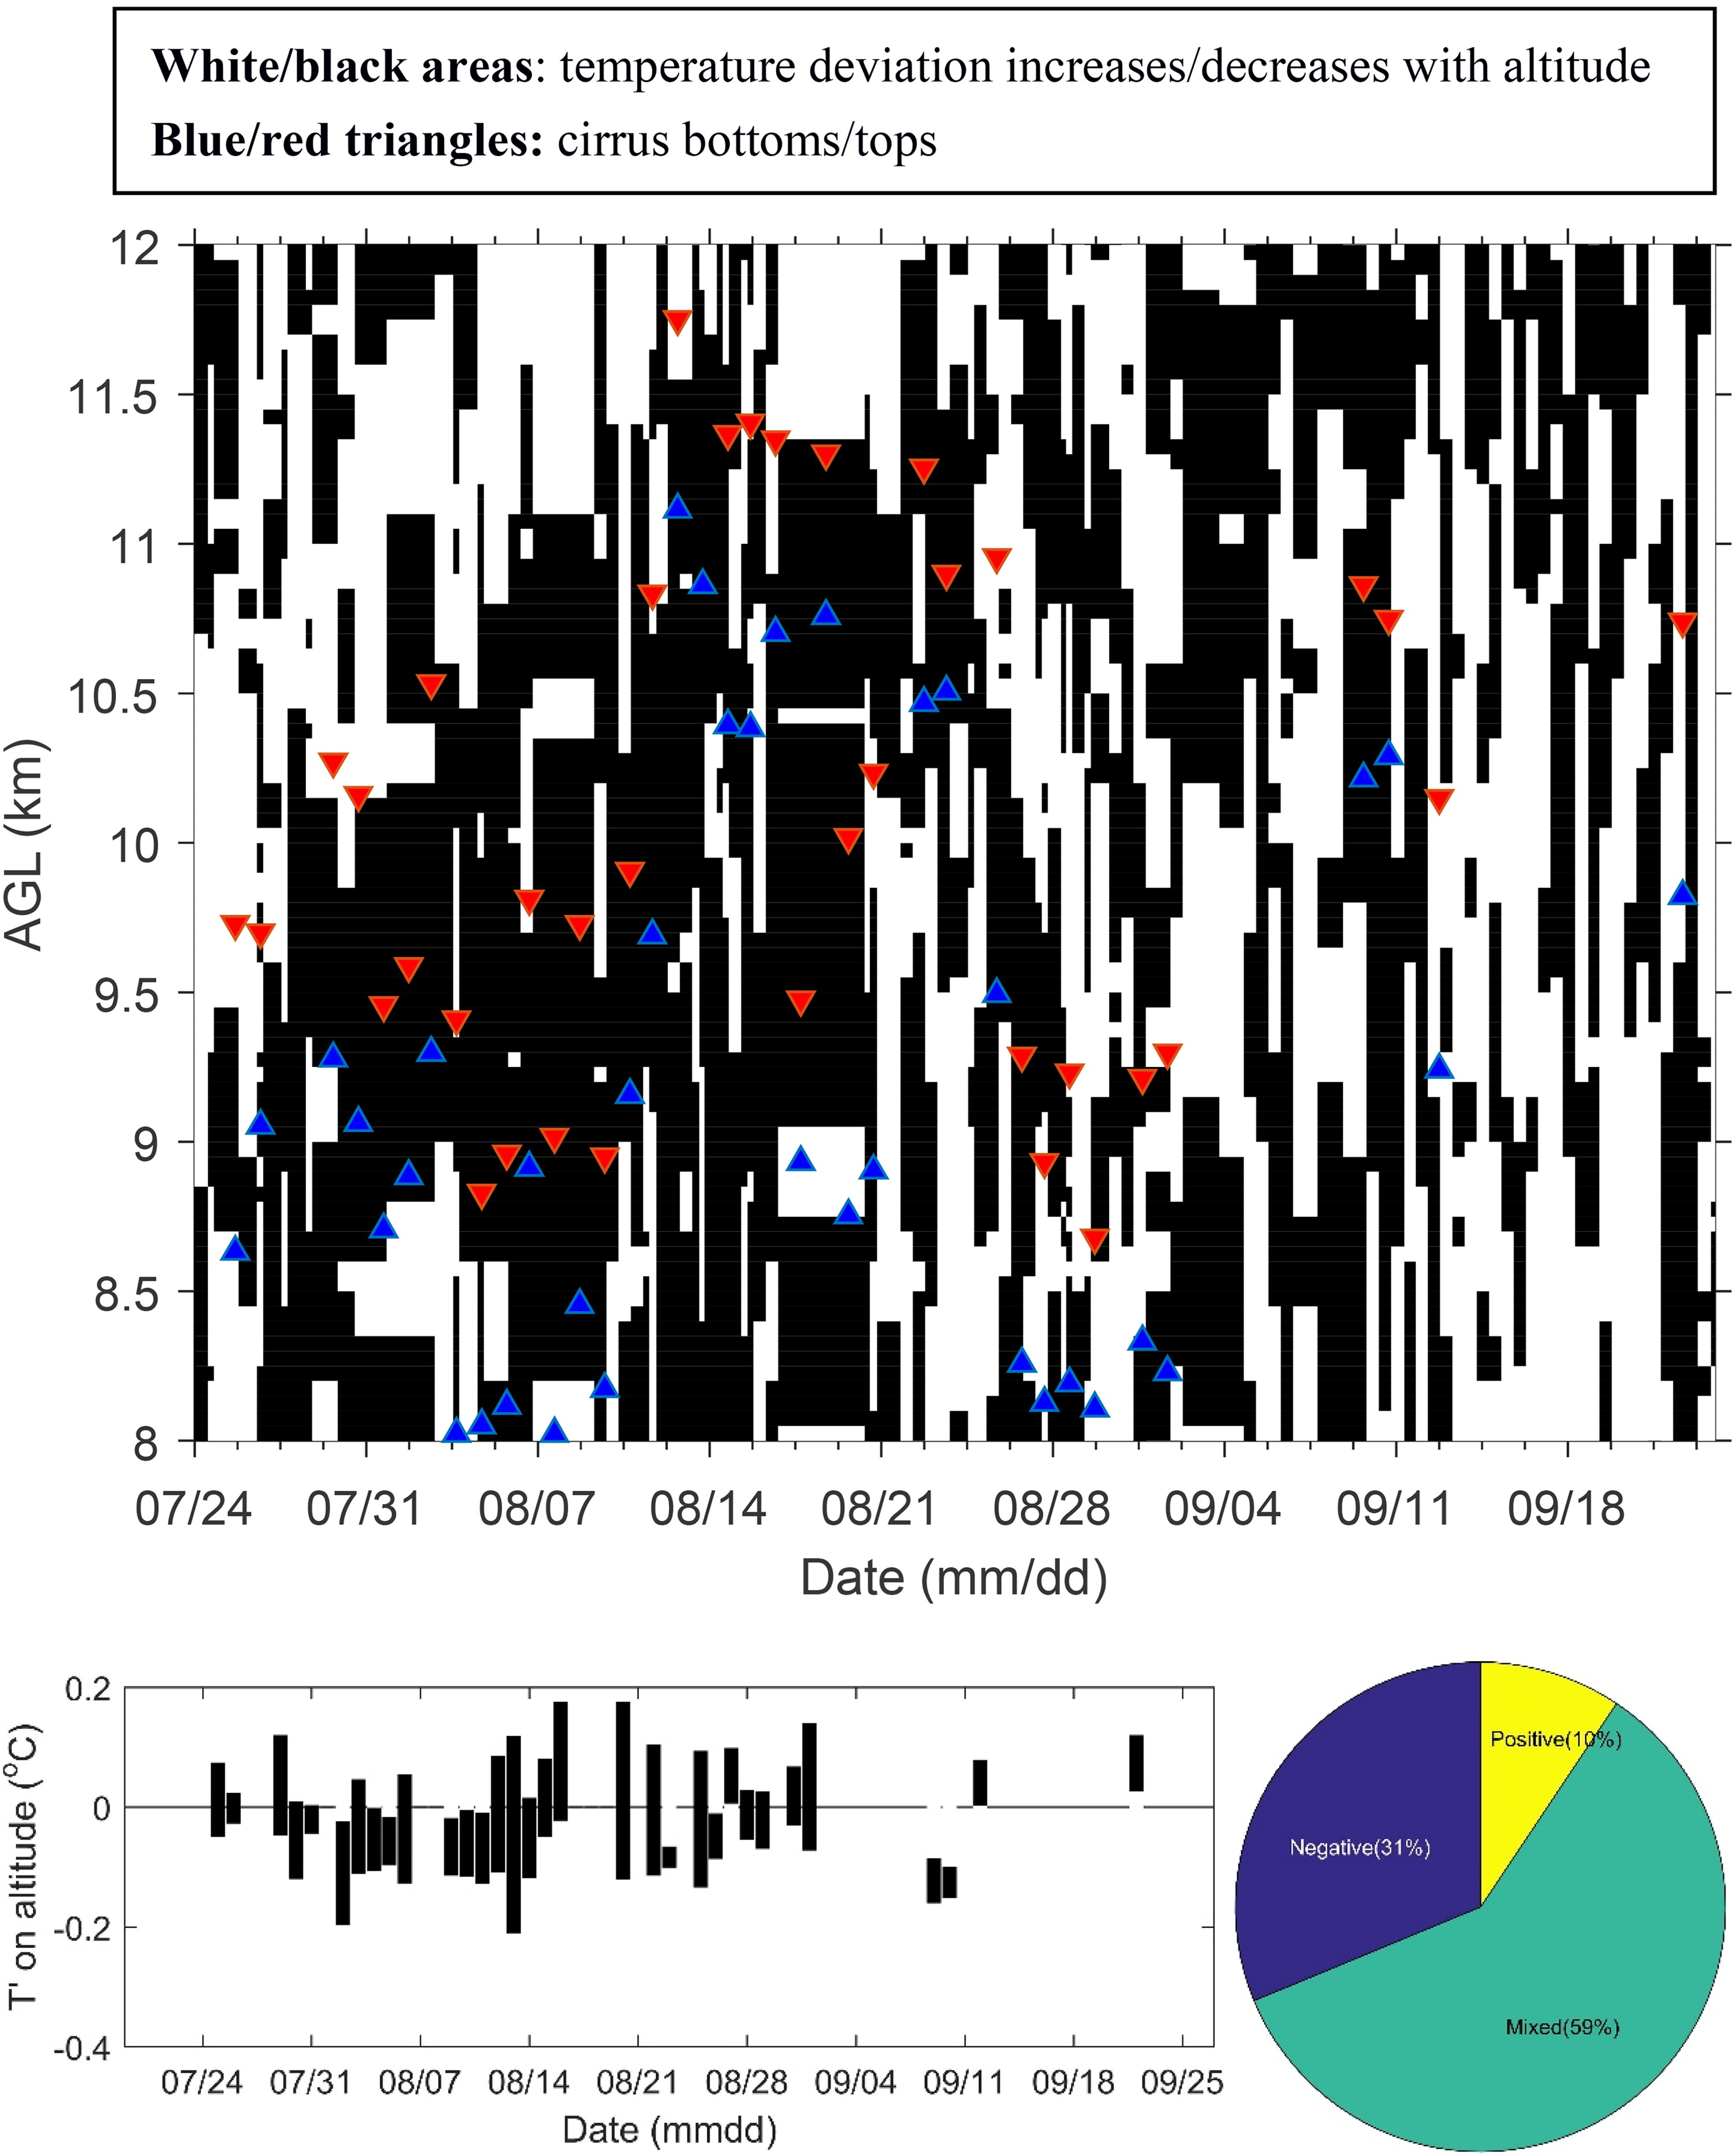
Fig. 4.
Data are plotted following Fig. 3, but with the gradient of temperature deviation plotted with altitude.
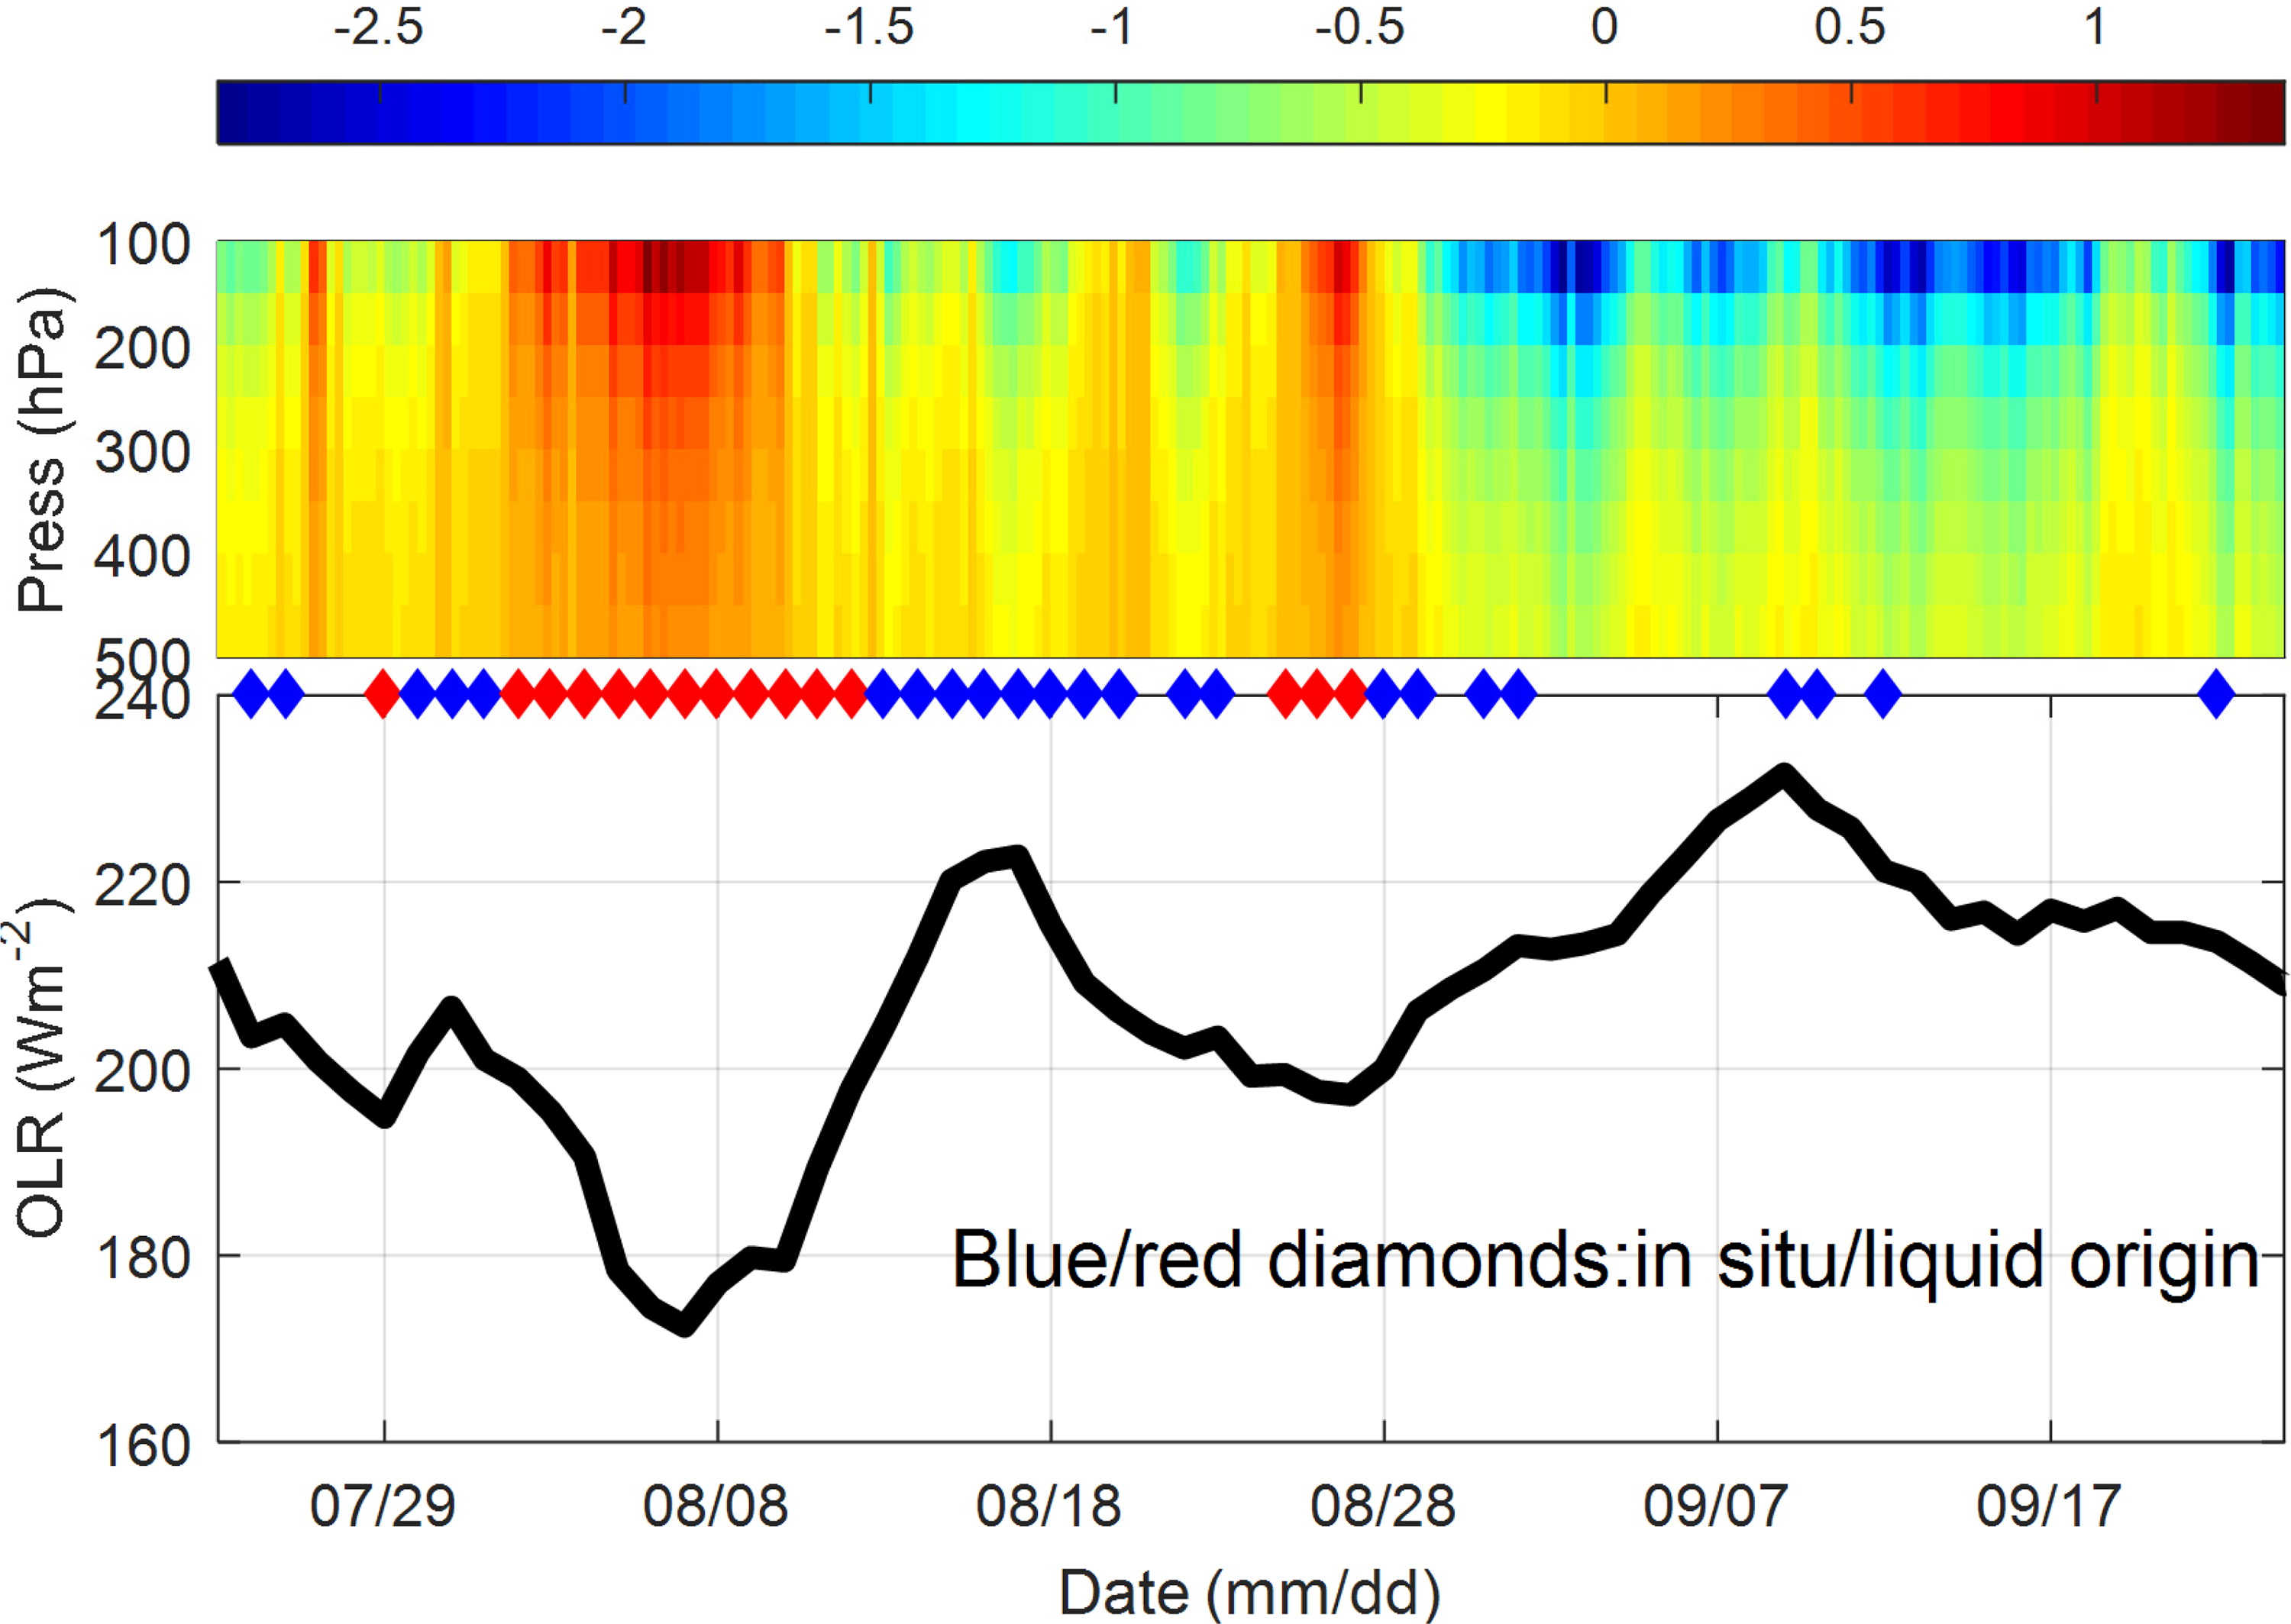
Fig. 5.
The temporal variation of vertical velocity (cm s−1) from the NCEP FNL data (upper panel) and the OLR calculated from the CDC OLR dataset over the Ali observation site (lower panel). The symbols represent the occurrence of cirrus clouds on the corresponding dates. Colors distinguish the origin (red for liquid and blue for in situ).
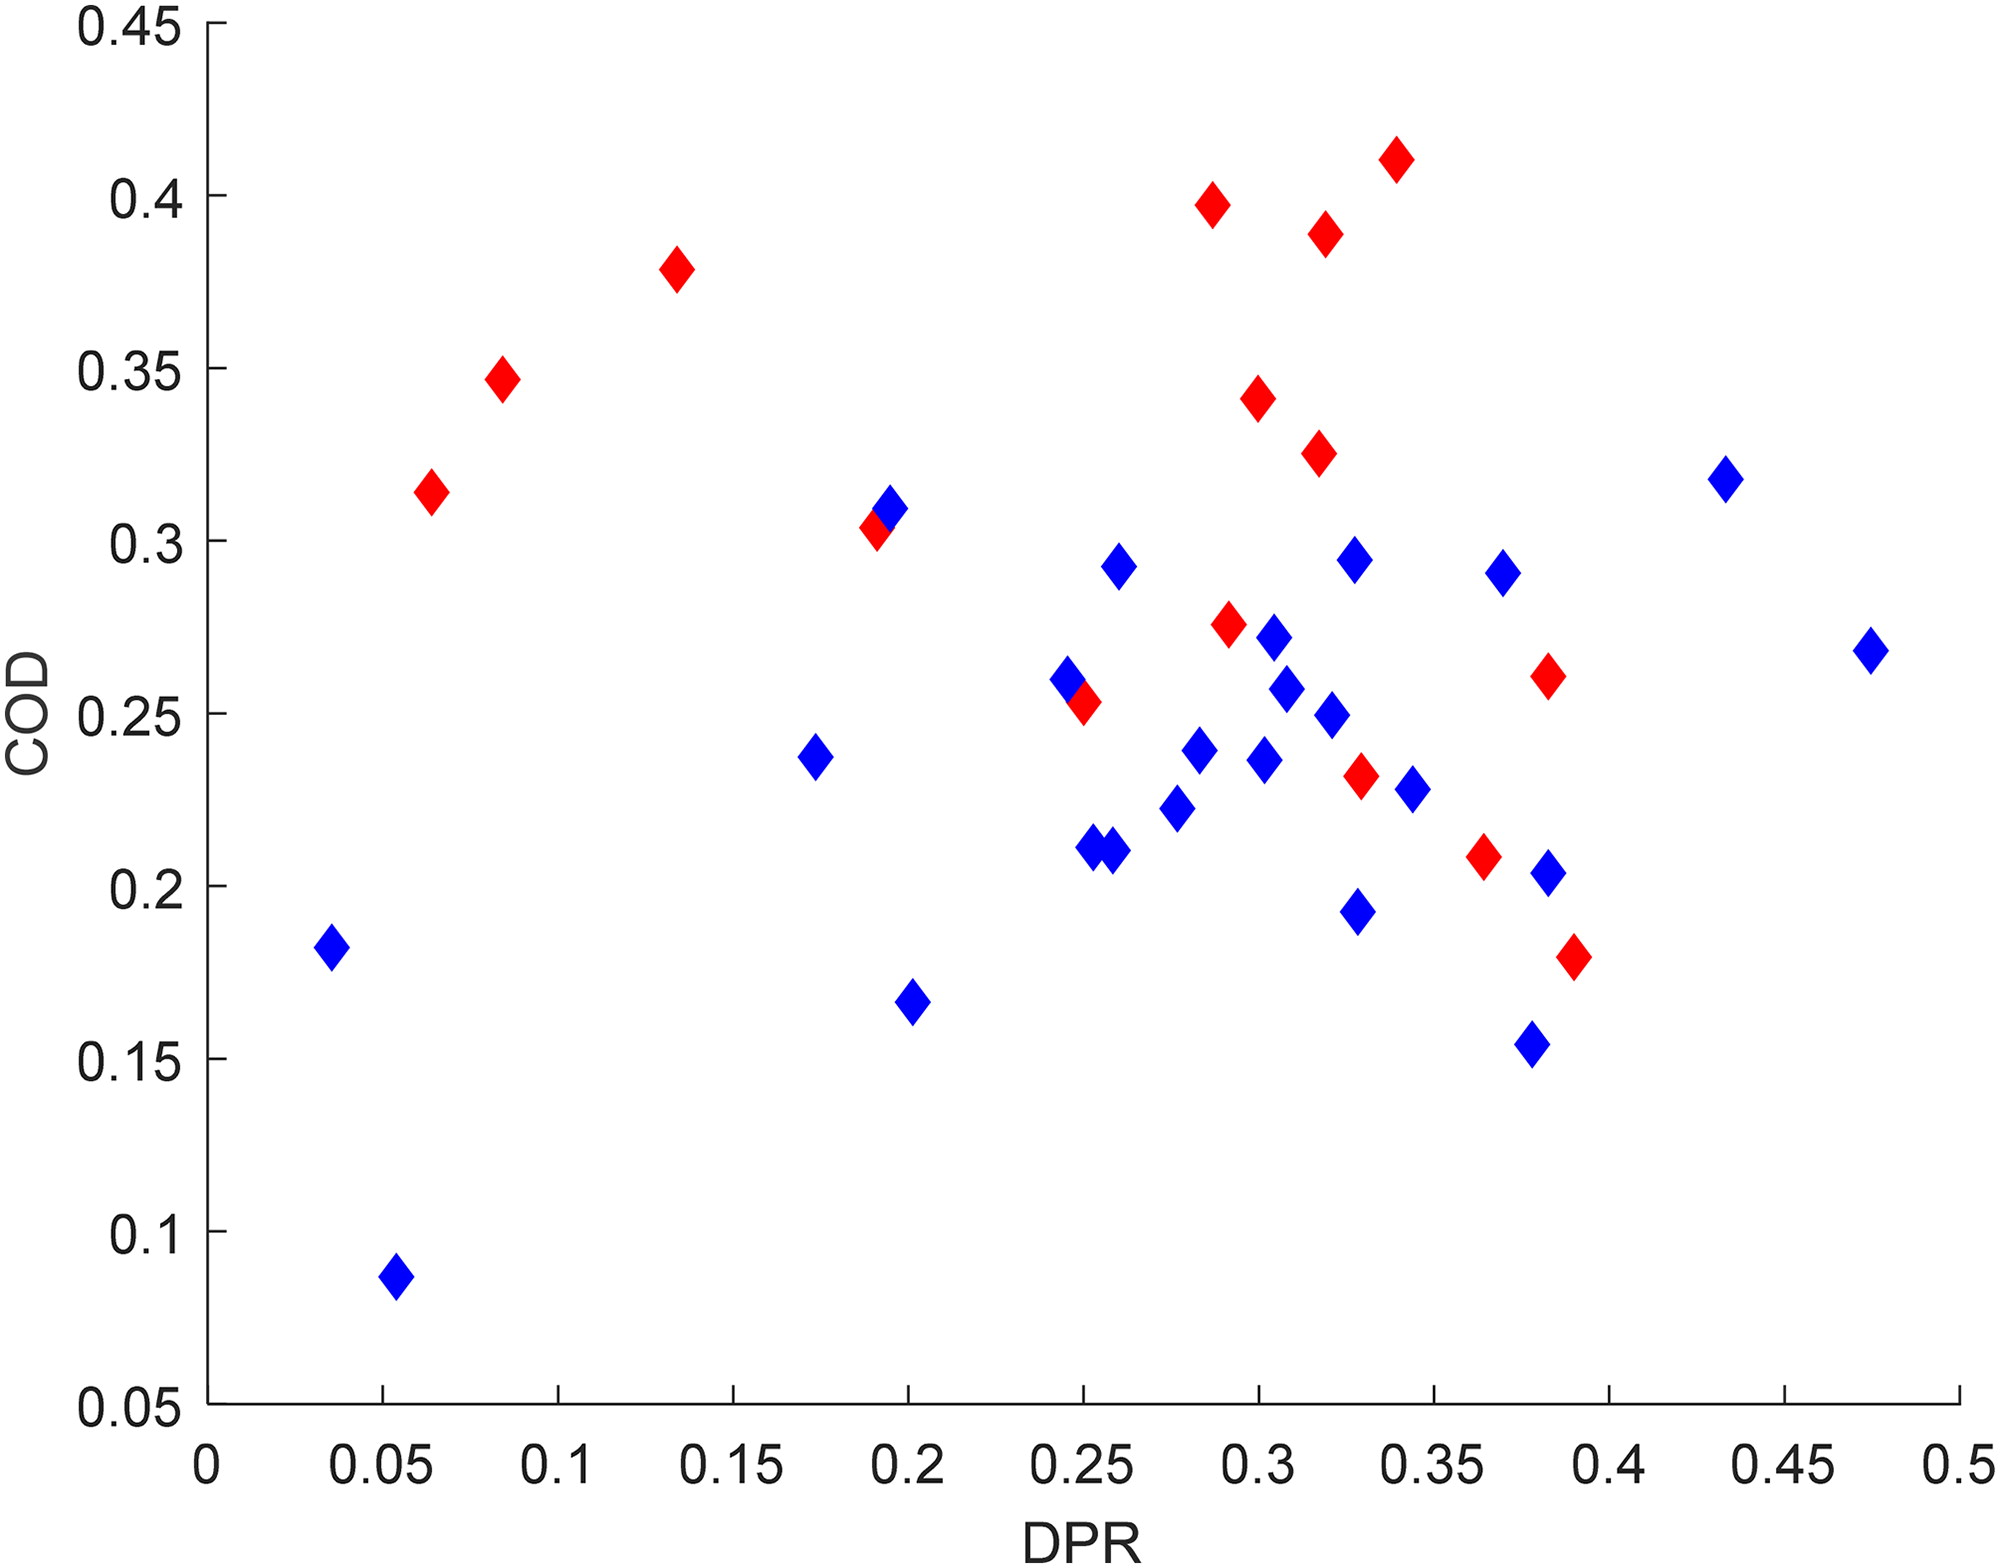
Fig. 6.
The relationship of the daily average optical parameters for Cloud Optical Depth (COD) and DePolarisation Ratio (DPR) from lidar retrieval according to different cirrus origins (blue: in-situ origin, red: liquid origin, see also Fig. 5).
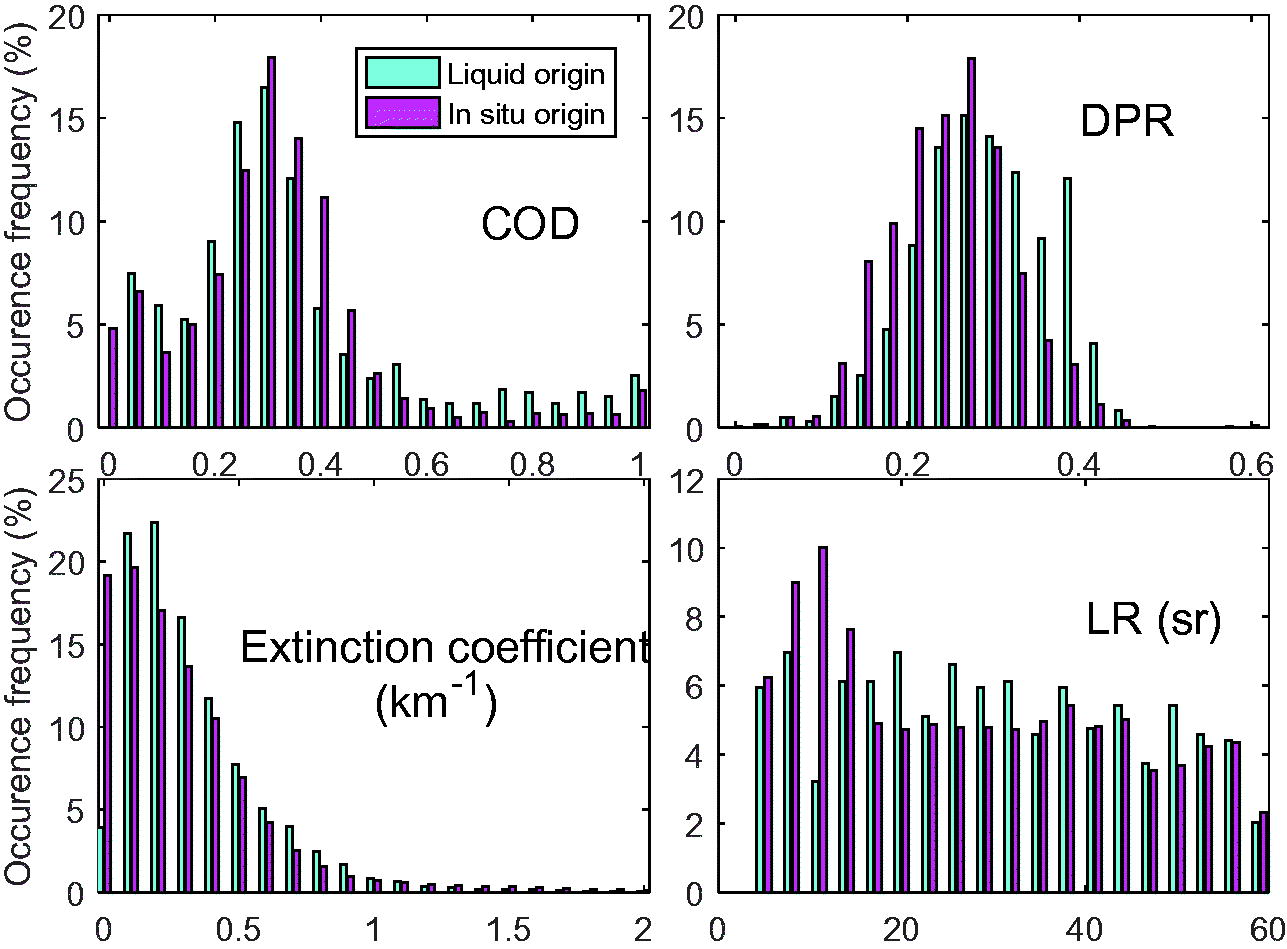
Fig. 7.
Frequencies of occurrence of optical parameters in cirrus clouds with in-situ and liquid origins.