Have a personal or library account? Click to login
Composition, isotopic fingerprint and source attribution of nitrate deposition from rain and fog at a Sub-Arctic Mountain site in Central Sweden (Mt Åreskutan) Cover

Composition, isotopic fingerprint and source attribution of nitrate deposition from rain and fog at a Sub-Arctic Mountain site in Central Sweden (Mt Åreskutan)

Open Access
|Jan 2019

Figures & Tables

Fig. 1.

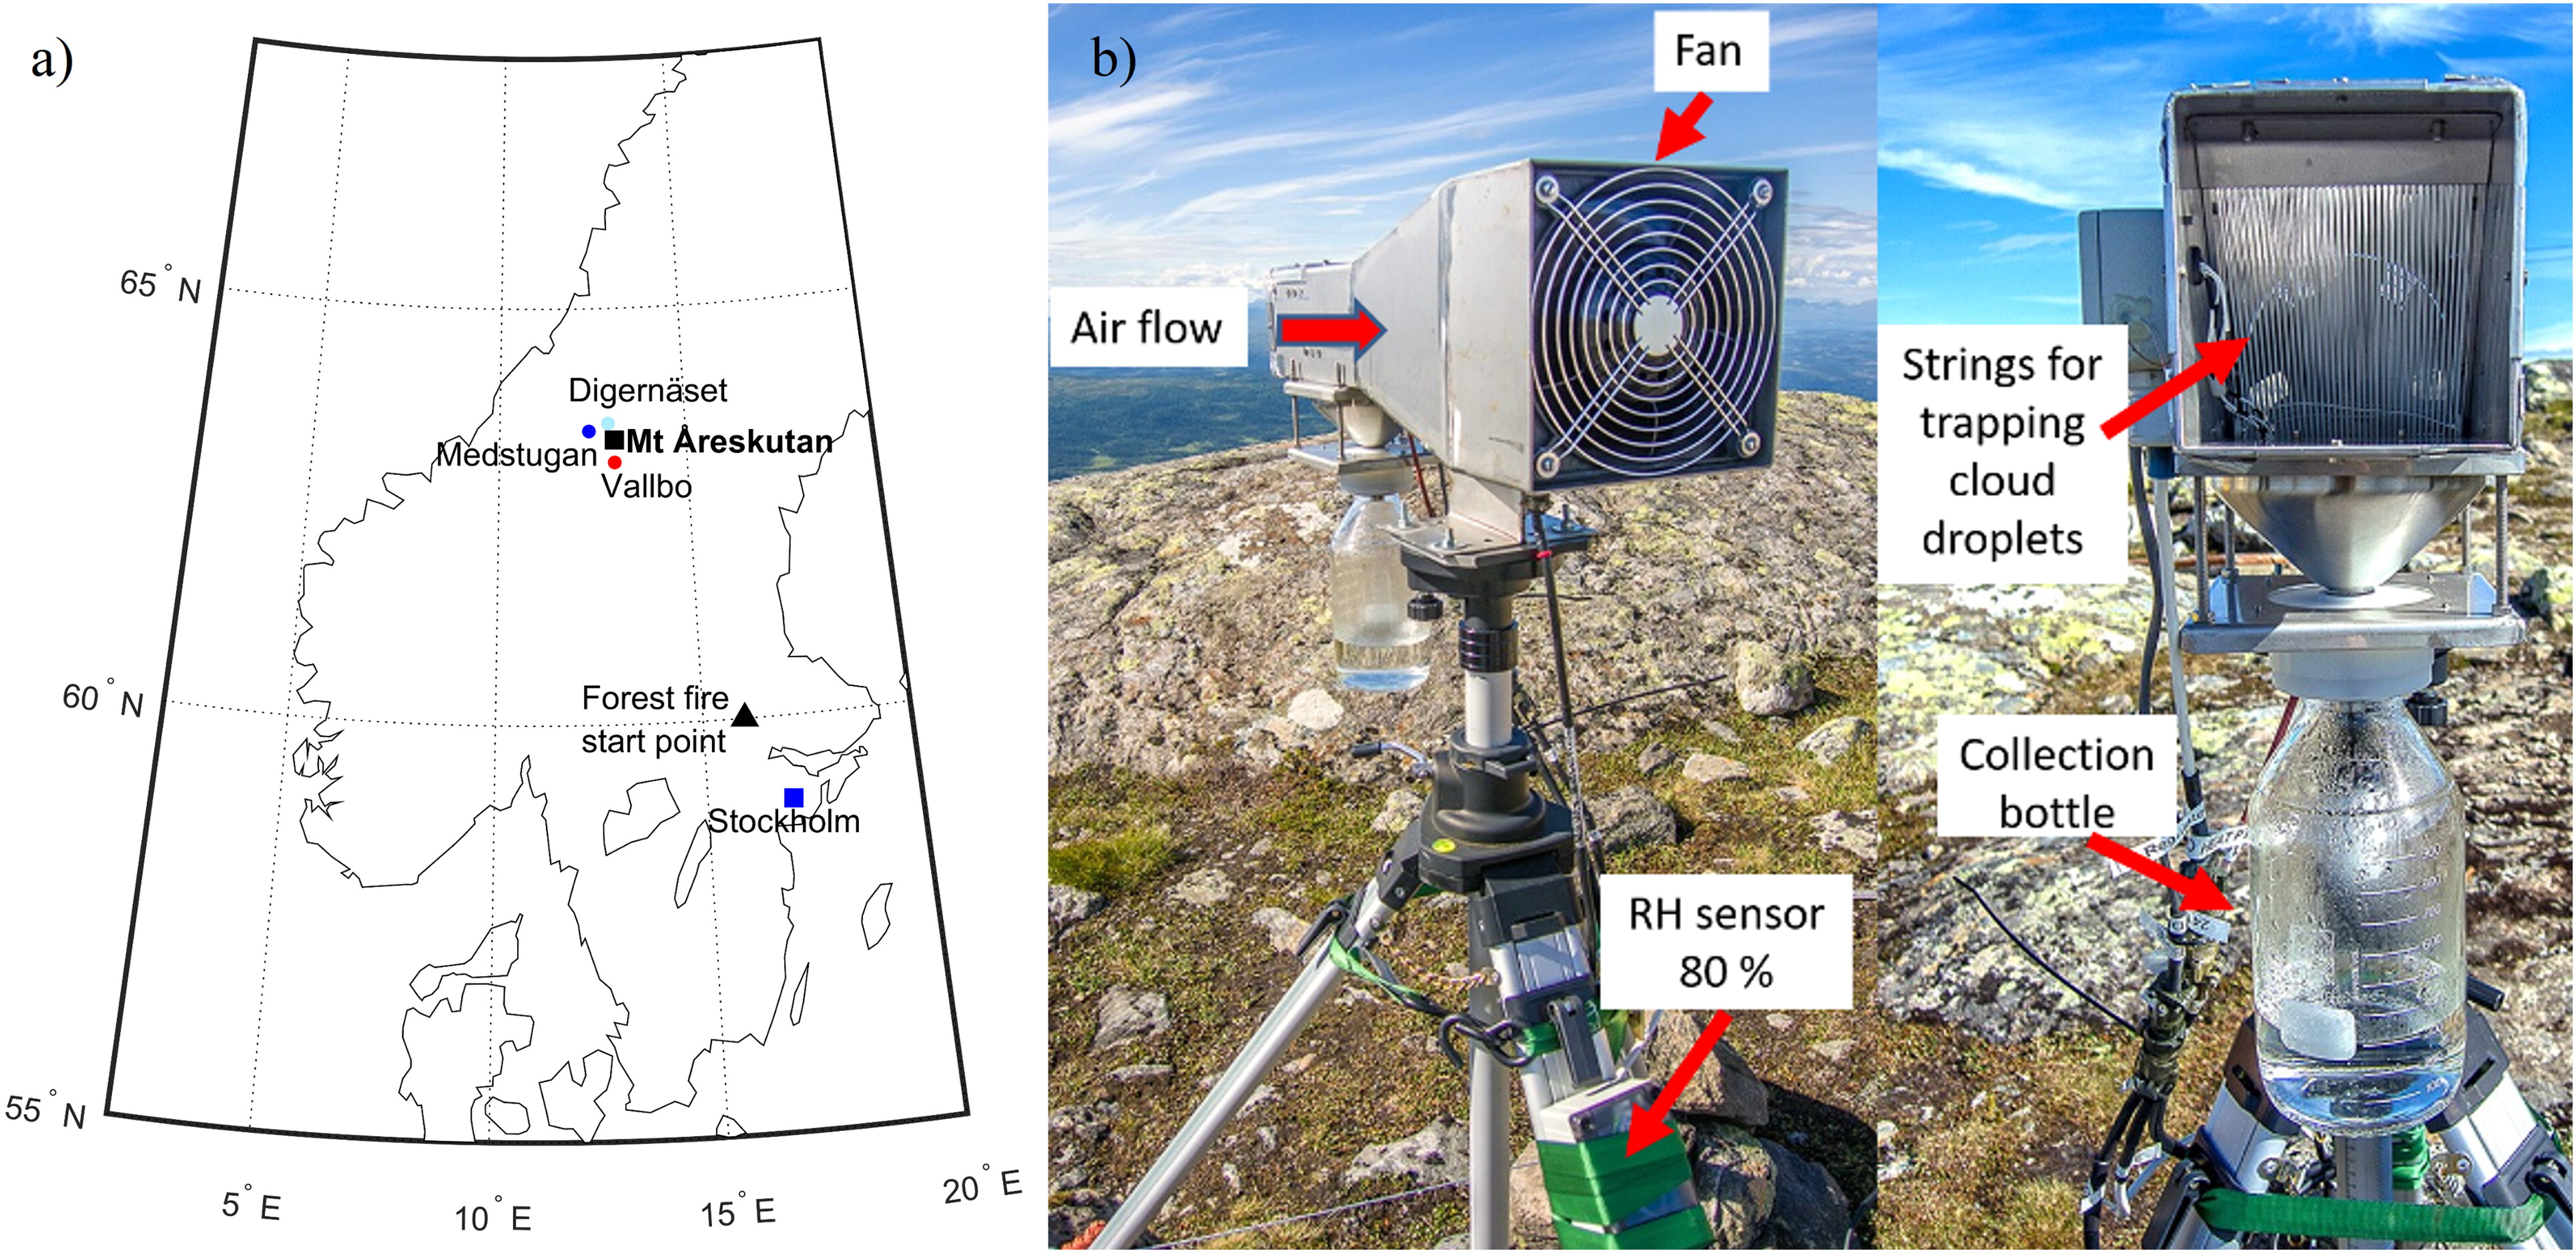
(a) Map of central Sweden showing the sampling site, Mt Åreskutan (black square), the start point of the Västmanland forest fire (black triangle), Digernäset station (pale blue dot), Medstugan station (blue dot), Vallbo station (red dot) and Stockholm (blue square) for reference. (b) Custom-built active strand cloudwater collector (Collett et al., 1990) used during the CAEsAR 2014 campaign.

Table 1.

Sample type, ID, sampling period, and amount of water collected of rain and fog samples taken during the CAEsAR 2014 campaign.

SampleIDSampling period in 2014Sampling interval (days)Total amount of water collected (ml)Mean fog droplet Reff±1σ (μm)RainR0Jun 27–Jul 47590–R1Jul 4–84525–R2Jul 8–157454–R3*Jul 15–1723133*–R4*Jul 17–1812518*–R5▼Jul 22–275720–R6▼Jul 27<1173–R7▼Jul 27<1n.a.–R8*▼Jul 27–Aug 1014213*R9▼Aug 10–14456R10▼Aug 14<171–R11▼Aug 14–228601*R12▼Aug 22–2312700–R13▼Aug 23–2412980–R14▼Aug 24–Sep 1017715–R15Sep 10–122118–FogF1Jul 4–841025.3 ± 2.2F2Jul 8–1463788.6 ± 3.5F3Jul 14–1513086.4 ± 2.7F4Jul 15–1722878.9 ± 3.5F5Jul 17–1812688.3 ± 4.2F6Jul 18–191967.1 ± 2.6F7▼Jul 19–27873(**)F8▼Jul 27–3032466.6 ± 2.7F9▼Jul 30–Aug 1011472*6.8 ± 3.1F10▼Aug 10–1222175.9 ± 1.8F11Aug 12–1427(**)F12▼Aug 14–228444*9.0 ± 2.6F13▼Aug 22–2314428.9 ± 2.2F14▼Aug 23–2412419.5 ± 2.0F15▼Aug 24–Sep 1017479*8.2 ± 2.5F16▼Sep 10–122499.1 ± 2.2

[i] () Samples in which nitrogen stable isotopes are measured; (*) volume corresponds to a fraction of total volume, i.e., the 5 L collection bottle was over-filled and part of the water was discarded; (n.a.) not available; and (**) R eff below the cut-off size of the instrument. Samples in italics indicate that they were collected during the timespan of the forest fire in central Sweden.

Table 2.

Mean molar concentrations, standard deviation (1σ), 25th, 50th, and 75th percentiles of selected ions, δ(15N), δ(18O), δ(17O), and Δ(17O) in rain and fog samples.
NMean ± 1σ25th50th75thNMean ± 1σ25th50th75thRatio fog/rain ± 1σRain (μmol L 1)Fog (μmol L 1)Na+167 ± 82391653 ± 139410238 ± 22Cl7 ± 9231232 ± 5549315 ± 9Mg2+2 ± 20138 ± 142484 ± 8NH4+9 ± 8581225 ± 32917283 ± 4Br0.03 ± 0.020.010.020.040.08 ± 0.090.010.050.103 ± 3NO311 ± 10481735 ± 561320363 ± 6SO42−9 ± 1036924 ± 26717273 ± 4K+2 ± 11123 ± 51232 ± 3Ca2+17 ± 195102314 ± 2735111 ± 2ssK+0.1 ± 0.200.10.21 ± 30.10.20.510 ± 36ssCa2+0.1 ± 0.200.10.21 ± 30.10.20.510 ± 36ssMg2+0.8 ± 0.90.20.31.06 ± 150138 ± 21ssSO42−0.4 ± 0.50.10.20.63 ± 80118 ± 22nssMg2+1 ± 80123 ± 22243 ± 24nssSO42−8 ± 1036821 ± 21613273 ± 4nssK+2 ± 11122 ± 31231 ± 2nssCa2+17 ± 185102312 ± 2535111 ± 2Rain ()Fog ()Δδ (fog − rain)δ(15N)9−2 ± 8−7−759−8 ± 2−9−8−6−6 ± 8δ(18O)957 ± 15426667971 ± 369717314 ± 15δ(17O)659 ± 3585860962 ± 56164653 ± 6Δ(17O)622 ± 1222222925 ± 22525253 ± 2

[i] Fog/rain ratios of mean values are also shown. N indicates the number of samples collected and analysed. Percentiles for ssK+ and ssCa2+ in fog are shown with one decimal as an exception for visualization.

Fig. 2.

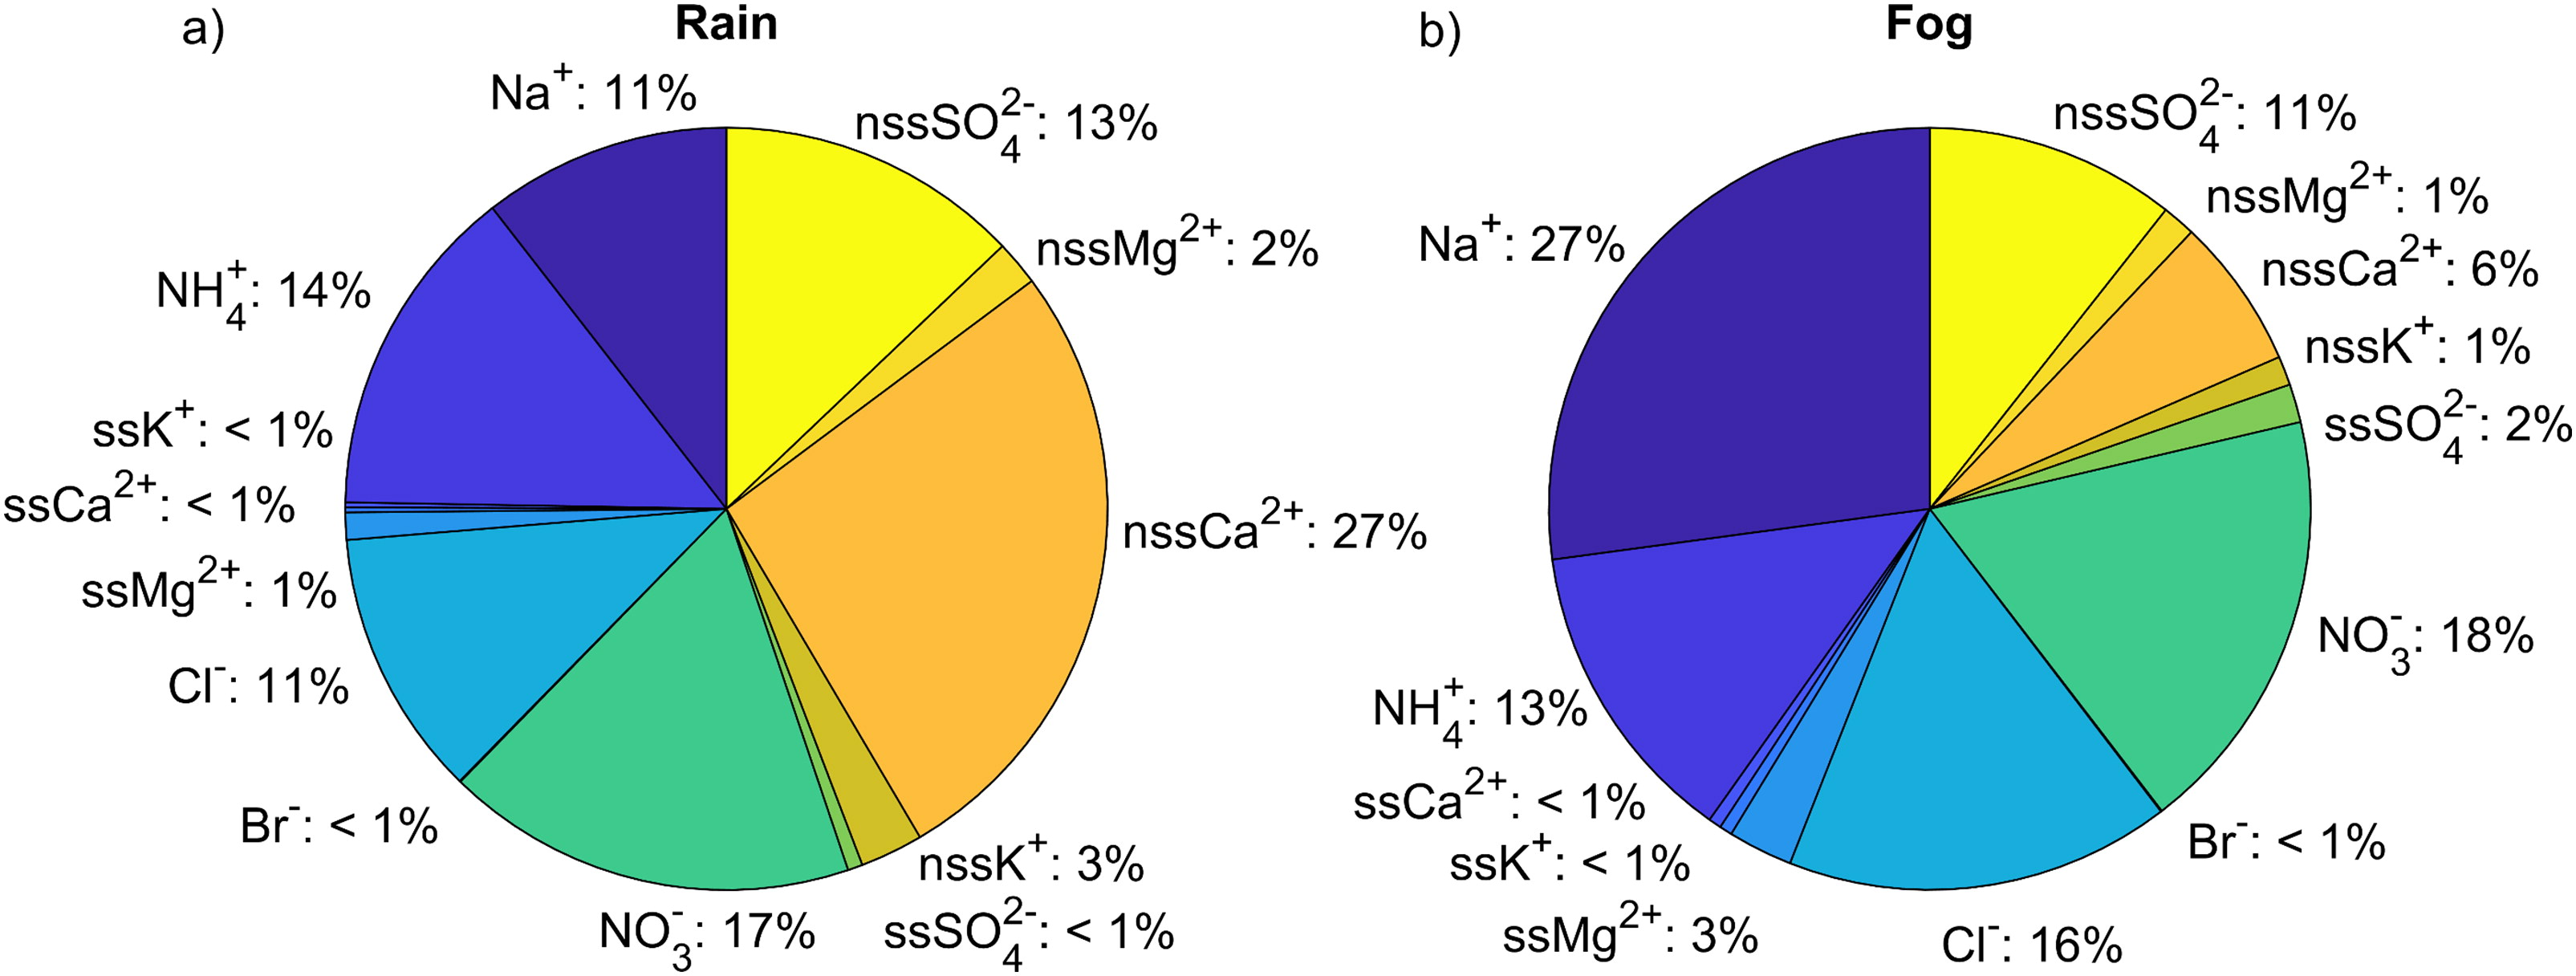
Pie-plot of ion fractions (mol-%) measured in (a) rain and (b) fog samples during the CAEsAR campaign. Nss- and ss-fractions were calculated as explained in Section 2.2.
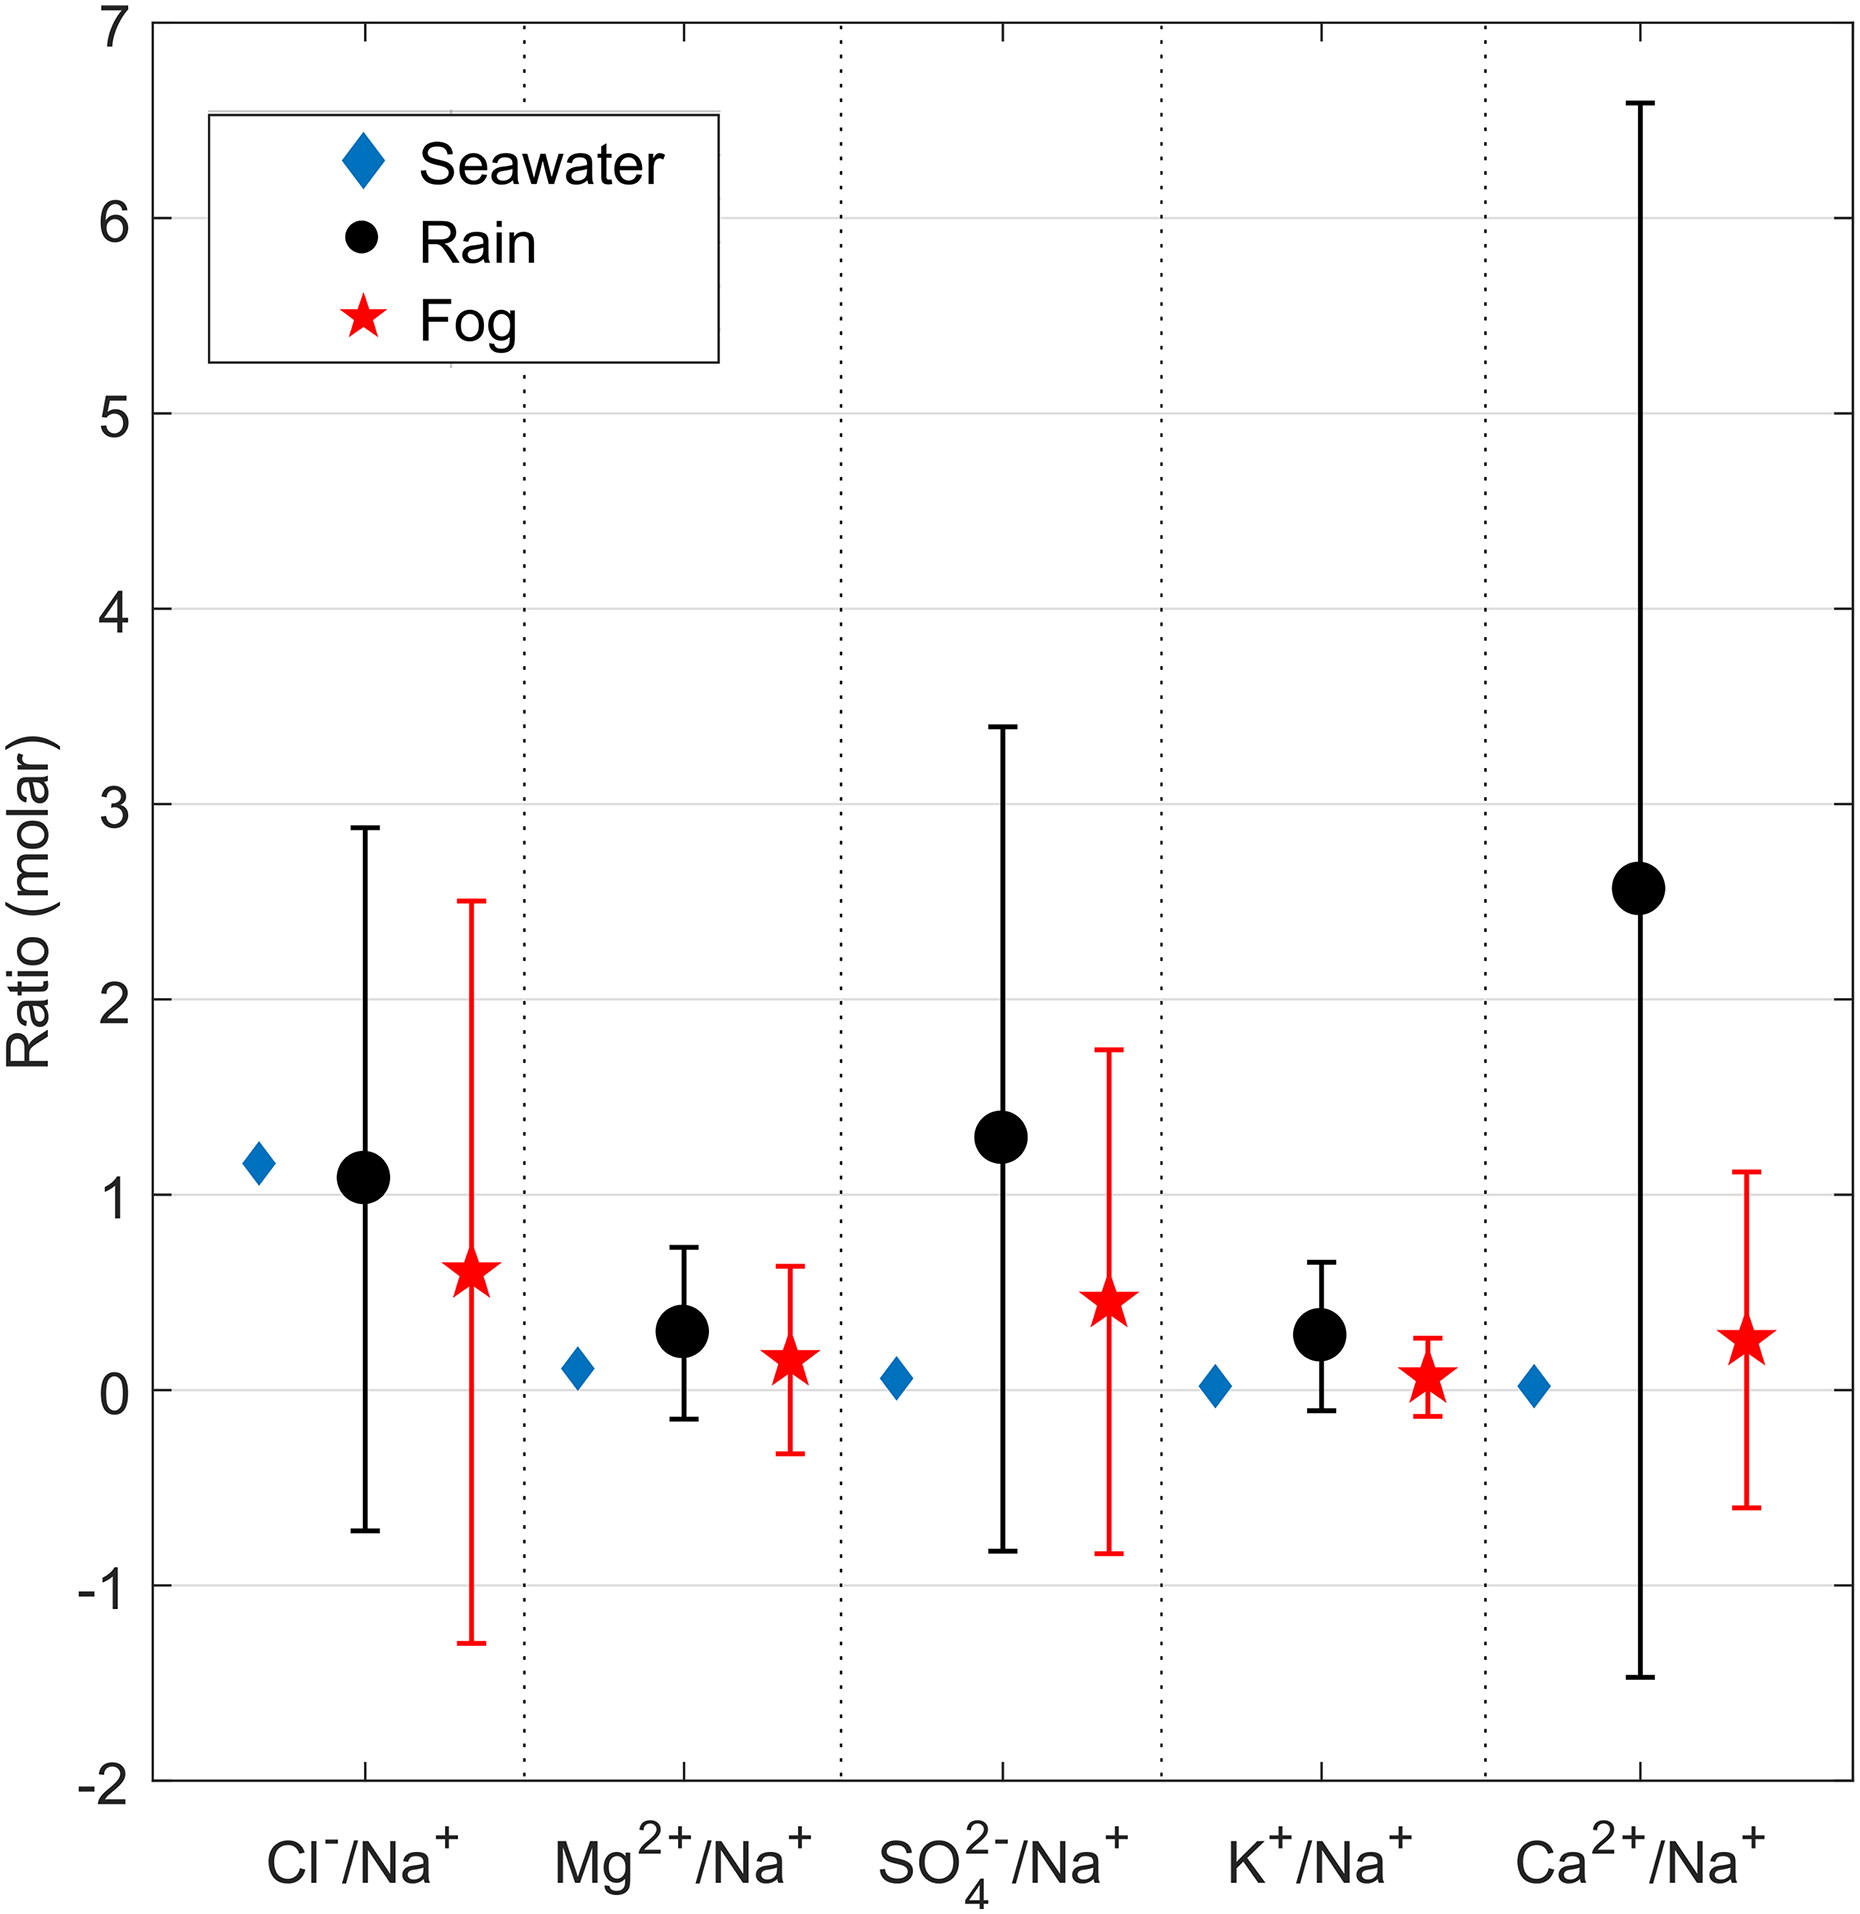
Fig. 3.

Sea-salt ratios referred to Na+ in bulk seawater (blue diamonds), in rain (black circles) samples, and in fog (red stars) samples collected during the CAEsAR campaign. Fog/rain ratios were calculated using mean ion concentrations. Error bars represent 1σ.

Table 3.

PCA loadings of the first three principal components calculated using concentrations of major ions (separated into ss- and nss-fractions) measured in rain and fog samples collected during the CAEsAR 2014 campaign.
SampleRainFogLoadingsPC1PC2PC3PC1PC2PC3Na+0.30−0.23−0.020.32−0.19−0.02NH4+0.230.45−0.360.220.45−0.33ssK+0.30−0.23−0.020.32−0.19−0.02ssCa2+0.30−0.23−0.020.32−0.19−0.02ssMg2+0.30−0.23−0.020.32−0.19−0.02Cl0.30−0.130.120.30−0.280.06Br0.200.250.900.12−0.38−0.31NO30.260.420.010.310.202 × 10−3ssSO42−0.30−0.23−0.020.32−0.19−0.02nssK+0.29−0.15−0.100.260.330.02nssCa2+0.30−0.02−0.040.280.310.25nssMg2+0.250.32−0.120.190.130.74nssSO42−0.270.37−0.130.210.37−0.42Explained Variance (%)7912567167SourceMixedSoil/Industrial Forest fireFumigationMixedSoil/IndustrialMineral dust

[i] Possible sources related to the different components are displayed in the bottom row.

Fig. 4.

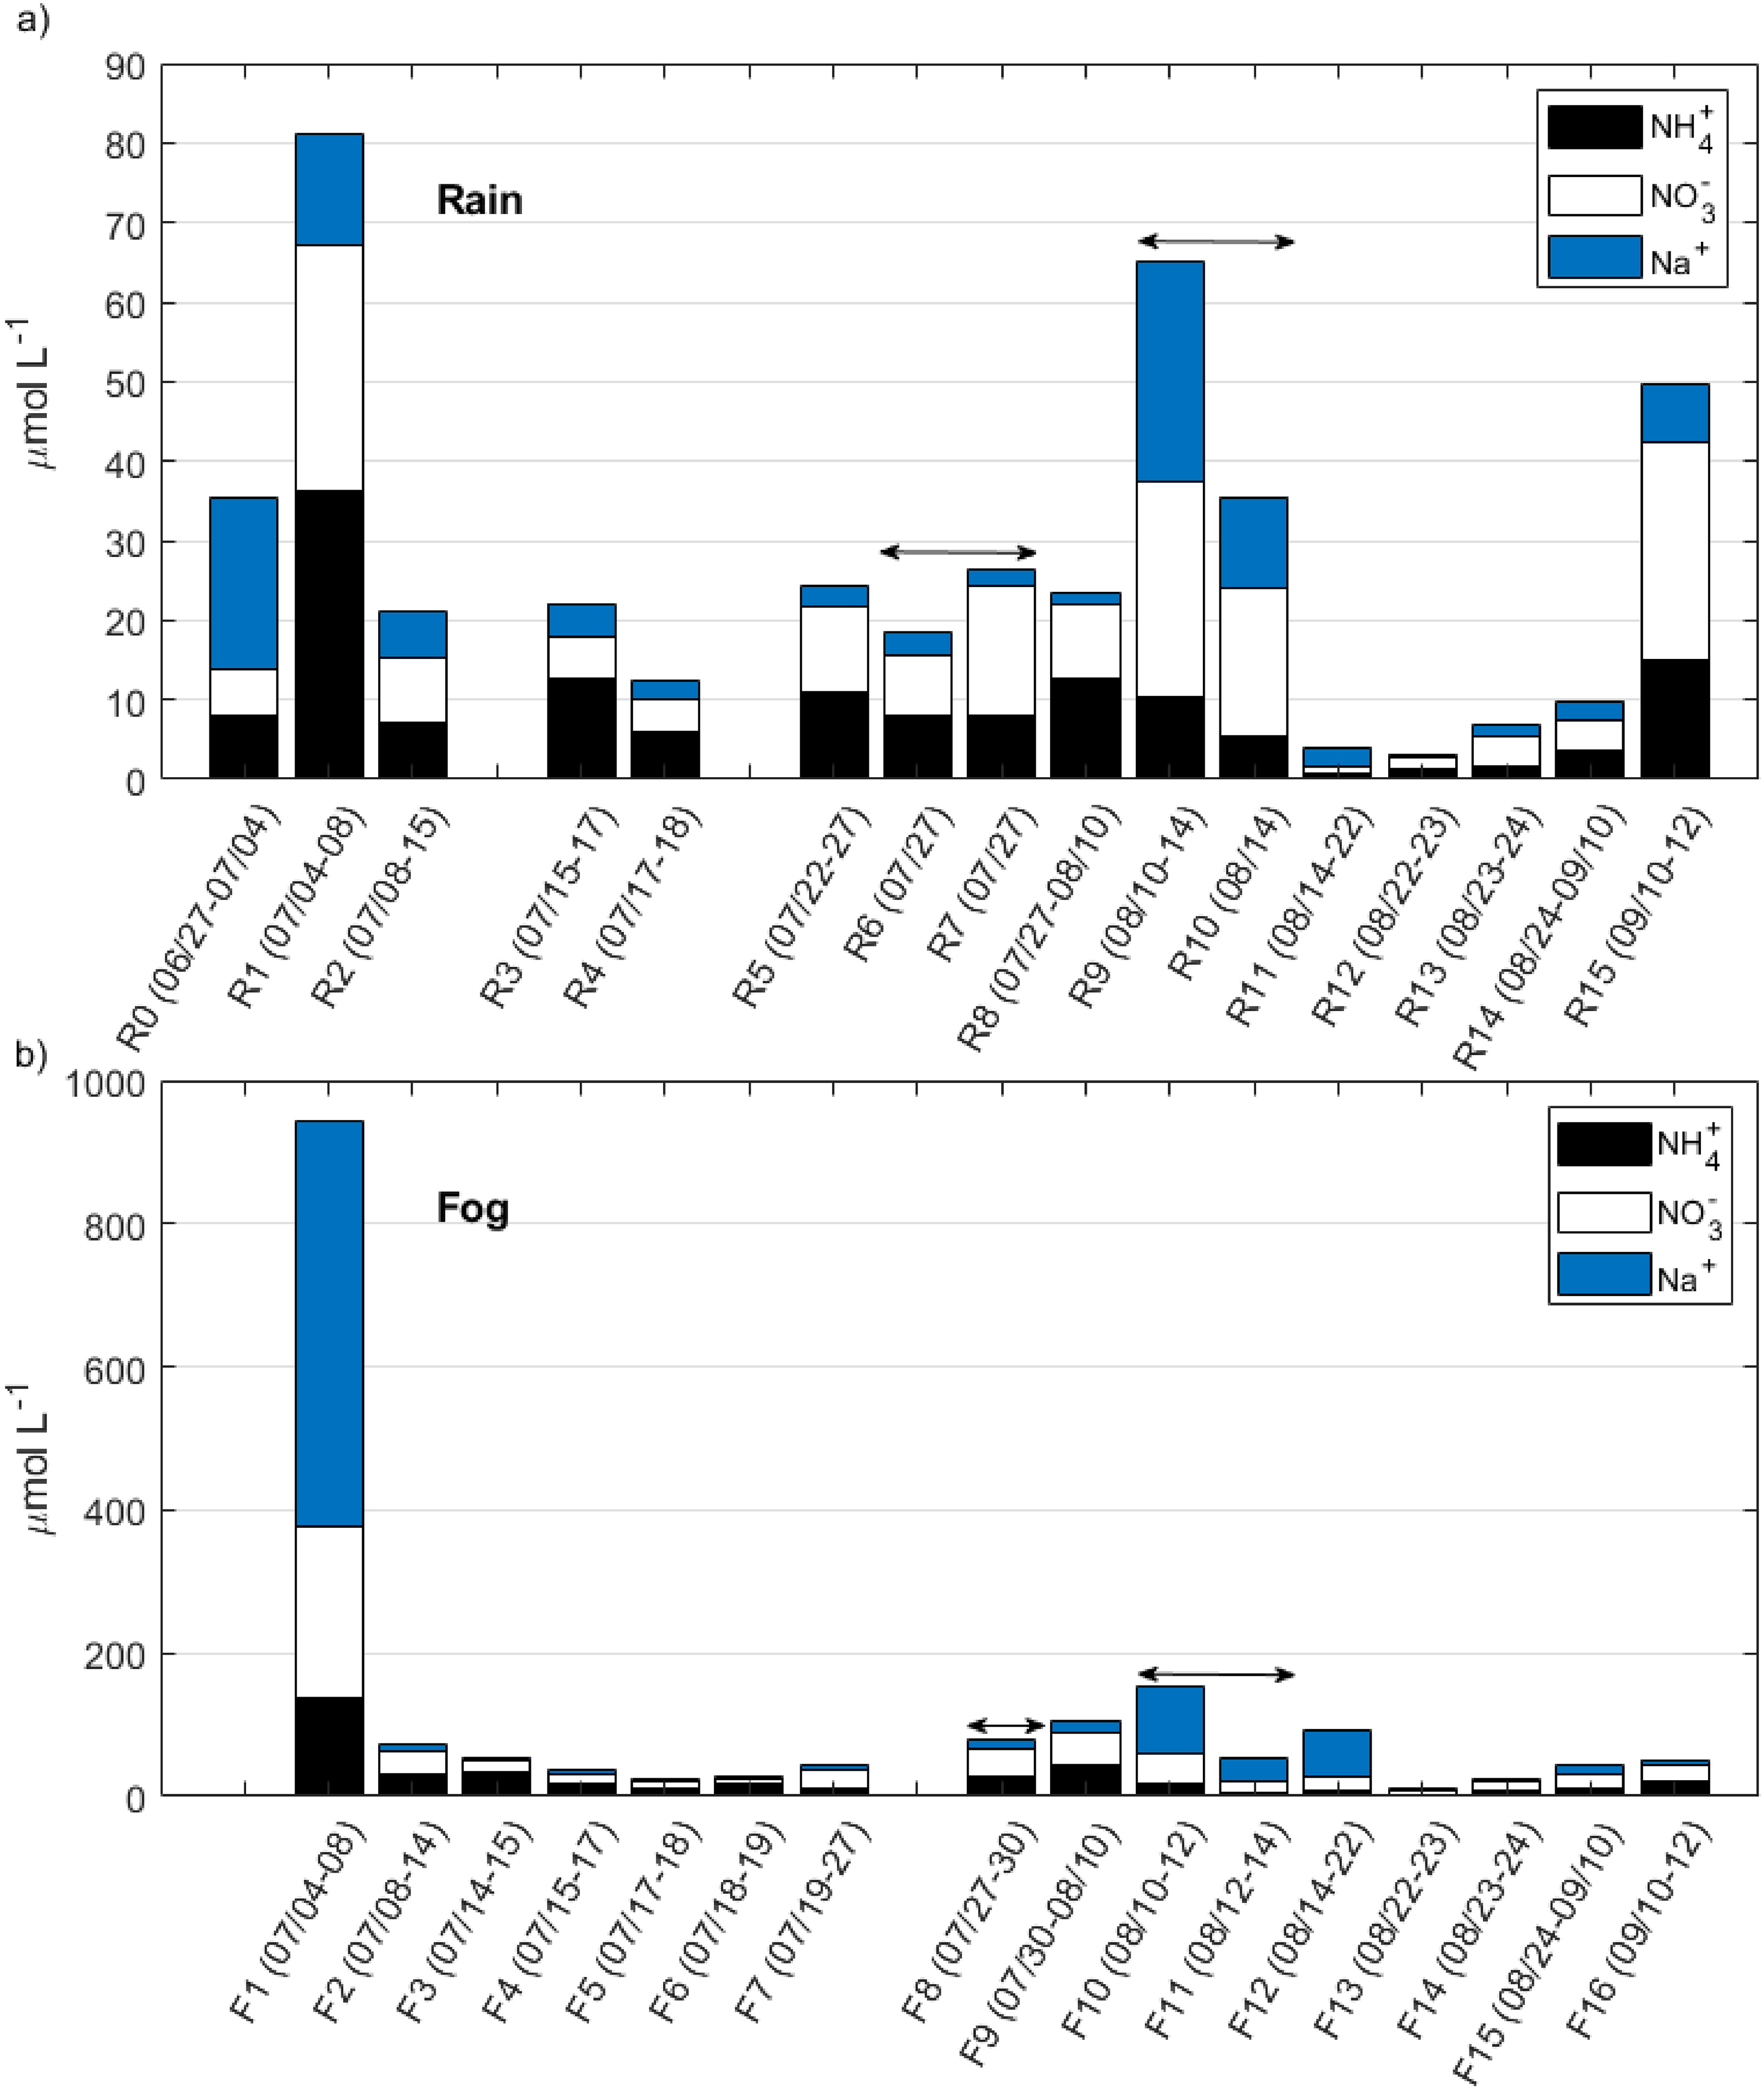
Stacked bar plot of NH4 +, NO3 , and Na+ concentrations in each (a) rain and (b) fog sample collected during the CAEsAR campaign. Horizontal arrows indicate that samples R6 and R7 overlap with sample F8; while samples R9 and R10 together overlap with sample F10 and F11. For sample collection periods see Table 1.
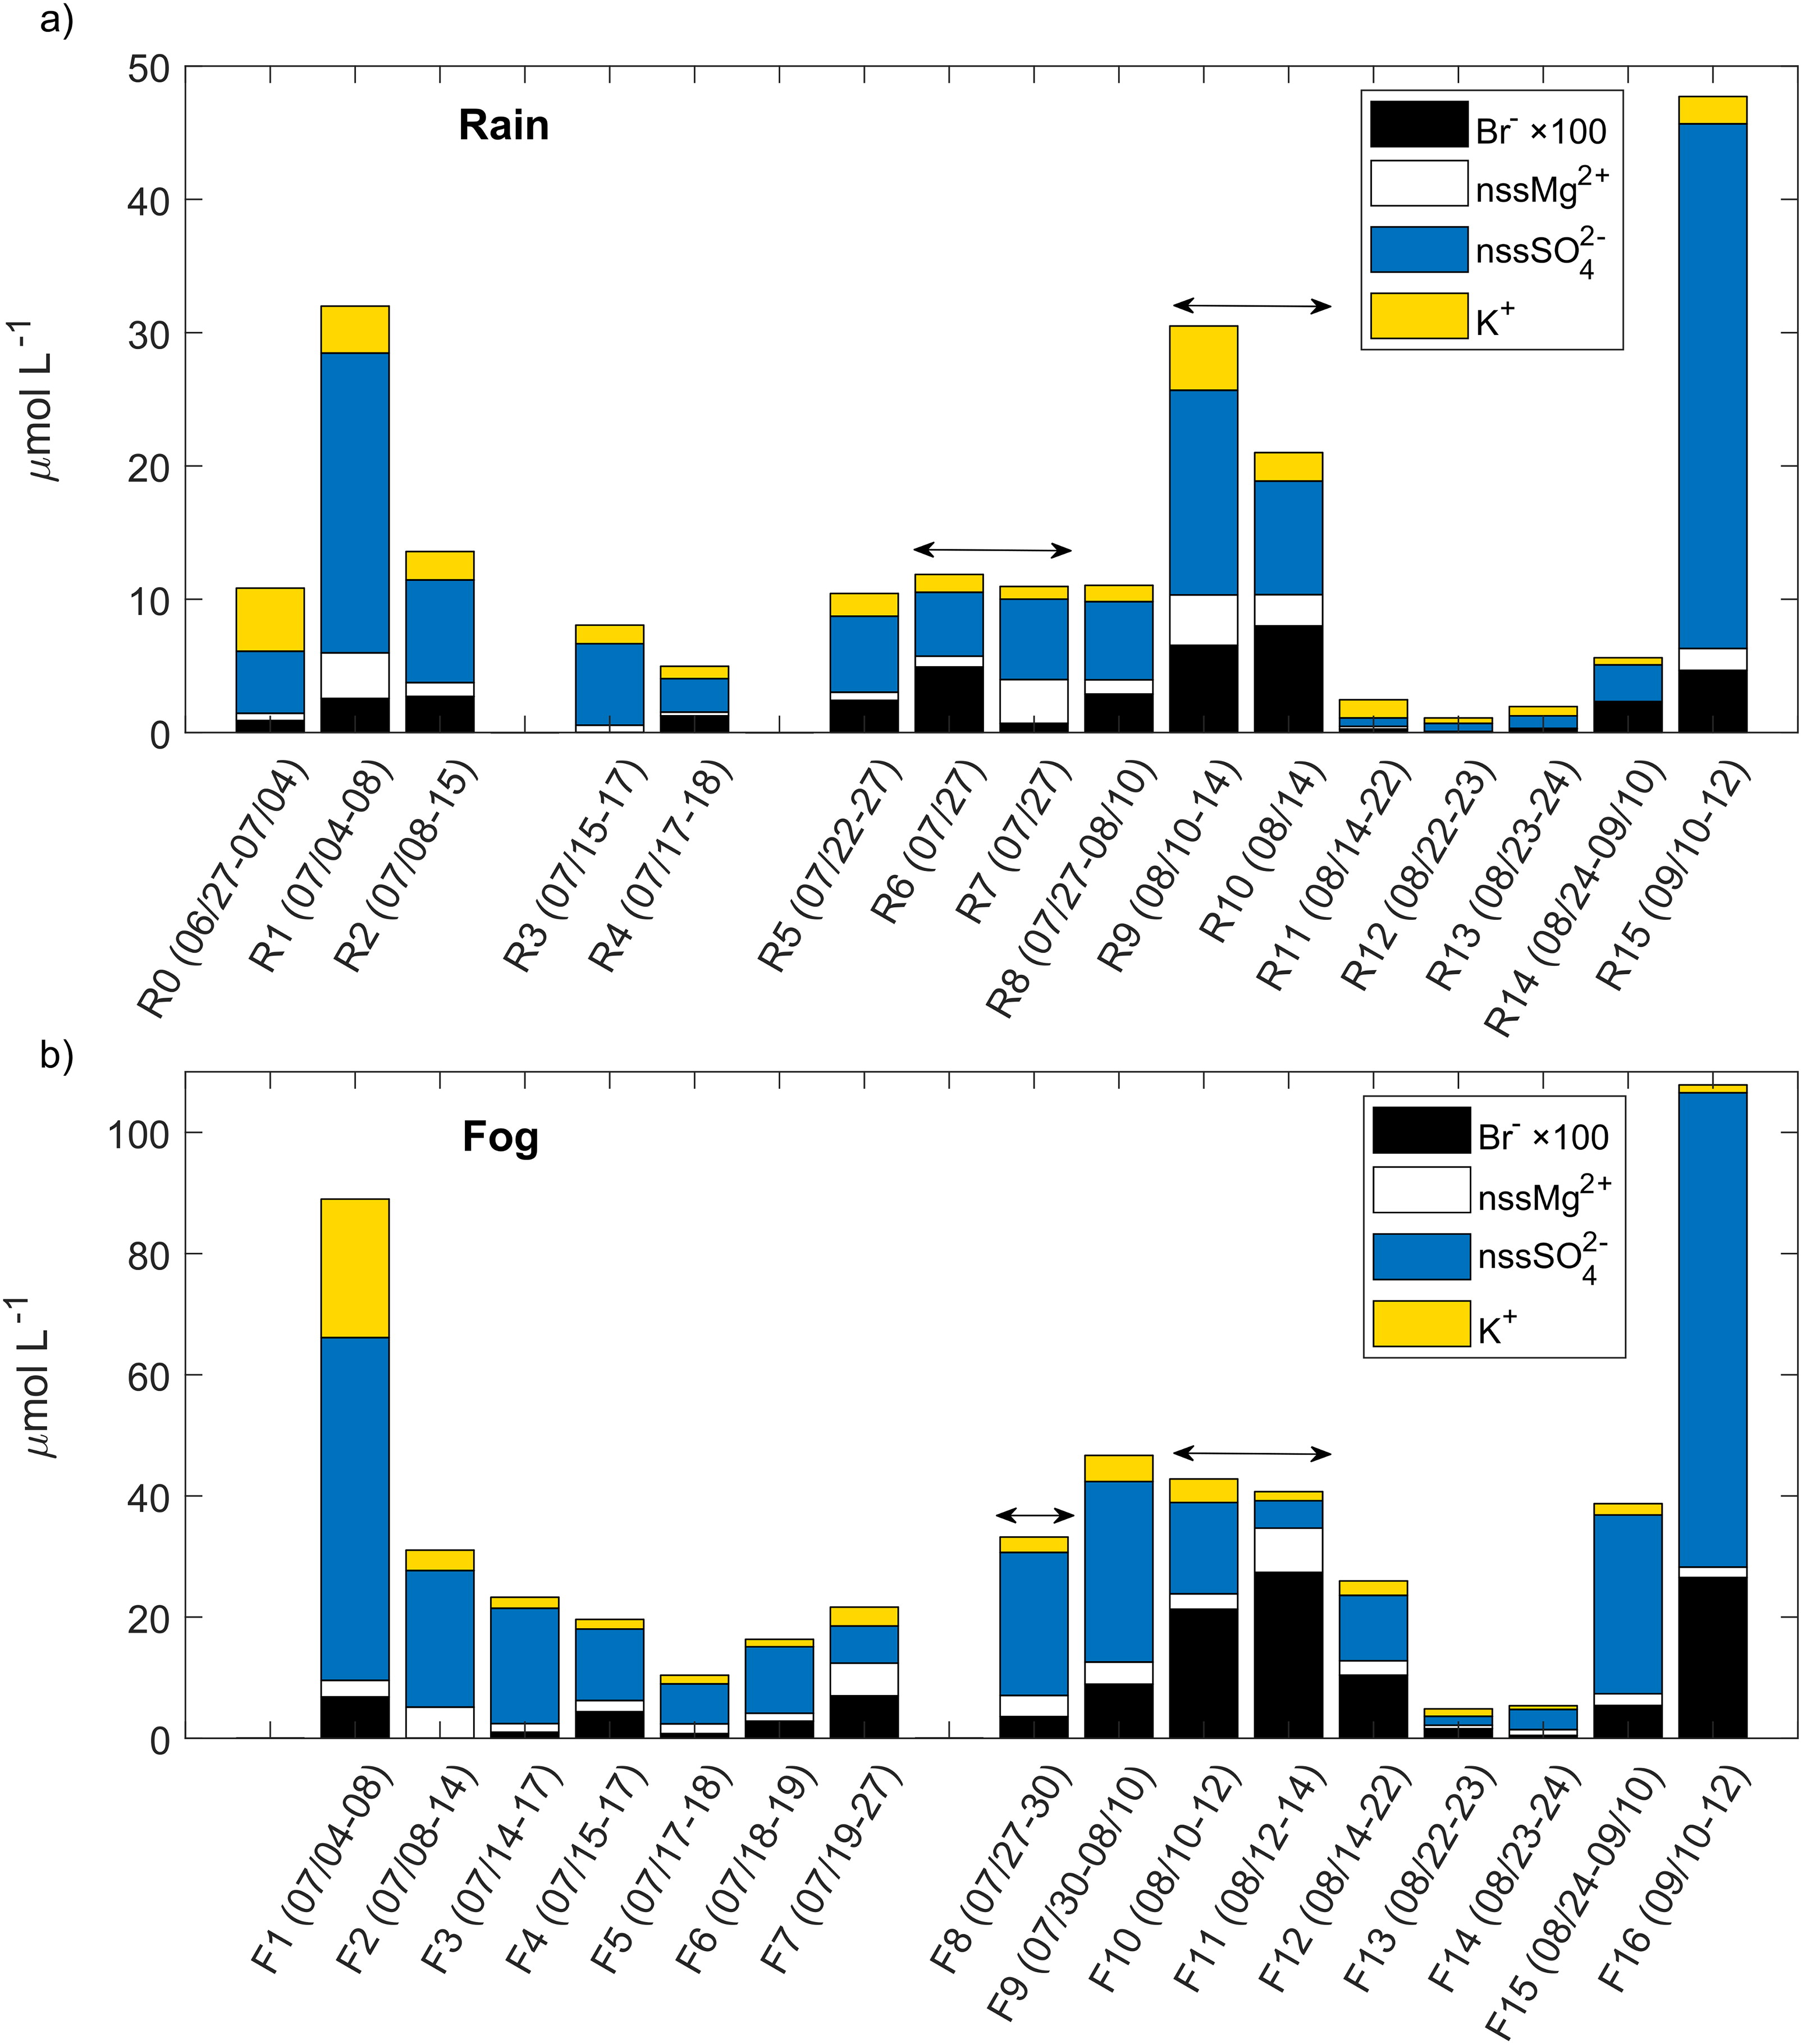
Fig. 5.

Stacked bar plot of Br, nssMg2+, nssSO4 2−, and K+ concentrations in each (a) rain and (b) fog sample collected during the CAEsAR campaign. Note that Br concentrations have been scaled to improve visualization. Horizontal arrows indicate that samples R6 and R7 overlap with sample F8; while samples R9 and R10 together overlap with sample F10 and F11. For sample collection periods please refer to Table 1.

Table 4.

Rain and fog sample classification considering concentrations thresholds; more than double the mean (high), less than half the mean (low), and within twice the mean and half the mean (medium).
Sample Rain (Fog)RainFogNH4+NO3NH4+NO3R0medium(*)R1 (F1)highR2 (F2)medium(F3)(*)mediumlowR3 (F4)mediumlowmediumlowR4 (F5)mediumlow(F6)(*)mediumlowR5 (F7)mediumlowmediumR6medium(*)R7 (F8)mediumR8 (F9)mediumR9 (F10)mediumhighmediumR10 (F11)mediumlowR11 (F12)lowmediumR12 (F13)lowR13 (F14)lowR14 (F15)lowmediumR15 (F16)mediumhighmedium

[i] Rain and fog samples collected within the same time interval are shown together. (*) no sample.

Fig. 6.

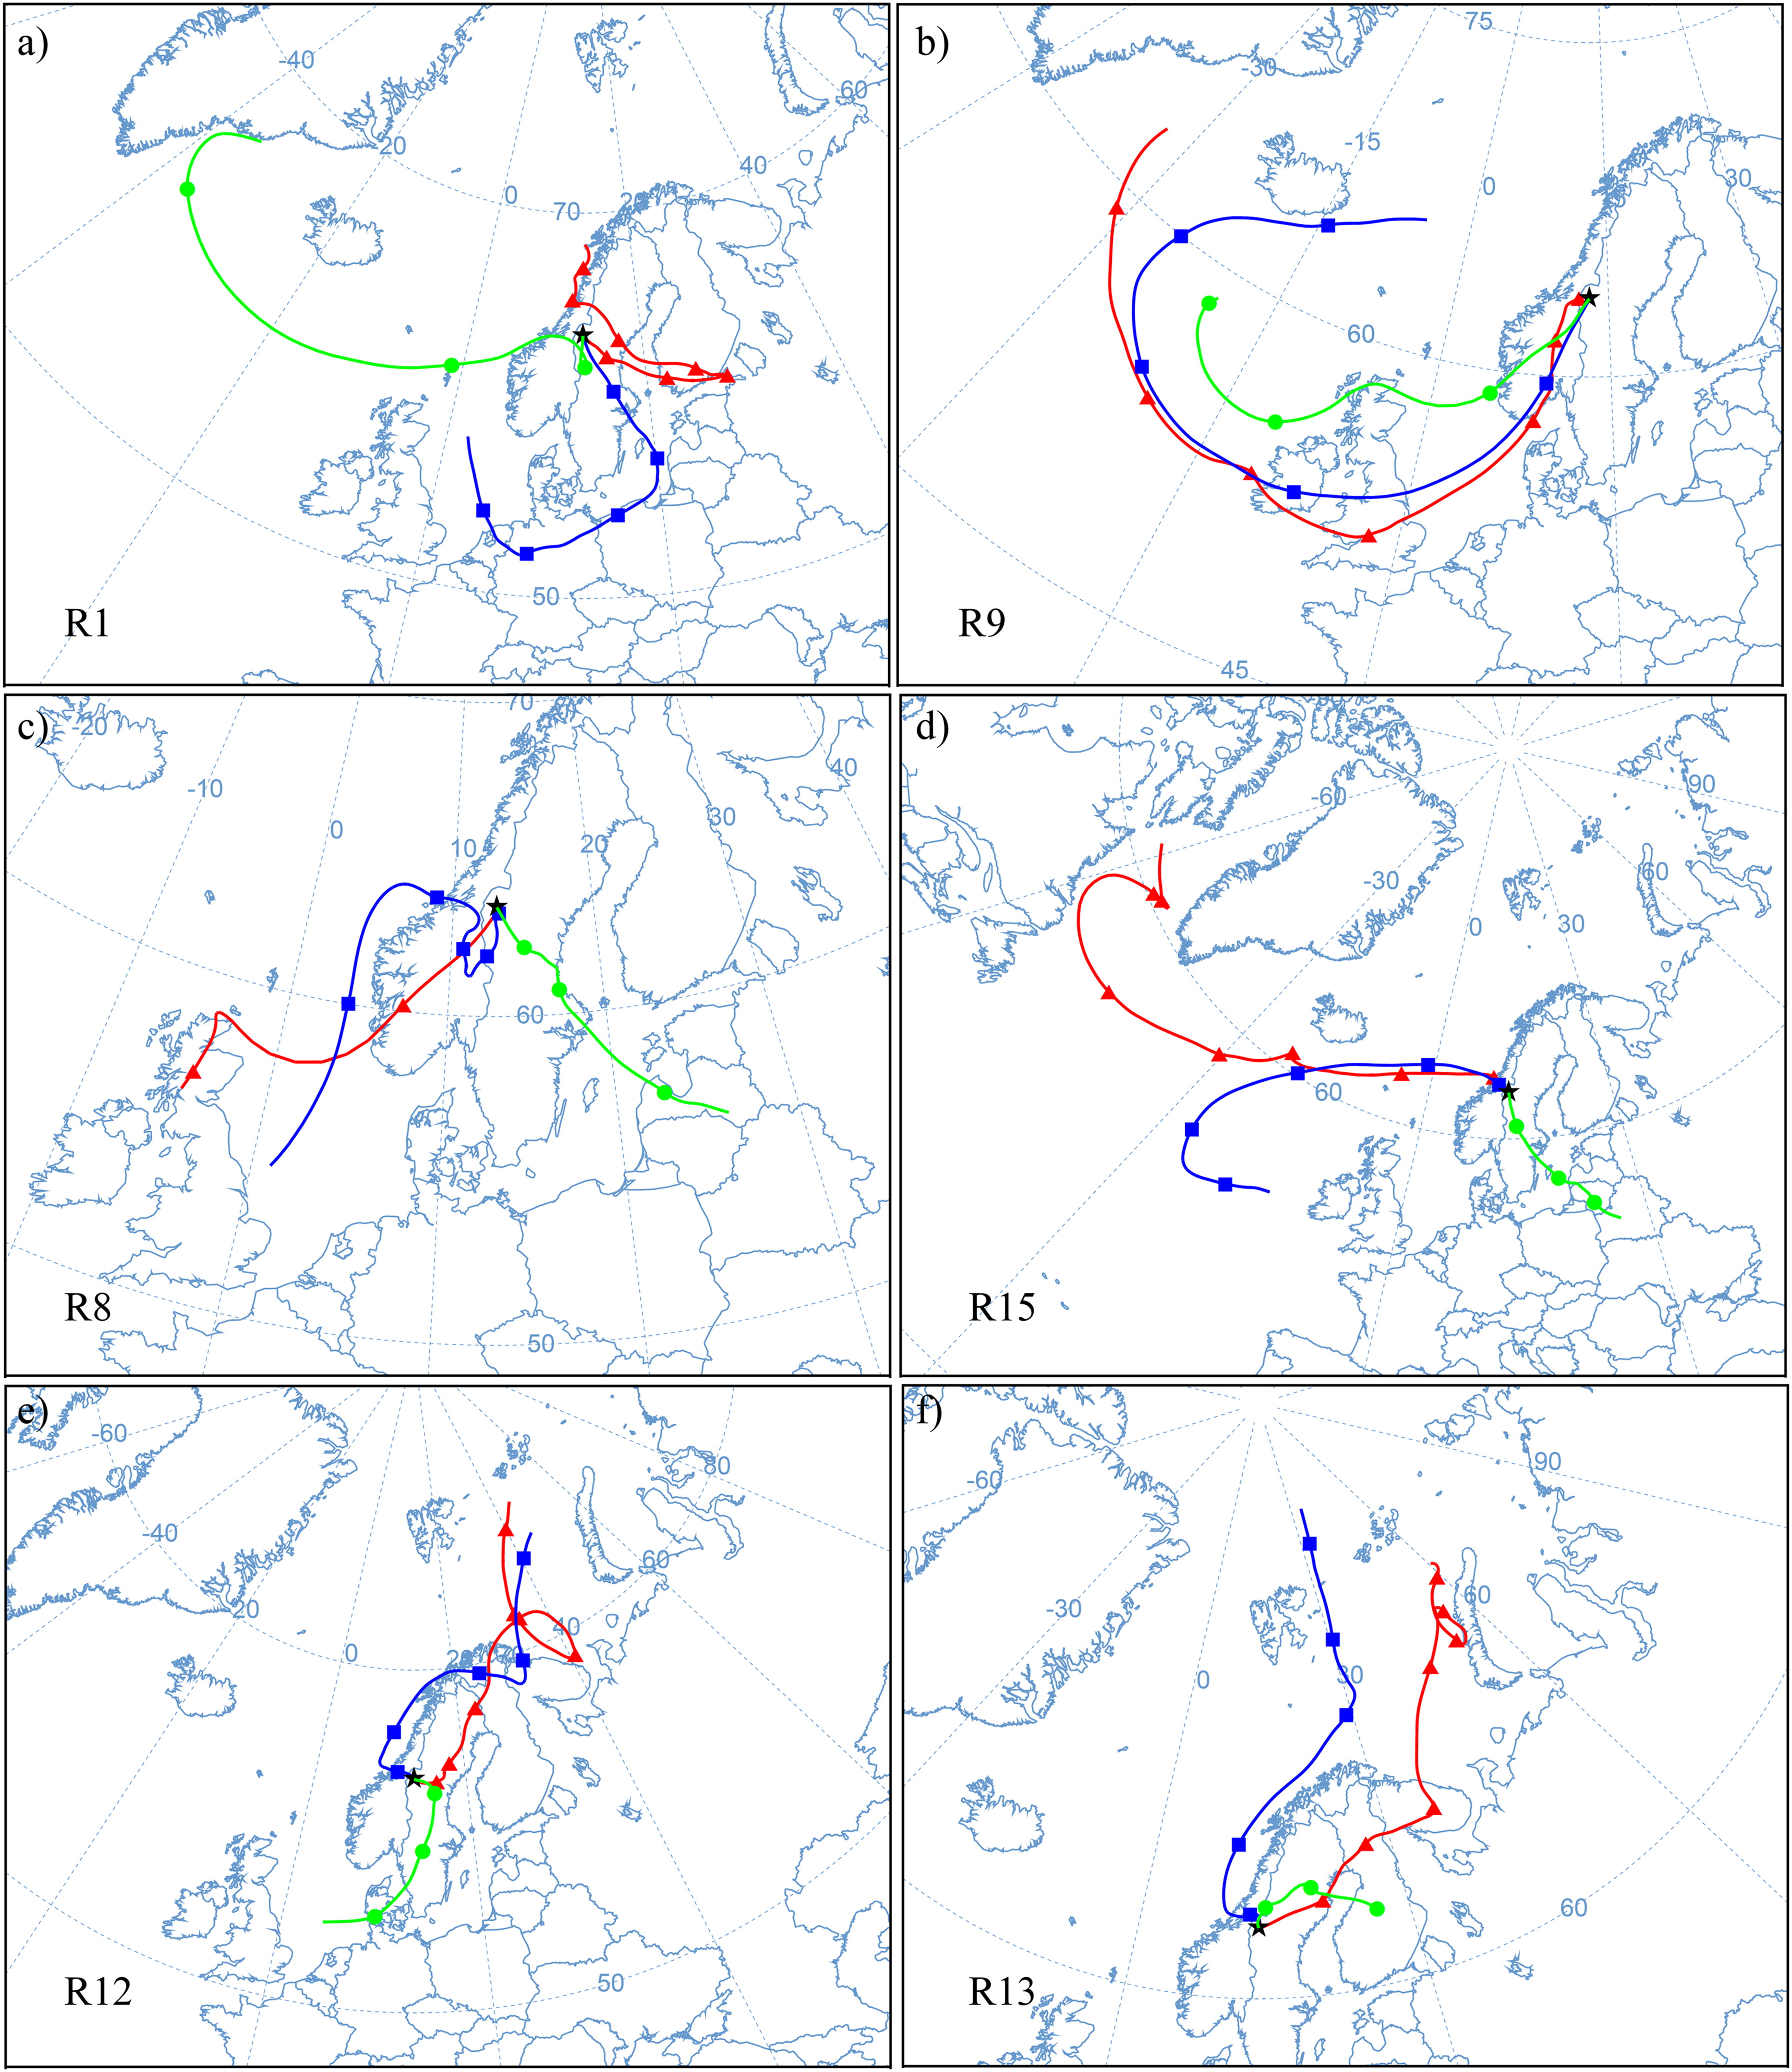
7-day back-trajectories arriving to Åreskutan for samples (a) R1, (b) R9, (c) R8, (d) R15, (e) R12, and (f) R13. Start altitude is an elevation of 500 m above ground level (a.g.l.). Each colour represents a back-trajectory restarted each 48 h: initial back-trajectory (red line and triangles), restarted after 48 h (blue line and squares), and restarted after 96 h (green line and circles).
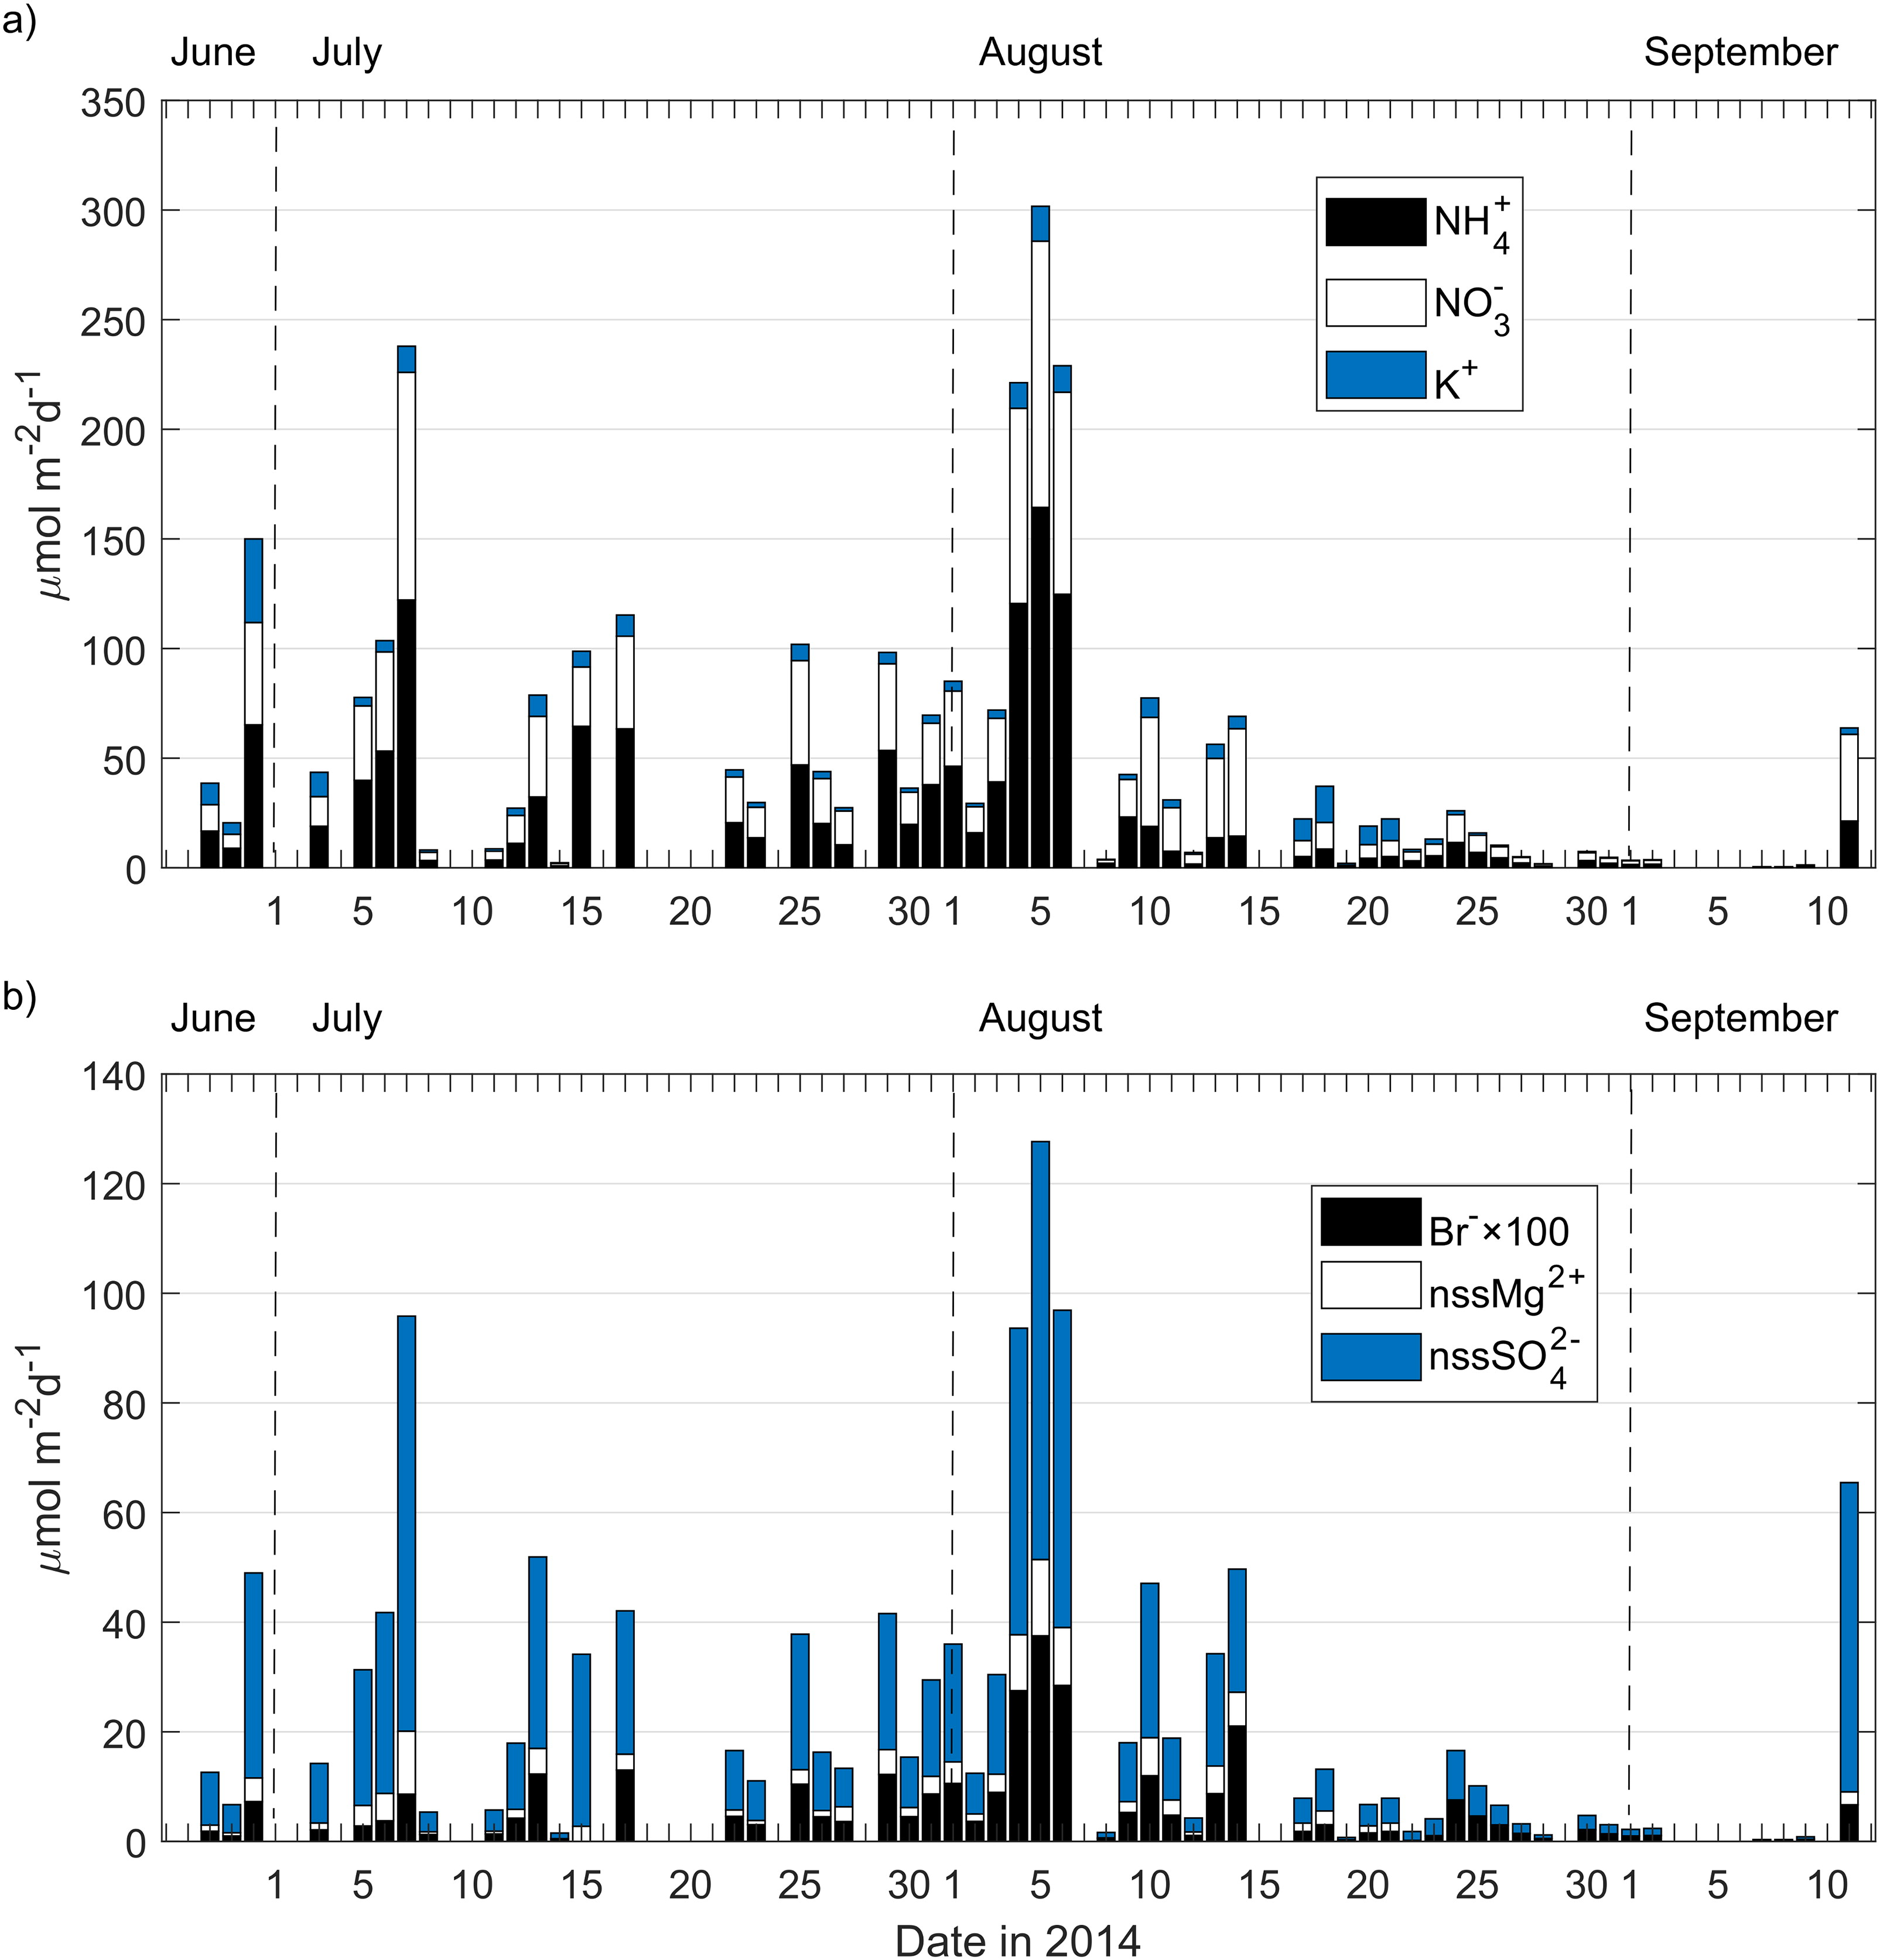
Fig. 7.

Stacked bar plot of (a) NH4 +, and NO3 , and (b) Br, nssMg2+, and nssSO4 2− daily rain deposition obtained as explained in Section 2.3. Note that Br concentrations have been scaled to improve visualization.
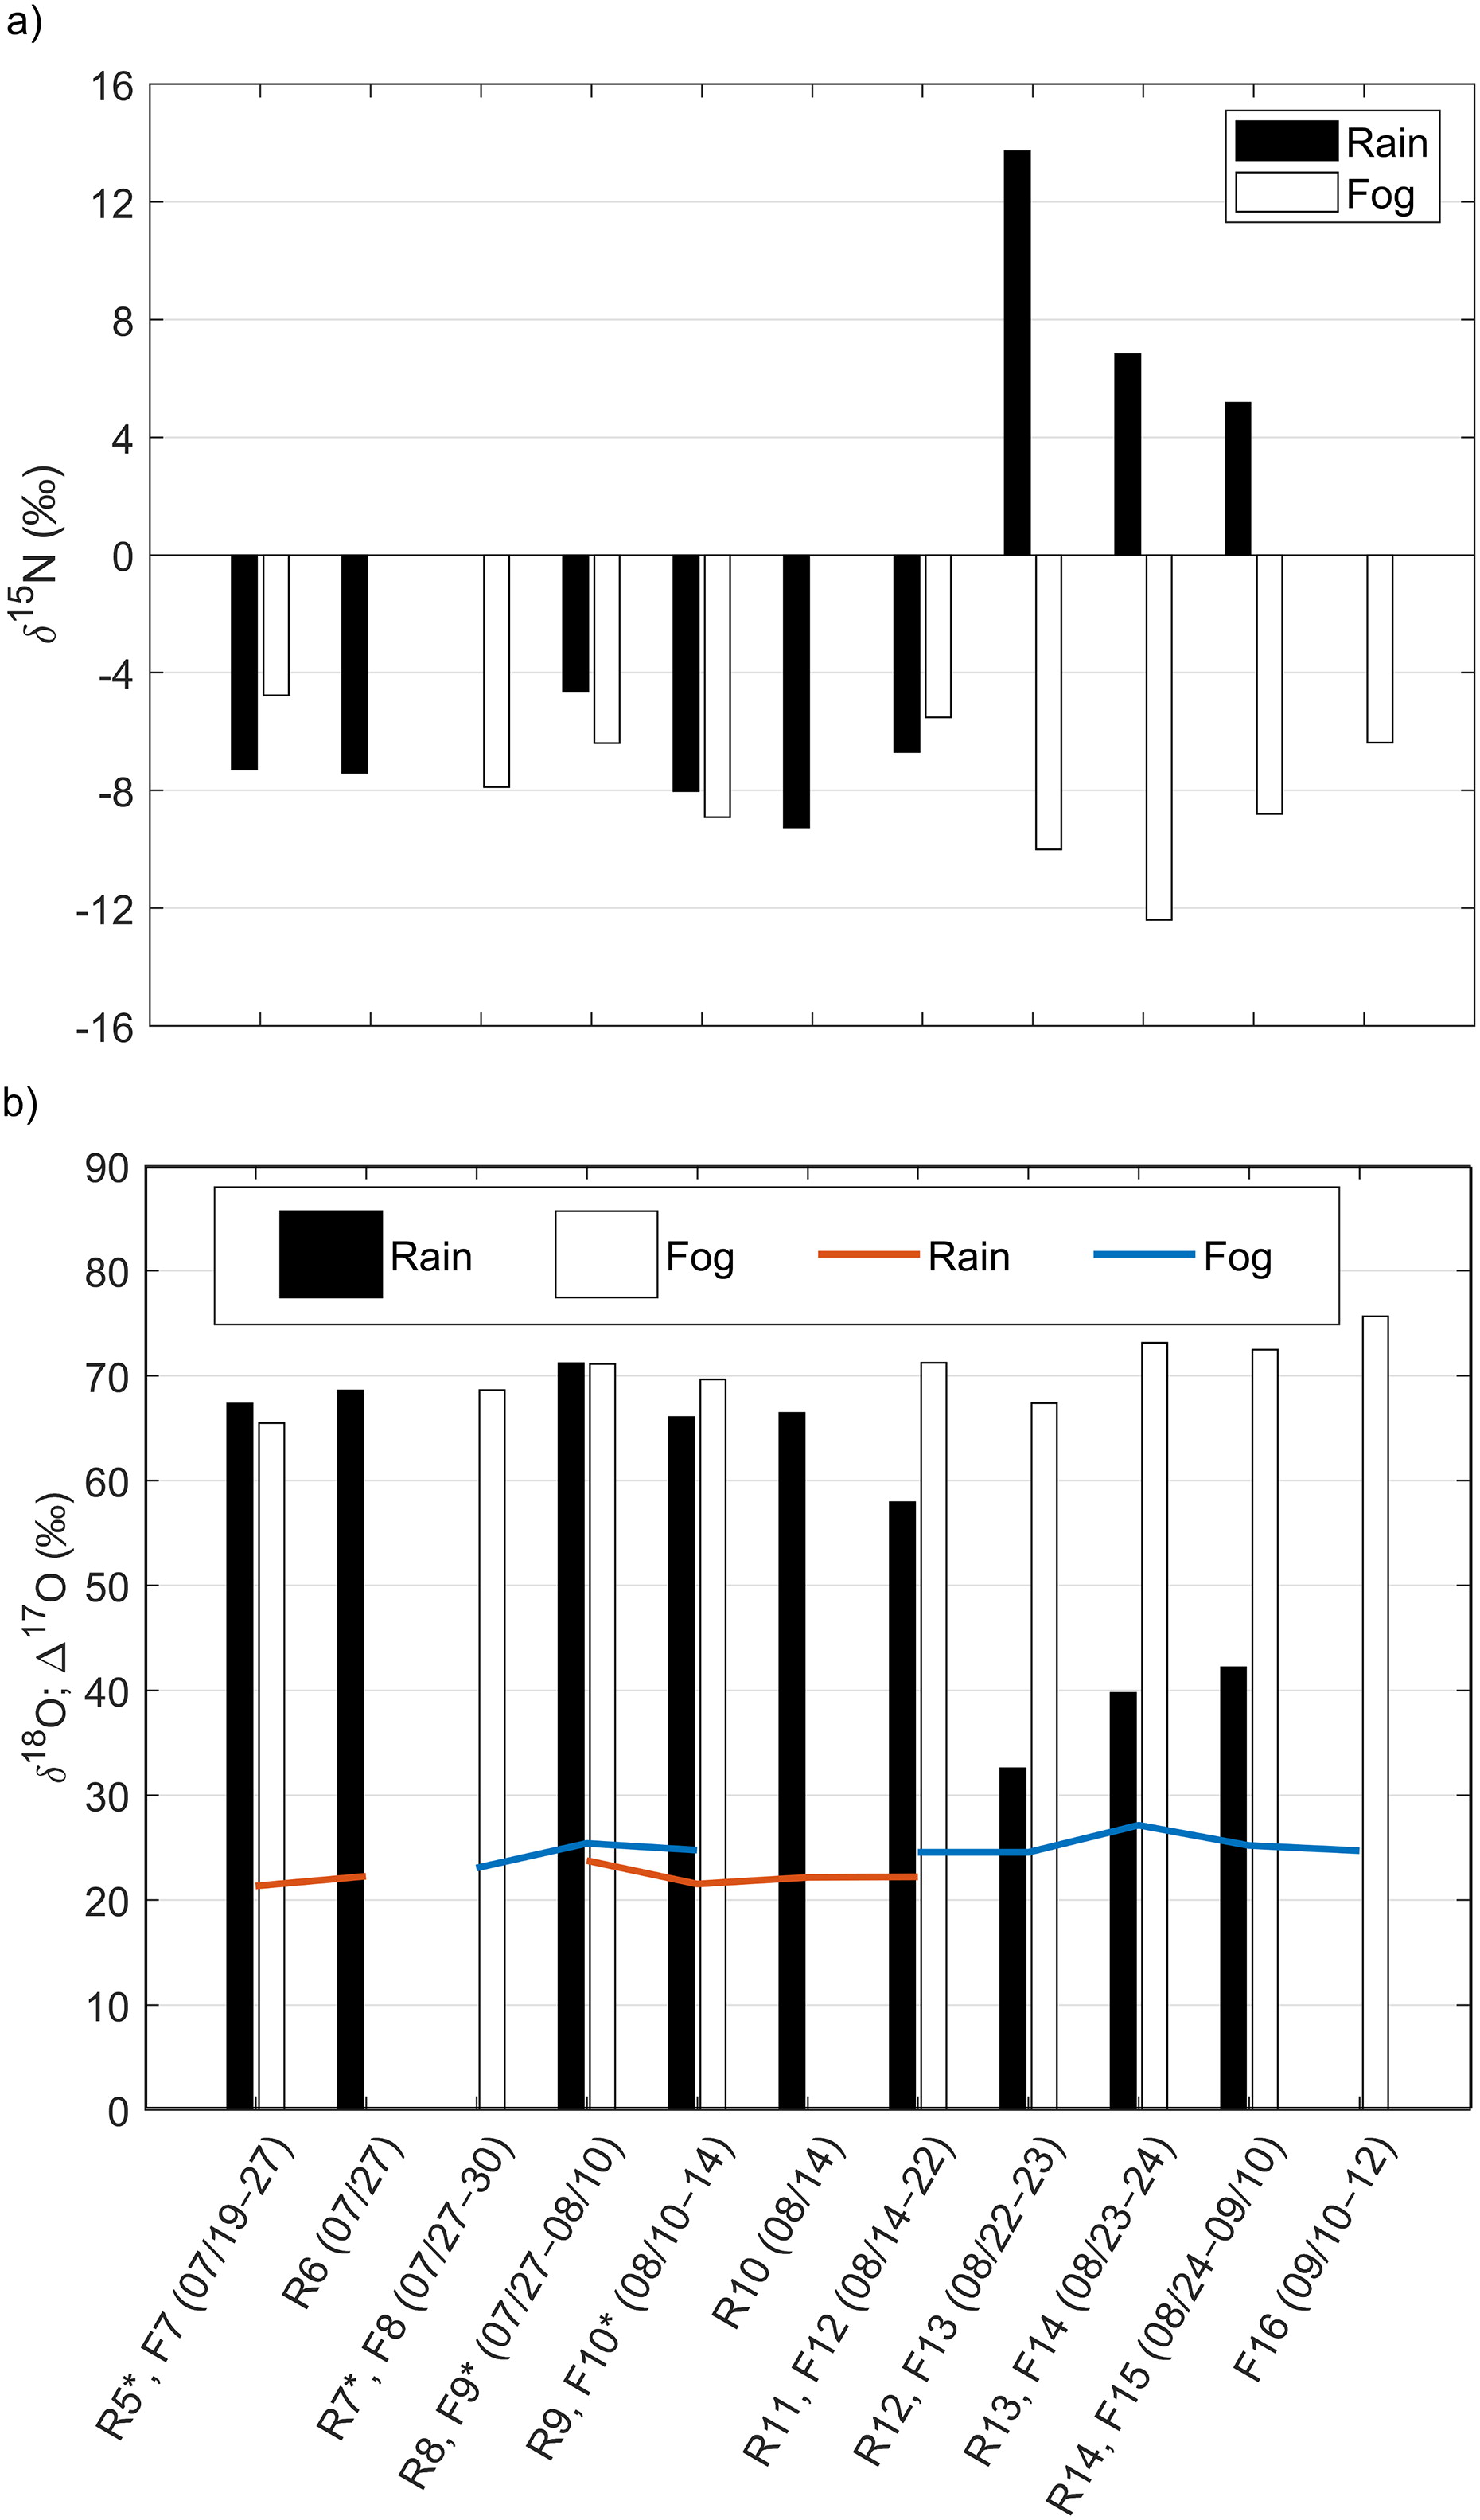
Fig. 8.

Bar plot of (a) δ(15N), and (b) δ(18O) and Δ(17O) in NO3 , from rain and fog samples collected during the CAEsAR campaign. In the bottom graph, Δ(17O) values for rain and fog samples are shown with red and blue lines, respectively. (*) The sampling date is (as detailed in Table 1): R5 07/22–27, R7 07/27, F9 07/30–08/10, F10 08/10–12.

Table 5.

Fog/rain ratios of mean ion concentrations of samples classified as high, medium, or low (explained in Section 3.2), and associated to three main ion sources: anthropogenic (i.e. high NO3 concentrations), inland (i.e. medium NO3 concentrations), and marine Arctic (i.e low NO3 concentrations), also described in Section 3.2.

IonRatio fog/rain ± 1σAnthropogenicInlandMarine ArcticNa+14 ± 202 ± 37 ± 12NH4+3 ± 43 ± 22 ± 3ssK+14 ± 202 ± 37 ± 12ssCa2+14 ± 202 ± 37 ± 12ssMg2+12 ± 182 ± 37 ± 12Cl5 ± 63 ± 37 ± 14Br4 ± 33 ± 46 ± 10NO34 ± 43 ± 24 ± 3ssSO42−14 ± 202 ± 37 ± 12nssK+2 ± 21 ± 11.4 ± 0.8nssCa2+1 ± 10.8 ± 0.70.6 ± 0.6nssMg2+0.8 ± 0.44 ± 38 ± 8nssSO42−2 ± 23 ± 25 ± 6
Table 6.

Mean and standard deviation (1σ) for rain and fog deposition of selected ions considering modelled deposition velocities reported by Matsumoto et al. (2011).

IonRain deposition (μmol m−2 d−1)Fog deposition (μmol m−2 d−1)Na+15 ± 26113 ± 268NH4+26 ± 3672 ± 69K+5 ± 69 ± 10Ca2+34 ± 3833 ± 57Mg2+4 ± 518 ± 27Cl15 ± 1970 ± 114Br0.06 ± 0.080.2 ± 0.3NO323 ± 2789 ± 111SO42−17 ± 1975 ± 92
Table S1.

Mean daily precipitation estimated as the mean of daily precipitation at the three SMHI stations near Åre: Medstugan, Digernäset and Vallbo, and mean, median, standard deviation (1σ), maximum, and minimum precipitation values for the three stations (considering the study period, i.e., 77-days).

DateMean daily precipitation (Combining the three stations) (mm d−1)DateMean daily precipitation (Combining the three stations) (mm d−1)Jun 282.1Aug 513.0Jun 291.1Aug 69.9Jun 308.0Aug 80.2Jul 32.3Aug 91.8Jul 51.1Aug 101.8Jul 61.5Aug 110.7Jul 73.4Aug 120.2Jul 80.5Aug 131.3Jul 110.5Aug 142.6Jul 121.6Aug 177.2Jul 134.5Aug 1812.1Jul 140.1Aug 190.7Jul 155.1Aug 206.2Jul 1710.4Aug 217.2Jul 181.3Aug 222.7Jul 190.7Aug 233.3Jul 200.3Aug 243.3Jul 221.9Aug 252.0Jul 231.3Aug 261.3Jul 254.3Aug 270.6Jul 261.9Aug 280.2Jul 271.3Aug 300.9Jul 294.2Aug 310.6Jul 301.6Sep 10.4Jul 313.0Sep 20.5Aug 13.7Sep 70.1Aug 21.3Sep 80.1Aug 33.1Sep 90.2Aug 49.5Sep 111.4Statistics considering the 77-day periodStationCombining the three stationsMedstuganDigernäsetVallboMean (mm)2322Median (mm)10011σ (mm)3644Maximum (mm)13262319Minimum (mm)0000.0
Table S2.

Days in which fog was present at the sampling site and mean liquid water content γ(H2O), for each sample interval.

SampleDateMean γ(H2O) (g m−3)SampleDateMean γ(H2O)(g m−3)F1Jul 40.18F12Aug140.26Jul 7Aug15F2Jul 80.42Aug16Jul 13Aug17F3Jul 140.23Aug18F4Jul 150.37Aug19Jul 16Aug20F5Jul 170.32Aug21F6Jul 180.23F13Aug220.21F7Jul 190.01F14Aug230.31Jul 24F15Aug240.22Jul 25Aug25Jul 26Aug26F8Jul 280.26Aug27Jul 29Aug28F9Jul 300.26Aug29Aug 1Aug30Aug 2Aug31Aug 3Sep02Aug 4Sep03Aug 5Sep04Aug 6Sep05Aug 7Sep06Aug 8Sep08Aug 9Sep09F10Aug 100.19F16Sep100.38Aug 11Sep11F11Aug 120.02Sep12
Language: English
Page range: 1559398 - 1559398
Published on: Jan 1, 2019
Published by: Stockholm University Press
In partnership with: Paradigm Publishing Services

© 2019 Carmen P. Vega, E. Monica Mårtensson, Ulla Wideqvist, Jan Kaiser, Paul Zieger, Johan Ström, published by Stockholm University Press
This work is licensed under the Creative Commons Attribution 4.0 License.