
Table 1.
Values used for the simulation describing typical aerosol properties of a quasi-unary model, described by (Olenius and Riipinen, 2017).
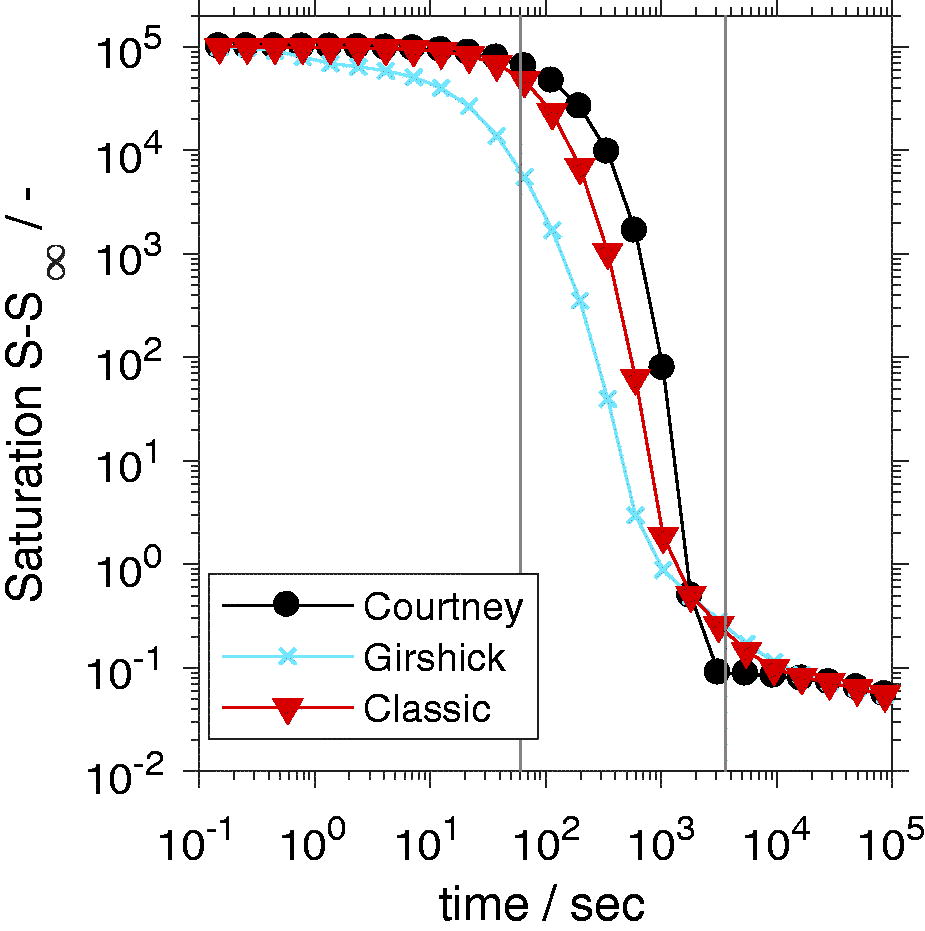
Fig. 1.
The supersaturation surplus for an initial supersaturation of and . The vertical lines designate the simulation times of 1 min and 1 hr, a total simulation time of 24 hr is presented.
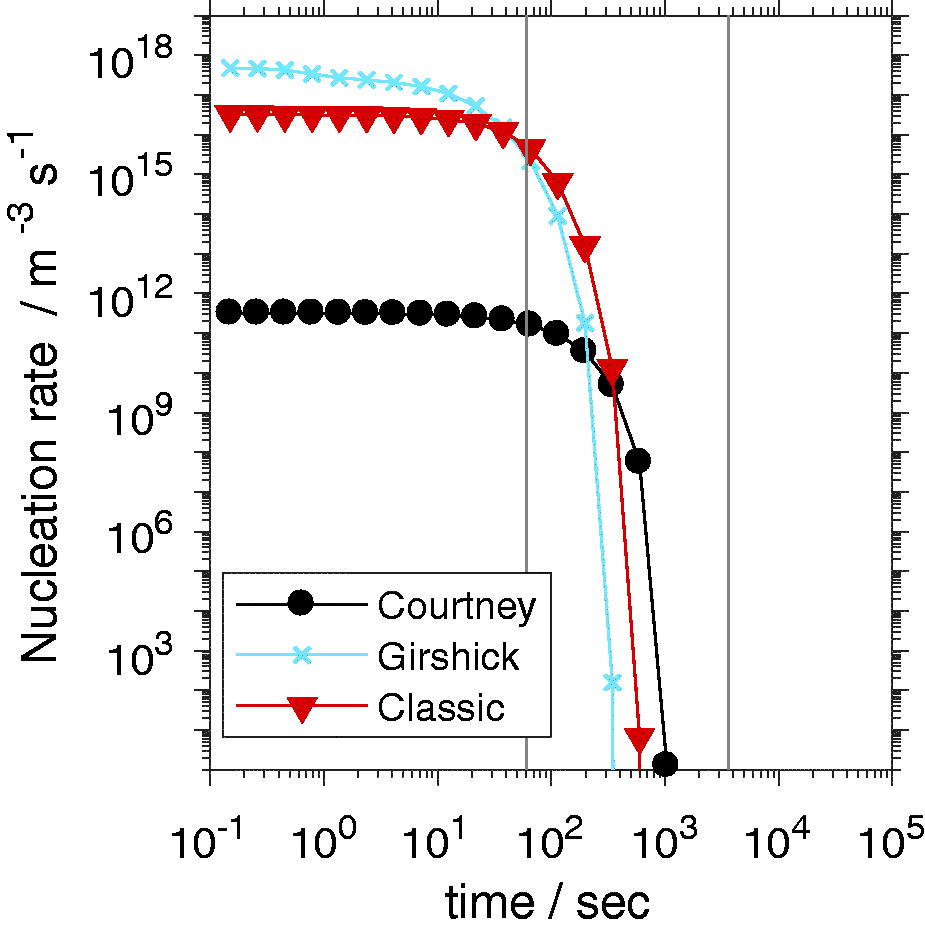
Fig. 2.
The nucleation rates for the three discussed nucleation theories for an initial supersaturation of . The vertical lines represent the simulation times of 1 min and 1 hr, a total simulation time of 24 hr is presented.
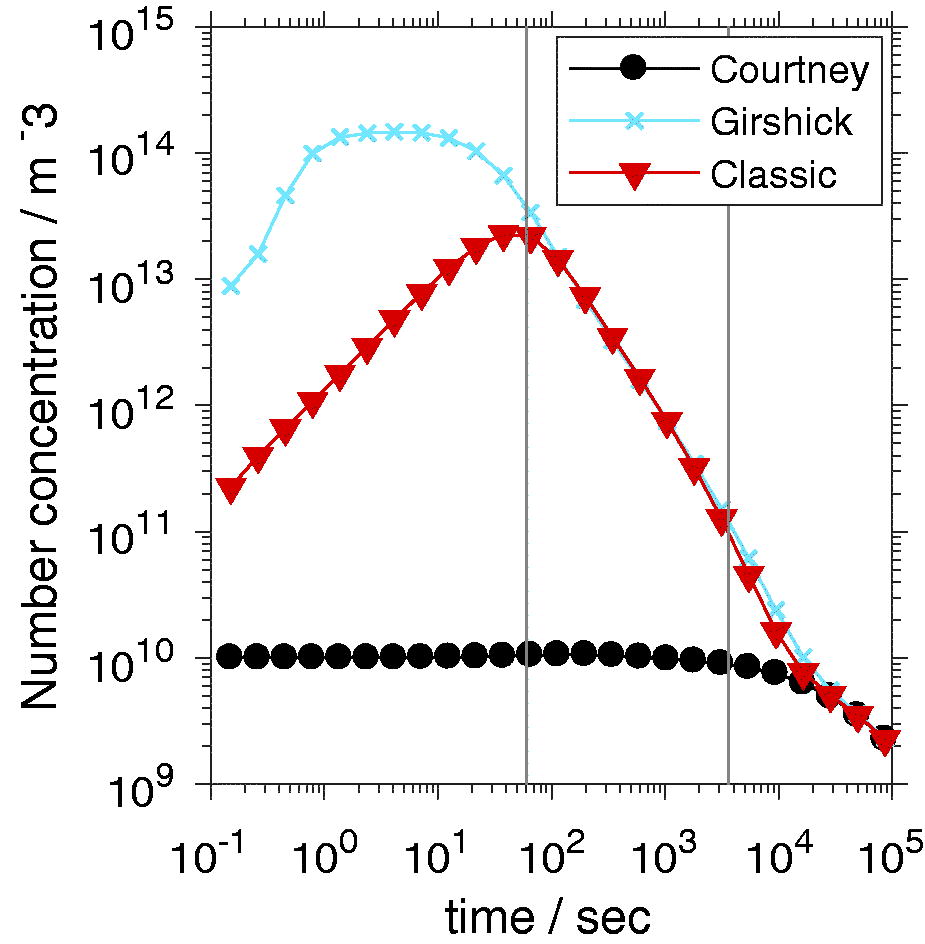
Fig. 3.
The number concentration in dependency of the used nucleation theories are shown. The vertical lines represent the simulation times of 1 min and 1 hr, a total simulation time of 24 hr is presented.
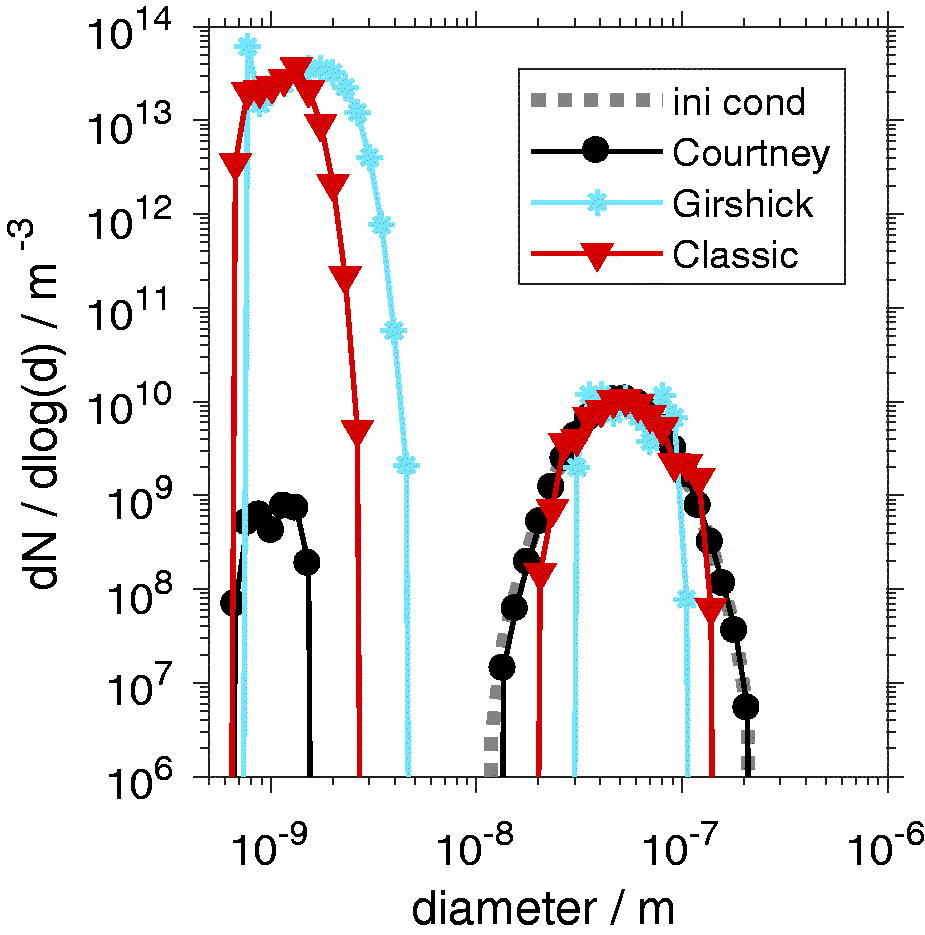
Fig. 4.
The PSDs resulting from the three different nucleation theories after a simulation time of 1 min for .

Fig. 5.
The PSDs resulting from the three different nucleation theories after a simulation time of 1 hr for .
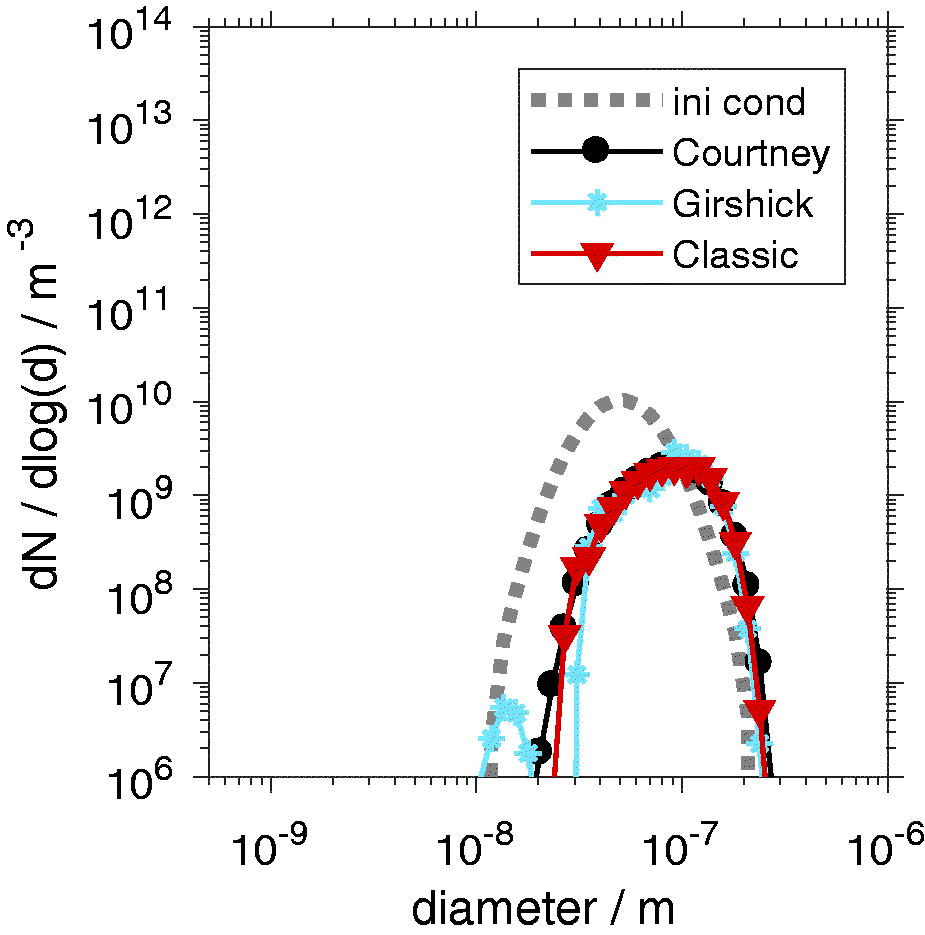
Fig. 6.
The PSDs resulting from the three different nucleation theories after a simulation time of 24 hr for .

Fig. 7.
The relative deviation of the total volume [defined in Equation (11)] from the initial total volume .
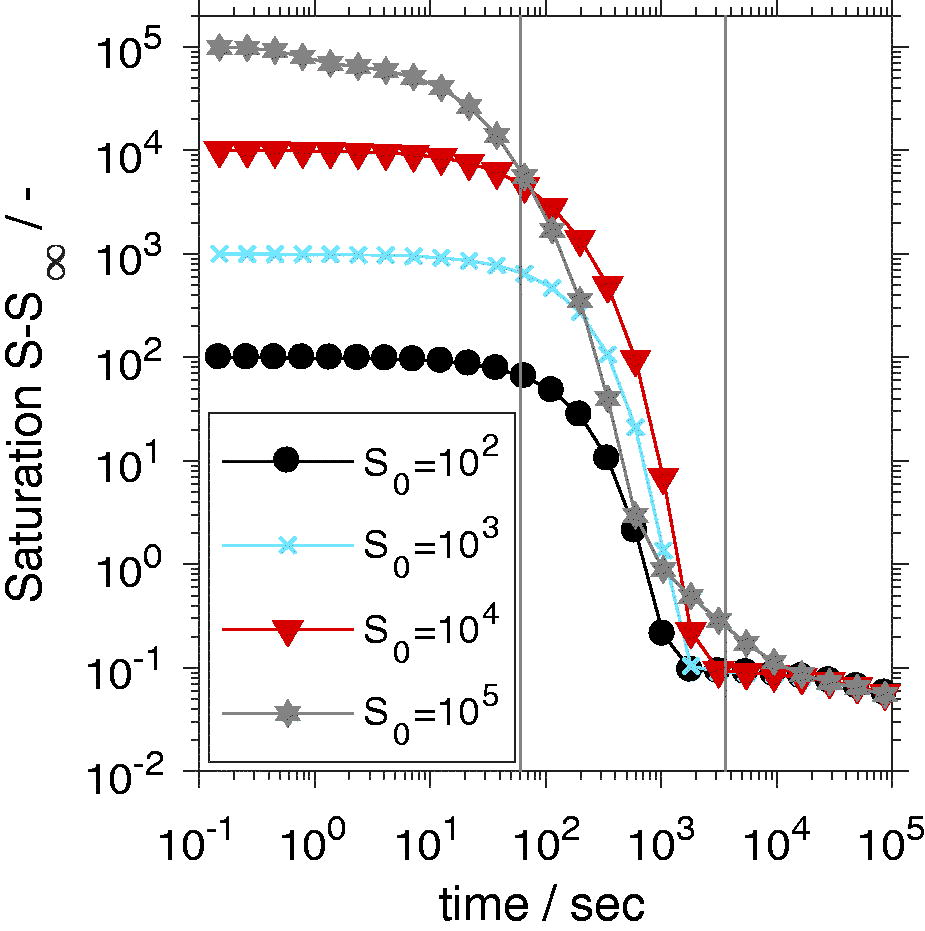
Fig. 8.
The supersaturation in dependency of its initial value for the Girshick nucleation theory. The vertical lines represent the simulation times of 1 min and 1 hr, a total simulation time of 24 hr is presented.
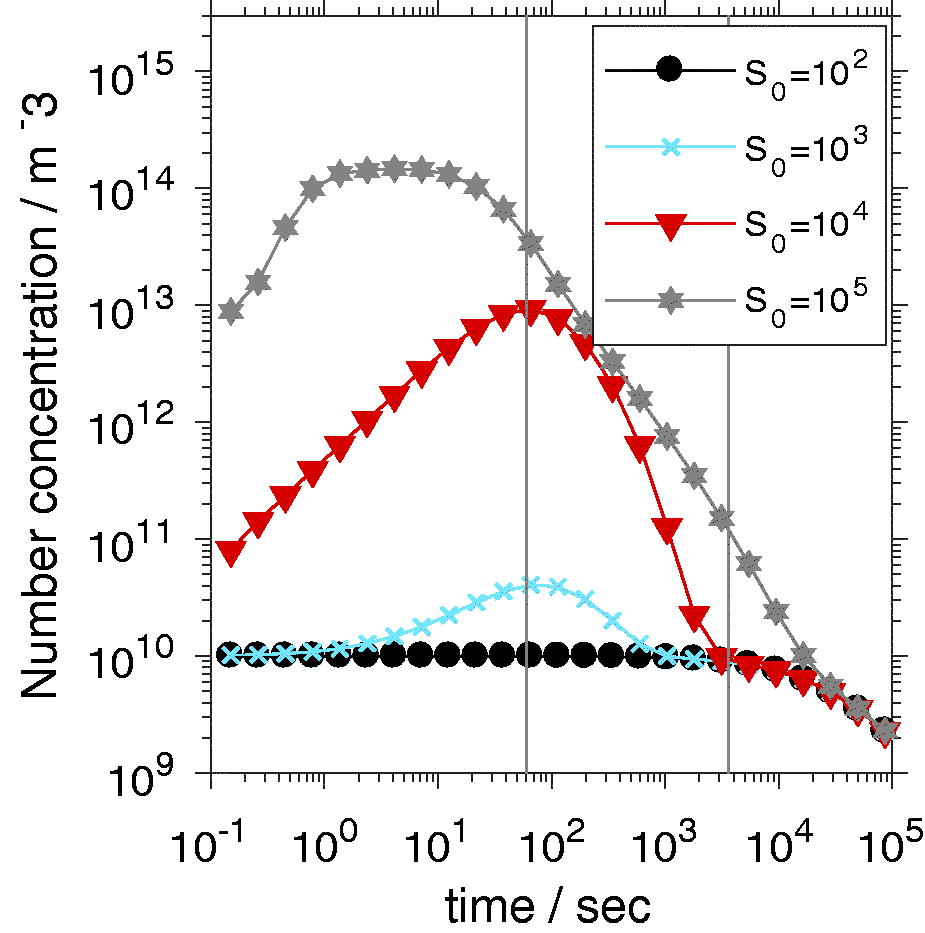
Fig. 9.
The number concentration in dependency of the initial supersaturation value for the Girshick nucleation theory. The vertical lines represent the simulation times of 1 min and 1 hr, a total simulation time of 24 hr is presented.