
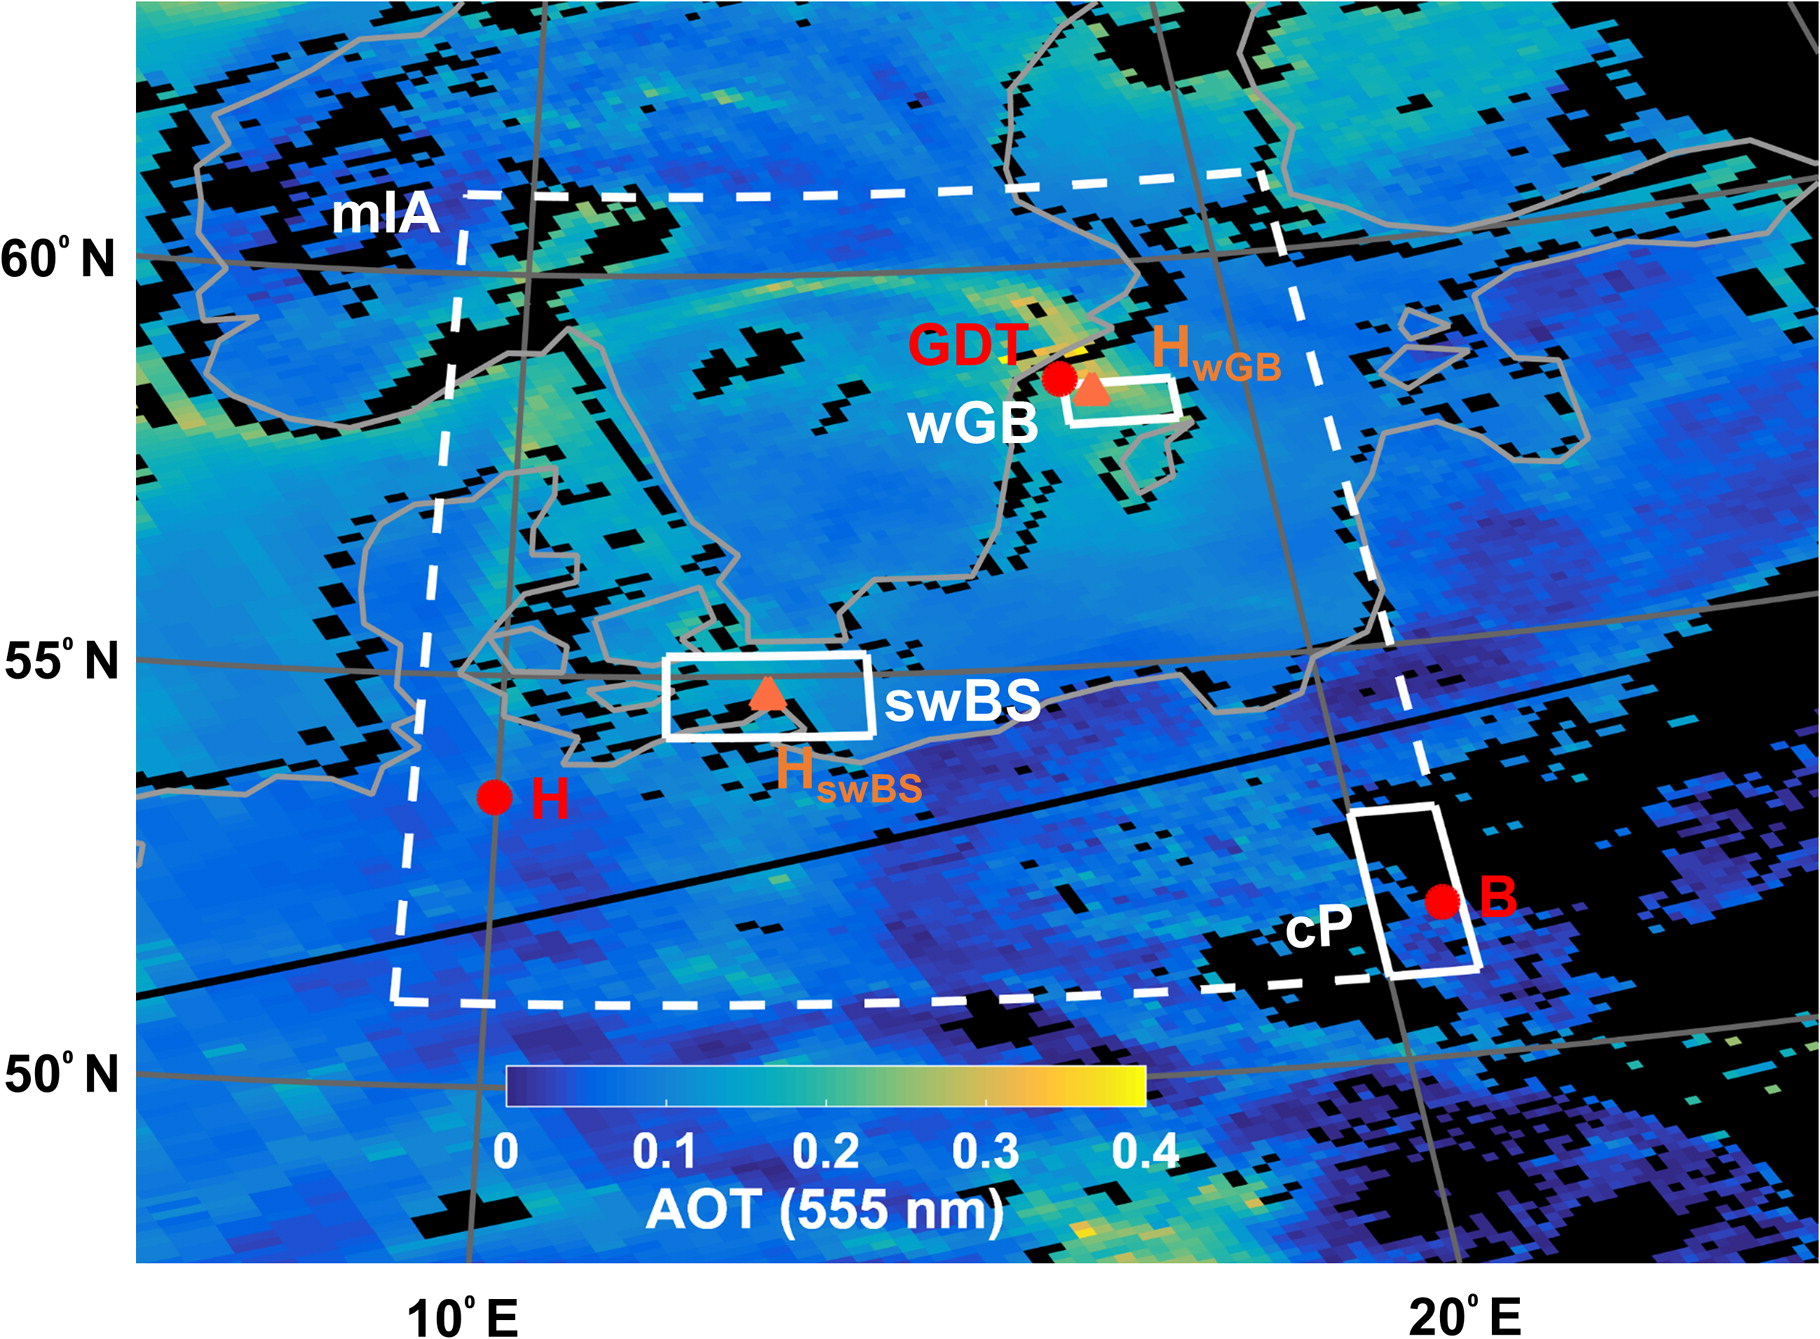
Fig. 1.
Two granules with AOT (550 nm) at 10-km resolution, retrieved from MODIS c051 Aqua observations at 11:25 and 11:30 UTC on 22 September 2006. The large white dashed box denotes the main investigation area (mIA), for which MODIS AOT available within this area and corresponding to April to September of the period 2003–2015 are used in the present study. The three smaller white solid boxes denote areas of the wGB, swBS and cP, for which trends in MODIS monthly AOT have been estimated with respect to the period 2003–2015. The red circles denote the AERONET stations GDT, Hamburg (H) and Belsk (B). The orange triangles denote locations in wGB (HwGB) and swBS (HswBS), which are used as starting locations for 5-days back trajectories calculated with the HYSPLIT model. See Table 1 for additional information.
Table 1.
Complementary information to Fig. 1 concerning the current investigation areas and present objectives (investigation periods are shown in Table 2).
Basin (wGB)58.5°N–58°NTrend in AOT17.5°E–19°EMODIS Aqua & Terrasouthwestern
Baltic Sea (swBS)55.25°N–54.25°NTrend in AOT12°E–14.5°EMODIS Aqua & TerracP52°N–51°NTrend in AOT20°E–21°EAERONET, MODISA/TGustav Dalen
Tower (GDT)58.57°NTrend in AOT a 17.47°EValidation of AOT b AERONET, MODISA/THamburg (H)53.50°NTrend in AOT a 9.97°EValidation of AOT b AERONET, MODISA/TBelsk (B)51.84°NTrend in AOT a 20.79°EValidation of AOT b HYSPLIT/MODISA/T (c061)wGB (HwGB)58.38°NTransport of clean and polluted air masses17.88°EHYSPLIT/MODISA/T (c061)swBS (HswBS)54.75°NTransport of clean and polluted air masses13.25°E
Table 2.
Linear trends obtained from MODIS and AERONET daily and monthly seasonally adjusted AOTs.
b Change in AOT per year (in %) and values denoted with boldface are statistically significant at the 95% confidence level (adjusted for temporal autocorrelation).
{ label (or @symbol) needed for fn[@id='TF6'] } dData for April, May, August and September are not available for all years, K = slope, M = y-intercept, RMSDrel = relative root mean square deviation, N = number of daily and monthly observed AOTs, X = No values are presented (see explanation in the text).
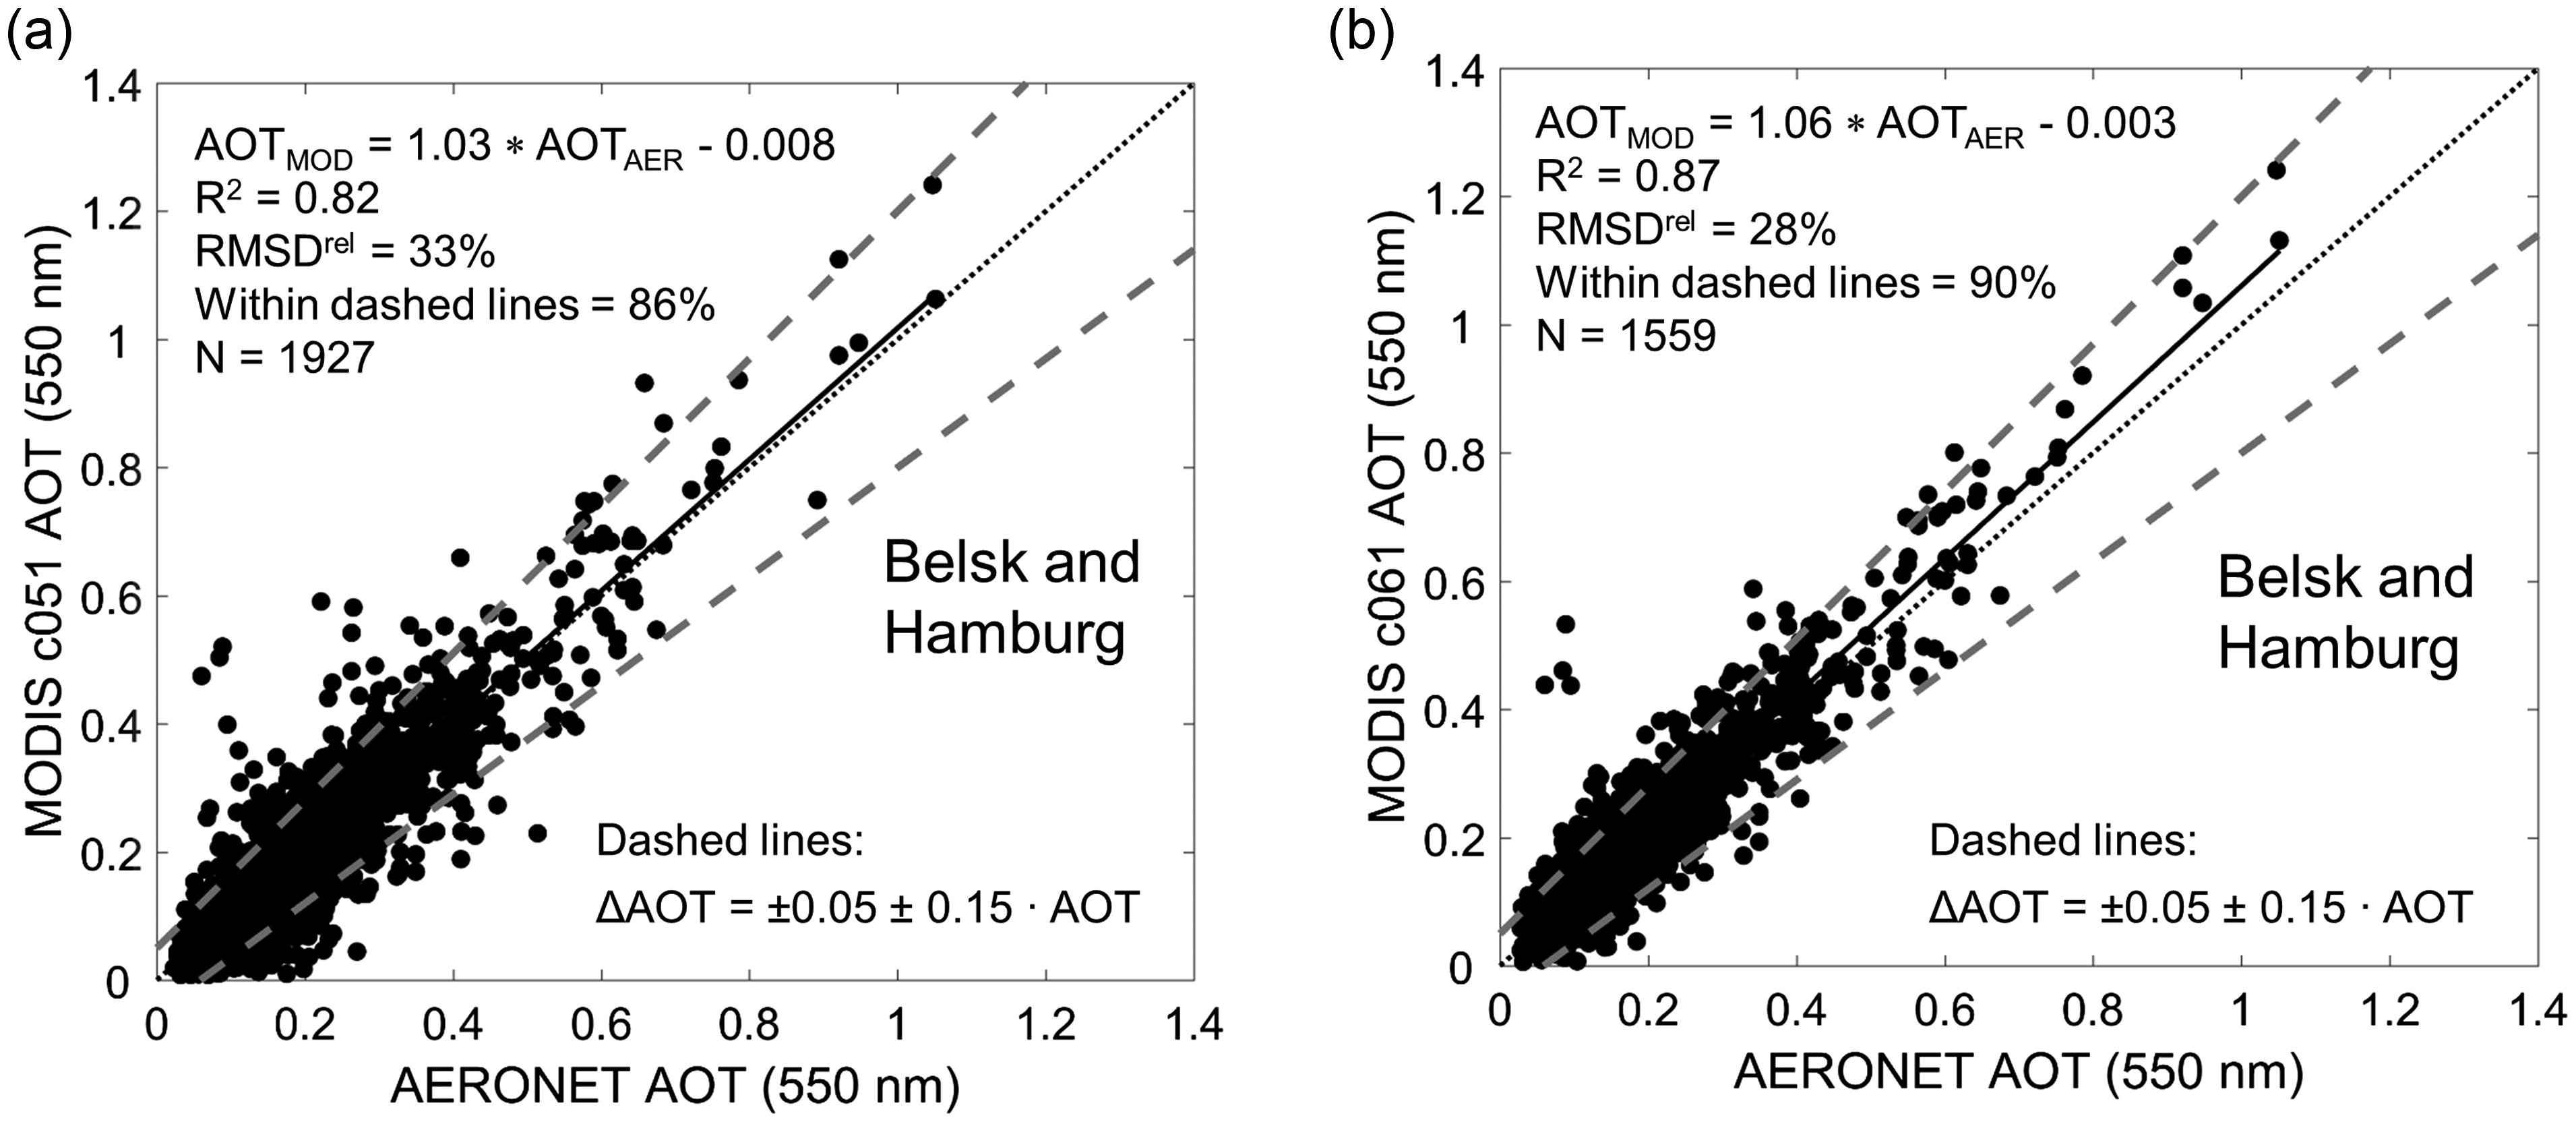
Fig. 2.
MODIS Aqua and Terra AOT versus AERONET AOT, for which the collocated values were obtained for April to September of the periods 2002–2015 (2003 is not included) and 2003–2016 for the stations Belsk and Hamburg, respectively, according to (a) c051 (2016 is not included) and (b) c061. The dashed lines in the figures represent predicted uncertainties (expected error envelopes) of the MODIS retrievals over land. R 2, RMSDrel and N denote the correlation coefficient, relative mean square deviation and number of collocated pairs, respectively. The solid and dotted lines denote the linear fit and 1-to-1 line, respectively.
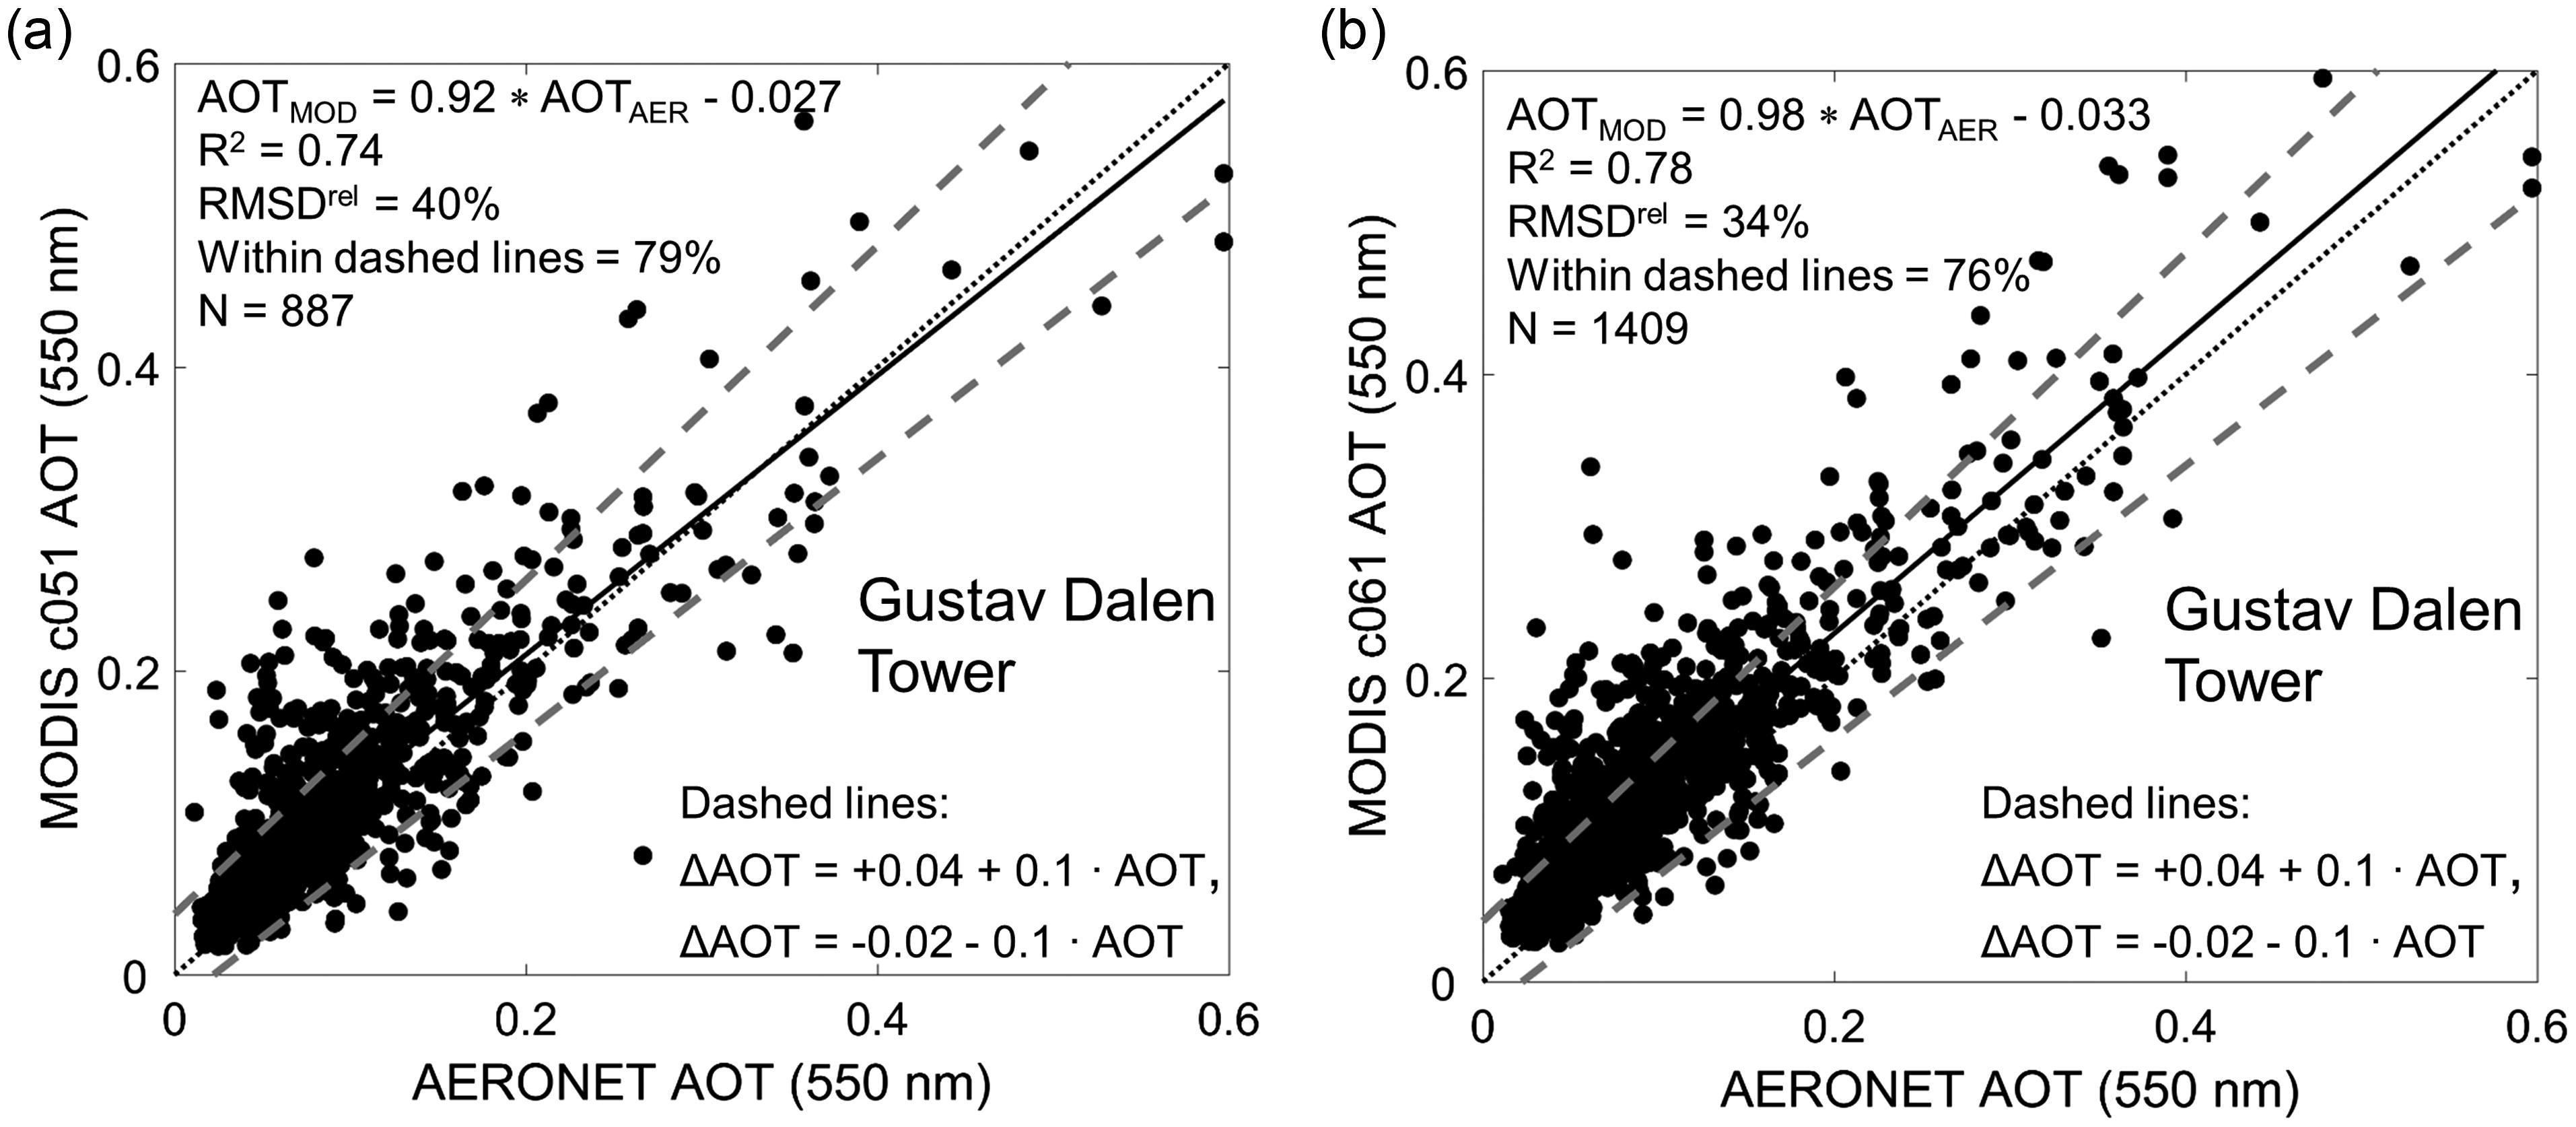
Fig. 3.
Same as Fig. 2, while with respect for the AERONET station GDT, for April–September of the period 2005–2015. The predicted uncertainties of the MODIS retrievals are for observations over the ocean.
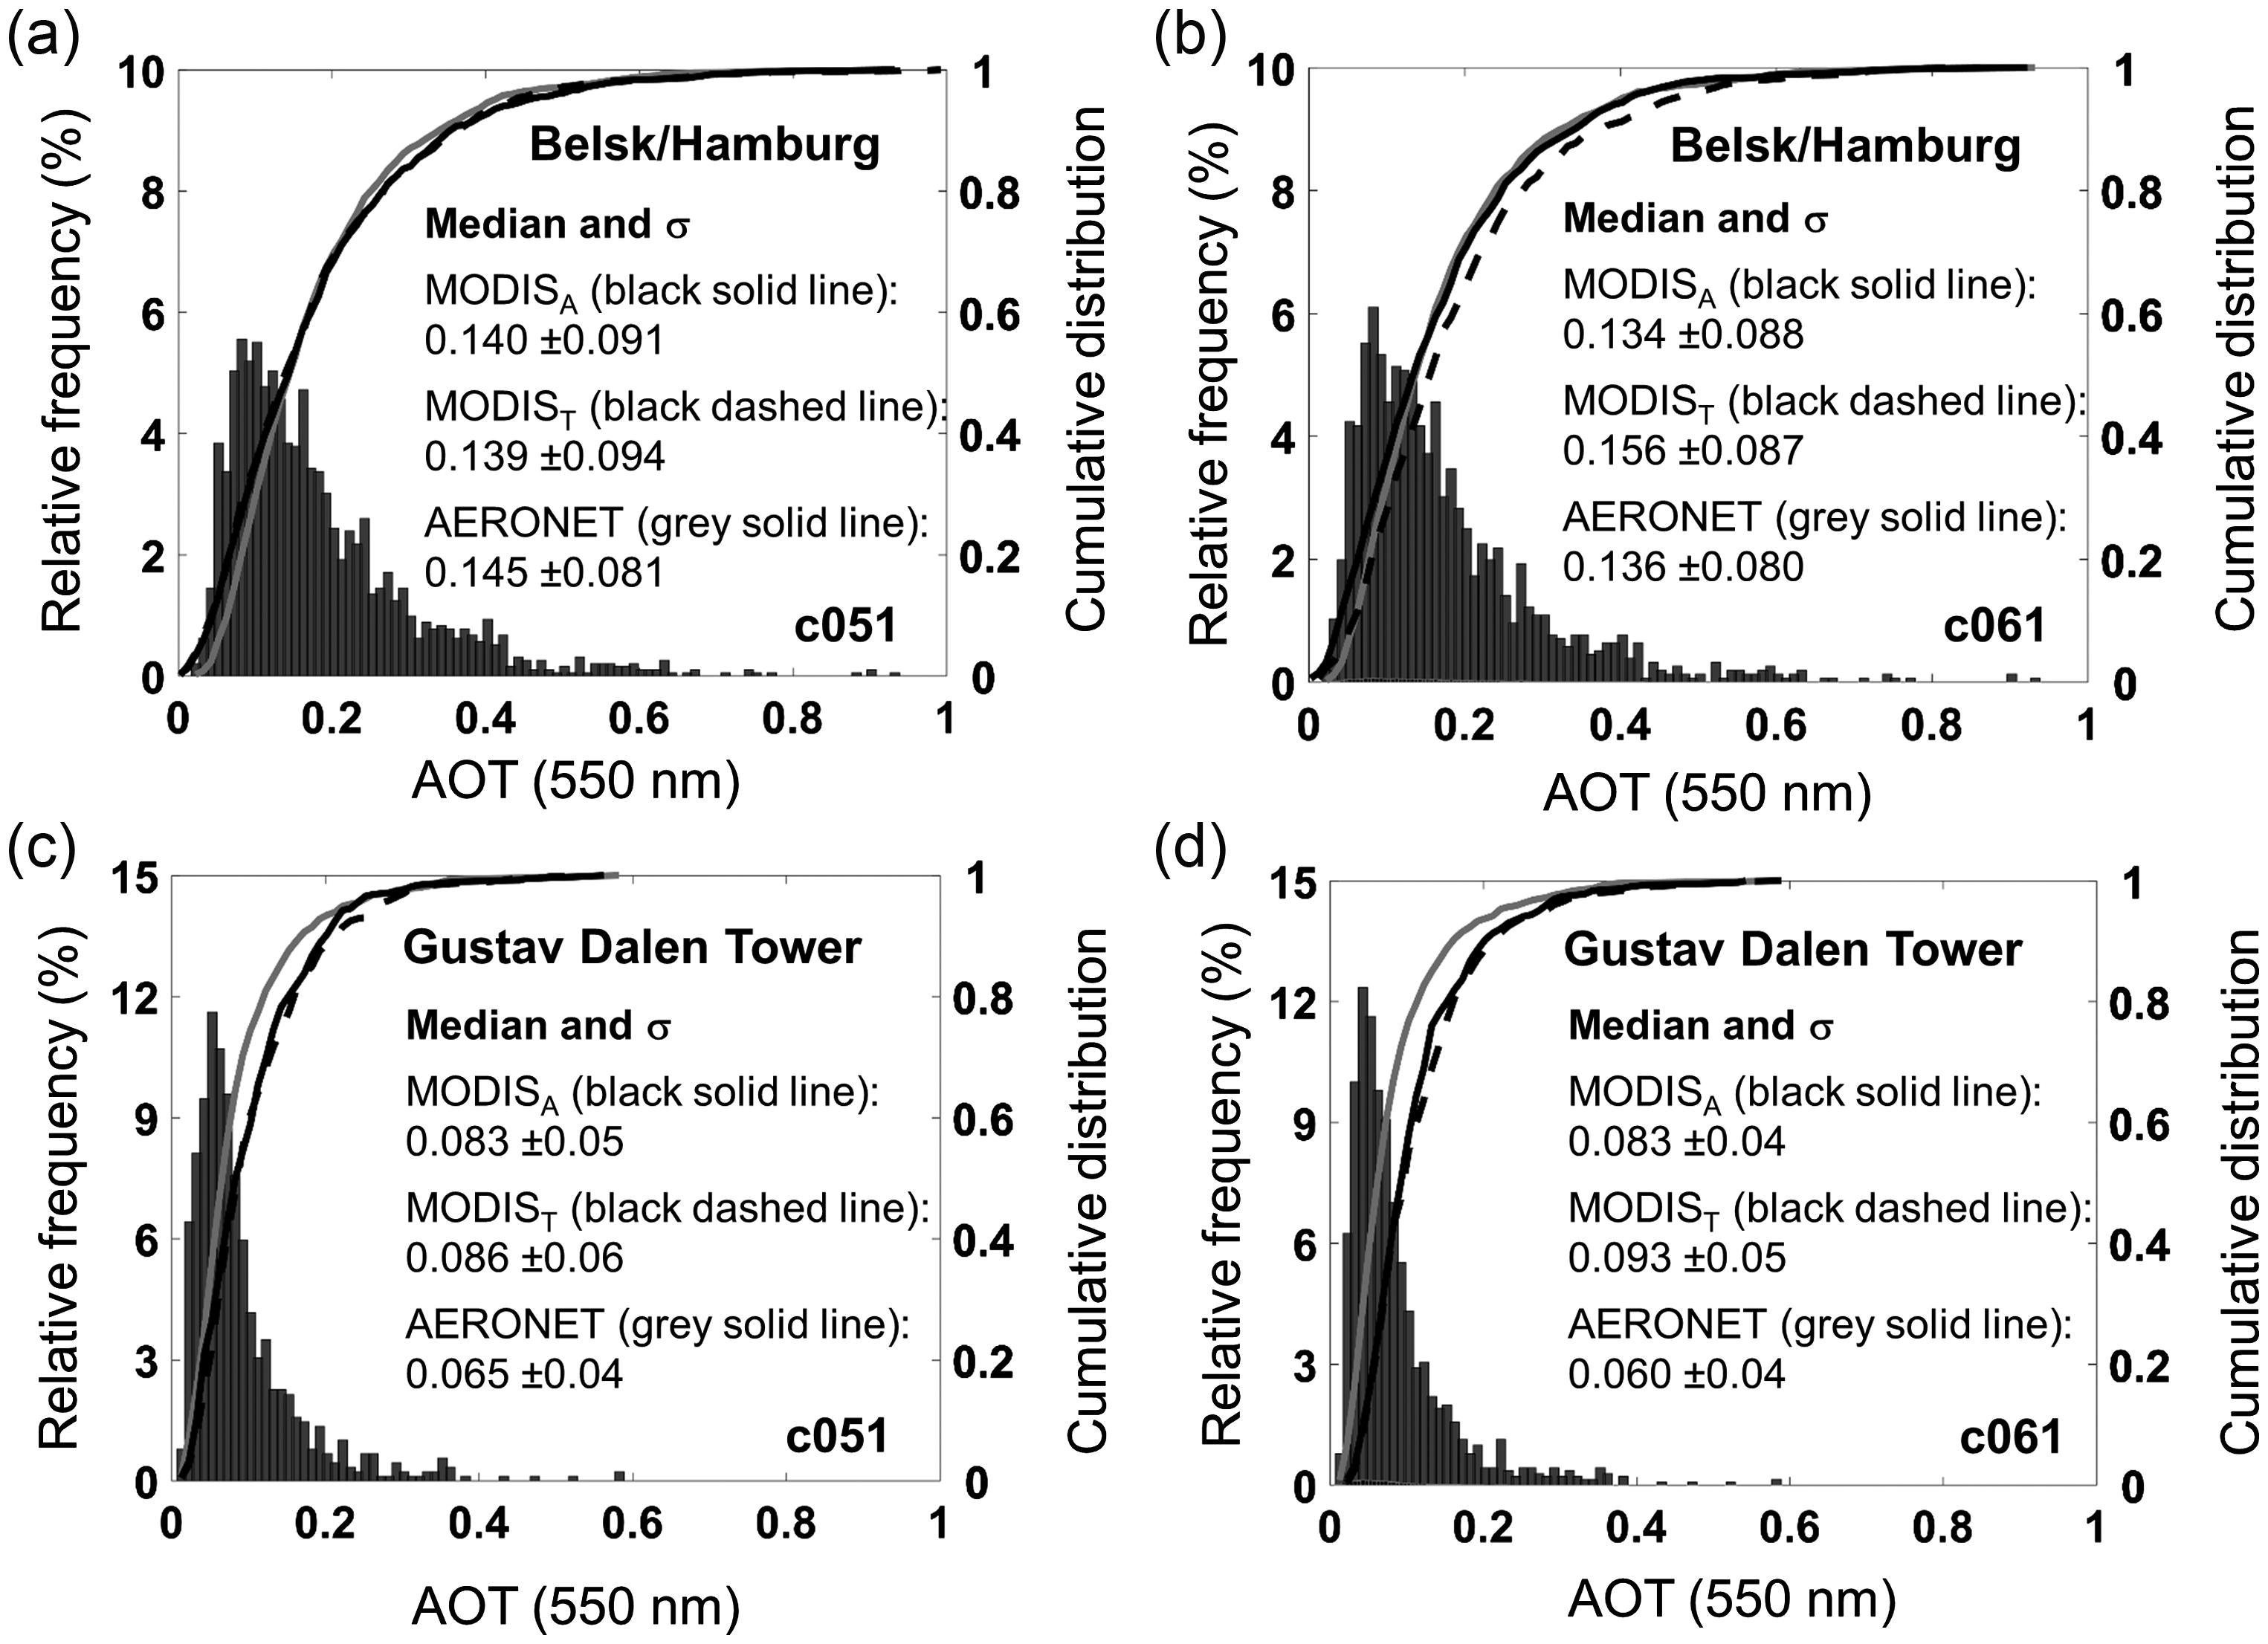
Fig. 4.
Relative frequency histogram of AERONET AOT (550 nm) and cumulative distribution of MODIS Aqua AOT (black solid line), MODIS Terra AOT (black dashed line) and AERONET AOT (grey solid line) of the results in Figs. 2 and 3, subdivided according to (a) Belsk & Hamburg and c051, (b) Belsk & Hamburg and c061, (c) GDT and c051 and (d) GDT and c061. The text in the figures shows median and standard deviation (σ).
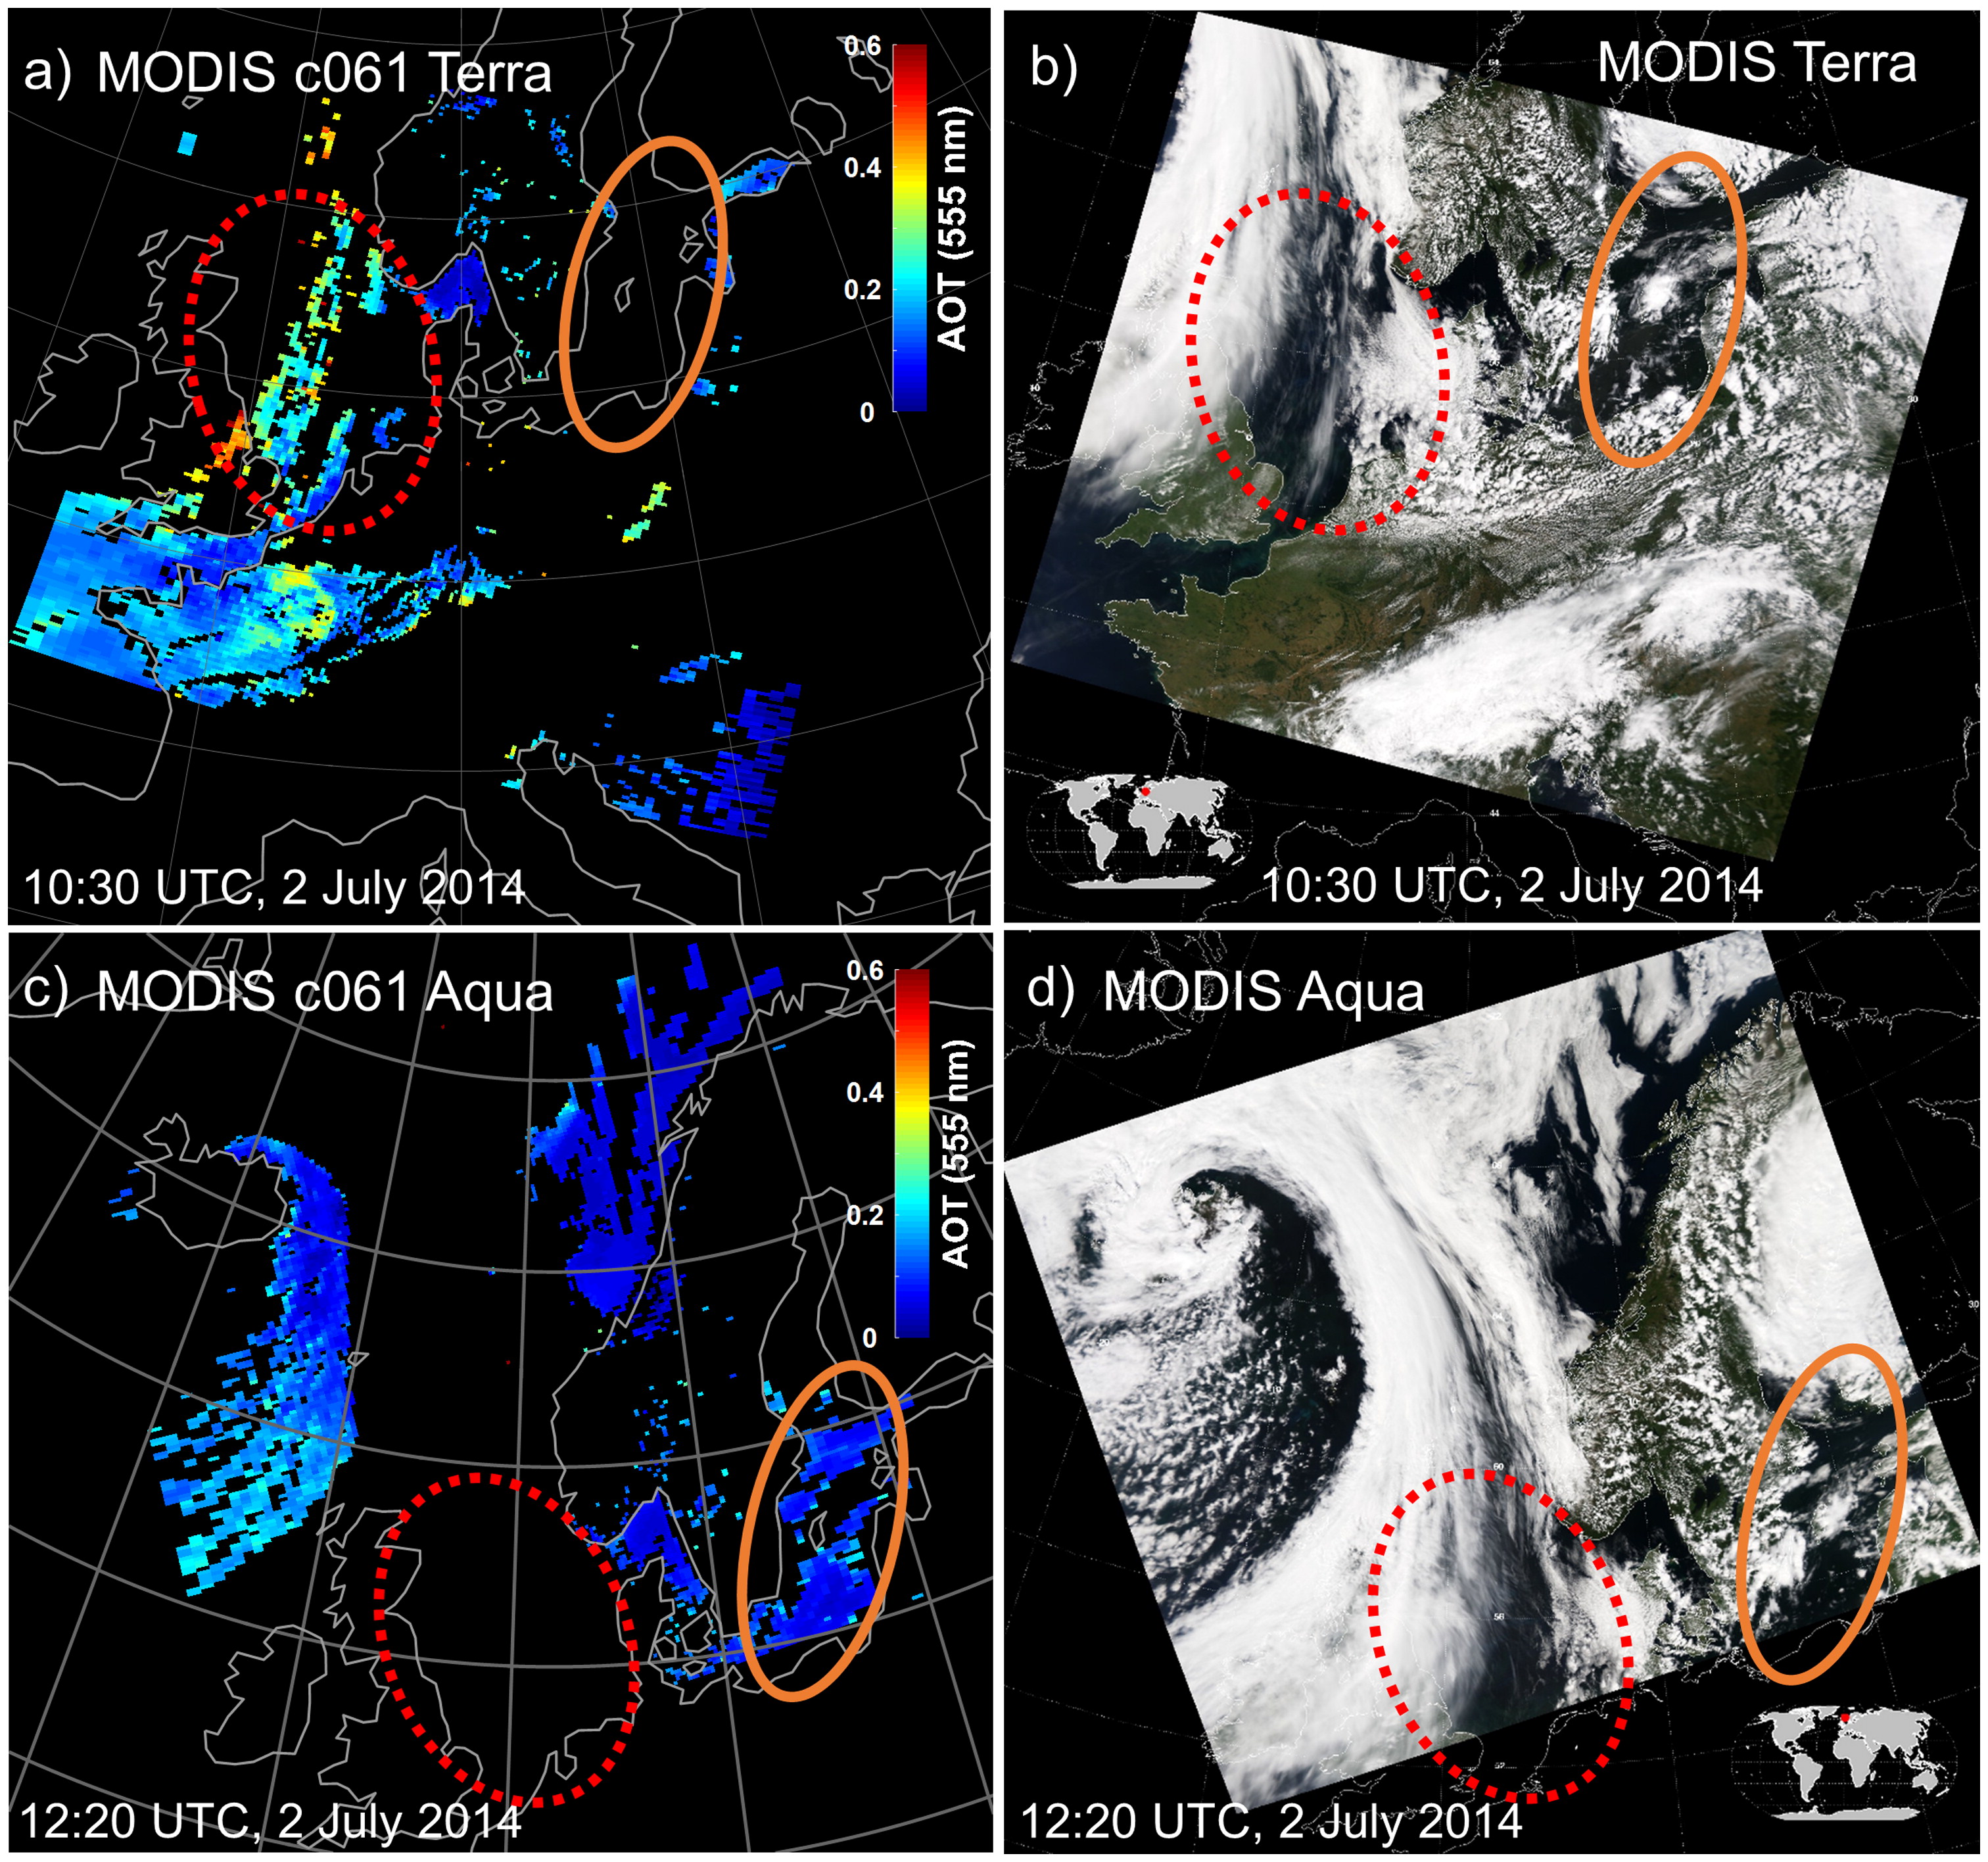
Fig. 5.
MODIS c061 AOT scenes over Europe for 2 July 2014, obtained from overpasses by (a) Terra at 10:30 UTC and (c) Aqua at 12:20 UTC. Panels (b) and (d) show the corresponding MODIS visible composite pictures. The areas denoted by the red dashed and the orange solid ovals are discussed in the text.
Table 3.
Mean number of days (in %) with MODIS and AERONET available AOTs, with respect to time periods listed in Table 2.
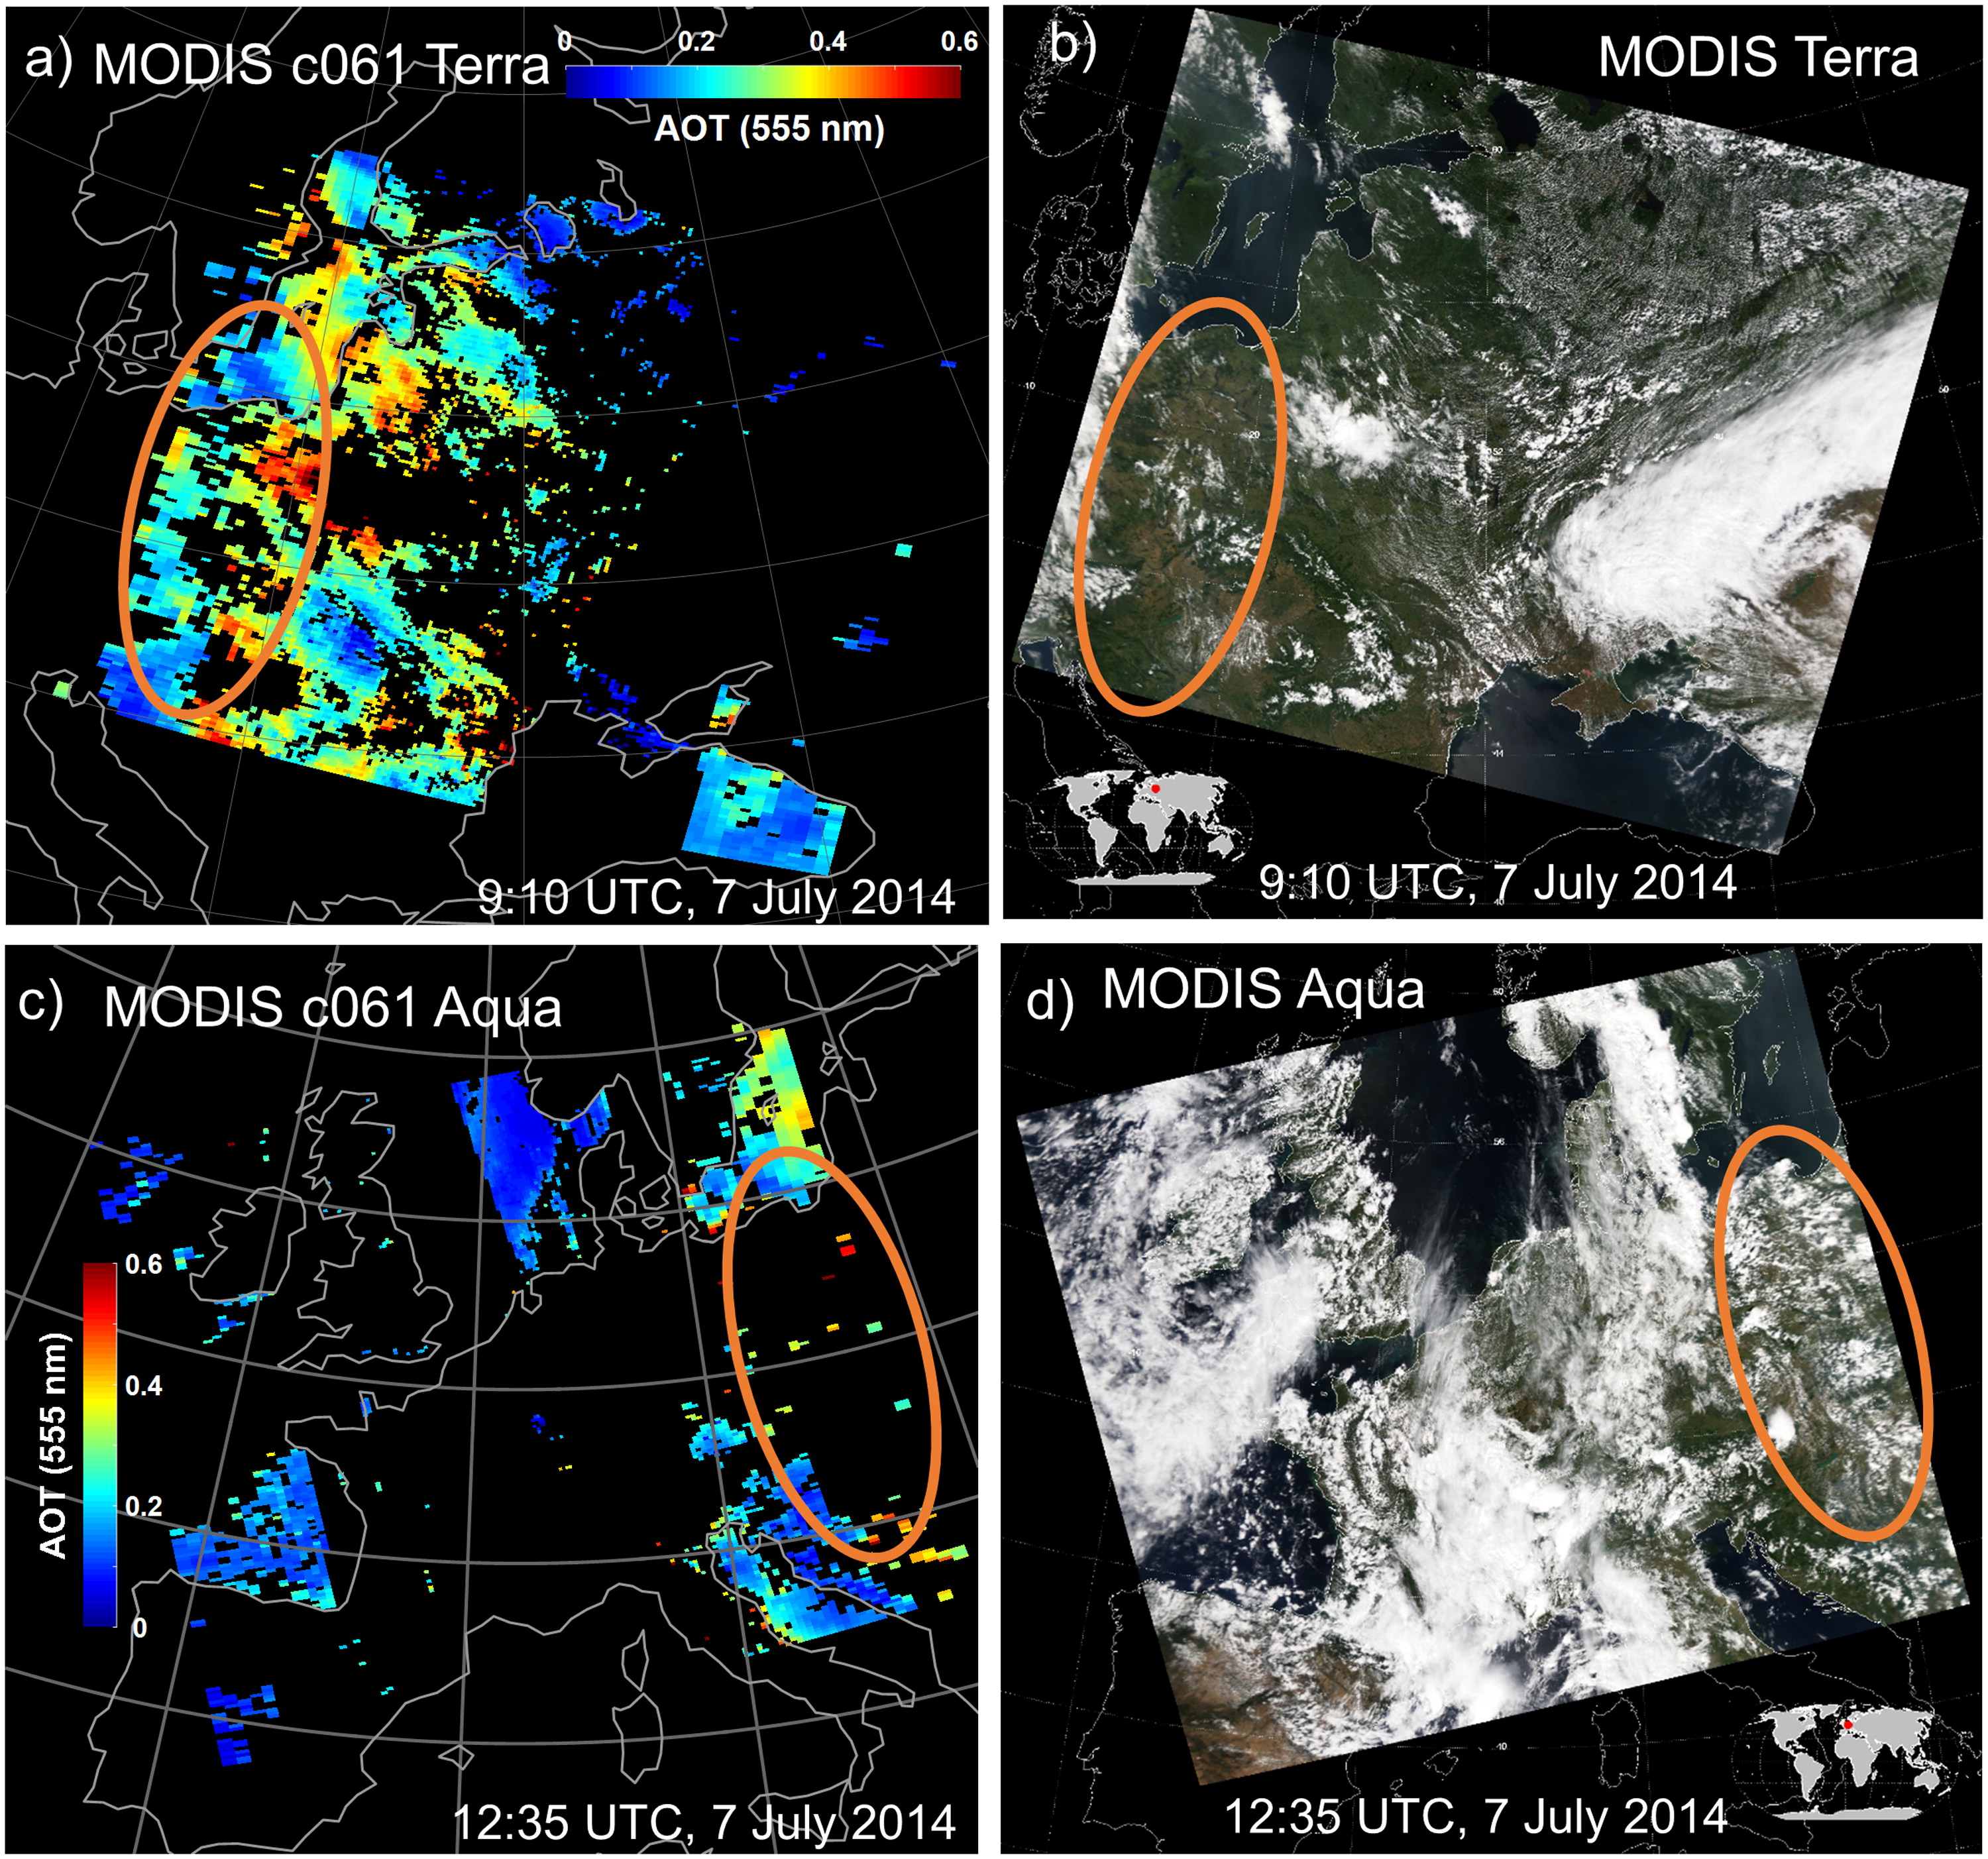
Fig. 6.
MODIS c061 AOT scenes over Europe for 7 July 2014, obtained from overpasses by (a) Terra at 9:10 UTC and (c) Aqua at 12:35 UTC. Panels (b) and (d) show the corresponding MODIS visible composite pictures. The areas denoted by the orange solid ovals are discussed in the text.
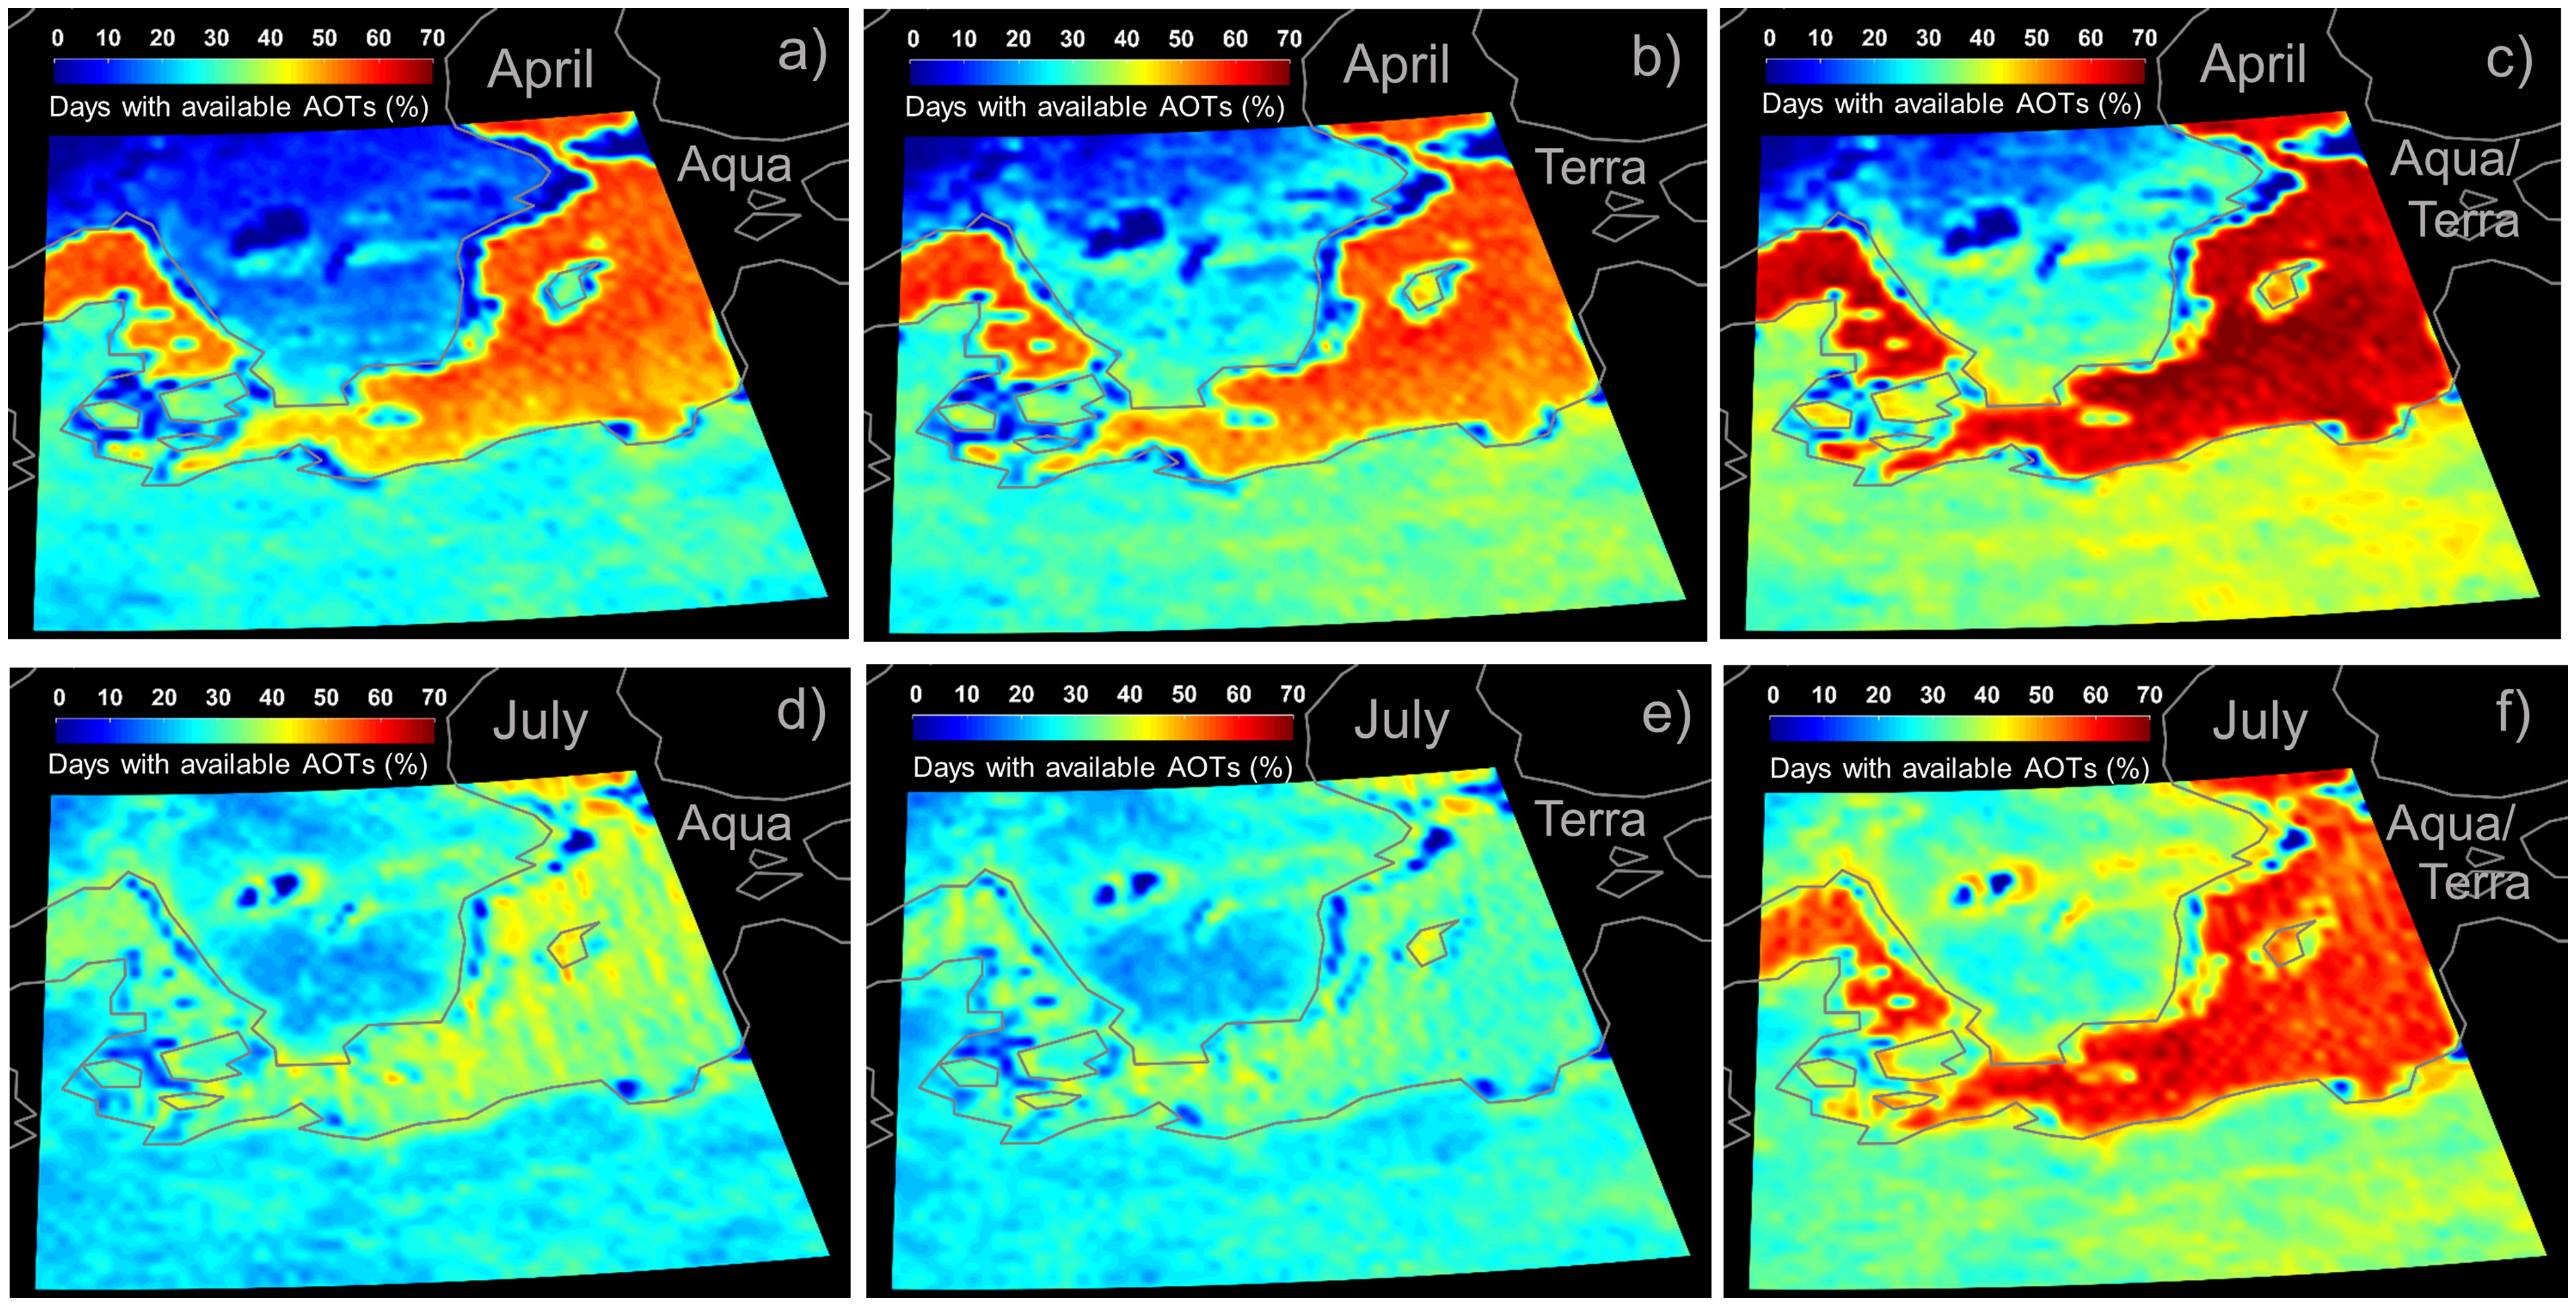
Fig. 7.
Percentage of days with available AOTs (c051) for April (top panels) and July (bottom panels) for the main investigation area. The left, centre and right panels show the MODIS Aqua, Terra and combined datasets, respectively.

Fig. 8.
Differences between c051 and c061, in percentage of days with available MODIS Aqua/Terra AOTs, for April (a) and July (b) of the period 2003–2015 and the main investigation area. The grey circles denote the AERONET stations GDT, Hamburg (H) and Belks (B).
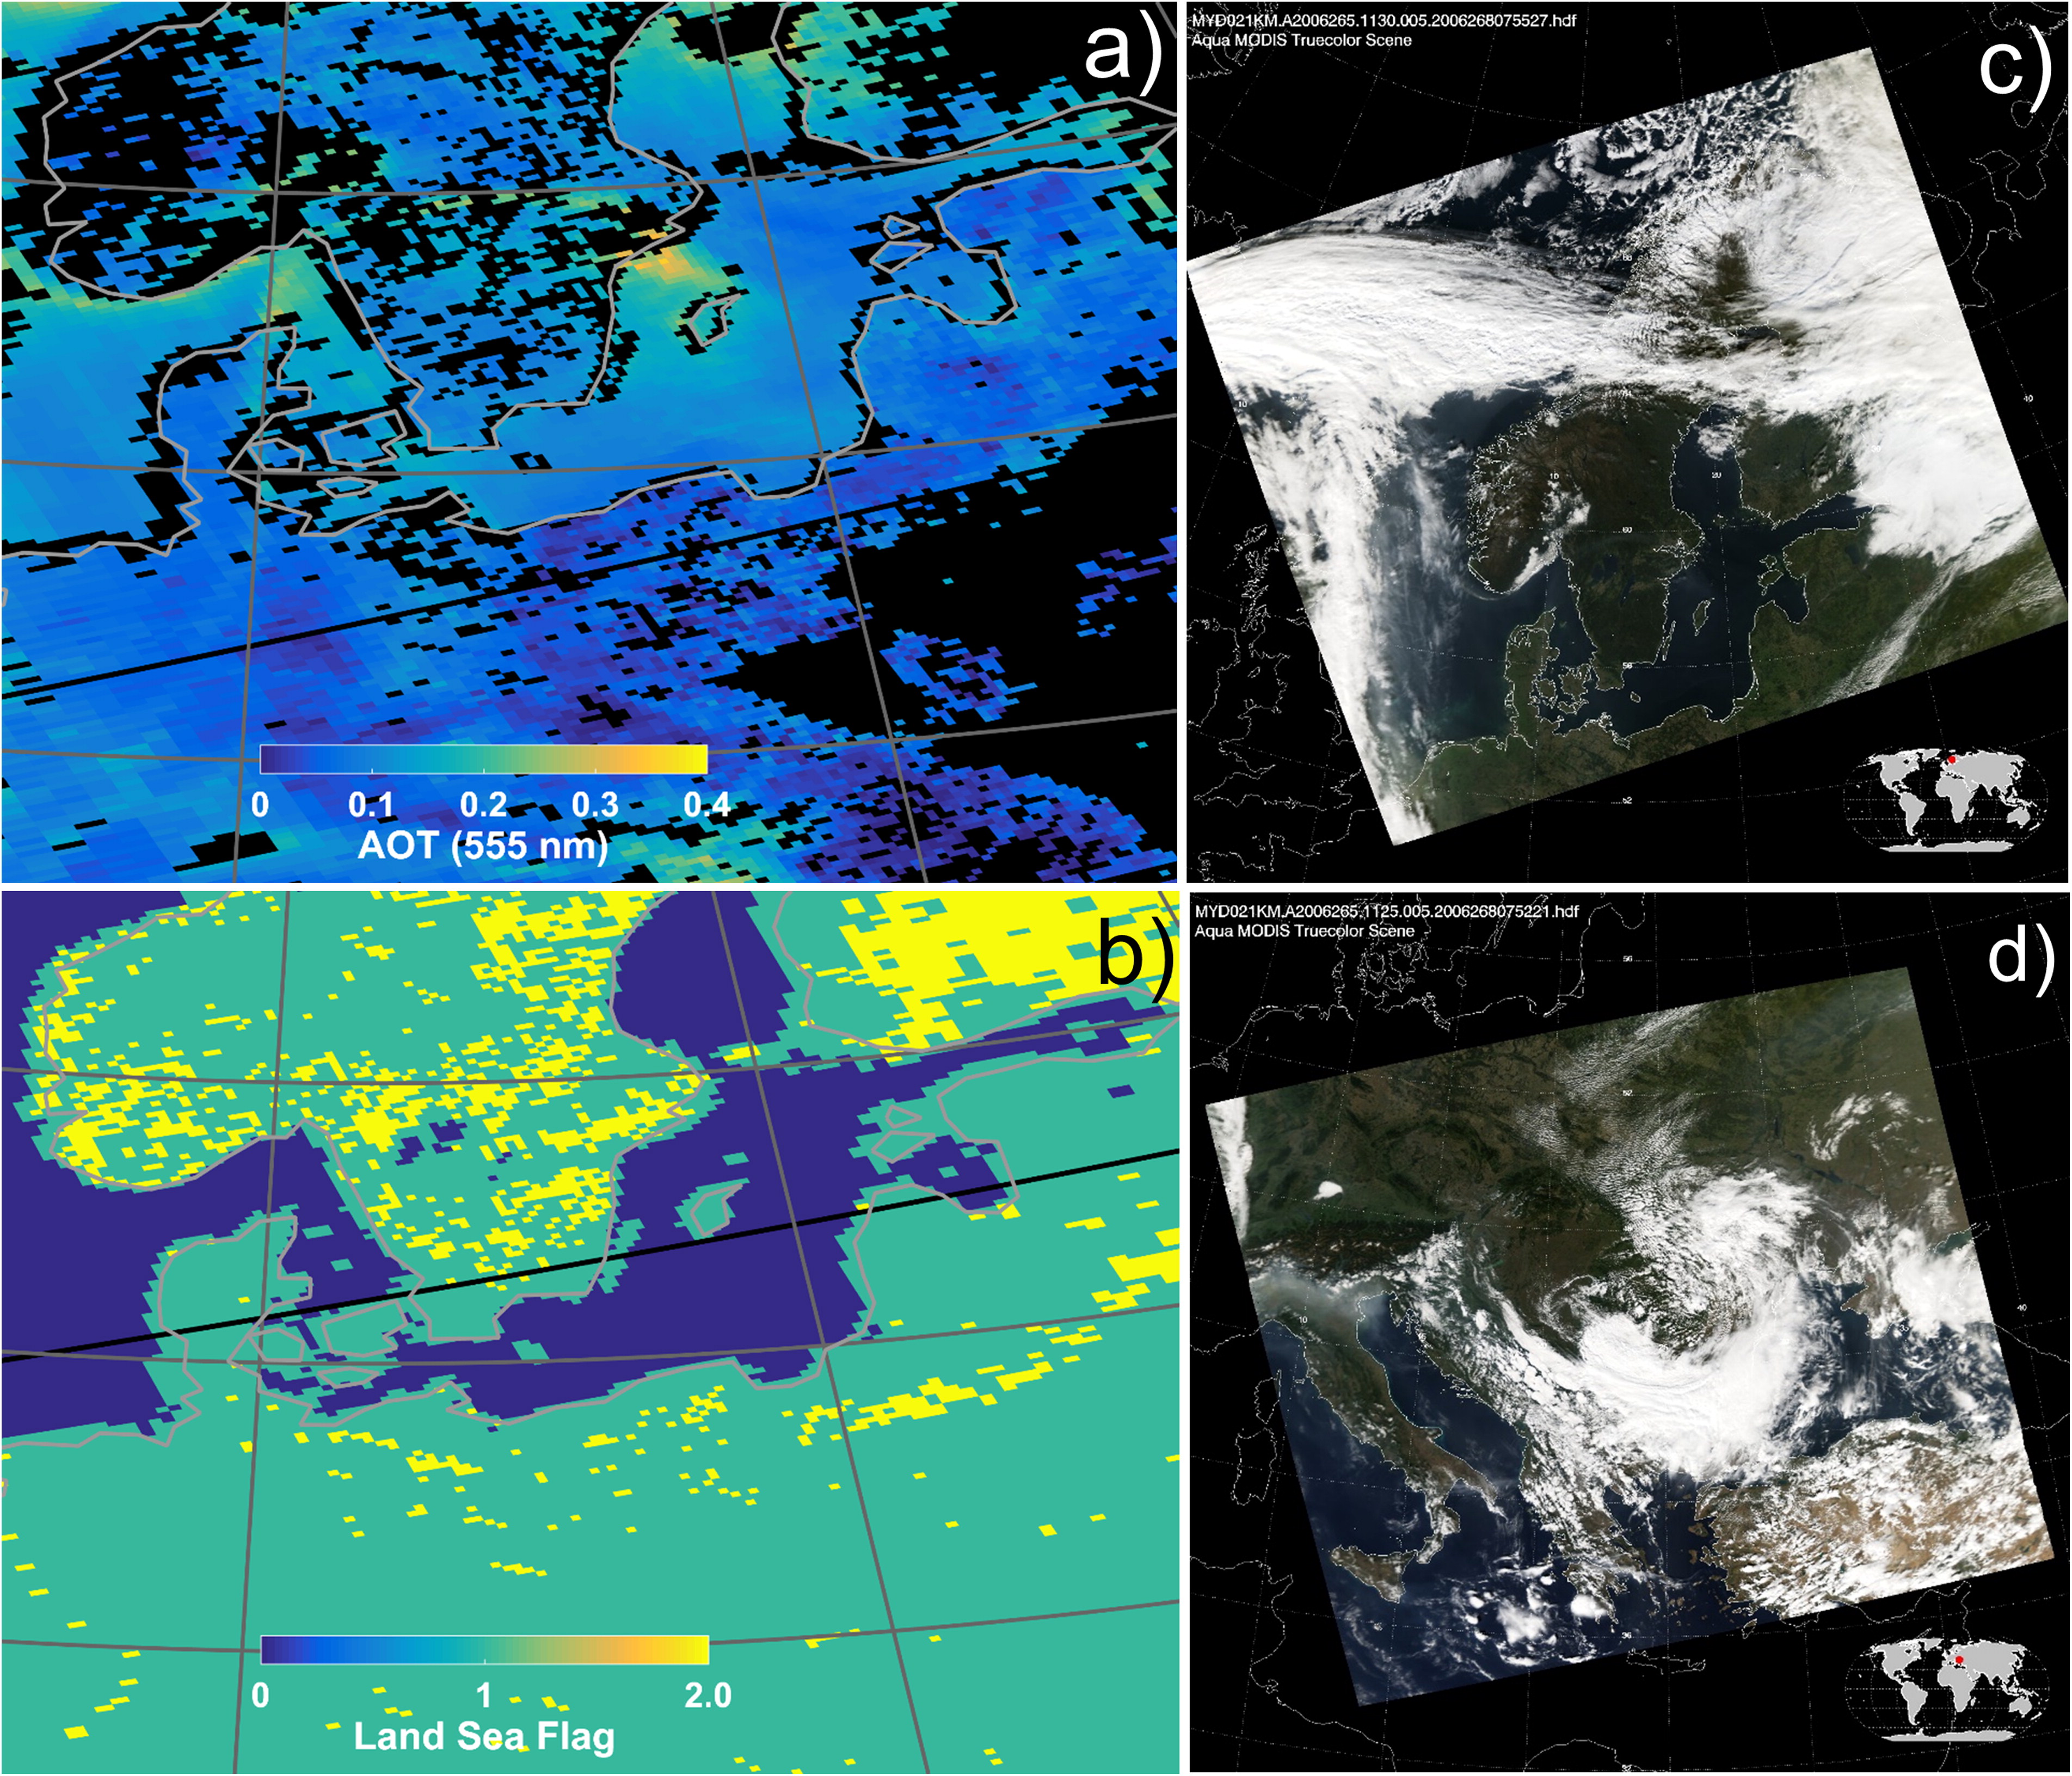
Fig. 9.
(a) Two granules with AOT (550 nm) at 10-km resolution, retrieved from MODIS c061 Aqua observations at 11:25 and 11:30 UTC on 22 September 2006. (b) Land sea flag (based on MOD03 c061 land sea mask), where 0 = ocean, 1 = land and 2 = coastal (coastal, Ephemeral and shallow inland water). (c and d) MODIS visible composite picture corresponding to 11:30 and 11:25 UTC, respectively, on 22 September 2006. Note that the scenes in (a) and (b) cover the Northern Europe, while a larger part of Europe is covered by the pictures combined in (c) and (d). The scenes in (a) and (b) cover the same area as the one shown in Fig. 1.
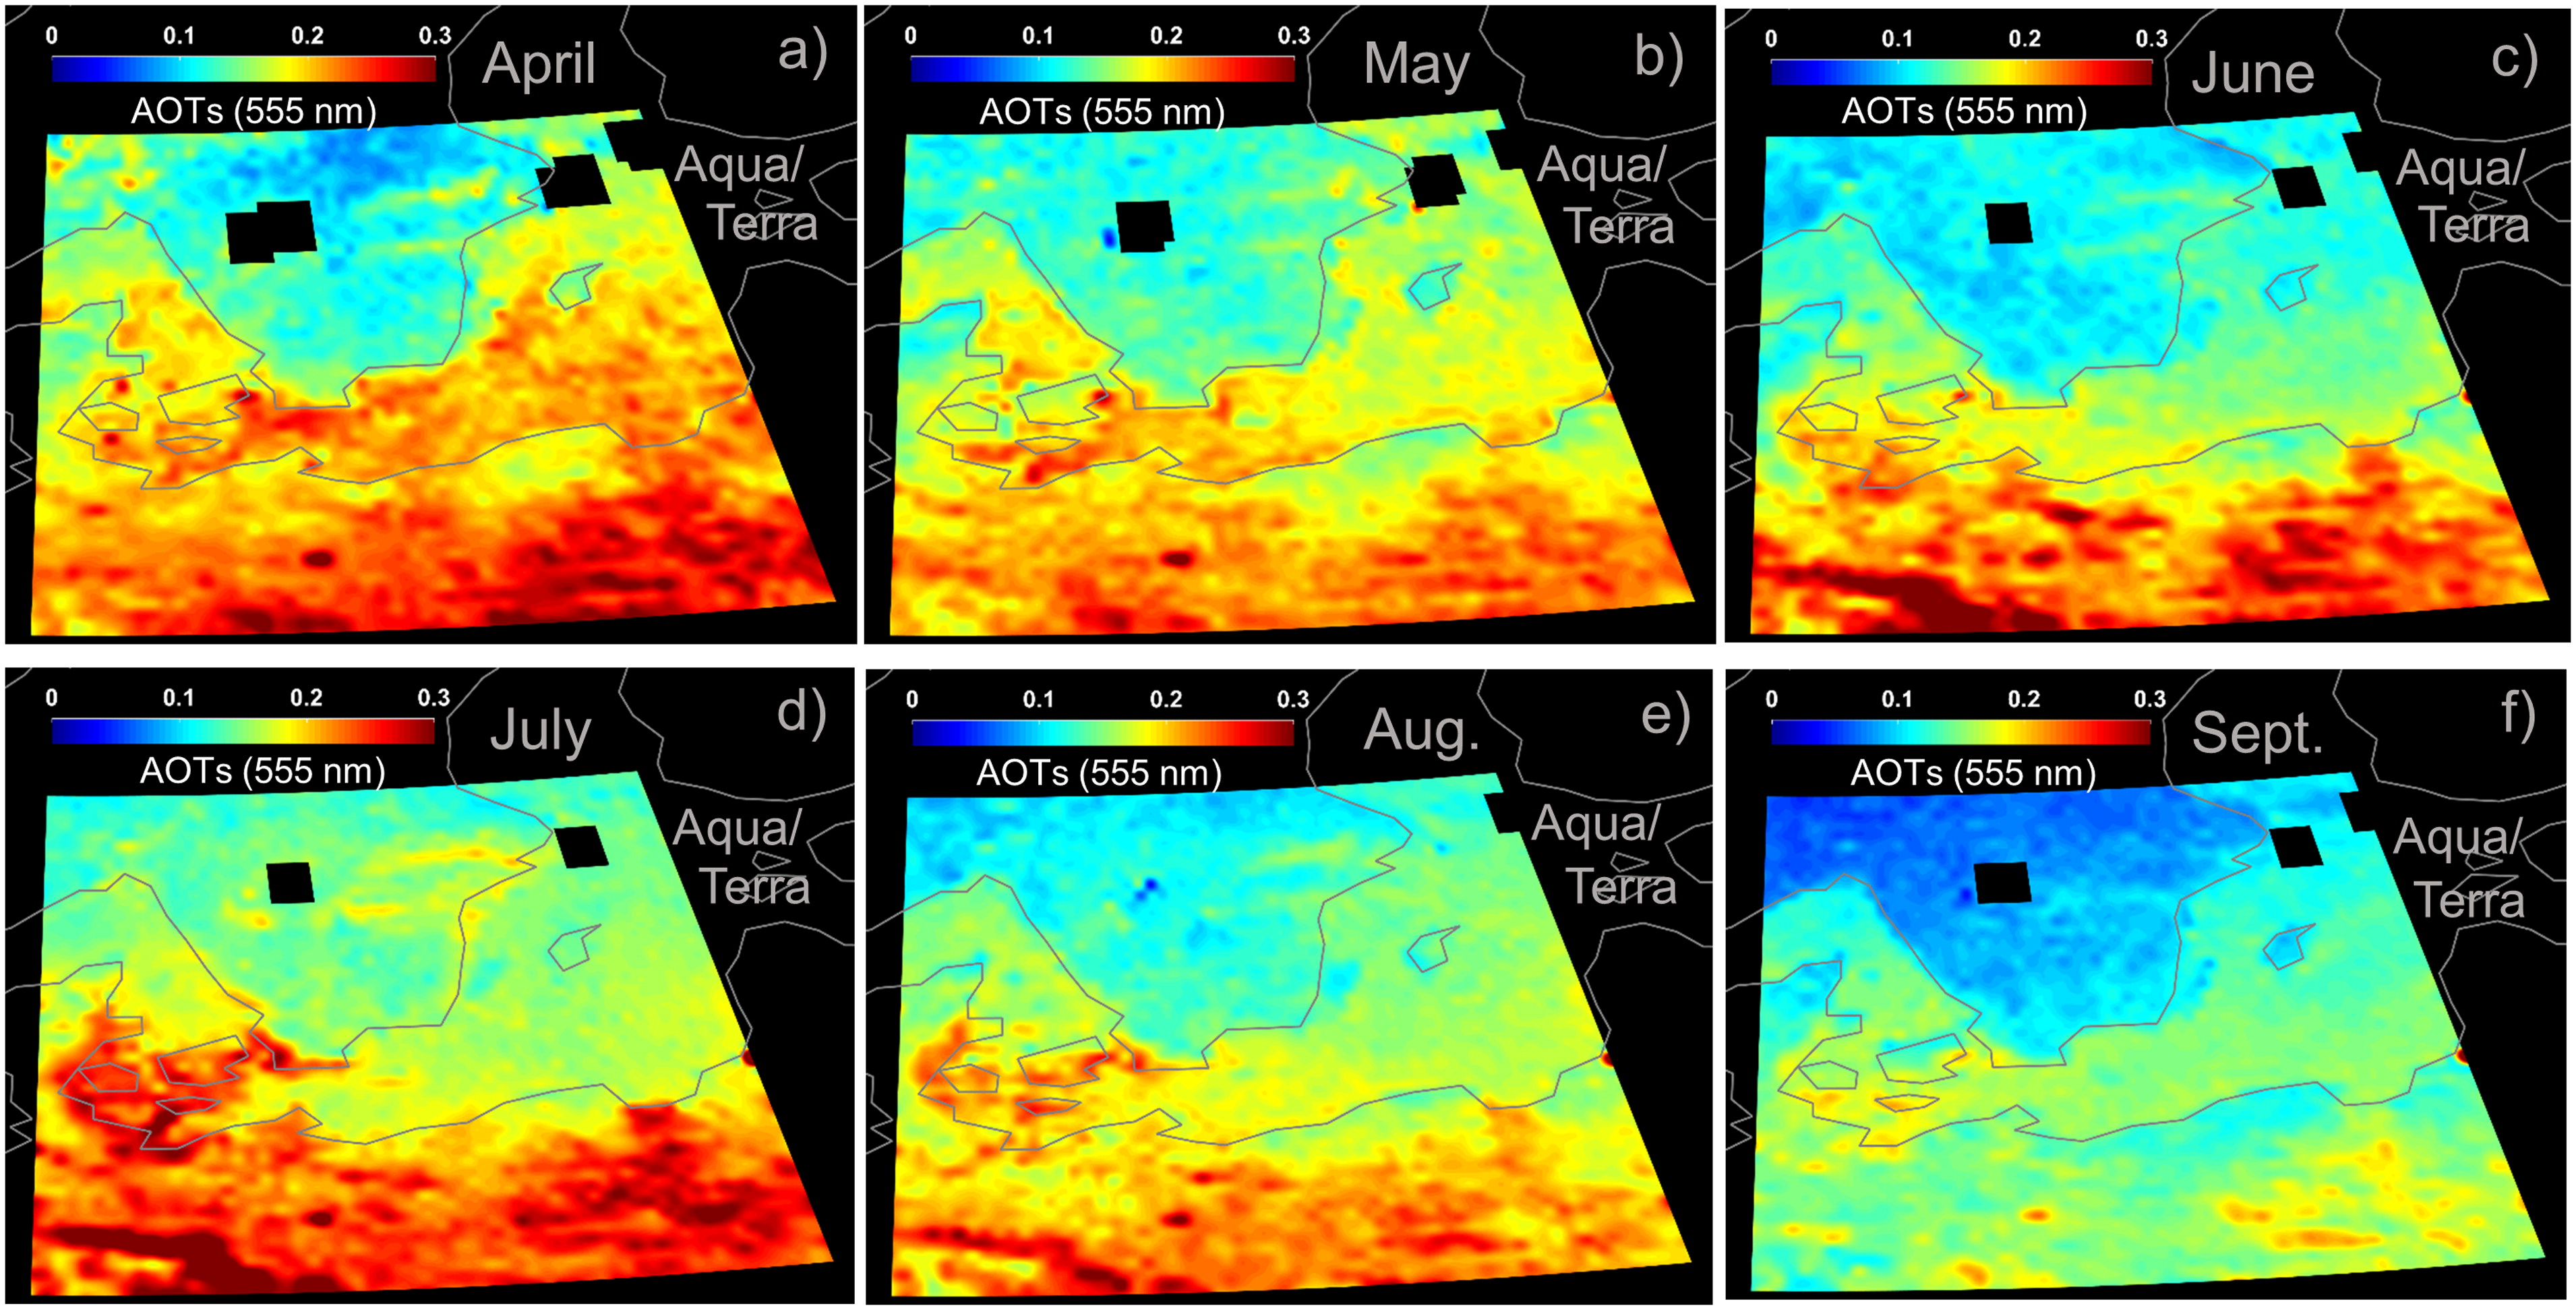
Fig. 10.
Fields of monthly mean AOTs, obtained for MODIS c051 Aqua and Terra combined with respect to the period 2003 – 2015, for (a) April, (b) May, (c) June, (d) July, (e) August and (f) September. The fields belong to the main investigation area. Note that lacking of AOT data, denoted with black, occurs for the largest inland lake in Sweden, Vättern and Stockholm archipelago (upper right in the figure).
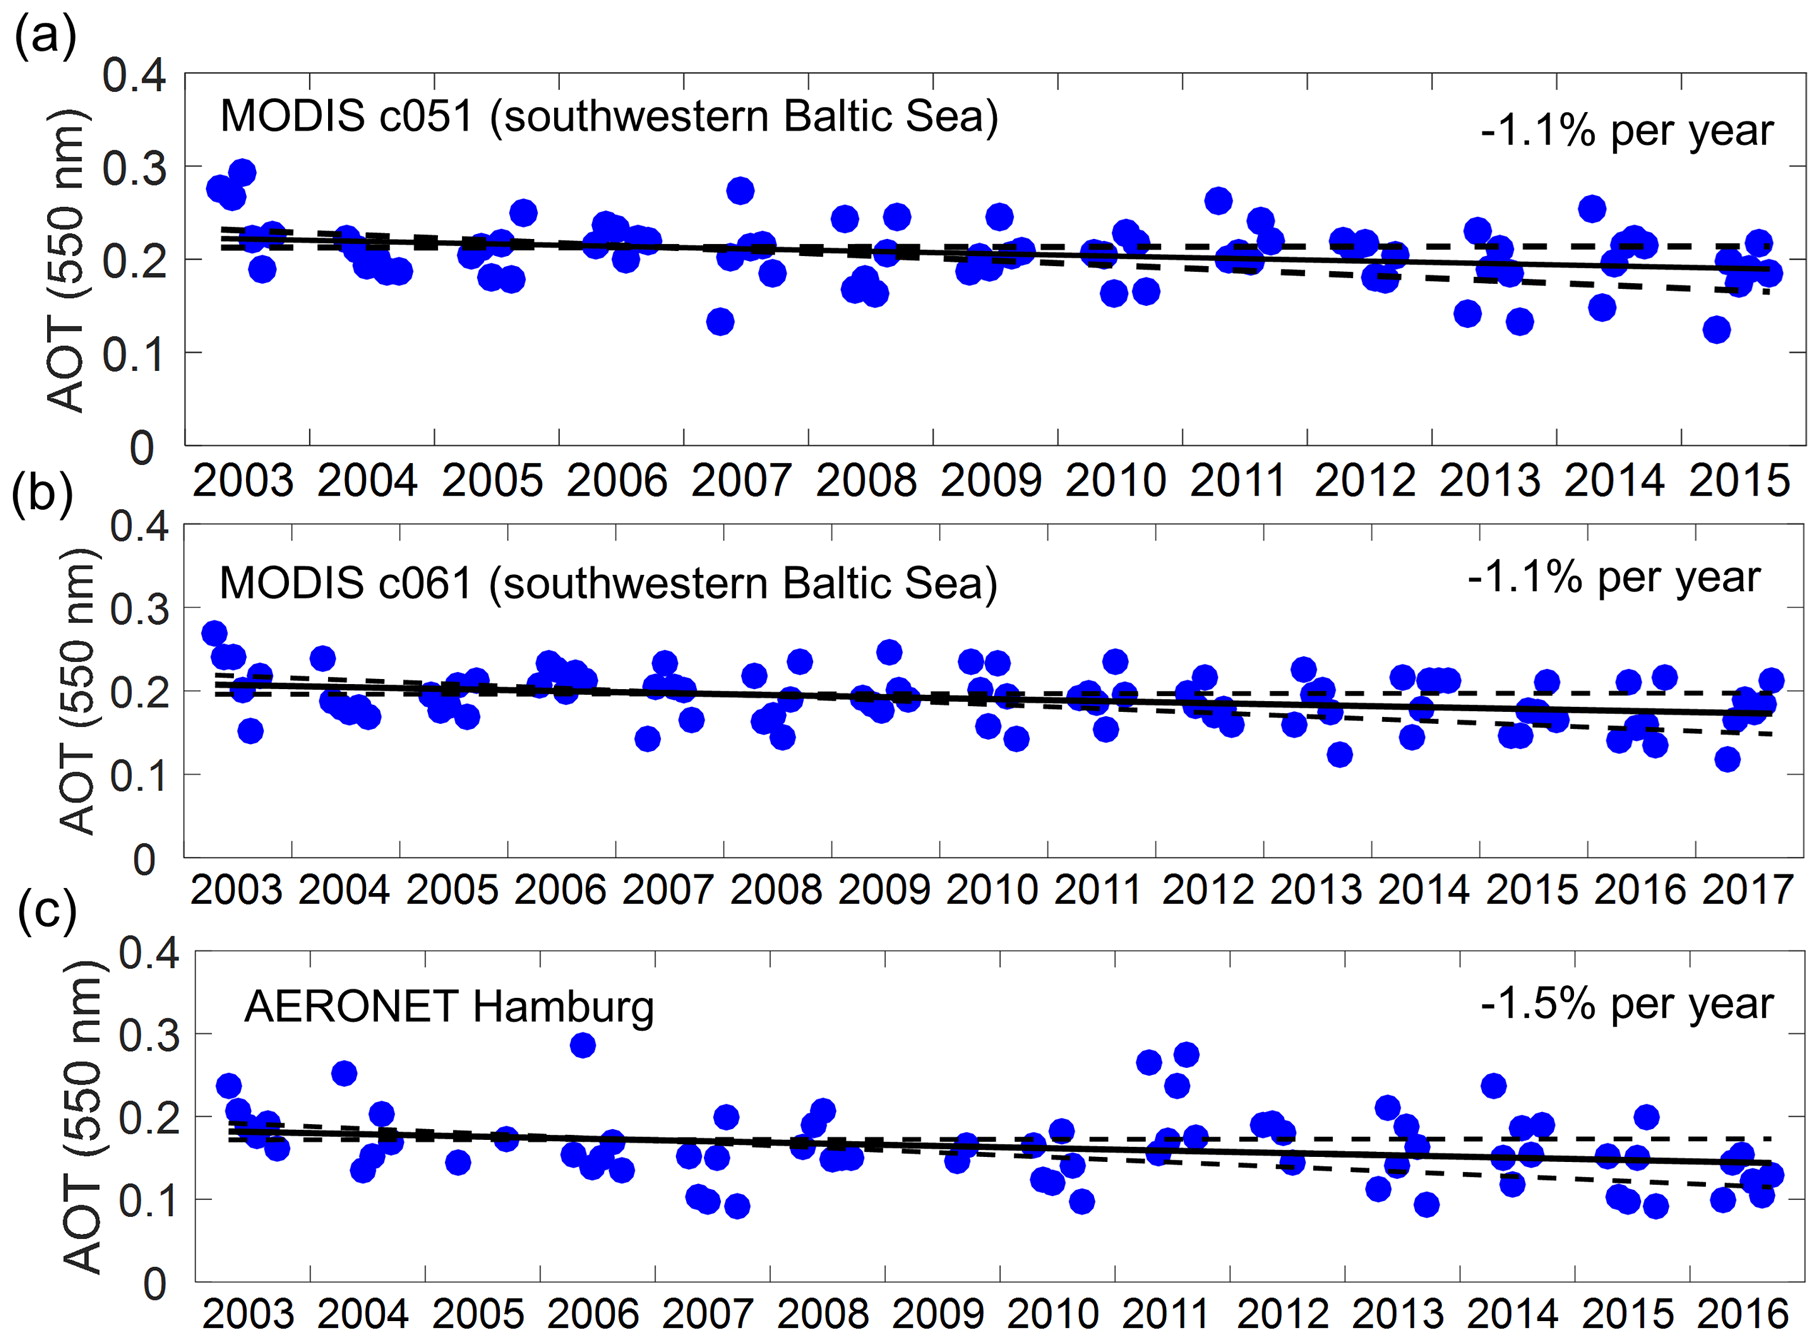
Fig. 11.
Time series of monthly median AOT (blue circles) for (a) MODIS c051 and (b) MODIS c061 over the swBS, as well as for (c) AERONET site in Hamburg. Trend values in percent per year have been obtained from the slopes of the black solid lines. The dashed lines denote the 95% confidence interval for the slope. More statistic results are present in Tables 2 and 3.

Fig. 12.
Same as Fig. 11, but for MODIS derived AOTs over cP and the AERONET site in Belsk.
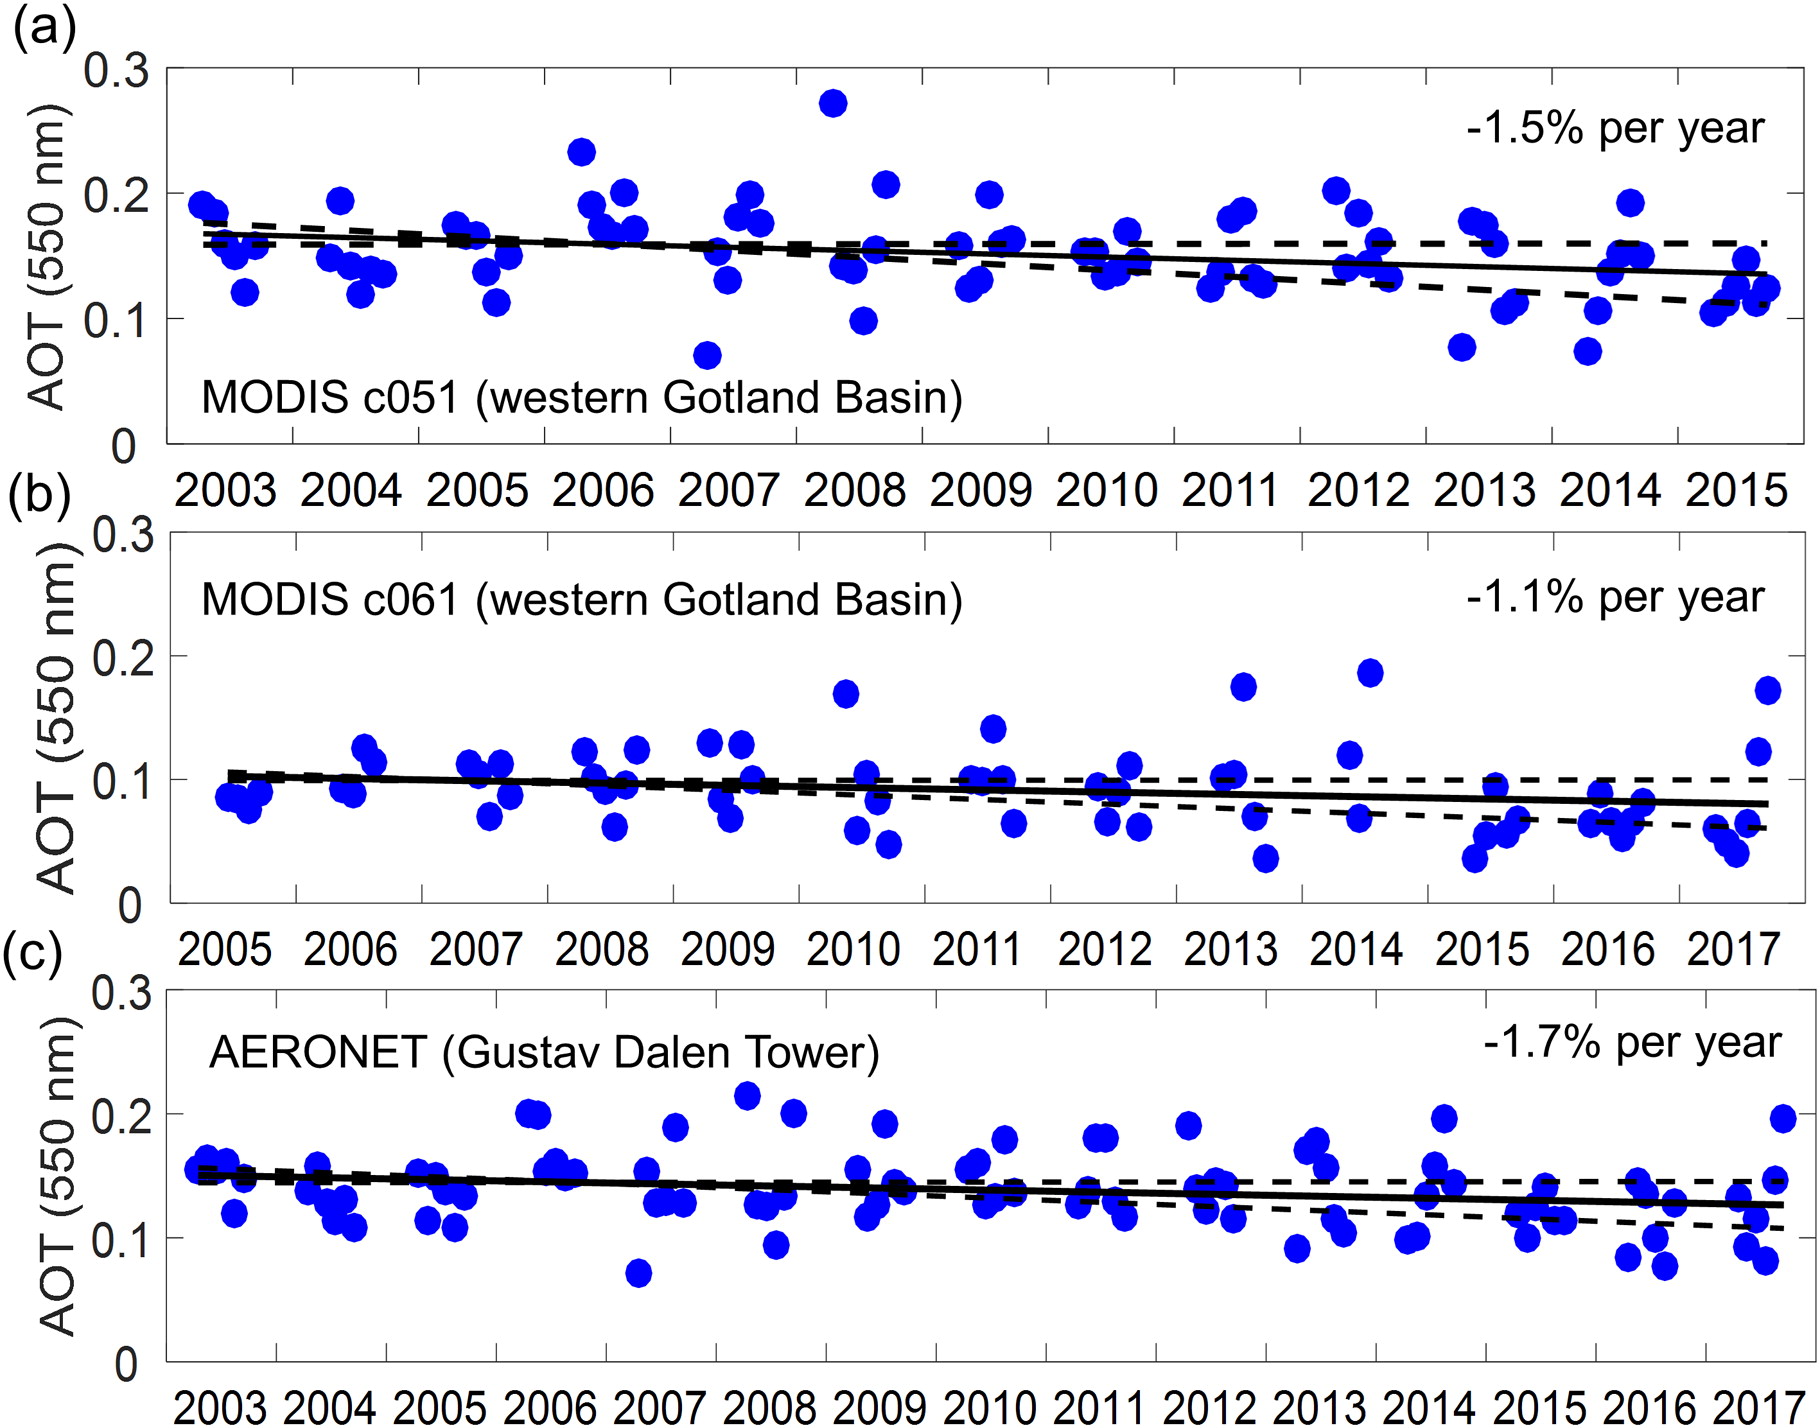
Fig. 13.
Same as Fig. 11, but for MODIS derived AOTs over wGB and the AERONET GDT site.
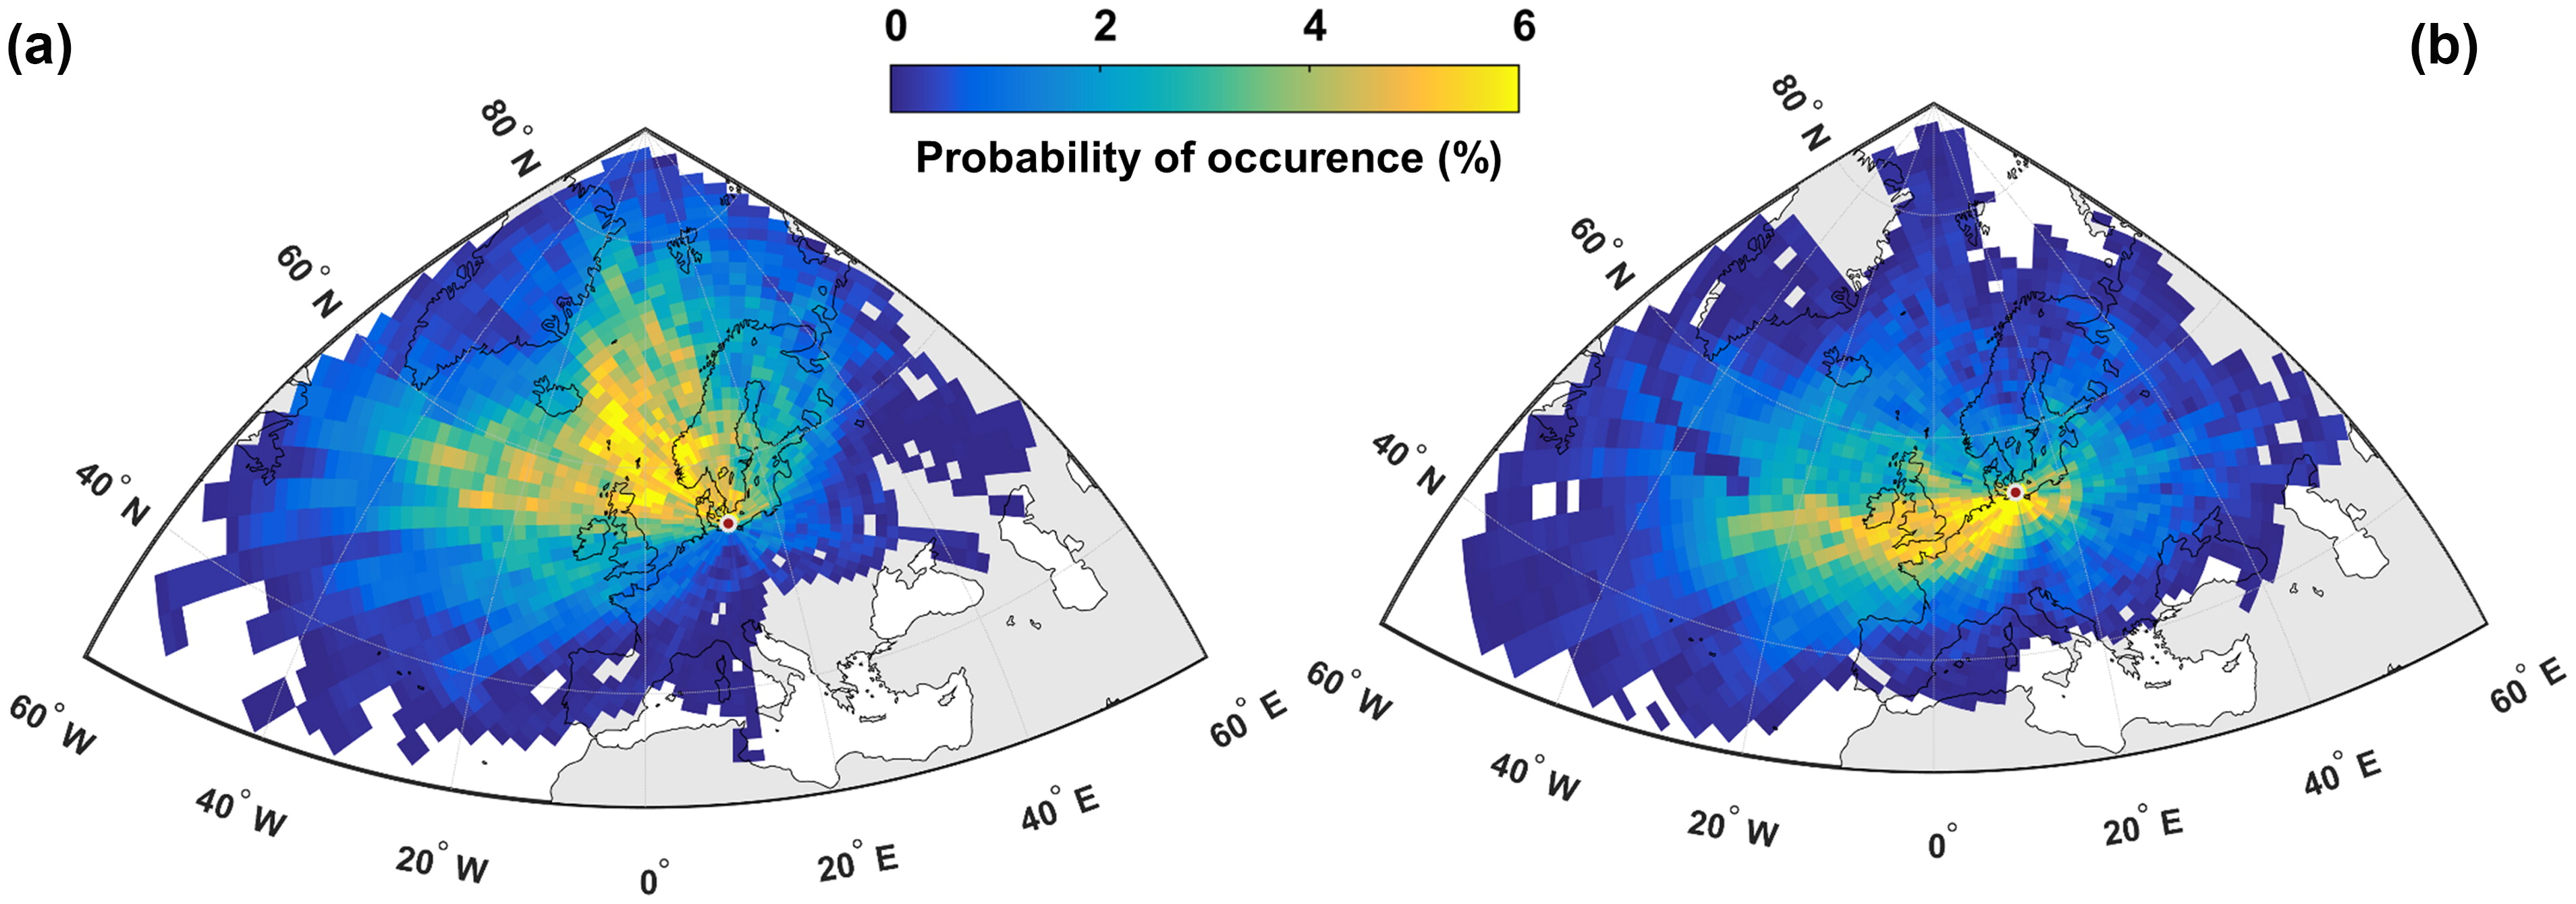
Fig. 14.
Probability of occurrence derived from Hysplit 5-days back-trajectories for the swBS region in combination with MODIS c061 daily AOT for April to September of the period 2003–2015. Panels (a) and (b) encompass only the trajectories with MODIS AOTs lower and higher than the 25th and 75th quartiles, respectively. The coordinates of the end points of the trajectories are presented in Table 1.
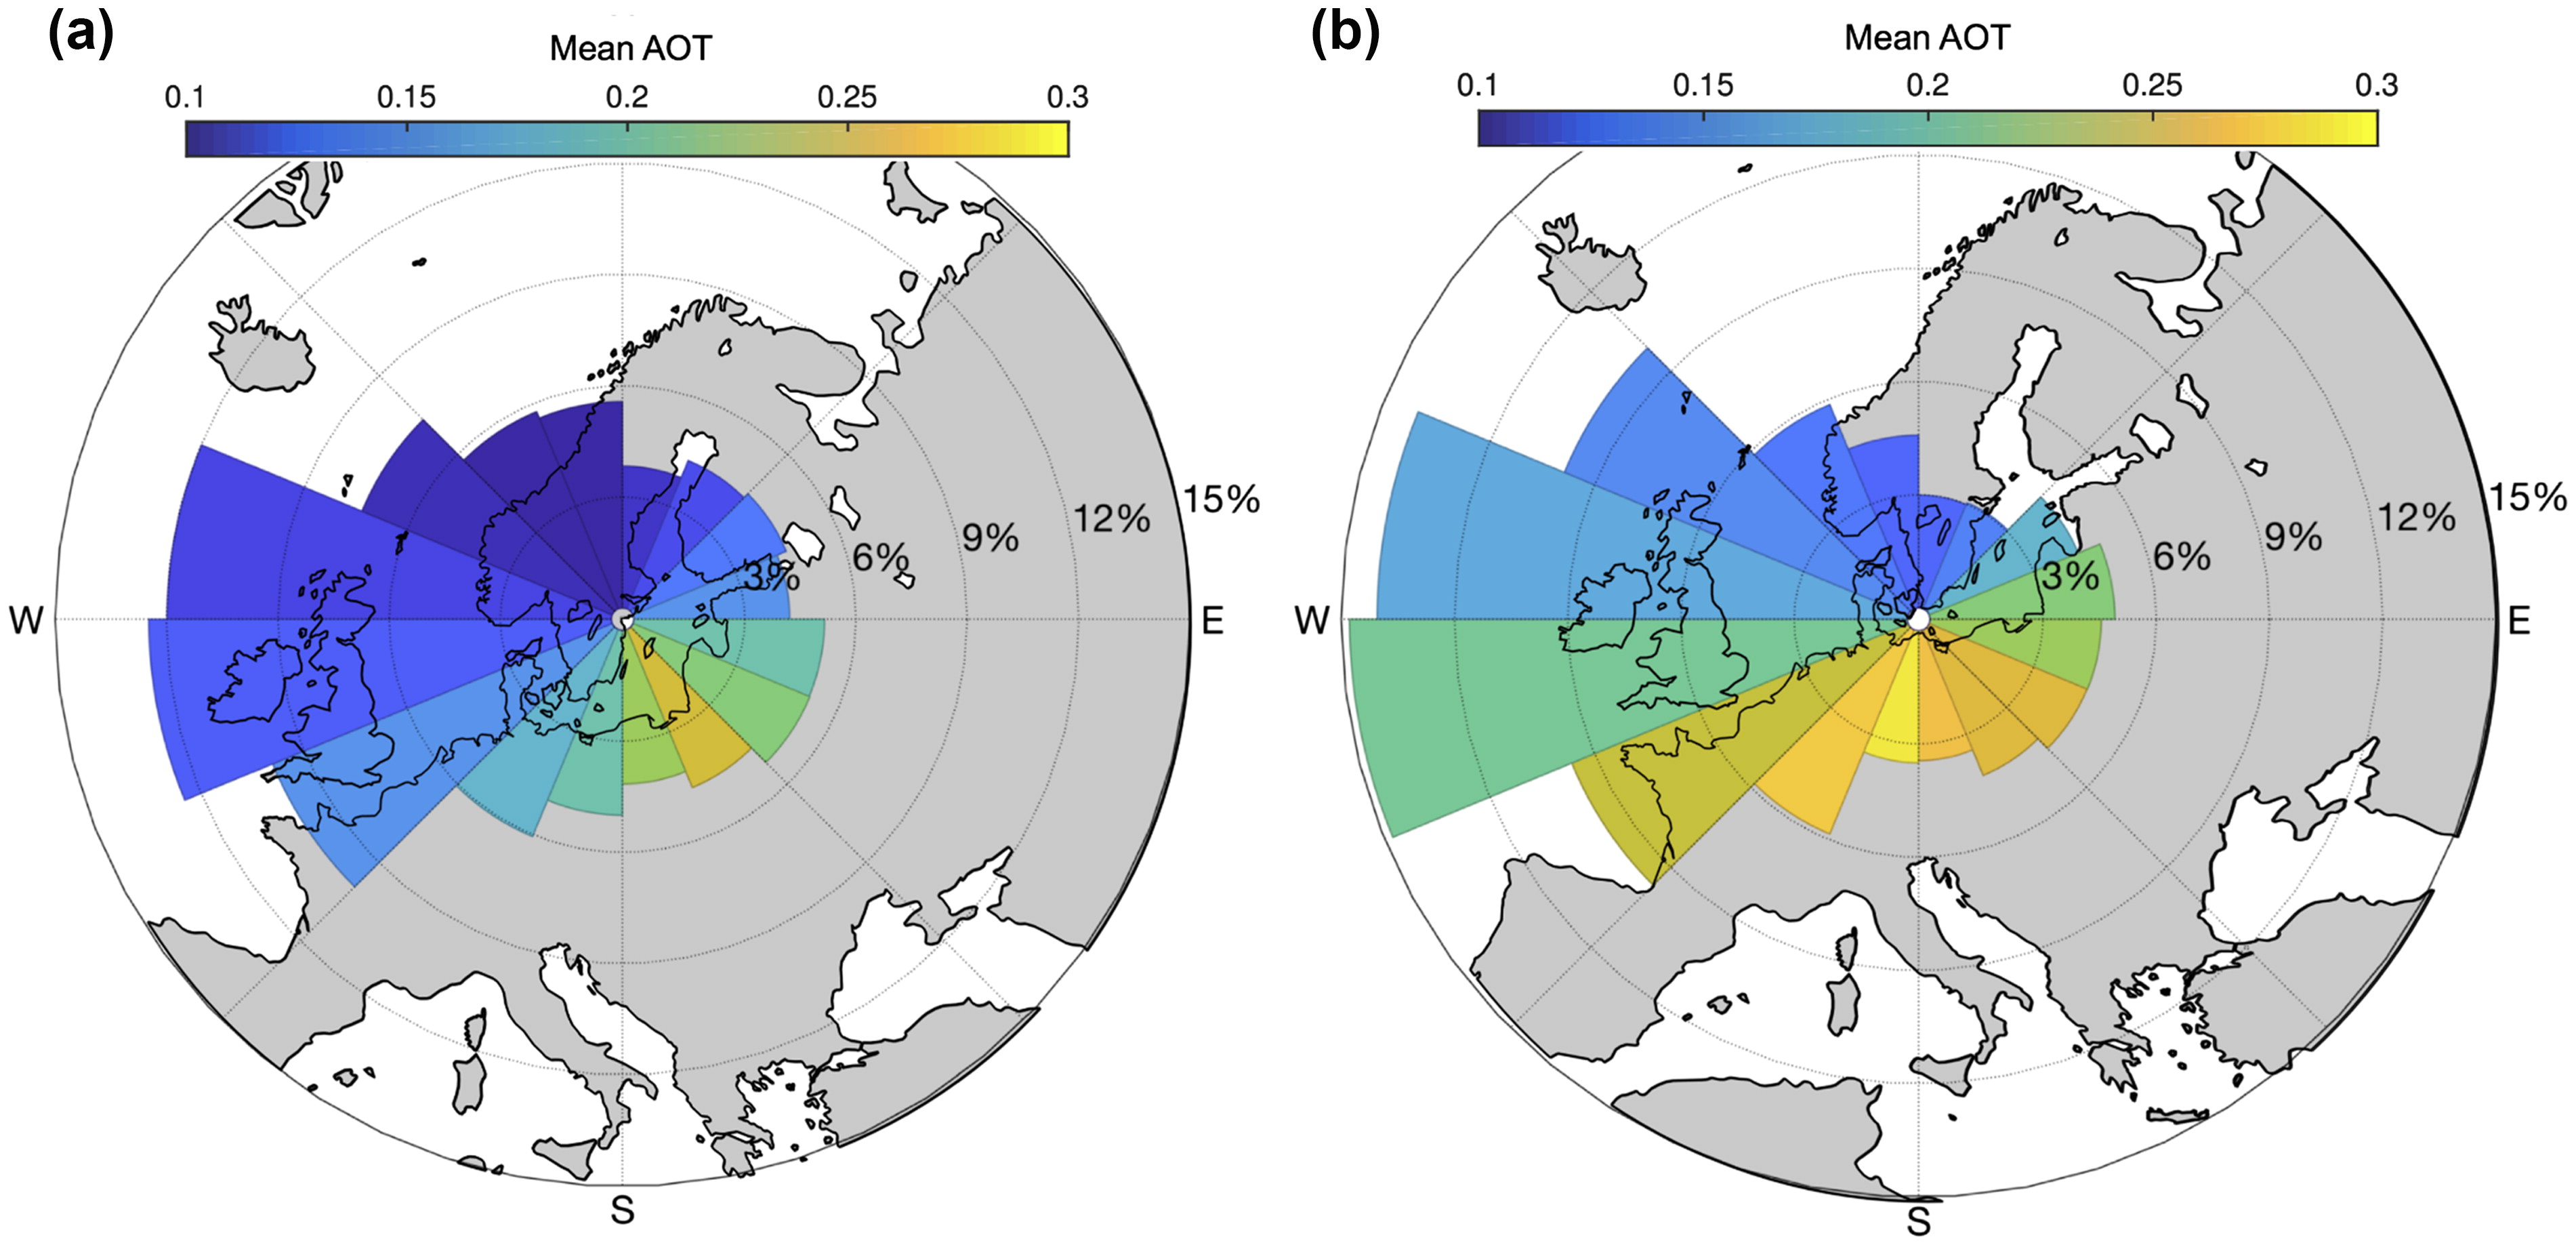
Fig. 15.
Relation between sector of air mass origin and MODIS c061 AOT for (a) wGB (b) swBS. The colour shades indicate the mean AOT for each sector, and the sector lengths indicates the contribution to the total AOT during the investigation period.