
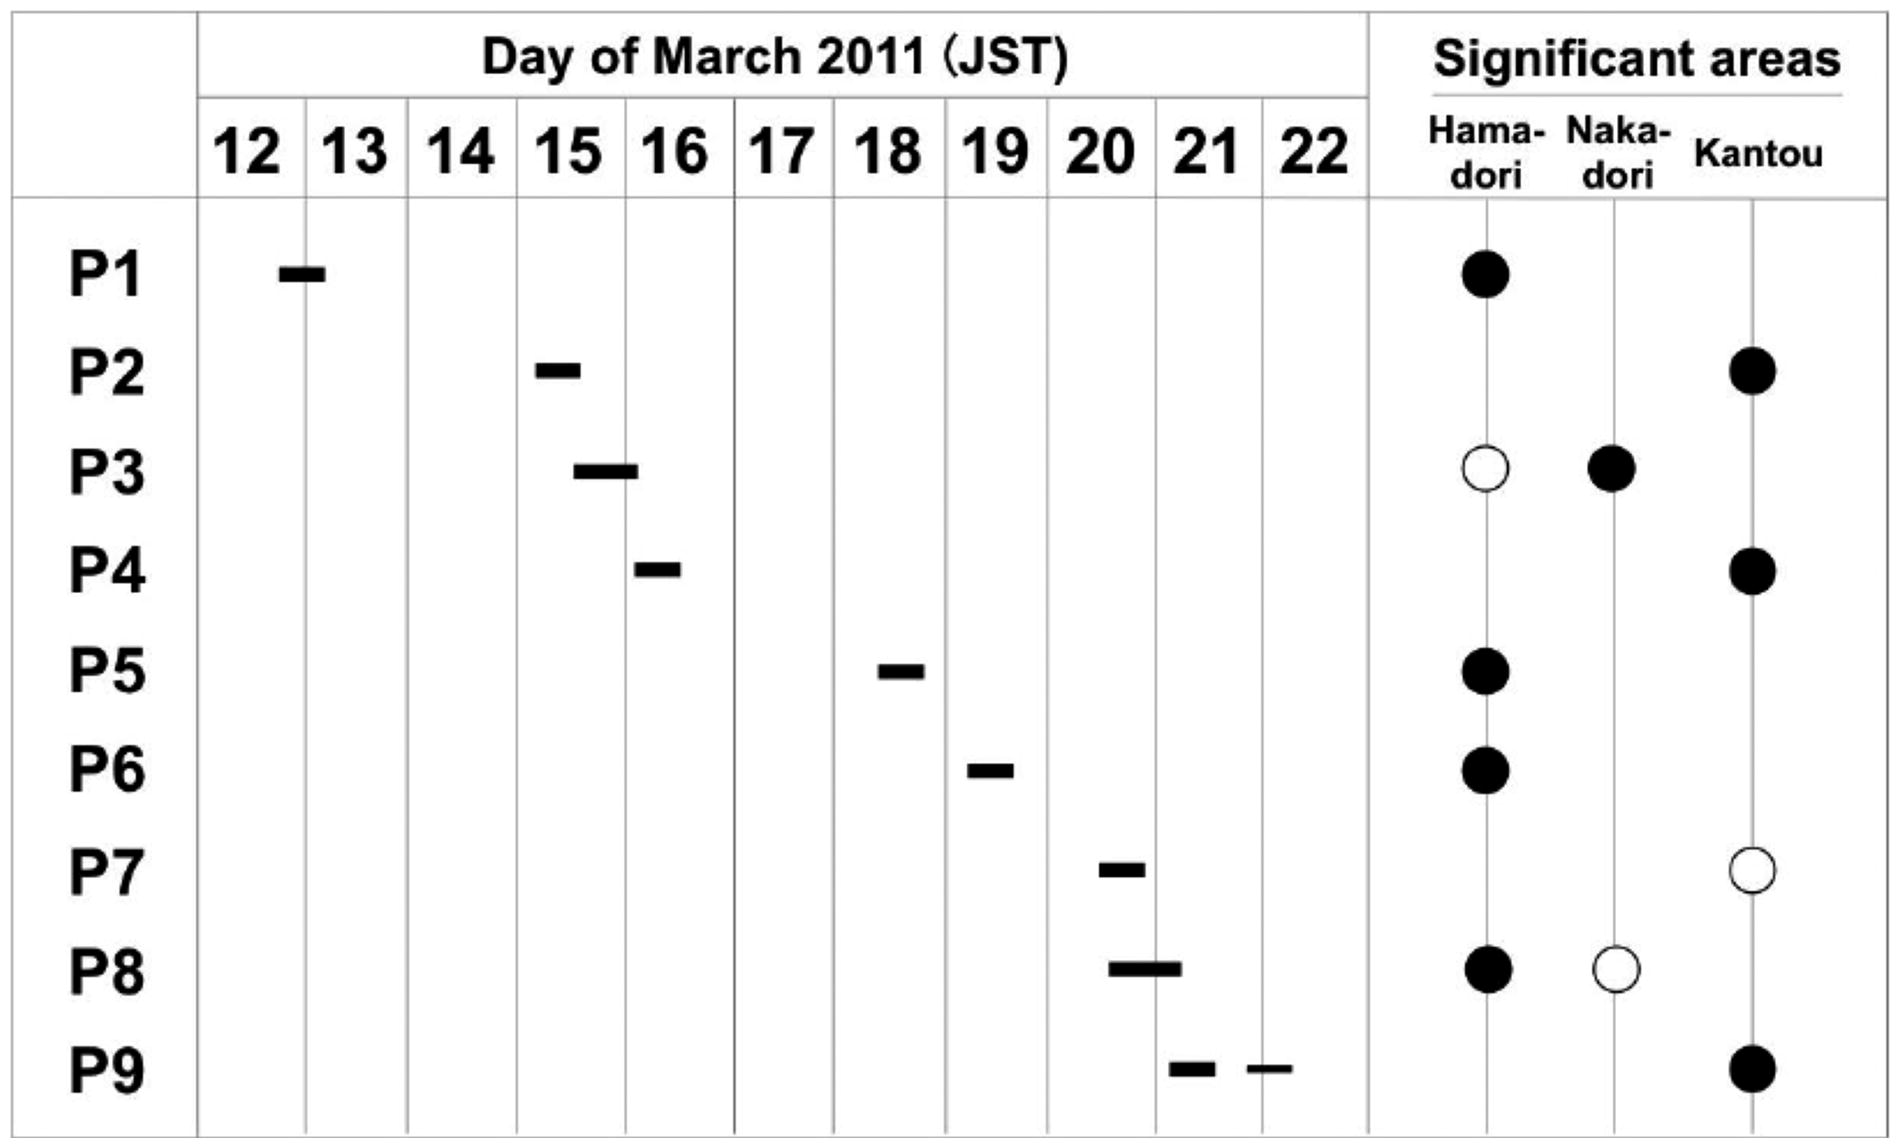
Fig. 1.
Fukushima 137C plumes identified by Tsuruta et al. (2014). Horizontal bars show periods with 137Cs concentrations greater than 10 Bq m−3. Closed (open) circles indicate areas where the highest concentrations were larger (smaller) than 100 Bq m−3. This figure was reprinted from fig. 3 in Nakajima et al. (2017).
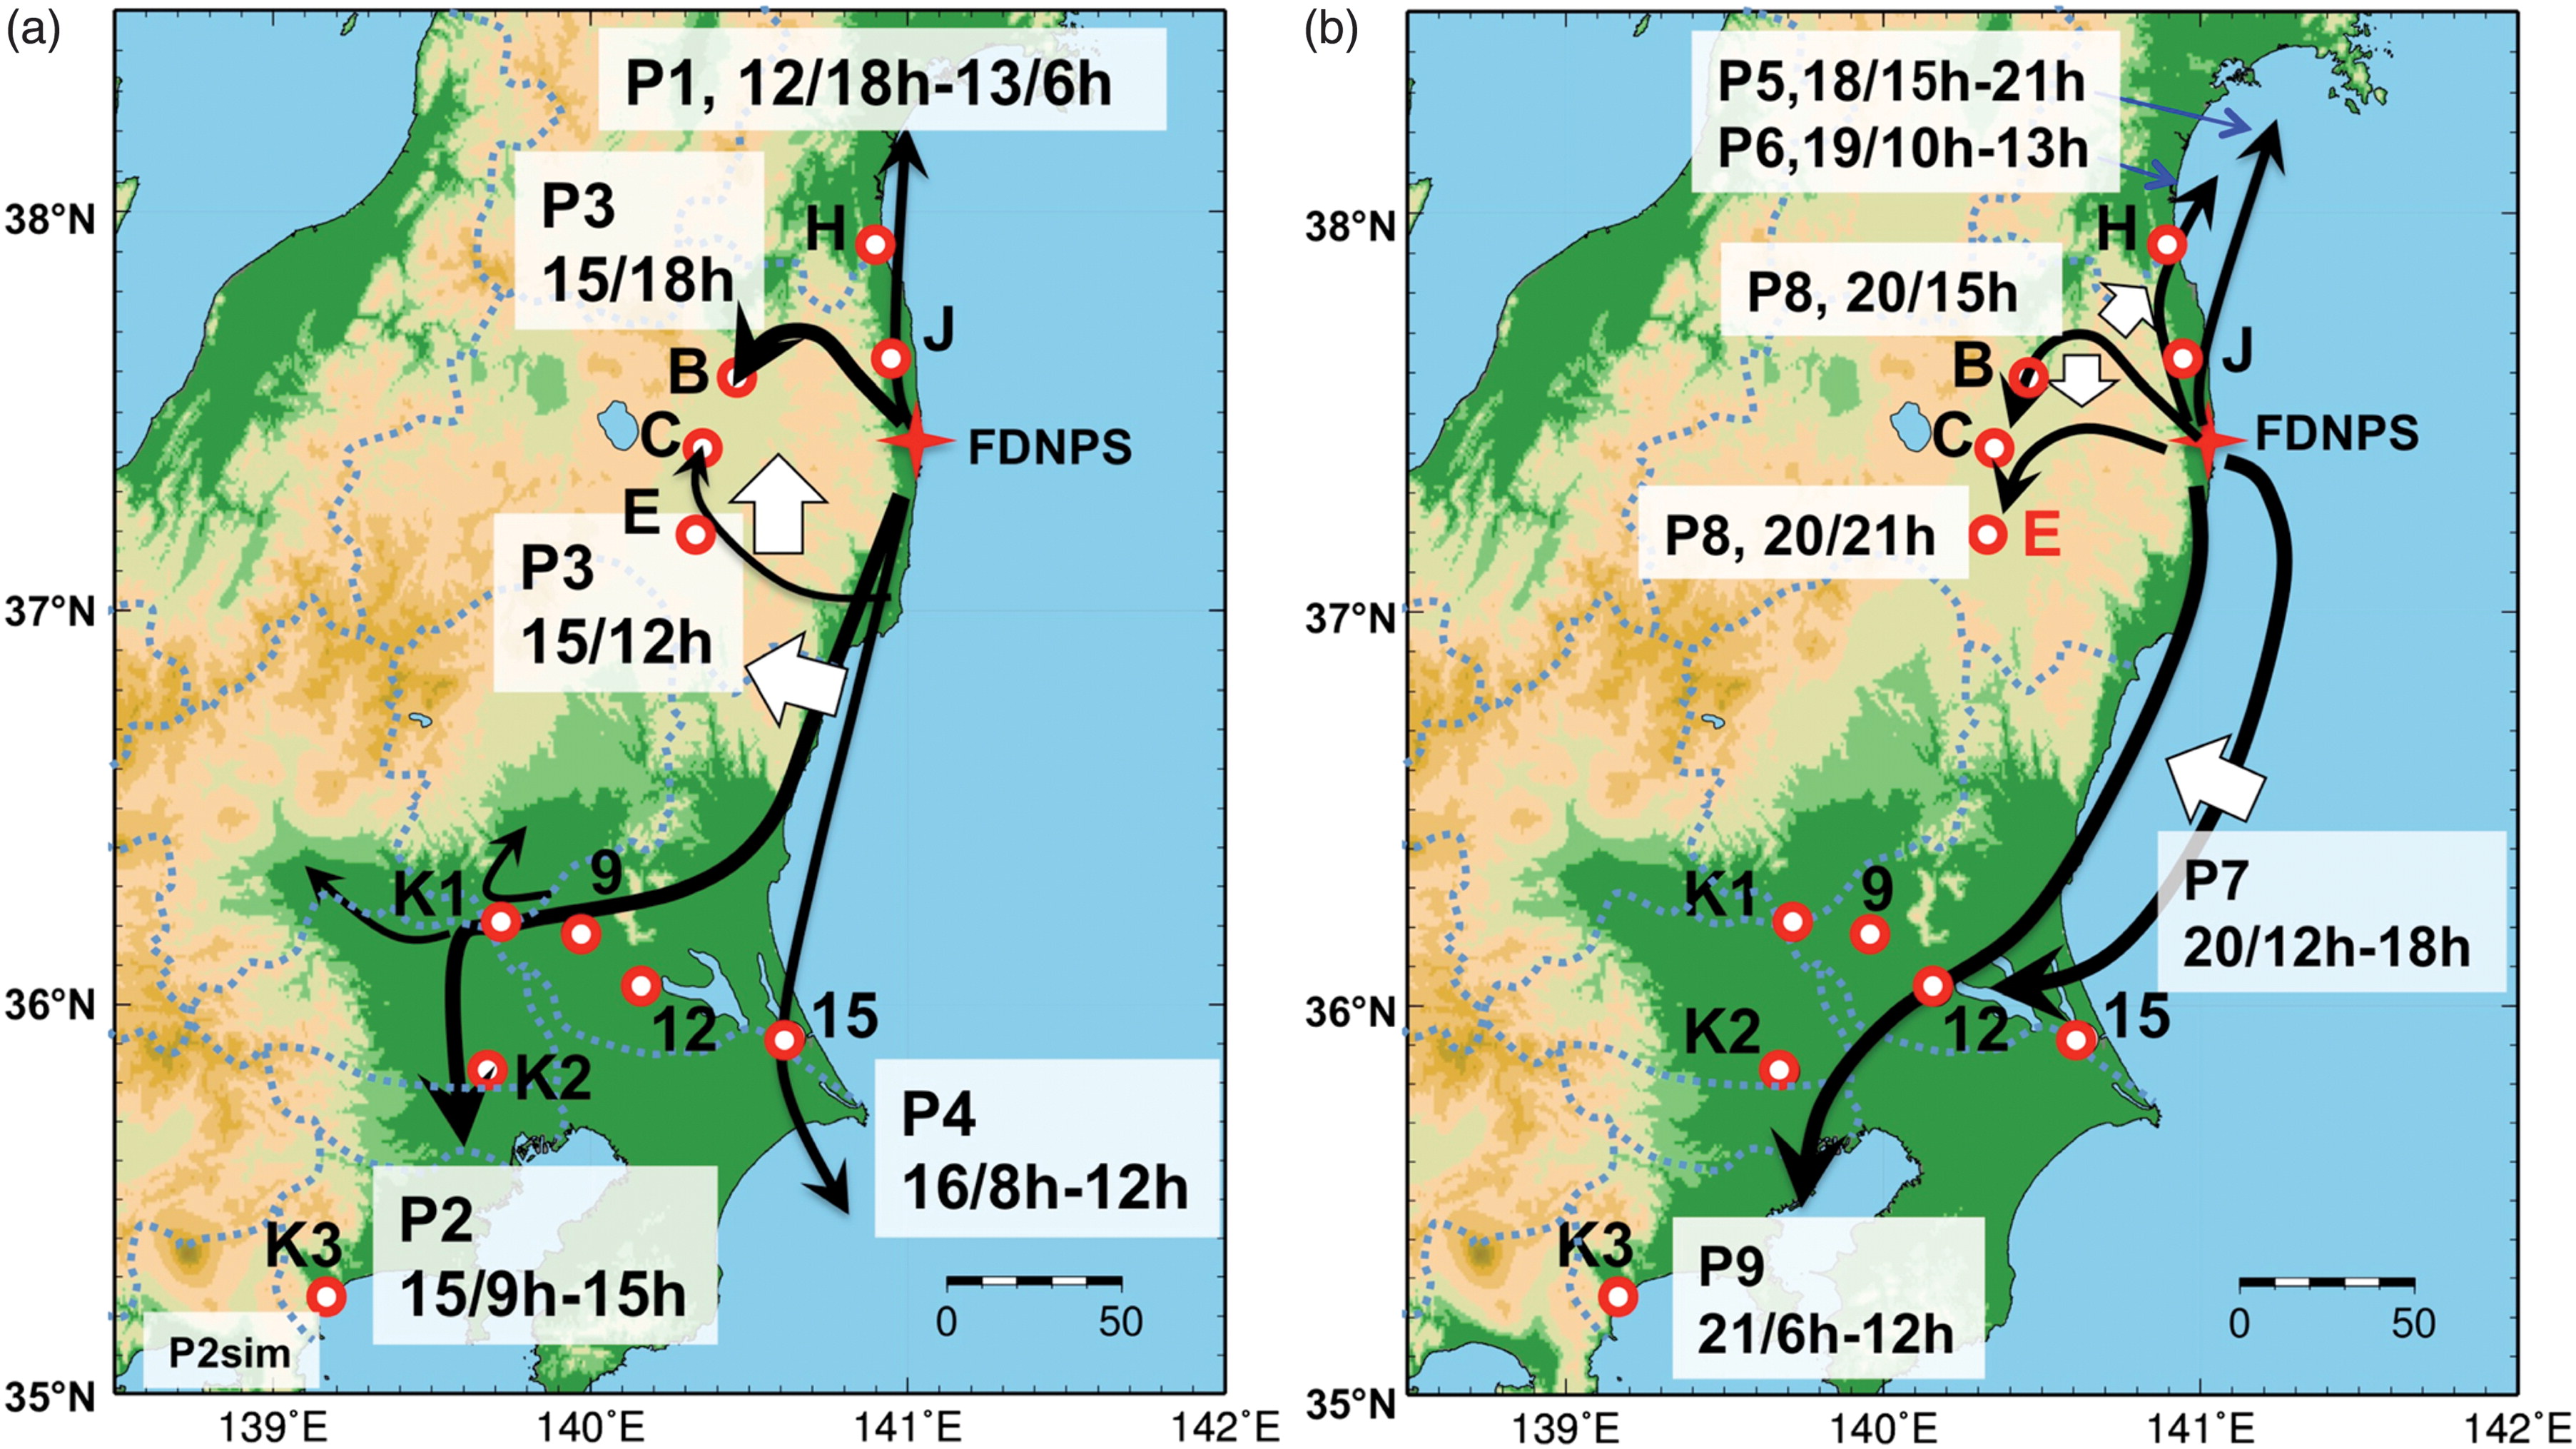
Fig. 2.
Schematic diagrams of the transport routes analyzed in Nakajima et al. (2017) for plumes P1–P9 isolated in Tsuruta et al. (2014). Black arrows indicate the general movement trend for each plume. This figure is reprinted from fig. 15 in Nakajima et al. (2017). The letters, B, C, E, H, J, K1, K2, K3, 9, 12, and 15, indicate 137Cs sample station locations identified in Nakajima et al. (2017) but these indications are not used in this study.
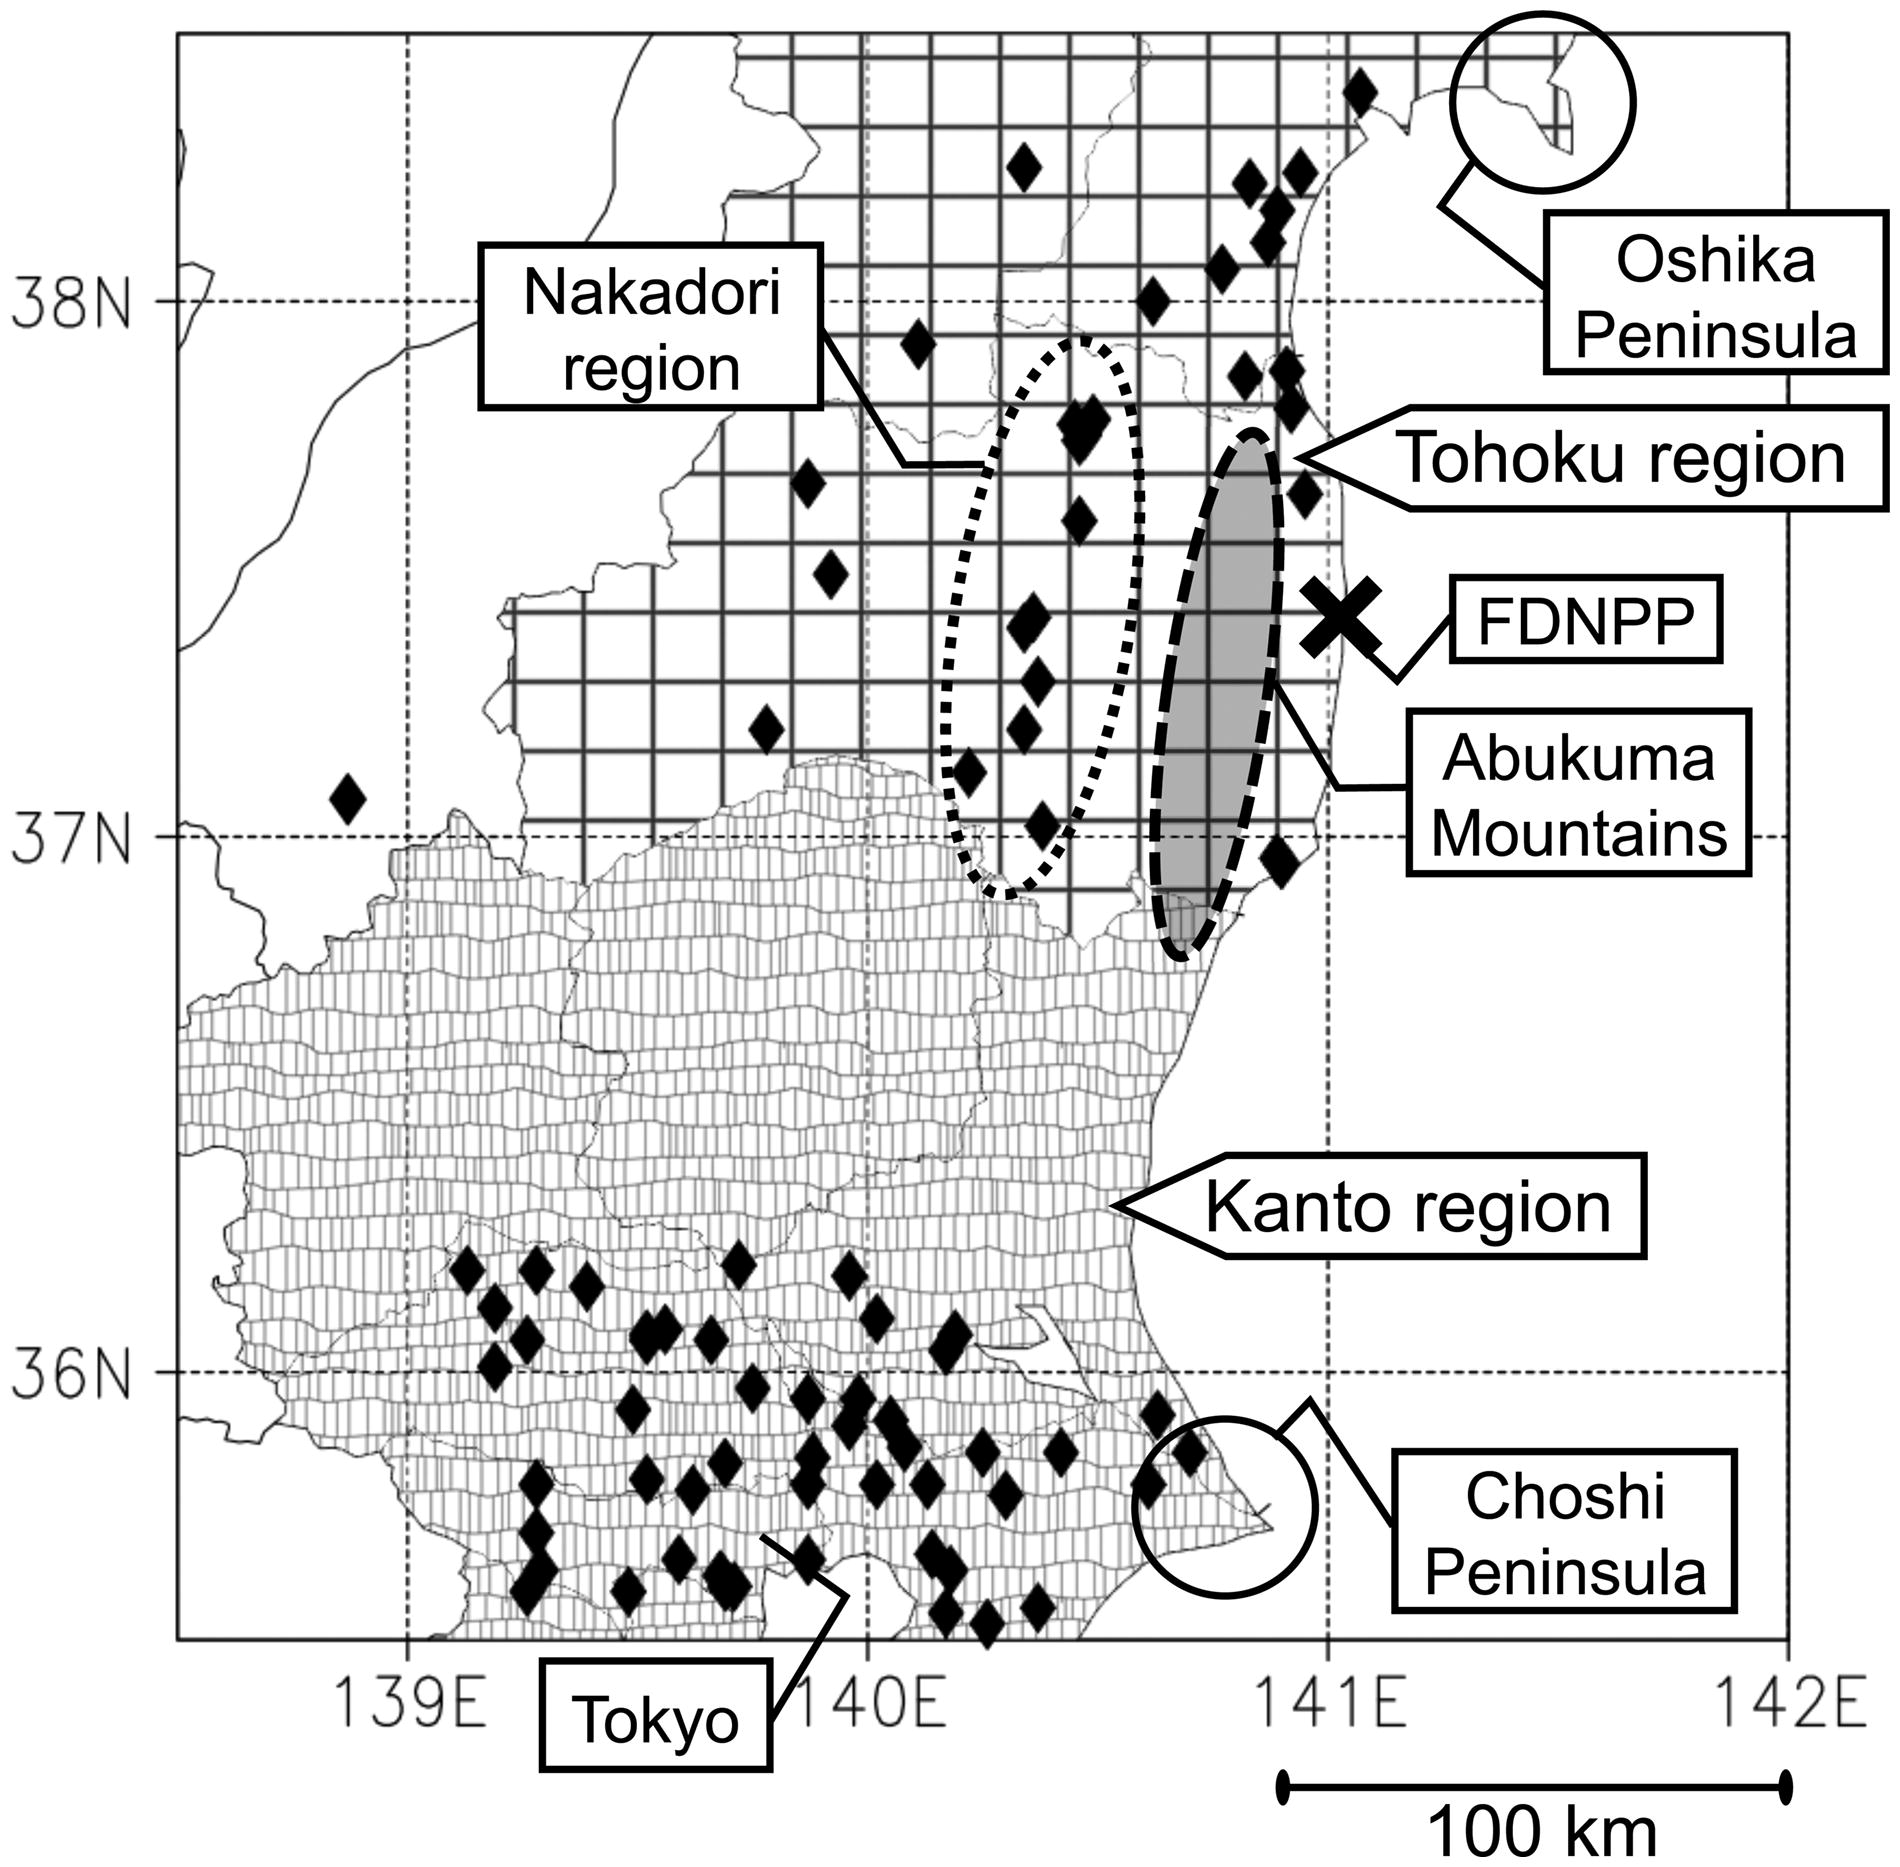
Fig. 3.
Map of the area around the FDNPP. Closed diamonds indicate the 137Cs sample stations in Tsuruta et al. (2014) and Oura et al. (2015).
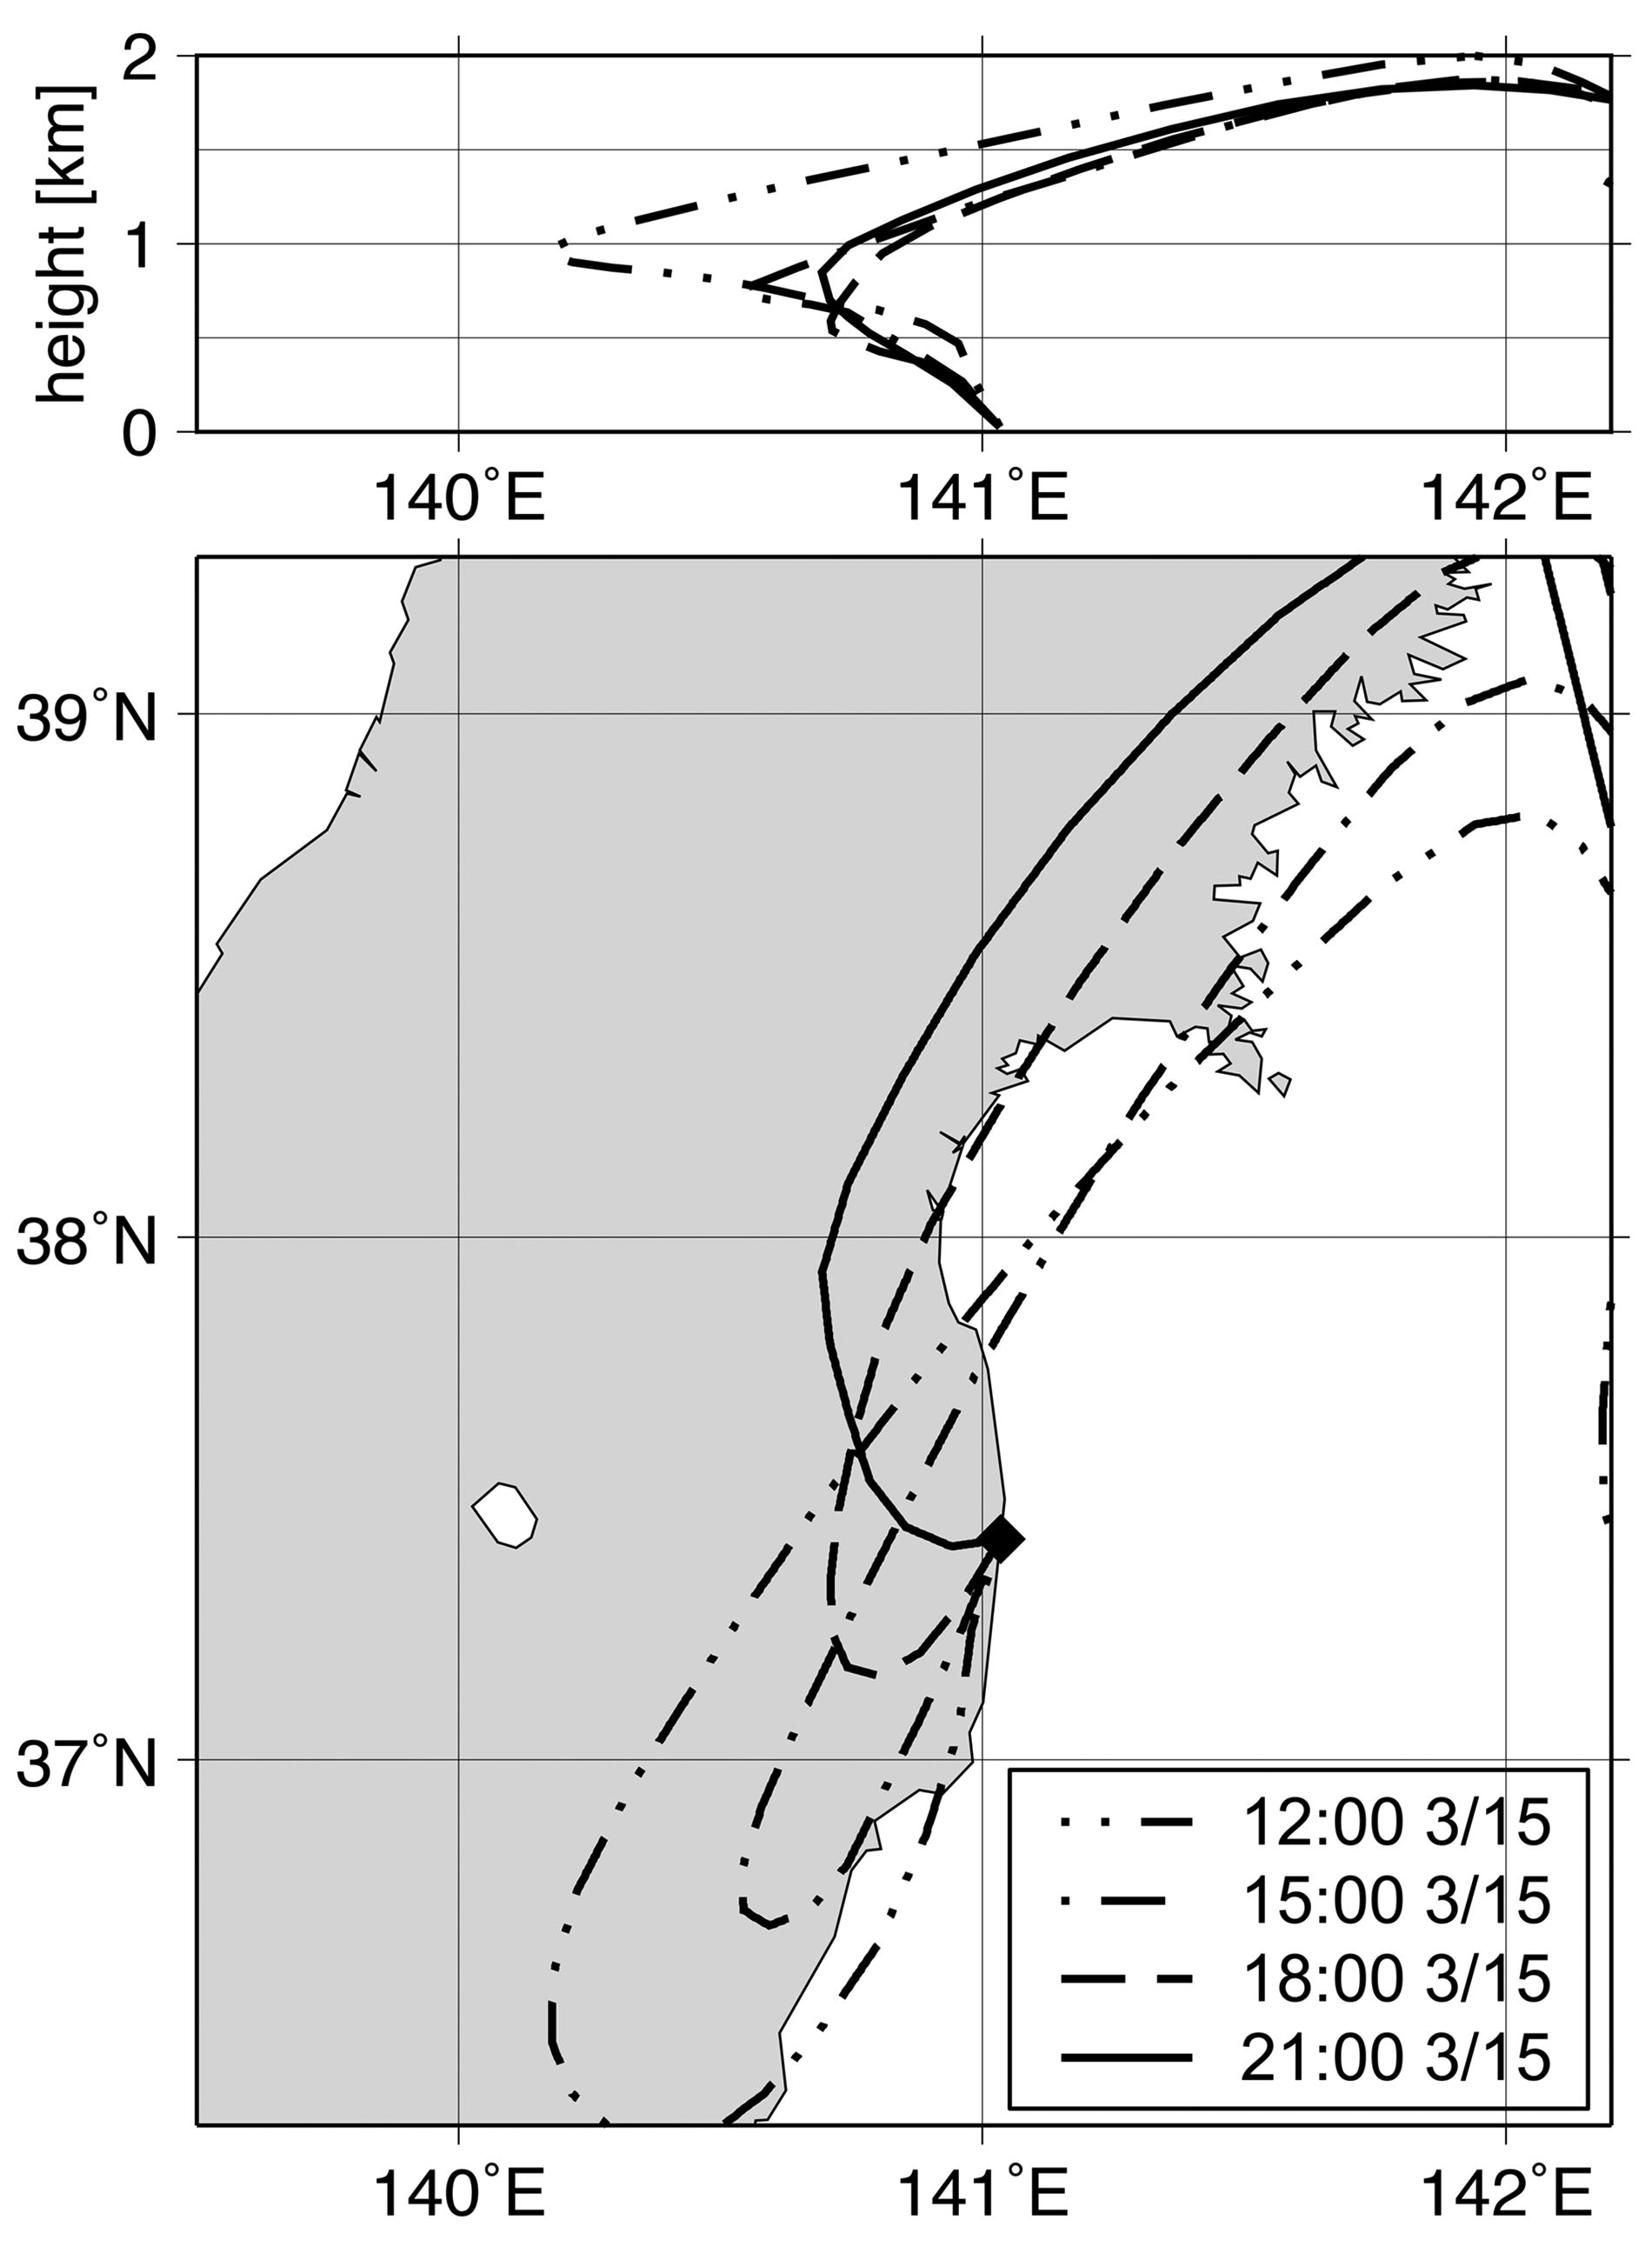
Fig. 4.
Forward trajectories that began at 12:00 JST (dashed two-dot line), 15:00 JST (dashed-dotted line), 18:00 JST (dashed line), and 21:00 JST (solid line) on 15 March 2011 from the FDNPP at a height of 25 m (calculated by Kajino et al. 2016).
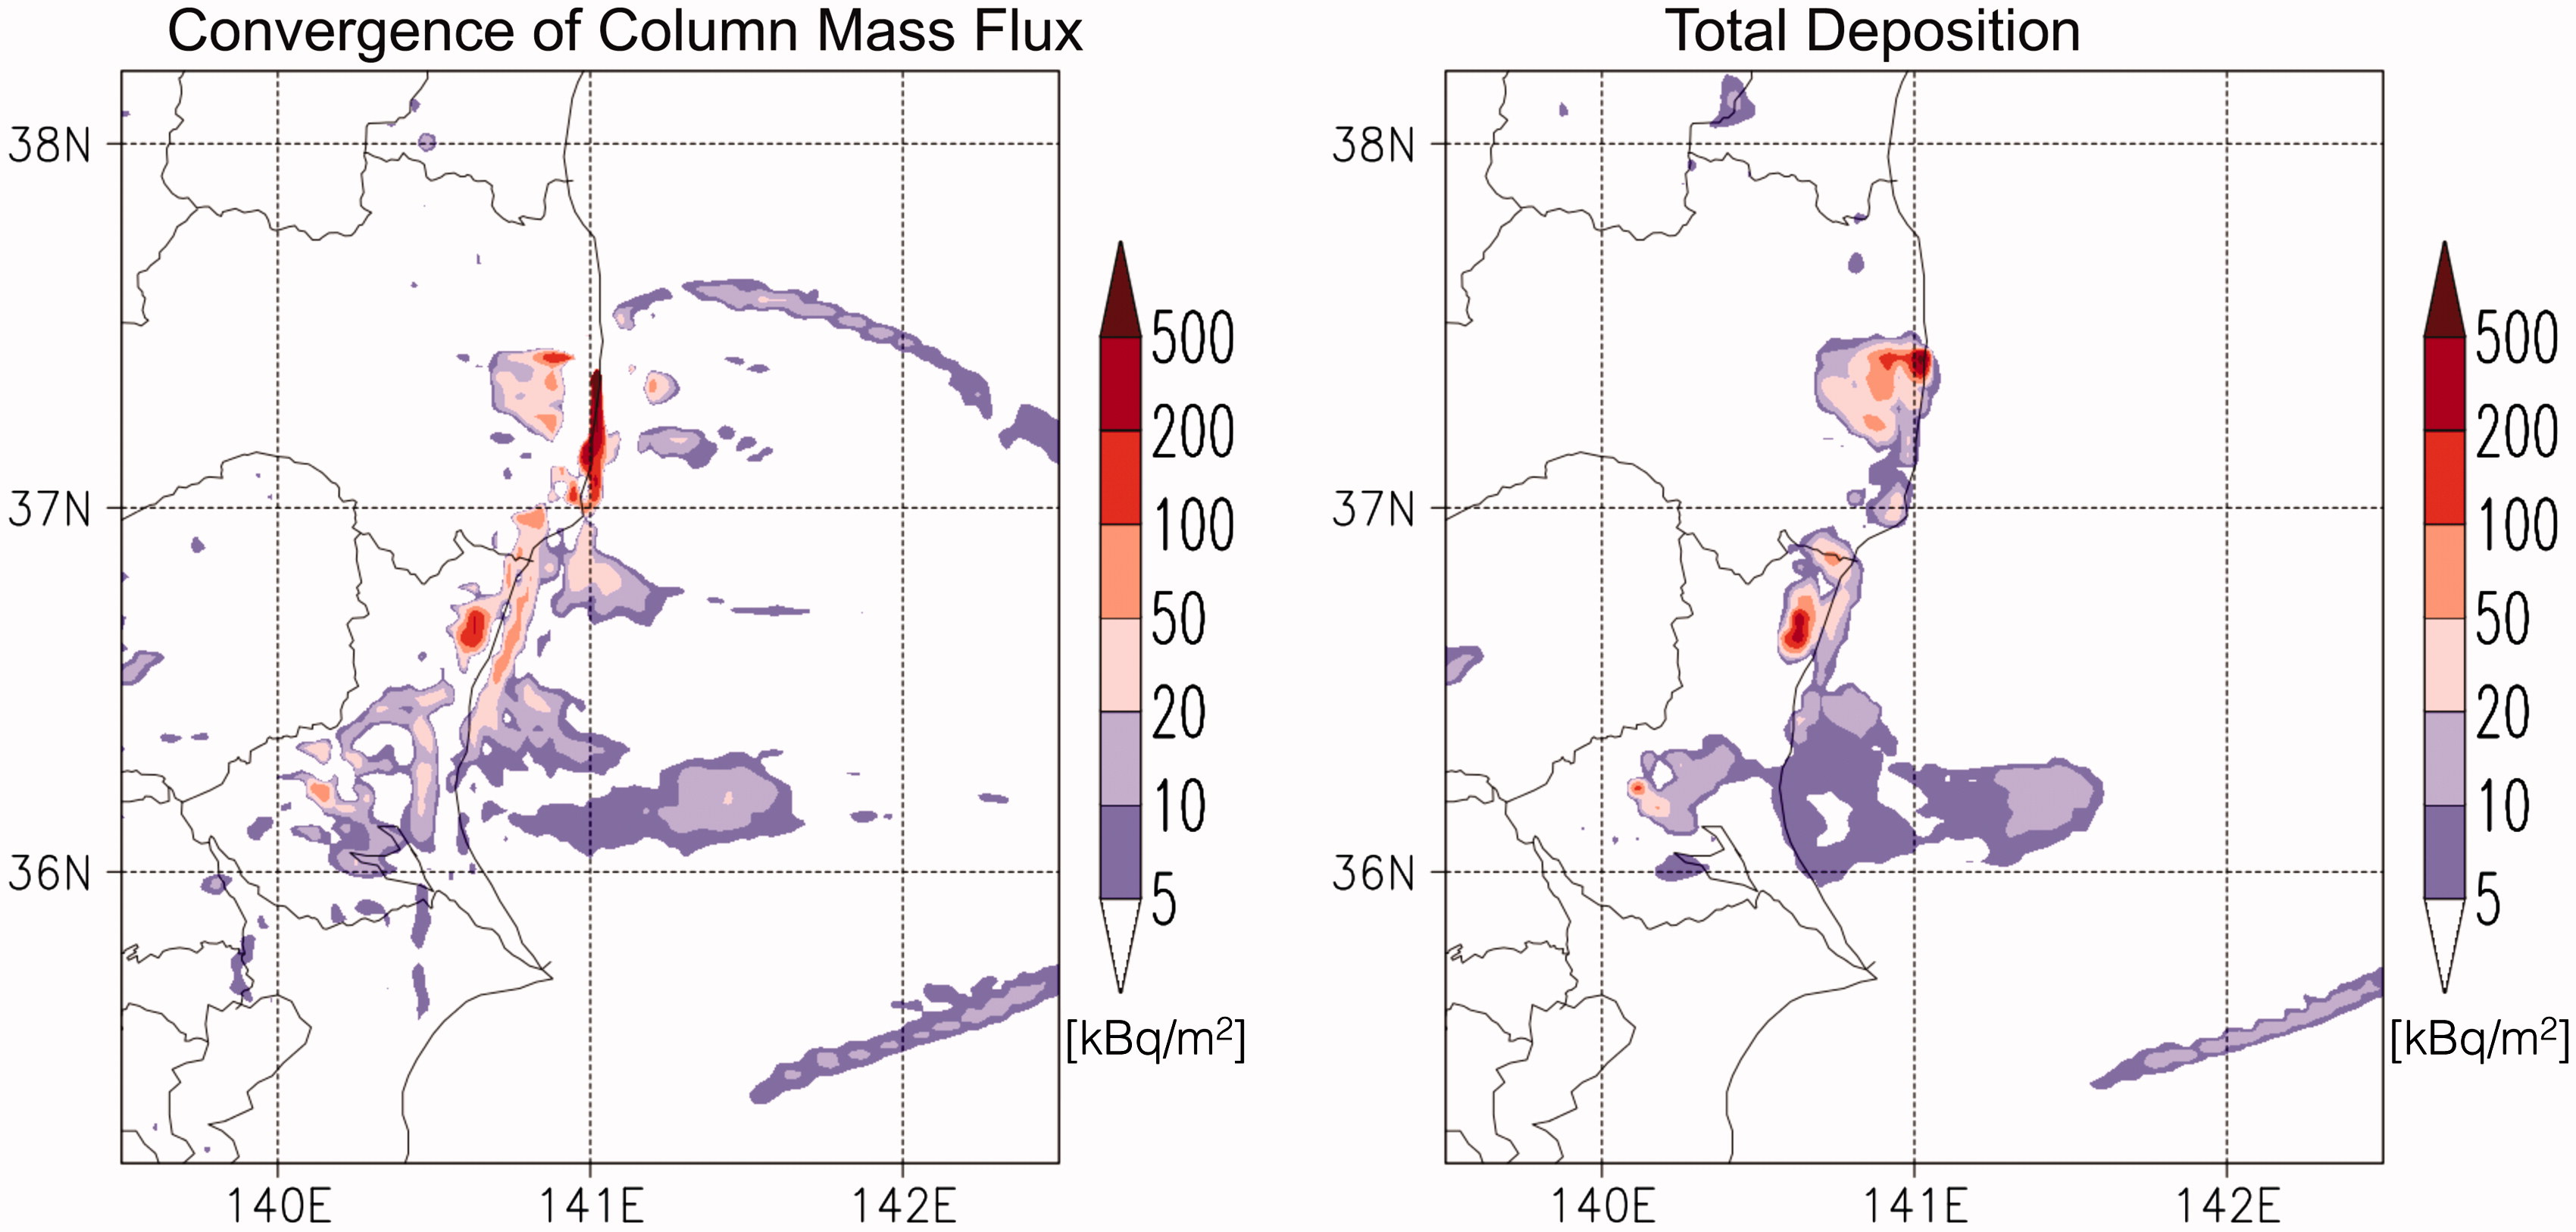
Fig. 5.
Convergence (= negative divergence) of the column-integrated 137Cs mass flux and the total deposition of 137Cs values temporally integrated from 21:00 JST on March 20 to 21:00 JST on 22 March 2011 for the model simulation used in this study.
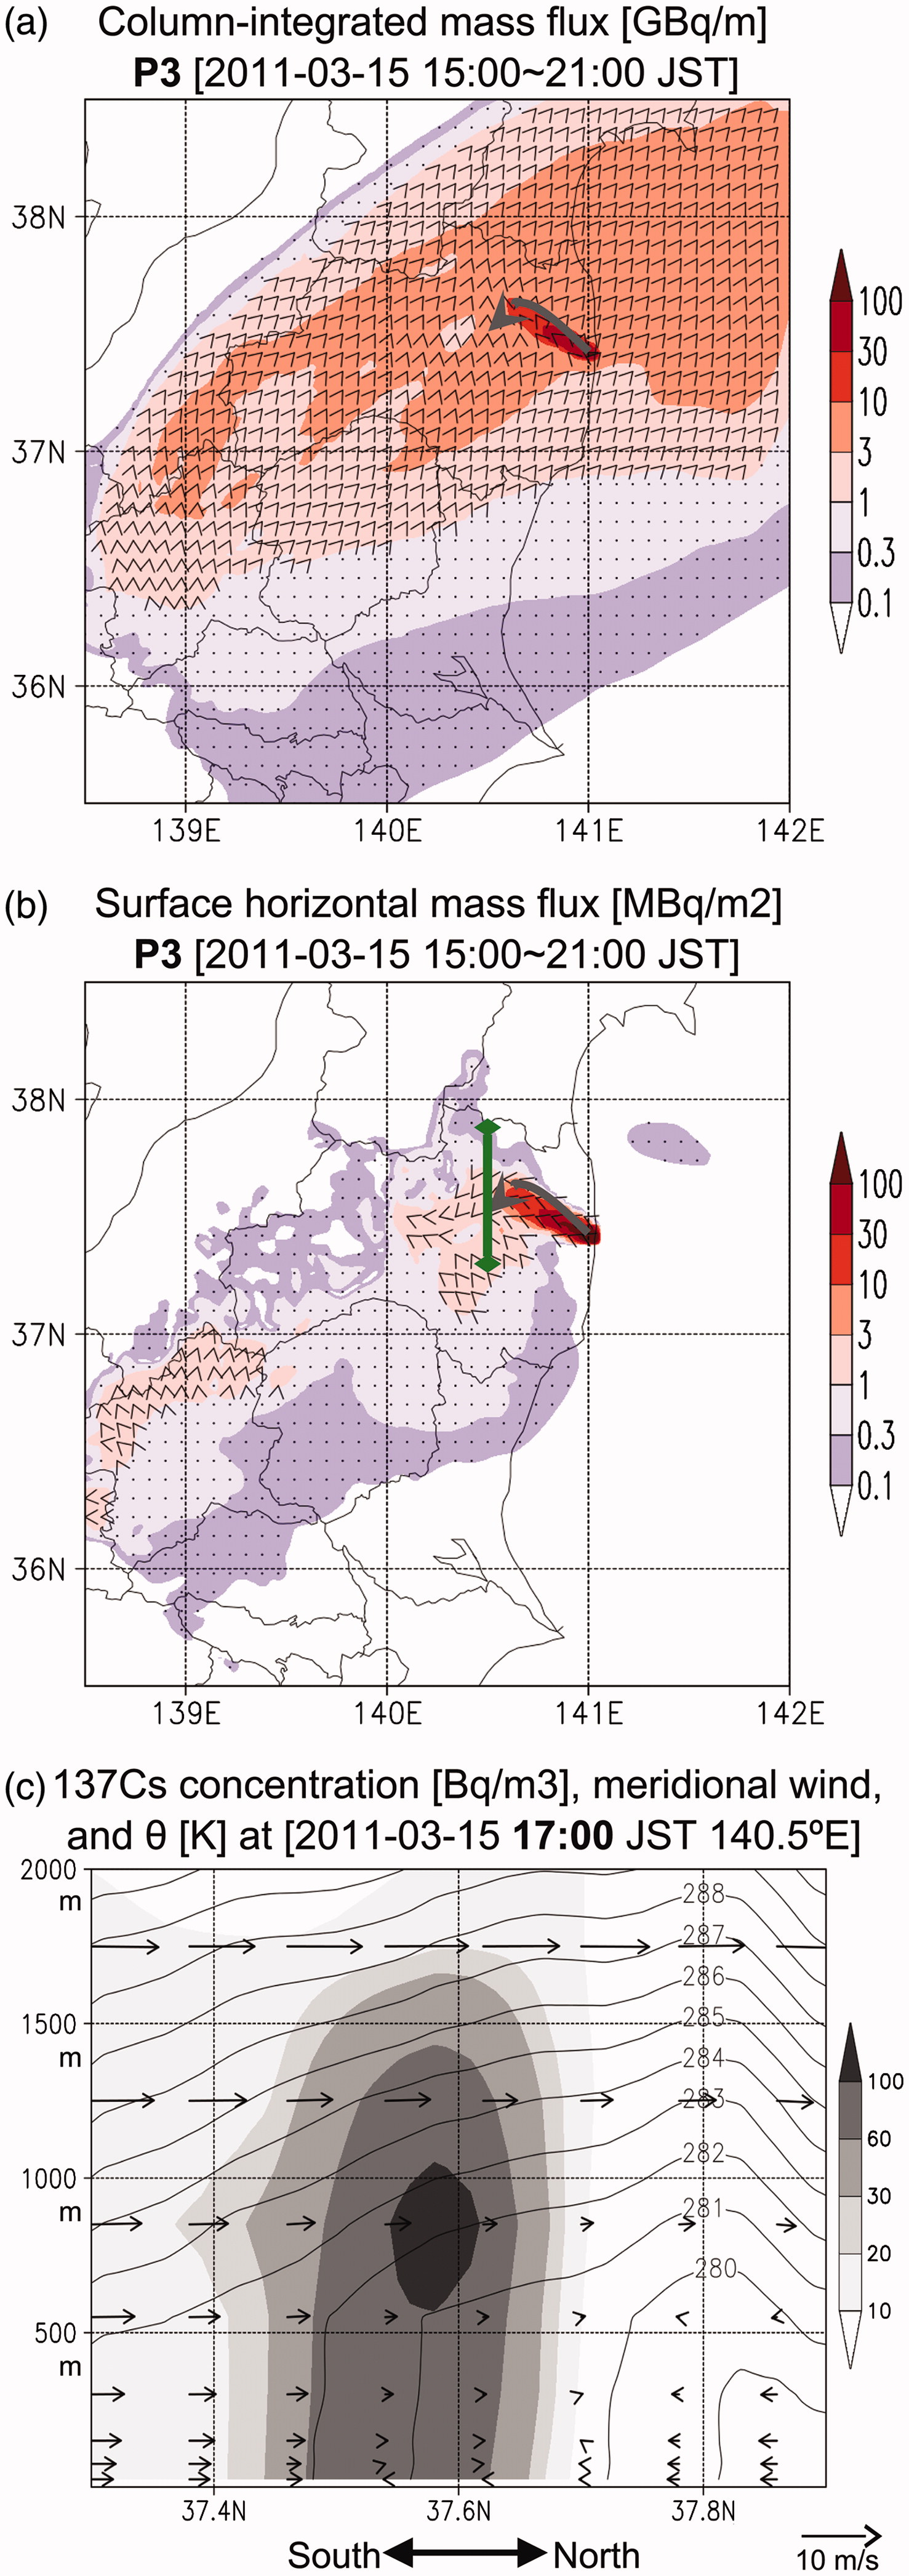
Fig. 6.
Time-integrals from 15:00 to 21:00 JST on 15 March 2011 of (a) the column-integrated mass flux of plume P3 and (b) the horizontal mass flux of plume P3 at the ground surface. Color shading indicates the magnitude of the mass flux. Small arrowheads indicate the direction of the mass flux. A large gray arrow illustrates the depiction in Nakajima et al. (2017) for plume P3 at 18:00 JST on March 15, shown in Fig. 2. (c) Latitude-altitude cross-sections at 140.5°E for 137Cs concentrations (gray shading), meridional winds (arrows), and potential temperature (θ; contours) at 17:00 JST on 15 March 2011. The cross-section is located at the green line in panel (b).
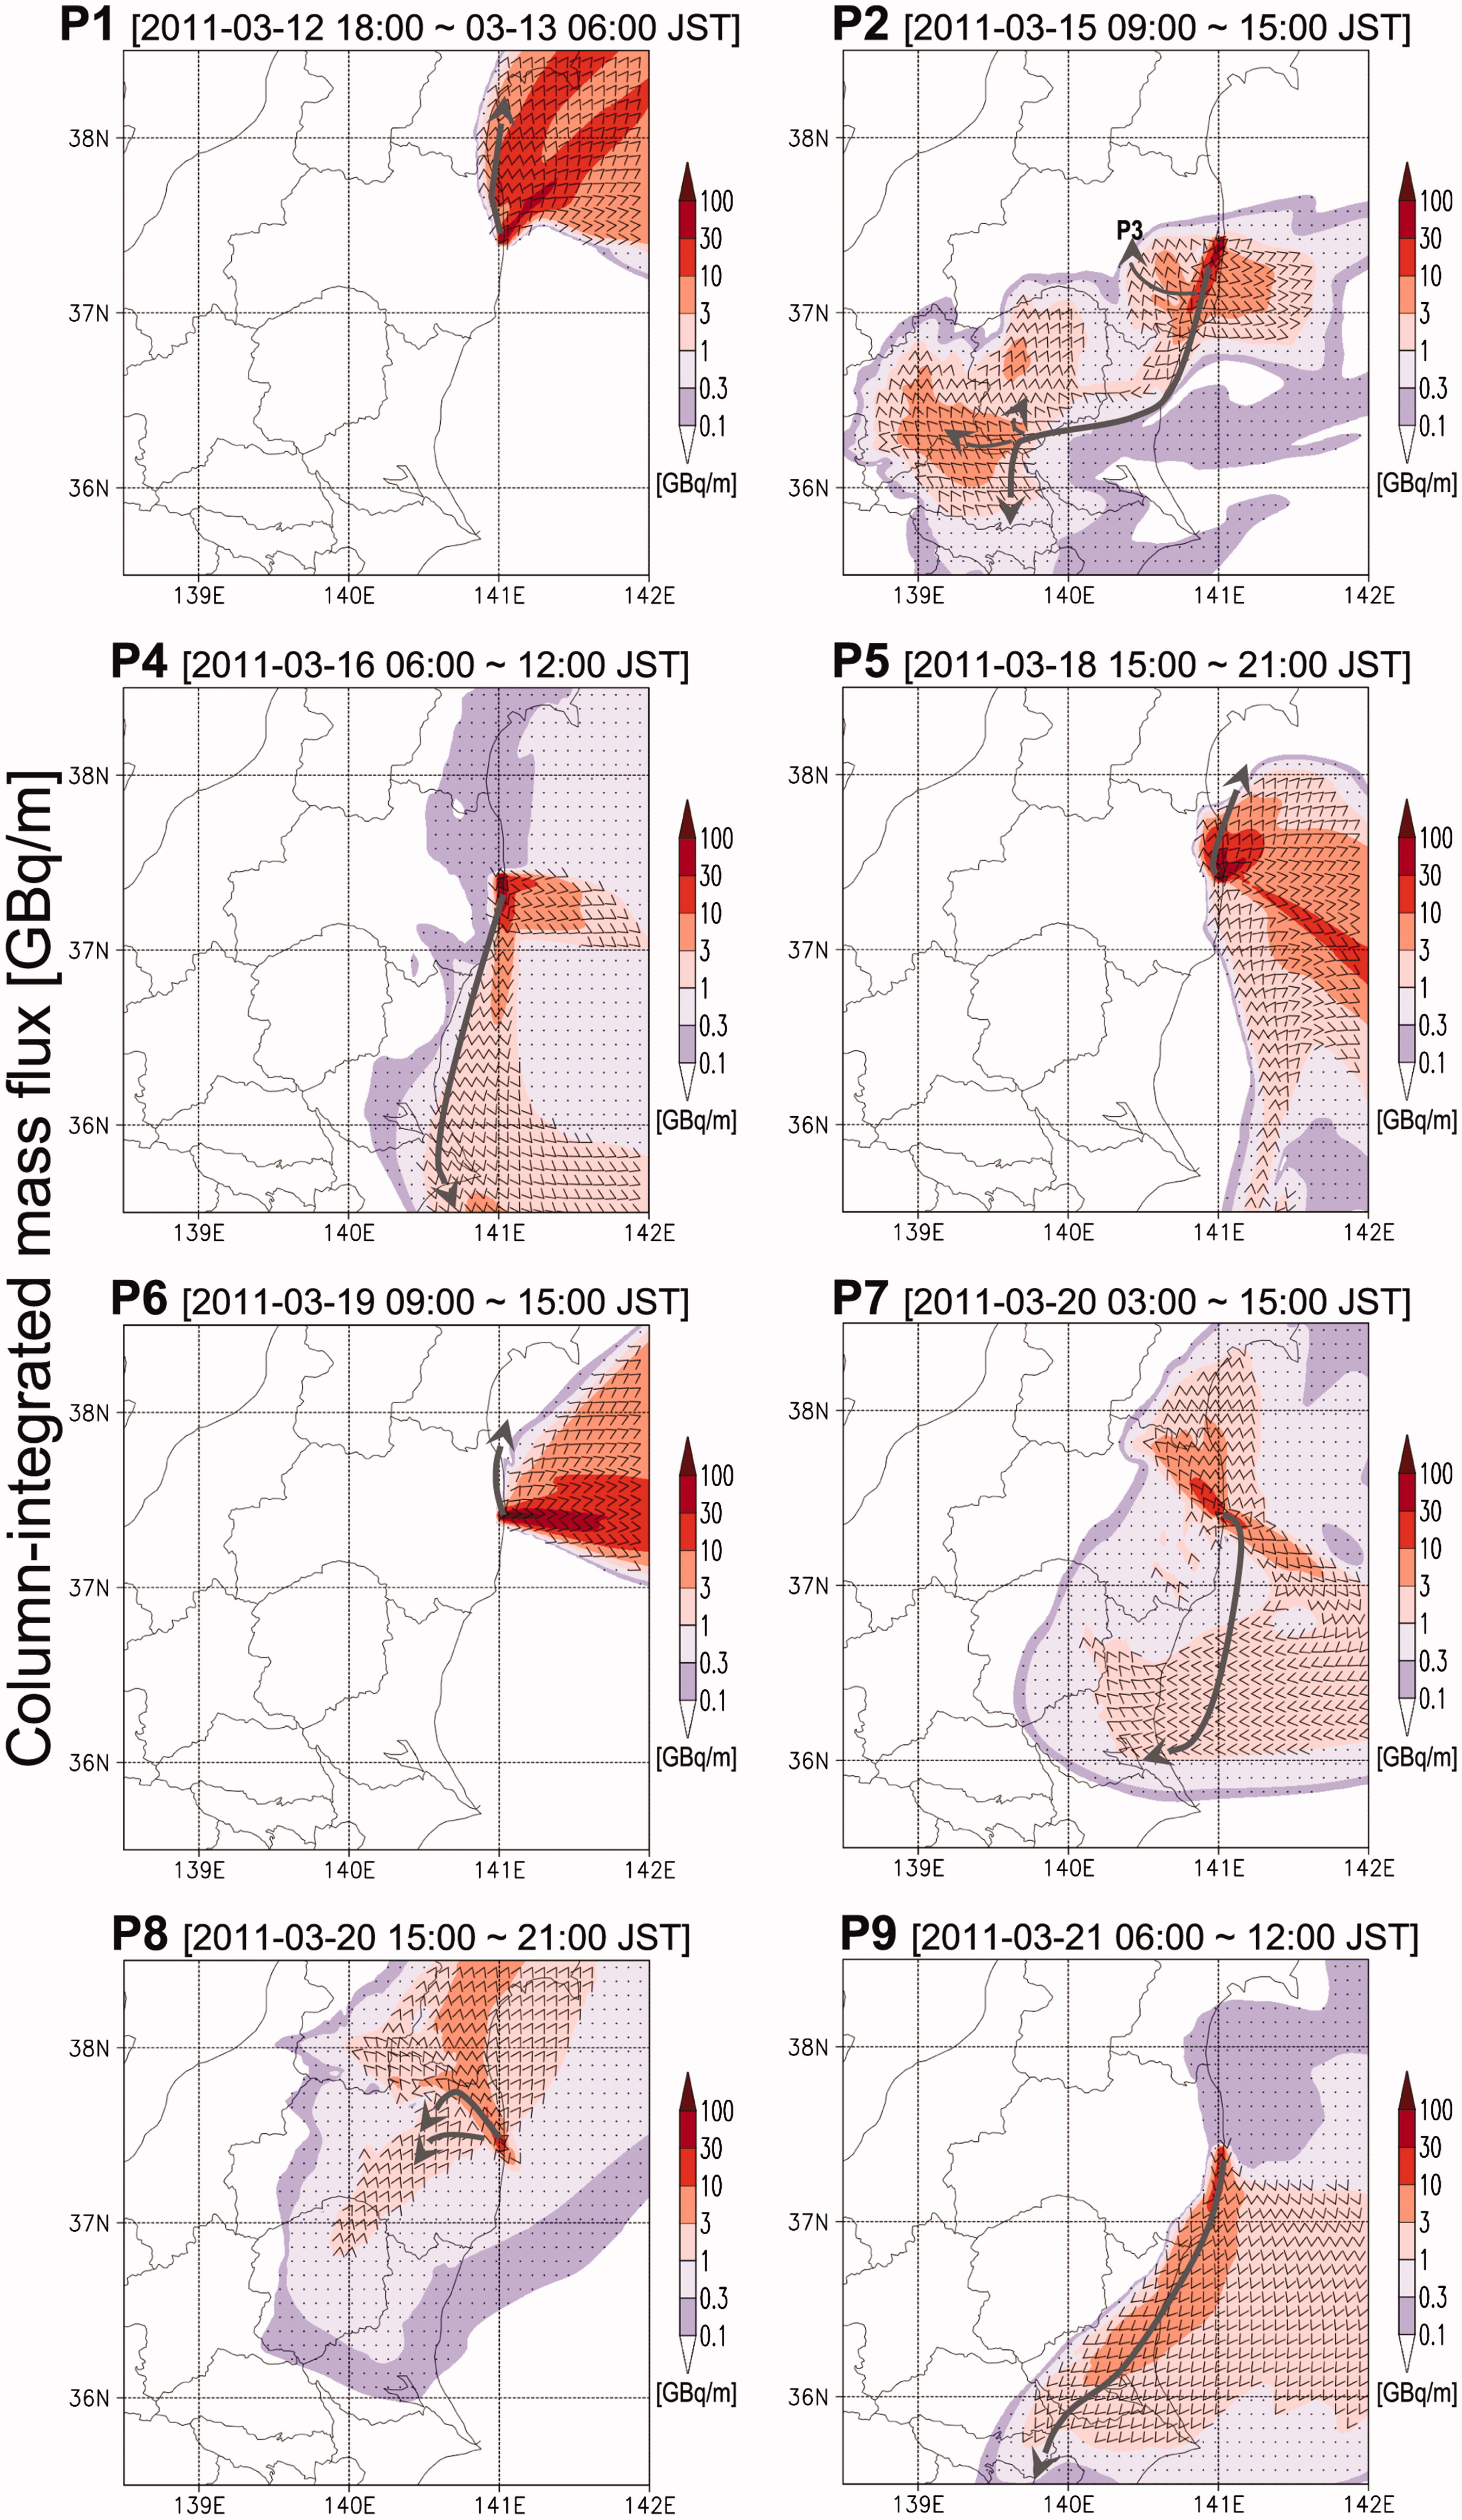
Fig. 7.
Time-integrals of the column-integrated mass fluxes of plumes P1–P2 and P4–P9. Color shading indicates the magnitude of the mass flux. Small arrowheads indicate the direction of the mass flux. Gray arrows illustrate the depictions from Nakajima et al. (2017) for plumes P1–P2 and P4–P9, shown in Fig. 2. In figure P2, only part of the plume P3 arrows from Nakajima et al. (2017) in the vicinity of the FDNPP is illustrated.
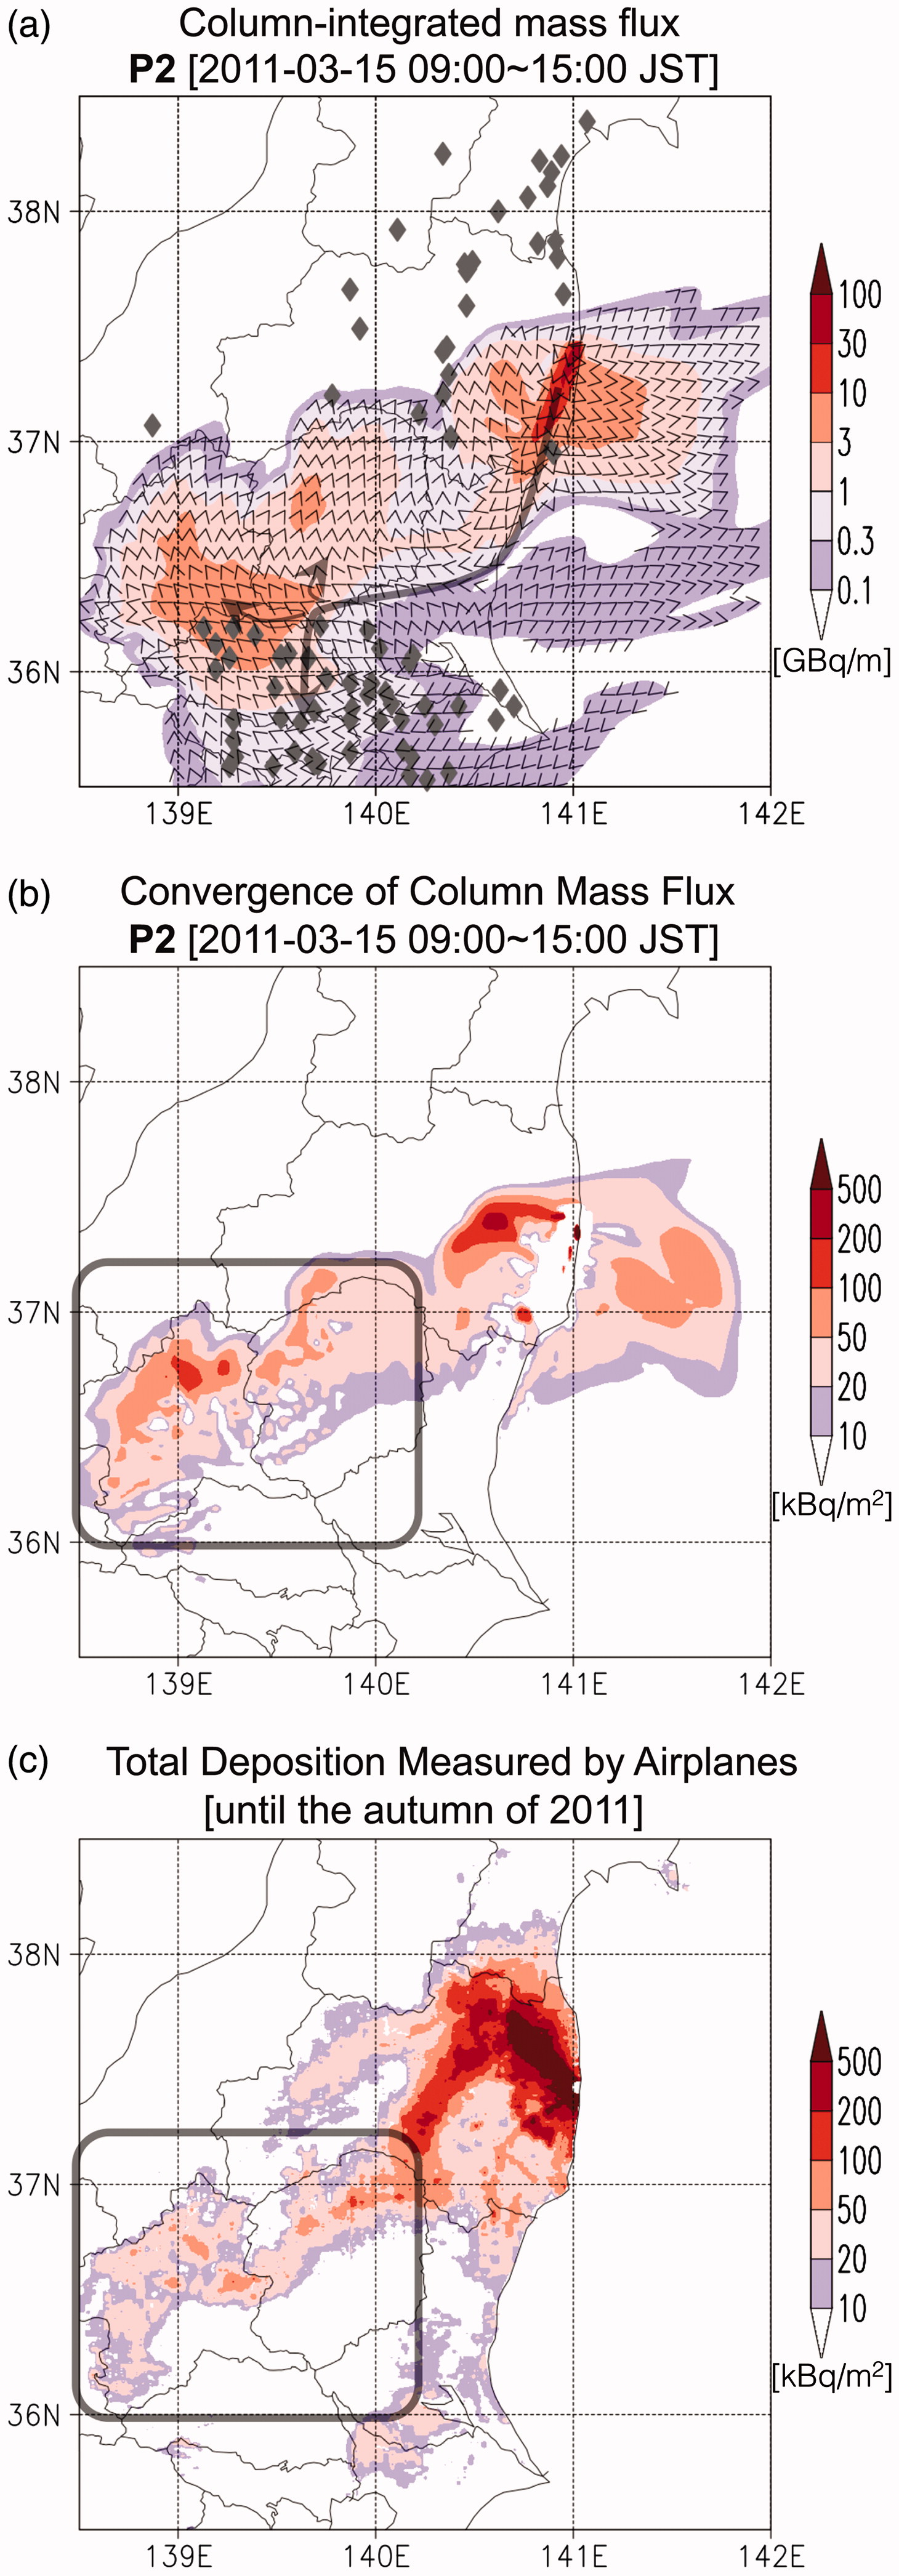
Fig. 8.
(a) Same as Fig. 7 for plume 2, but the plotted arrowheads include the direction of small mass fluxes <1 GBq m−1. Gray diamonds indicate the 137Cs sample stations from Tsuruta et al. (2014) and Oura et al. (2015). (b) Convergence of the column-integrated 137Cs mass flux time-integrated during the period of plume 2 in the model simulation. (c) Total deposition measured by airplanes, which were recorded by the Japanese government (Torii et al. 2012). Note that this deposition represents all Cs-137 emissions and plumes until autumn of 2011.
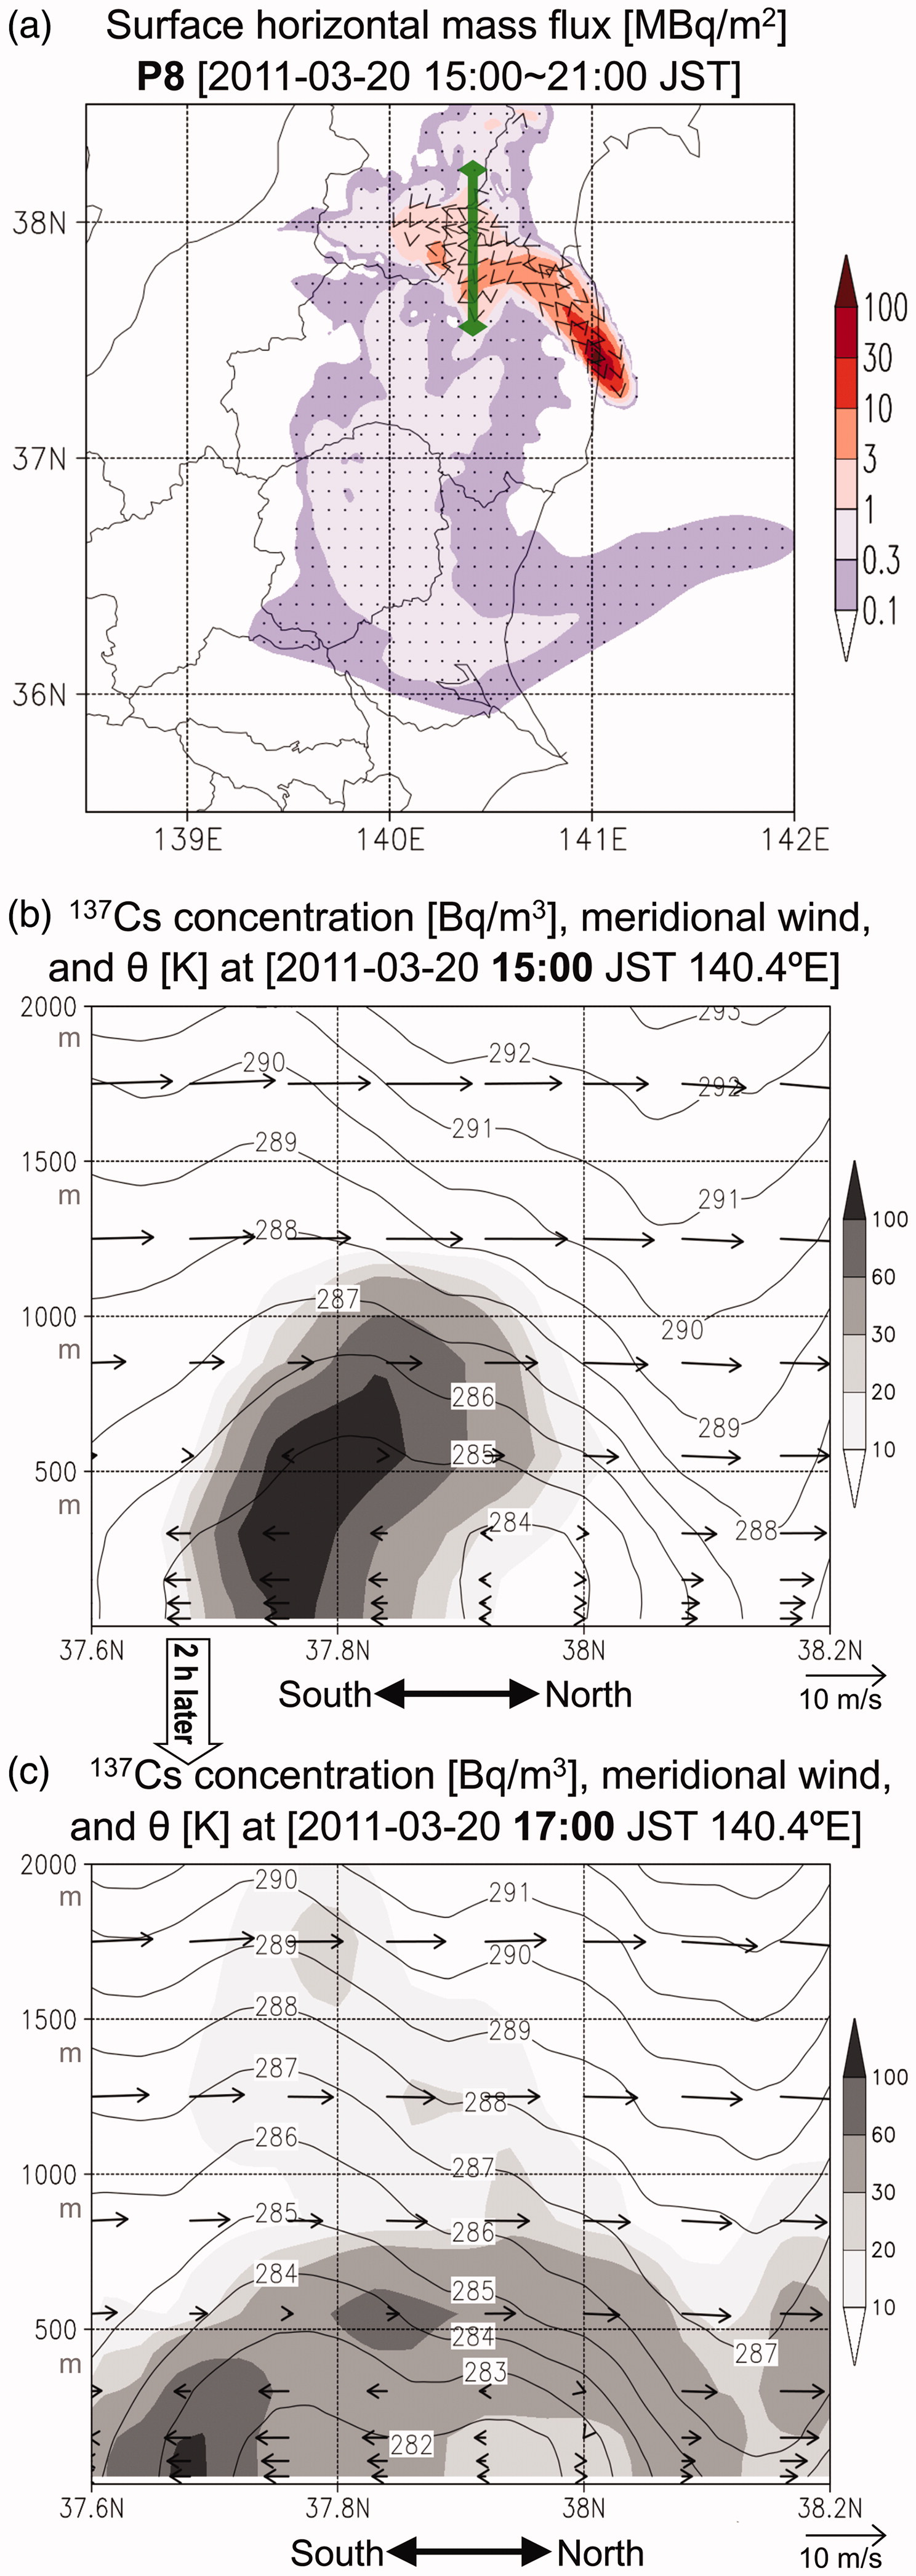
Fig. 9.
(a) Time-integral of the horizontal mass flux at the ground surface for plume P8. The time-integrated period is consistent with that of plume P8 in Fig. 7. Color shading indicates the magnitude of the mass flux. Small arrowheads indicate the direction of the mass flux. Latitude-altitude cross-sections at 140.4°E for 137Cs concentrations (gray shading), meridional wind (arrows), and potential temperature (θ; contours) are shown at (b) 15:00 JST on 20 March 2011 and (c) 17:00 JST on 20 March 2011. The cross-sections are located at the green line in panel (a).