Have a personal or library account? Click to login
Broadband dependence of atmospheric transmissions in the UV and total solar radiation Cover

Broadband dependence of atmospheric transmissions in the UV and total solar radiation

Open Access
|Jan 2019

Figures & Tables

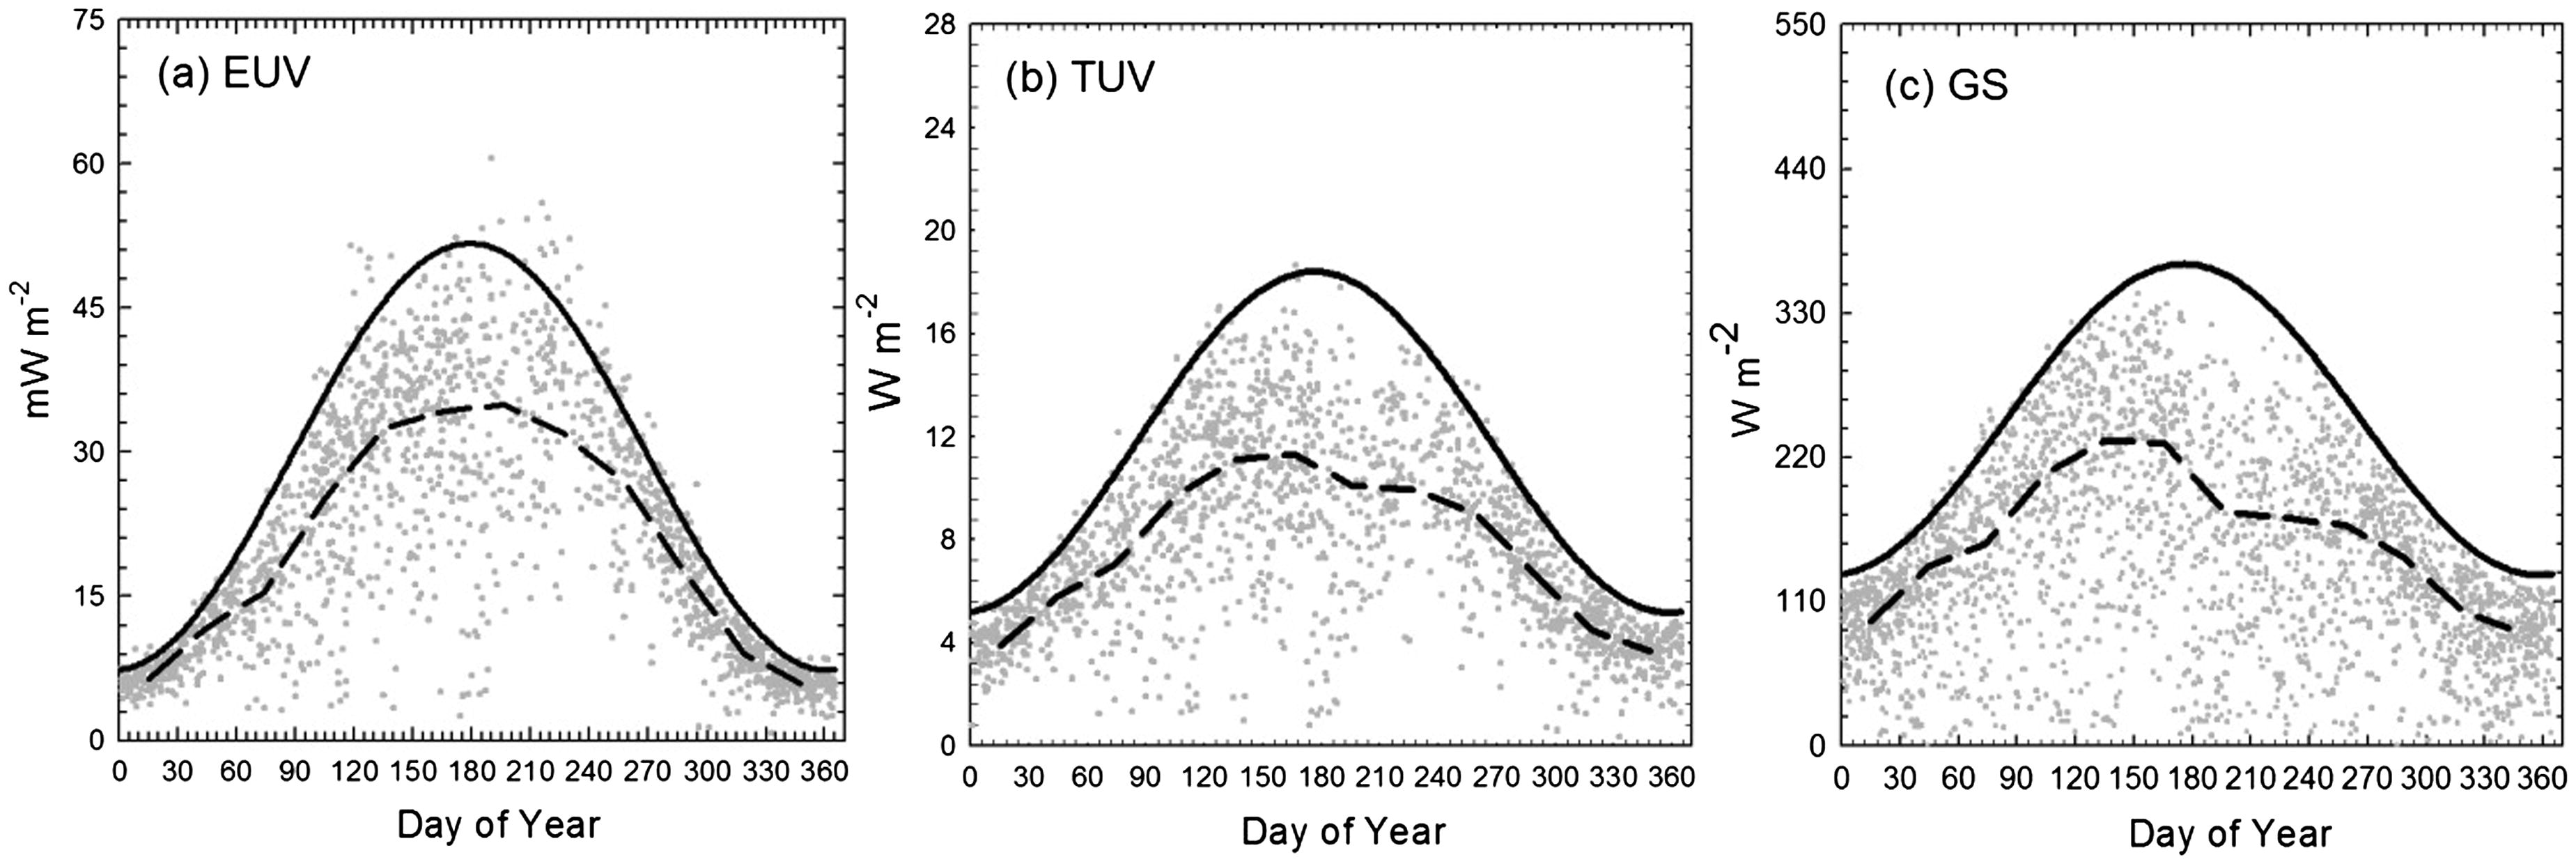
Fig. 1.

Annual cycles of the daily integrated SSR for the maximum possible clear-sky solar irradiance (reference value) and the all-sky average irradiance for (a) EUV, (b) TUV, and (c) GS total spectrum from March 2004 to February 2013. The solid and dashed lines show the envelope curves of the data maxima and the curves of the all-sky average values, respectively.

Table 1.

Results of the harmonic analysis for the clear-sky model (Equation 3).

SSRAverage y¯Amplitude (A)Phase angle (ϕ1)Degrees RadianEUV (mW m−2)29.522.2206 3.6TUV (W m2)11.86.6183 3.2GS (W m2)248.5118.6172 3.0
Table 2.

RAFs used in Equation (8) (Kim et al. 2014).

SSRCCAODTCOEUV (290–325 nm)–0.12–0.21–1.16TUV (290–363 nm)–0.13–0.21–0.35GS (305–2800 nm)–0.25–0.16–0.23
Table 3.

Annual mean correction ratios of the corrected SSR (EUV, TUV, and GS) to the measured SSR.
SSRCloud TAOD TOzone TEUV (290–325 nm)0.992 (0.125)1.014 (0.095)0.998 (0.145)TUV (290–363 nm)0.990 (0.101)1.012 (0.073)0.999 (0.147)GS (305–2800 nm)0.992 (0.077)1.022 (0.141)1.013 (0.189)

[i] Remarks: Figures in parentheses indicate standard deviation of the correction ratio.

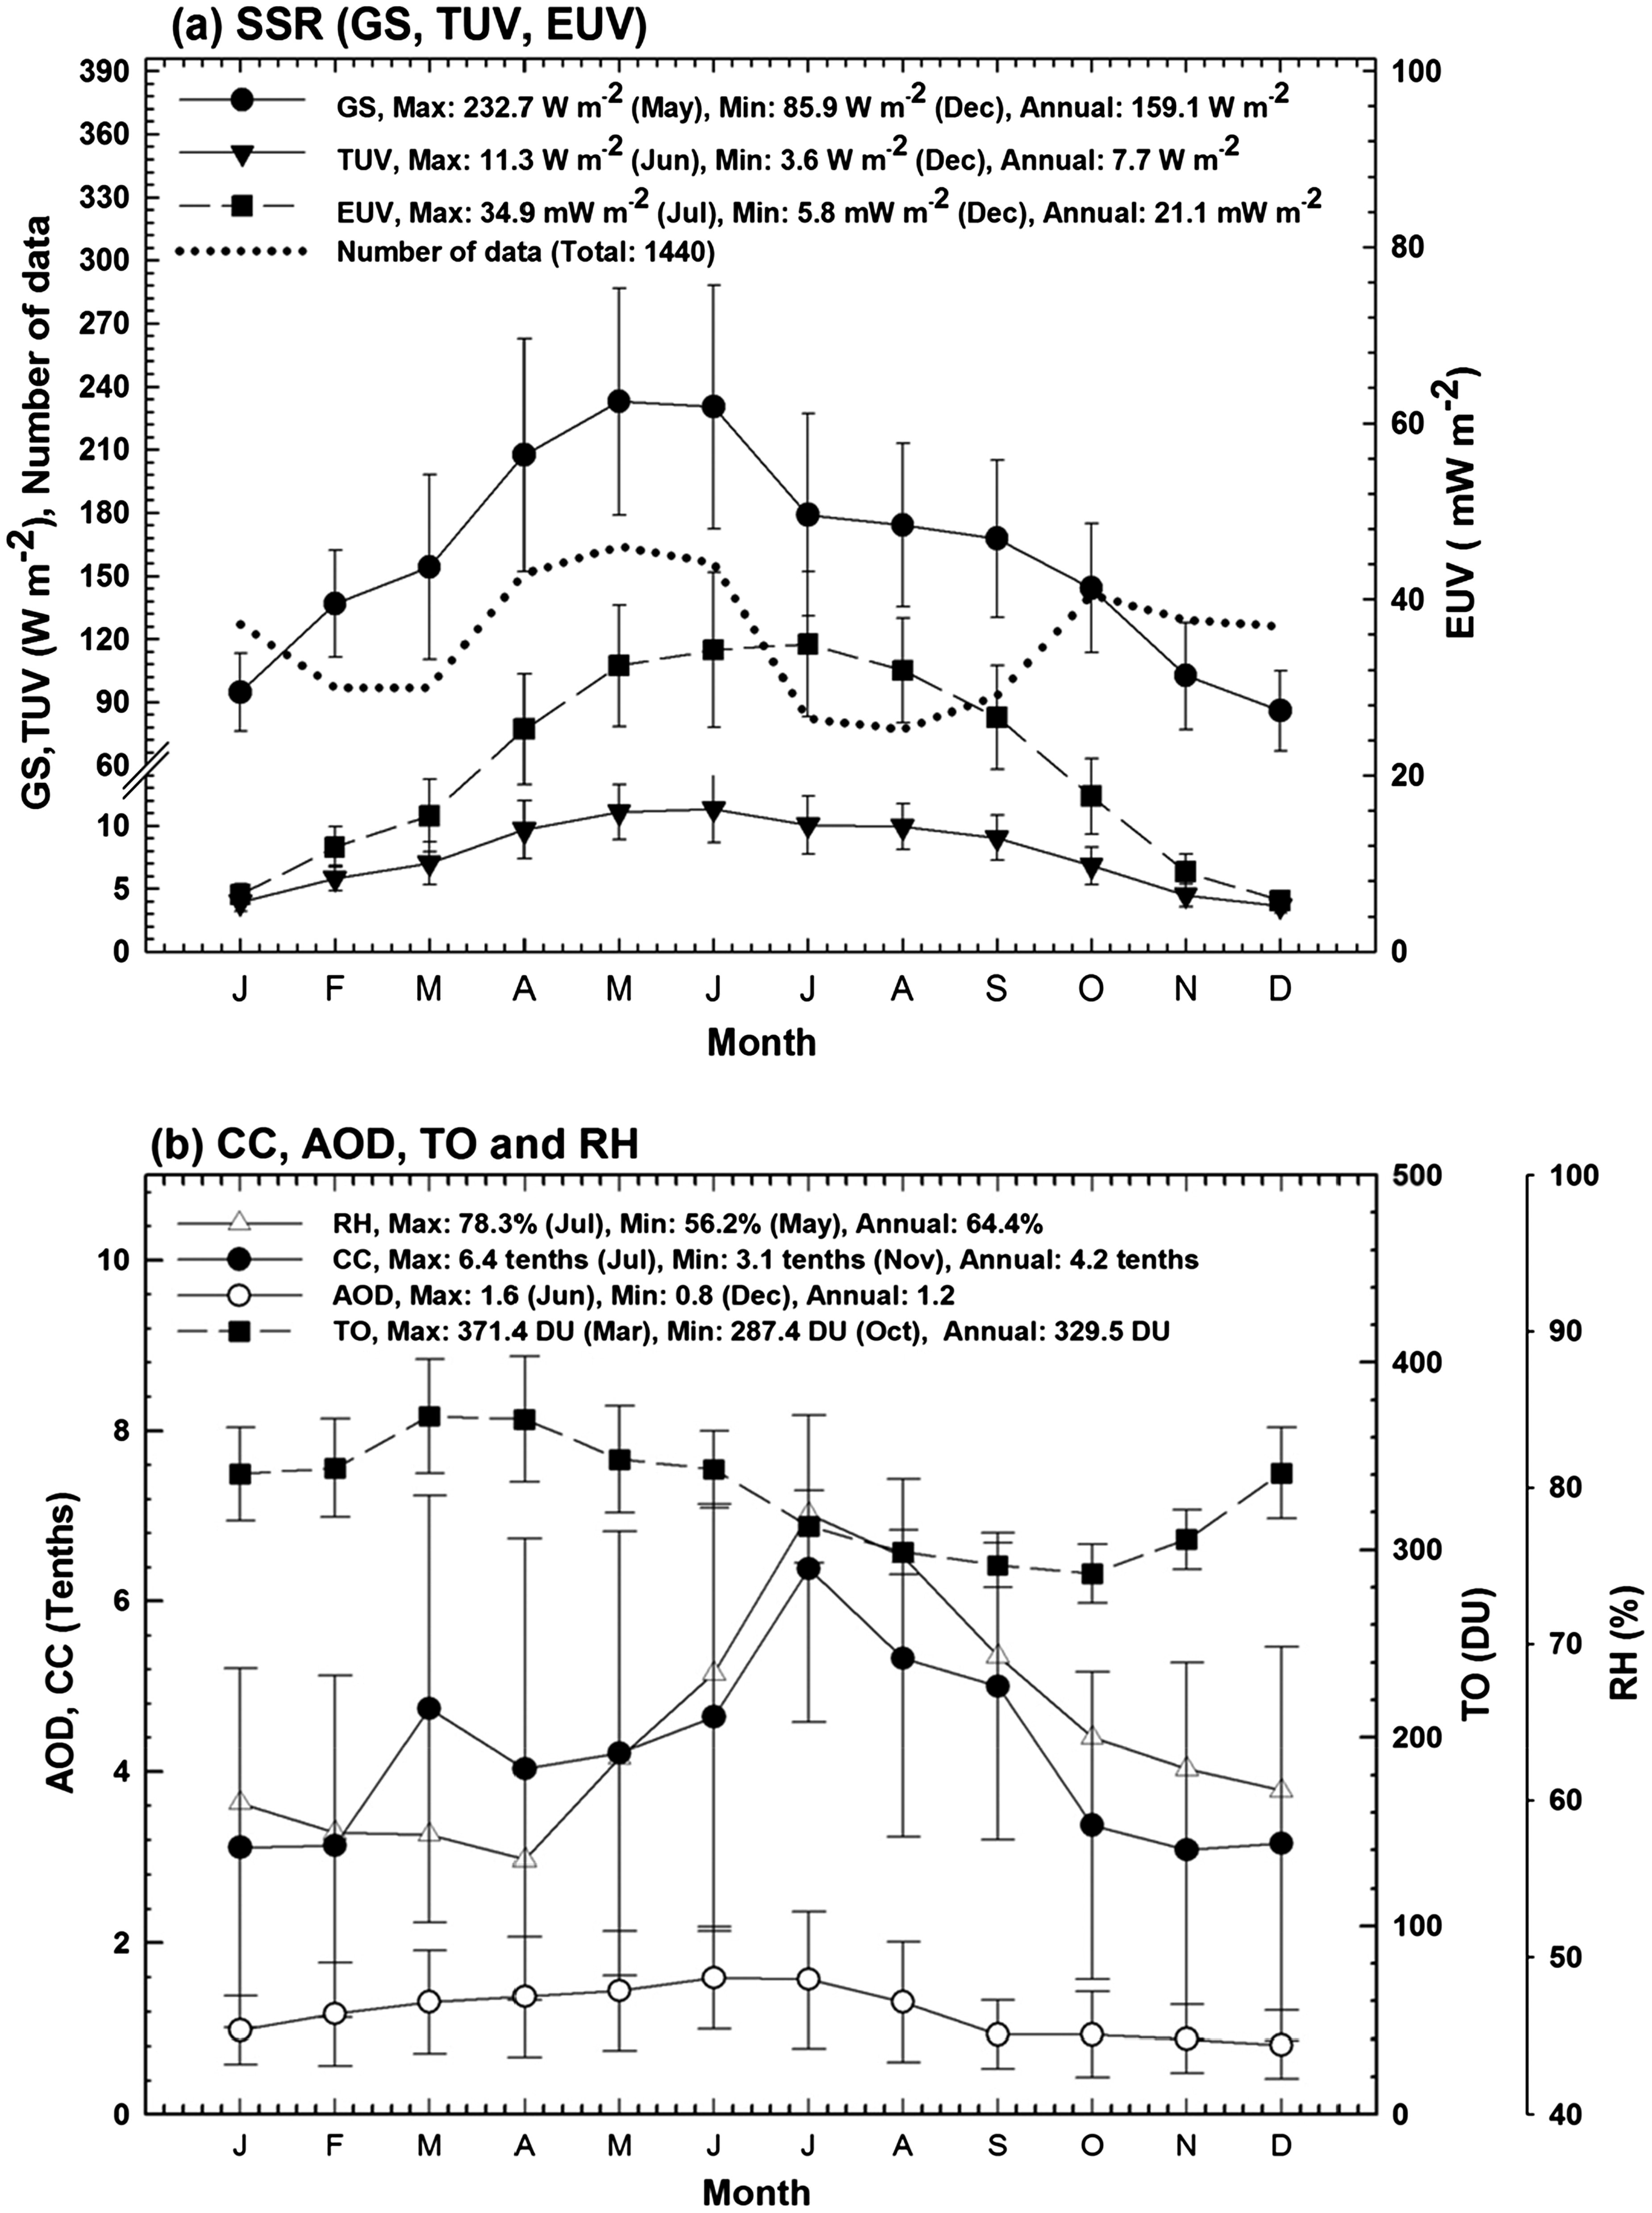
Fig. 2.

Annual cycles of monthly mean (a) SSI (GS, TUV, and EUV irradiances), number of data to the left vertical axis, and (b) CC, AOD (at 320.1 nm), TCO, and RH, over the period from March 2004 through February 2013.
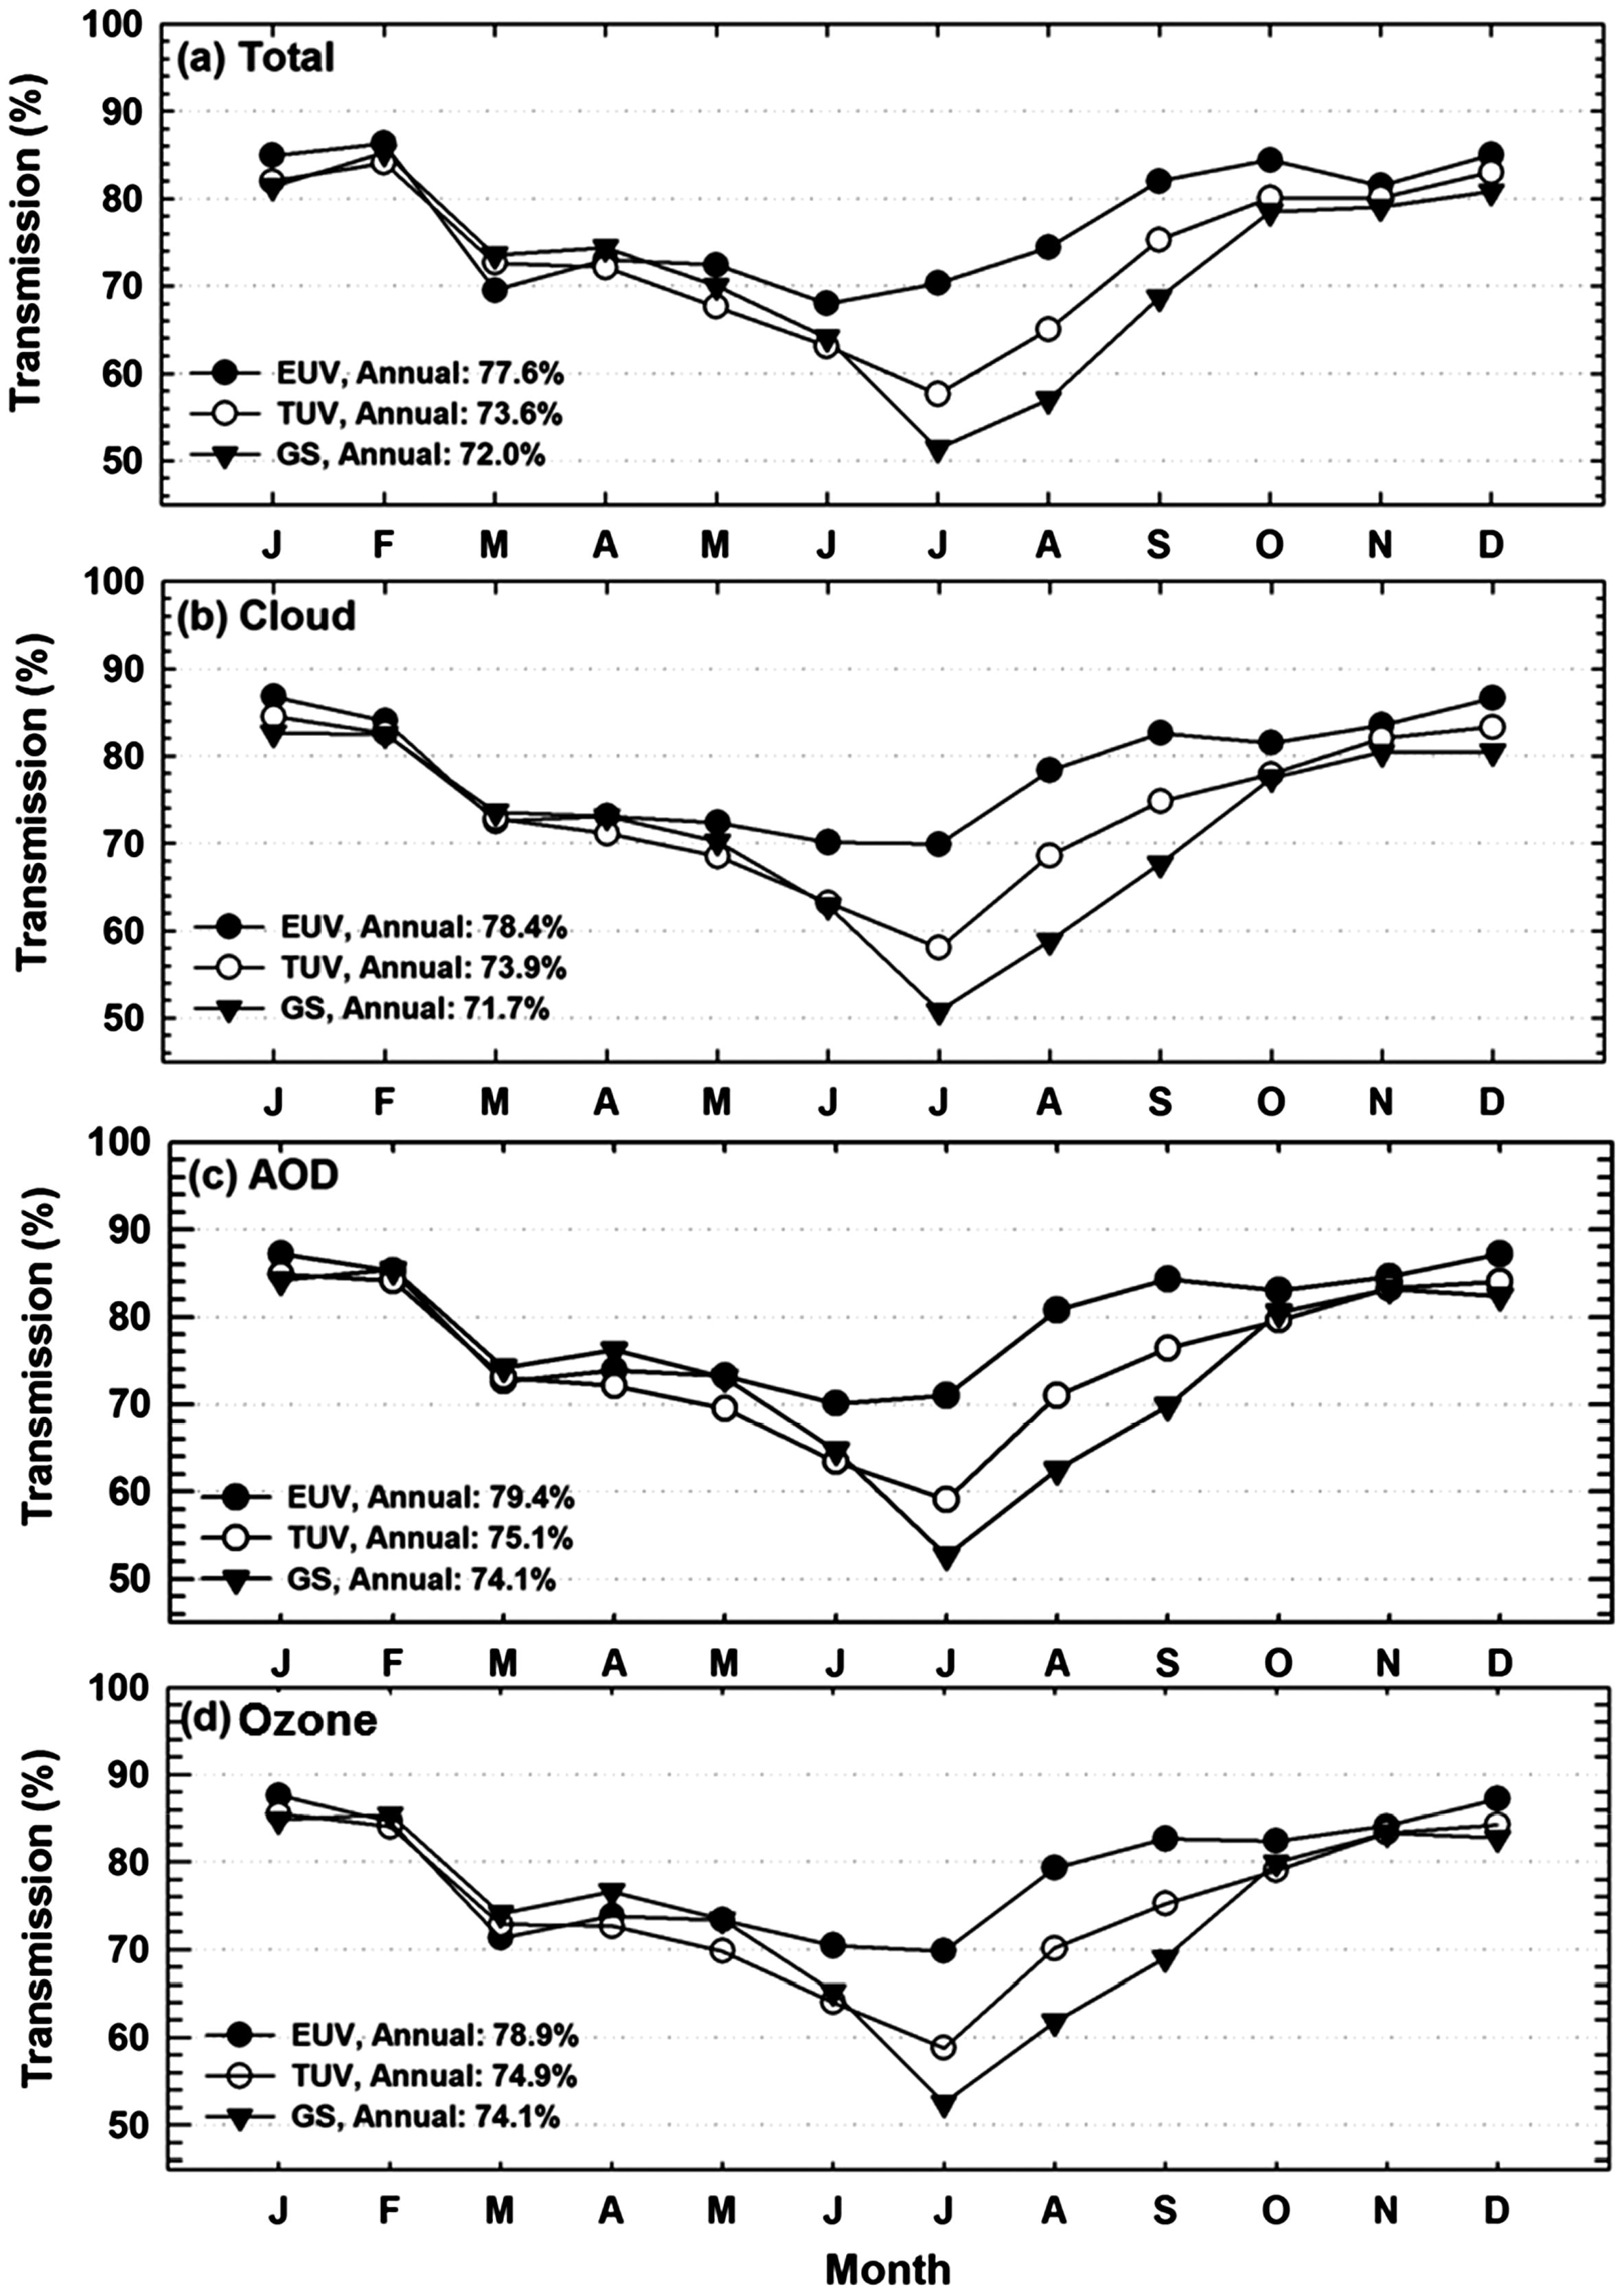
Fig. 3.

Annual cycles of (a) total, (b) cloud, (c) aerosol, and (d) ozone transmission in the EUV, TUV, and GS irradiances.

Table 4.

EUV, TUV, and GS transmissions (%) grouped by CC amount, AOD, and TCO.

SSRGroup CC (tenths)<11–23–45–67–89–10Number of data points23131836731417733EUV(87.4)86.179.374.969.254.1TUV(86.8)83.575.569.261.649.8GS(89.6)83.773.864.556.043.4SSRGroup AOD (320.1 nm)<0.50.5–0.80.9–1.21.3–1.61.7–2.02.1–2.42.5–4.0Number of data points1843773422591496762EUV(91.3)87.681.275.968.466.756.7TUV(89.0)84.276.871.065.163.253.6GS(91.6)84.276.270.462.661.851.7SSRGroup TCO (DU)<310310–324325–339340–354355–369370–384385–399400 ≤Number of data points4822151861841381216054EUV82.082.280.4(80.8)(78.5)76.369.570.2TUV75.077.476.3(77.8)(77.8)79.773.879.0GS71.775.975.9(80.3)(80.8)83.475.382.5

[i] Remarks: Figures in parentheses indicate nonsystematic wavelength dependence in atmospheric transmission.

Table 5.

Annual averages and seasonal wavelength dependences in total, cloud, aerosol, and ozone transmission (%) increase and decrease with wavelength from EUV through the TUV and GS regions of the solar spectrum.

IncreaseDecreaseMarchJuly–January (August)AnnualTotal transmission (%)EUV69.580.4 (74.4)77.6TUV72.674.7 (65.0)73.6GS73.671.0 (57.0)72.0Cloud transmission (%)EUV72.581.3 (78.3)78.4TUV72.875.6 (68.6)73.9GS73.671.2 (58.8)71.7Aerosol transmission (%)EUV72.682.6 (80.8)79.4TUV73.176.9 (71.0)75.1GS74.273.6 (62.5)74.1Ozone transmission (%)EUV71.381.9 (79.3)78.9TUV72.876.6 (70.1)74.9GS74.173.4 (61.8)74.1Associated meteorological parametersCloud Cover (tenths)4.74.2 (5.3)4.2Relative Humidity (%)57.867.2 (75.6)64.4AOD (320.1 nm)1.31.1 (1.3)1.2Total Ozone (DU)371.4311.1 (298.8)329.5

[i] Remarks: Transmissions in February, April, May, and June did not show systematic wavelength dependences except for the cloud transmission in February and June. Transmission in August is shown in parentheses.

Language: English
Page range: 1503513 - 1503513
Published on: Jan 1, 2019
Published by: Stockholm University Press
In partnership with: Paradigm Publishing Services

© 2019 Hana Lee, Woogyung Kim, Yun G. Lee, Ja-Ho Koo, Yeonjin Jung, Sang S. Park, Hi-Ku Cho, Jhoon Kim, published by Stockholm University Press
This work is licensed under the Creative Commons Attribution 4.0 License.