
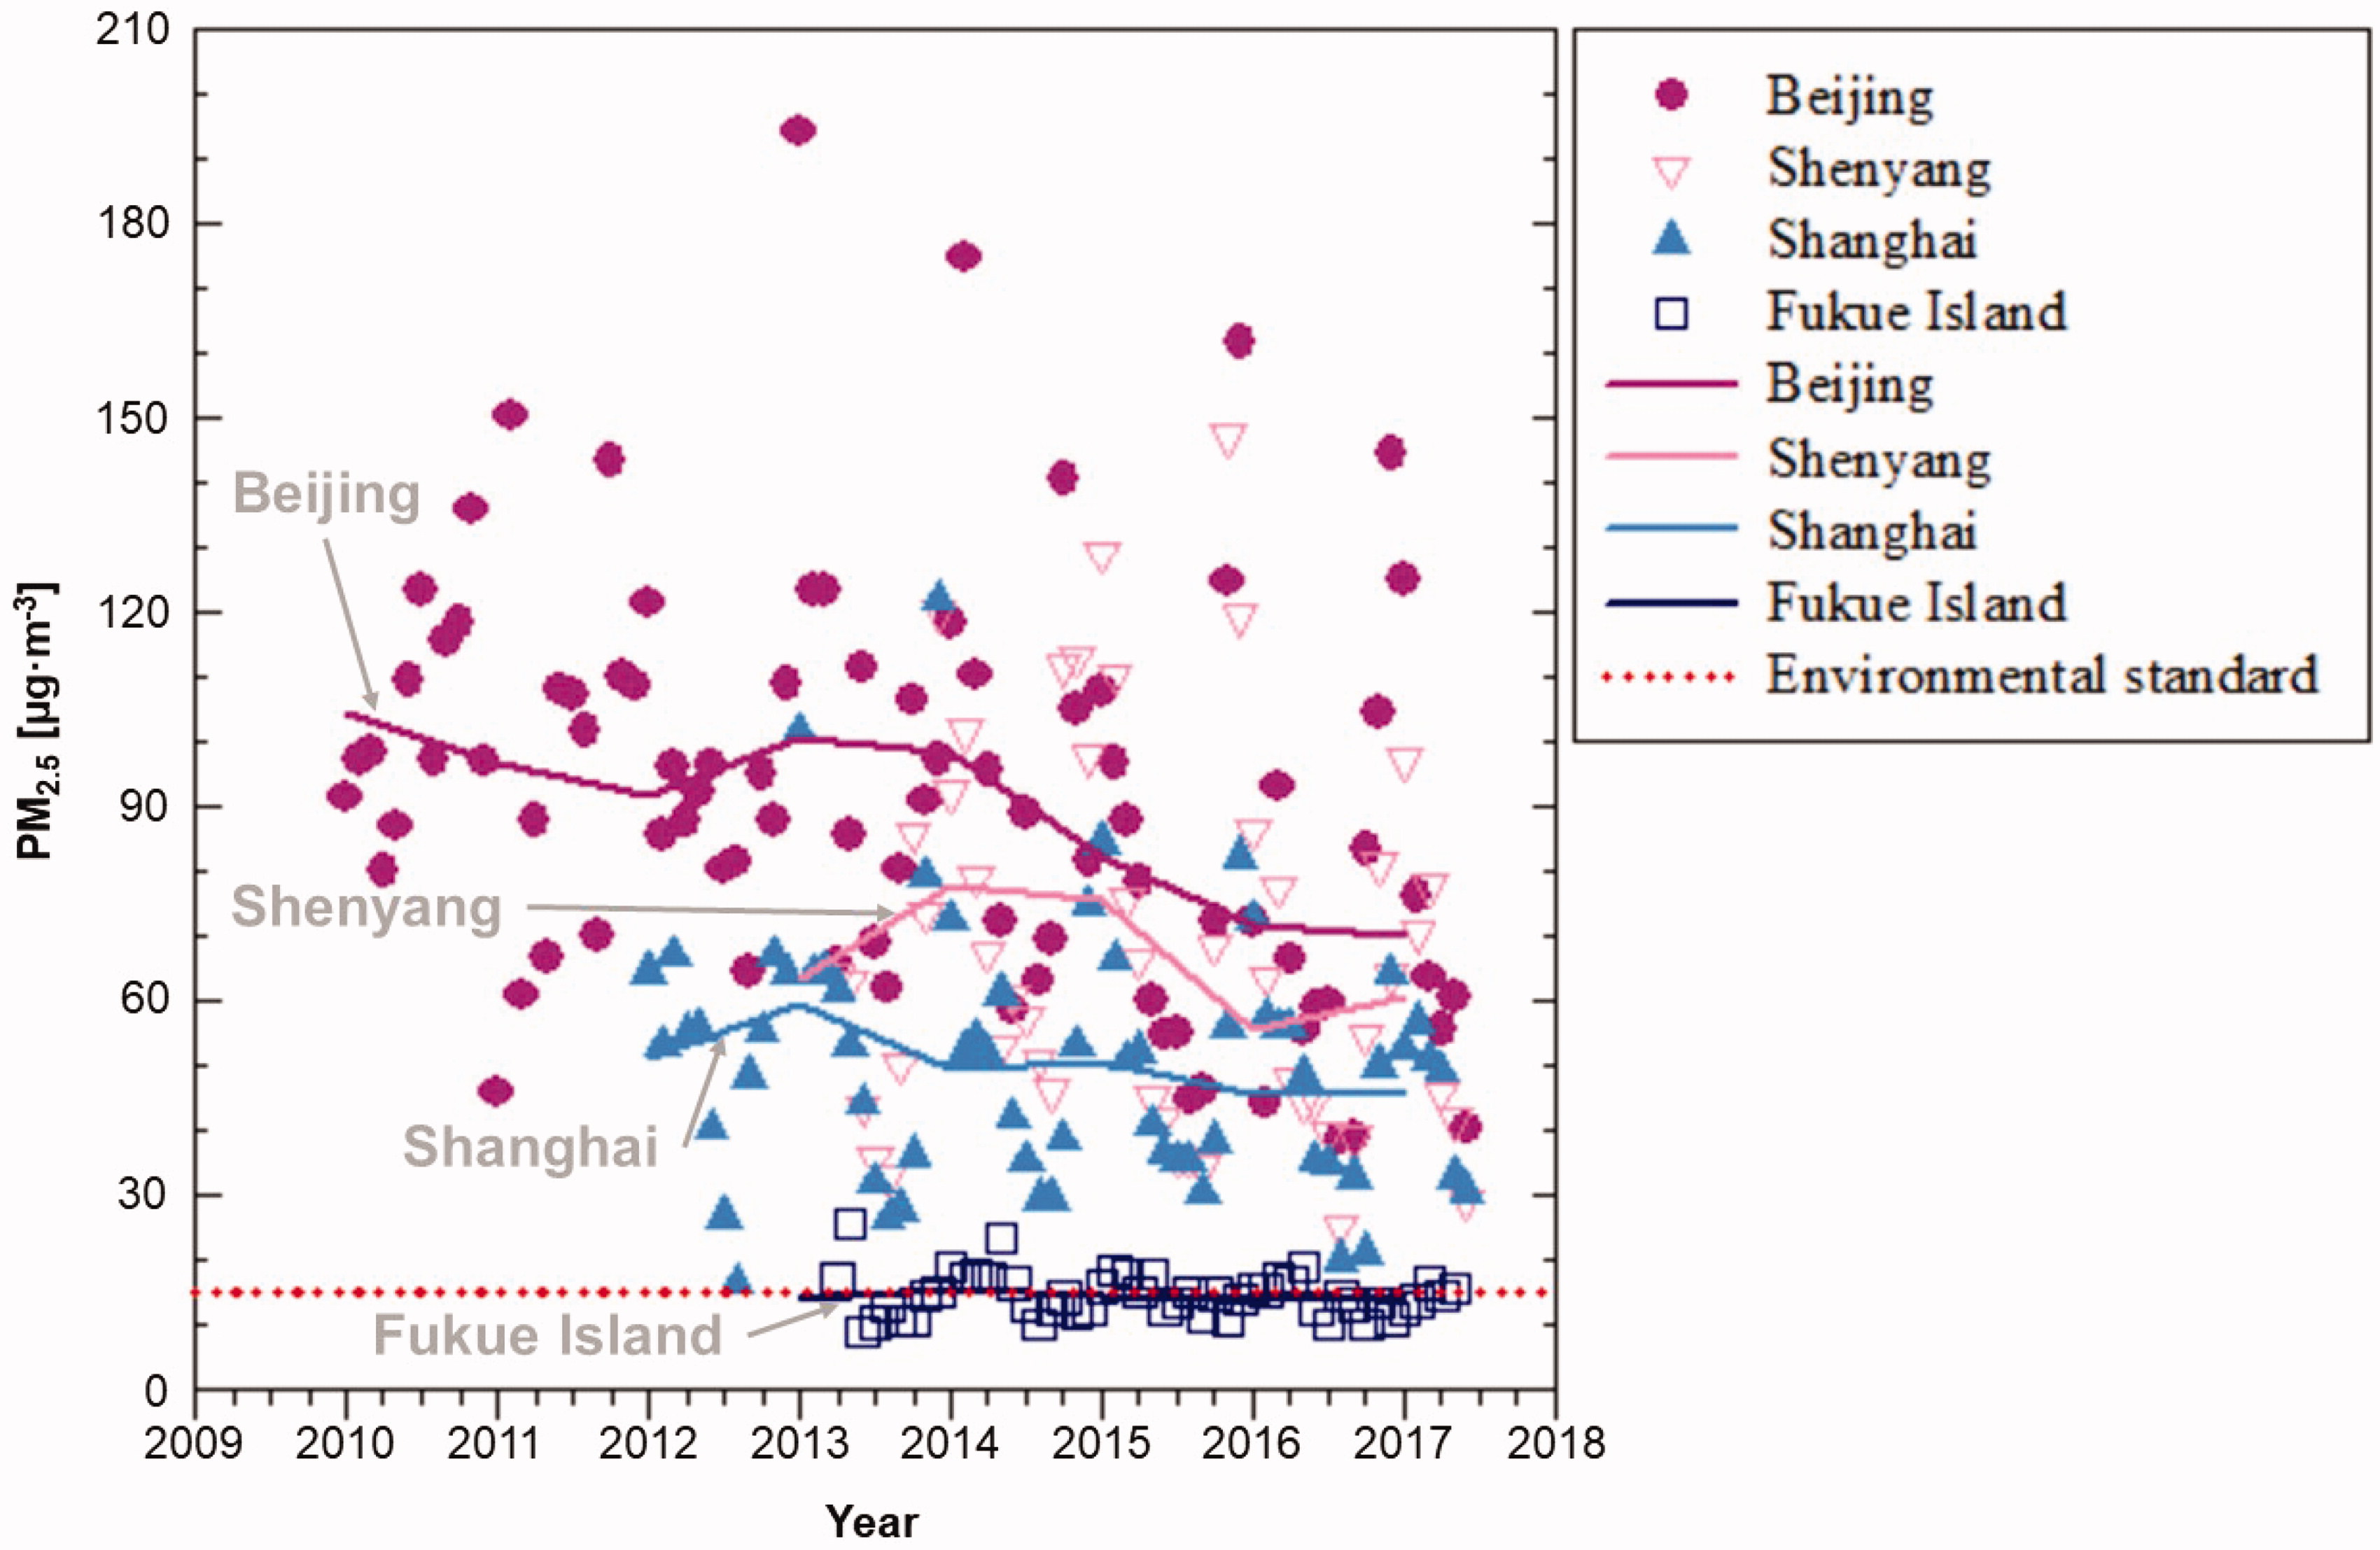
Fig. 1.
The monthly average (marked by symbols) and annual average (marked by lines) PM2.5 concentrations between 2010 and 2017. The PM2.5 concentration data in the upstream region (Beijing, Shenyang and Shanghai) were taken from the U.S. Embassy and Consulates in China (http://www.stateair.net/web/post/1/1.html), and those in the downstream region (Fukue Island) were measured by the Ministry of the Environment, Japan (http://nagasaki-taiki.aa0.netvolante.jp/graph/monthly). The annual standard for PM2.5 in Japan (marked by red dots) is ≤15 µg·m−3.
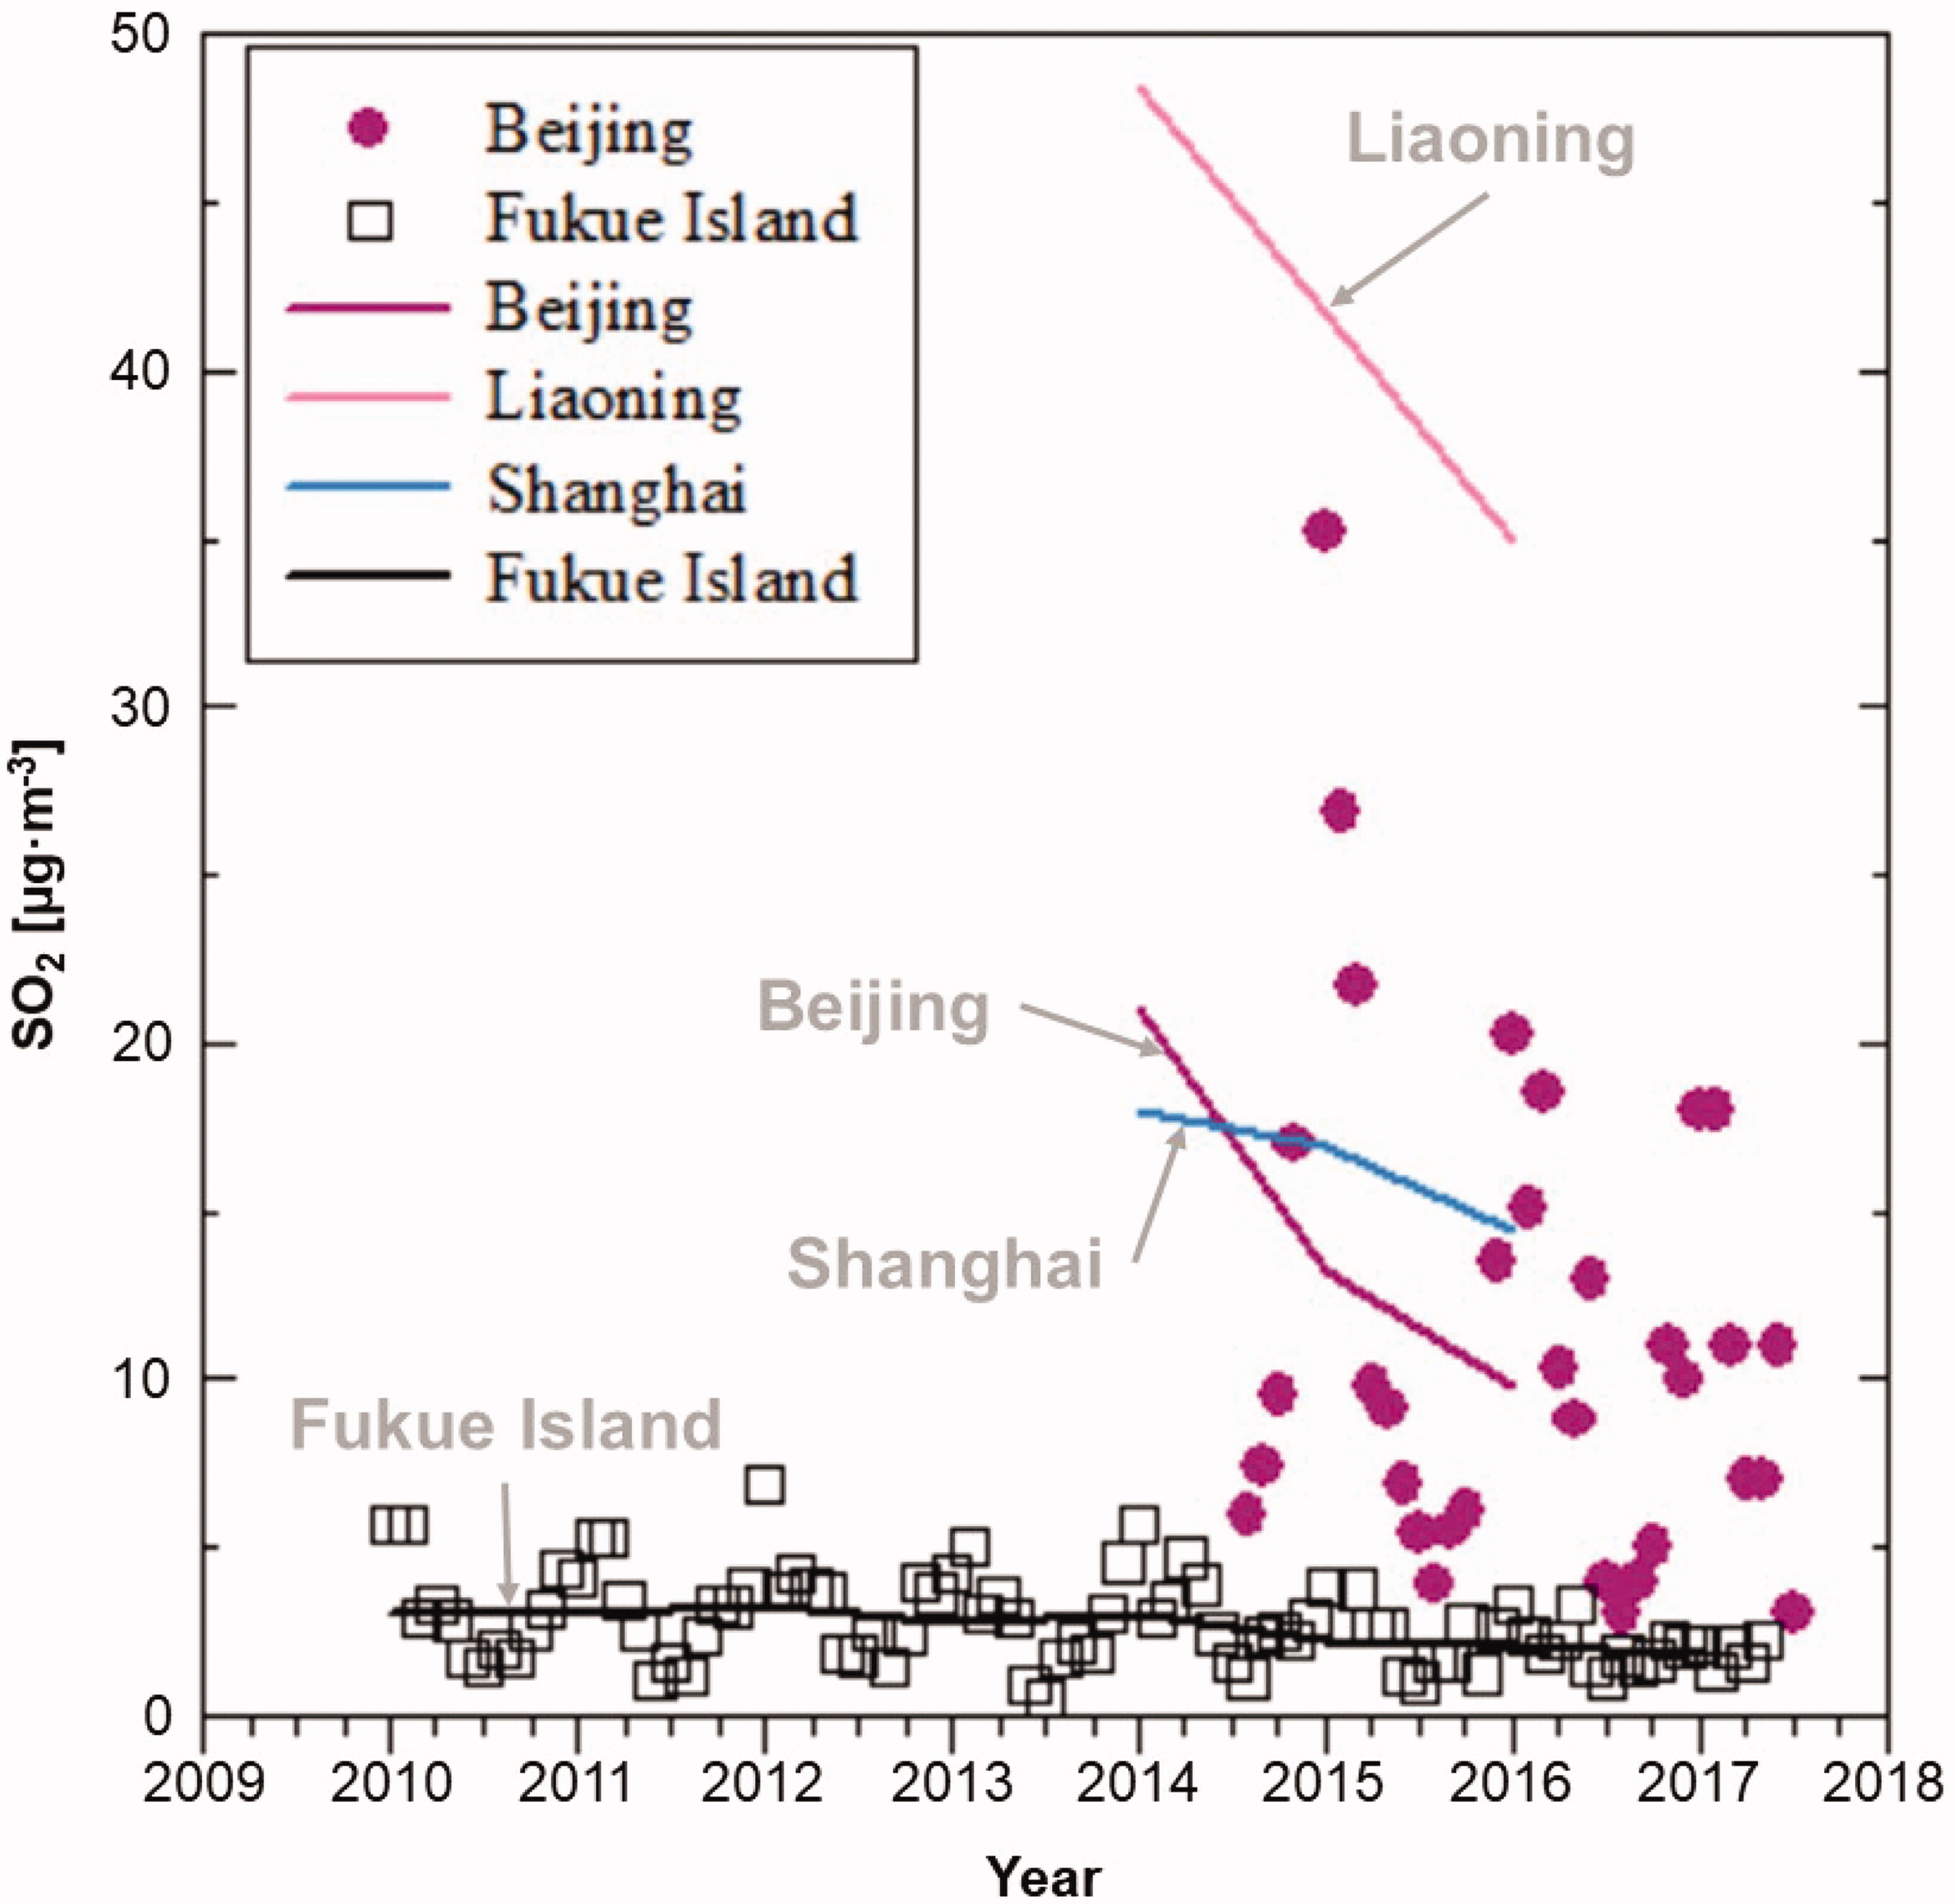
Fig. 2.
The monthly average (marked by symbols) and annual average (marked by lines) SO2 concentration data between 2010 and 2017. The monthly average SO2 concentration data in Beijing were taken from the Beijing Environmental Protection Bureau (http://www.bjepb.gov.cn/bjhrb/xxgk/ywdt/hjzlzk/dqhjzl/index.html), and the annual average SO2 concentration data in Beijing, Liaoning and Shanghai were reported by Song et al. (2017). The monthly and annual average SO2 concentrations on Fukue Island were measured by the Ministry of the Environment, Japan (http://nagasaki-taiki.aa0.netvolante.jp/graph/monthly).
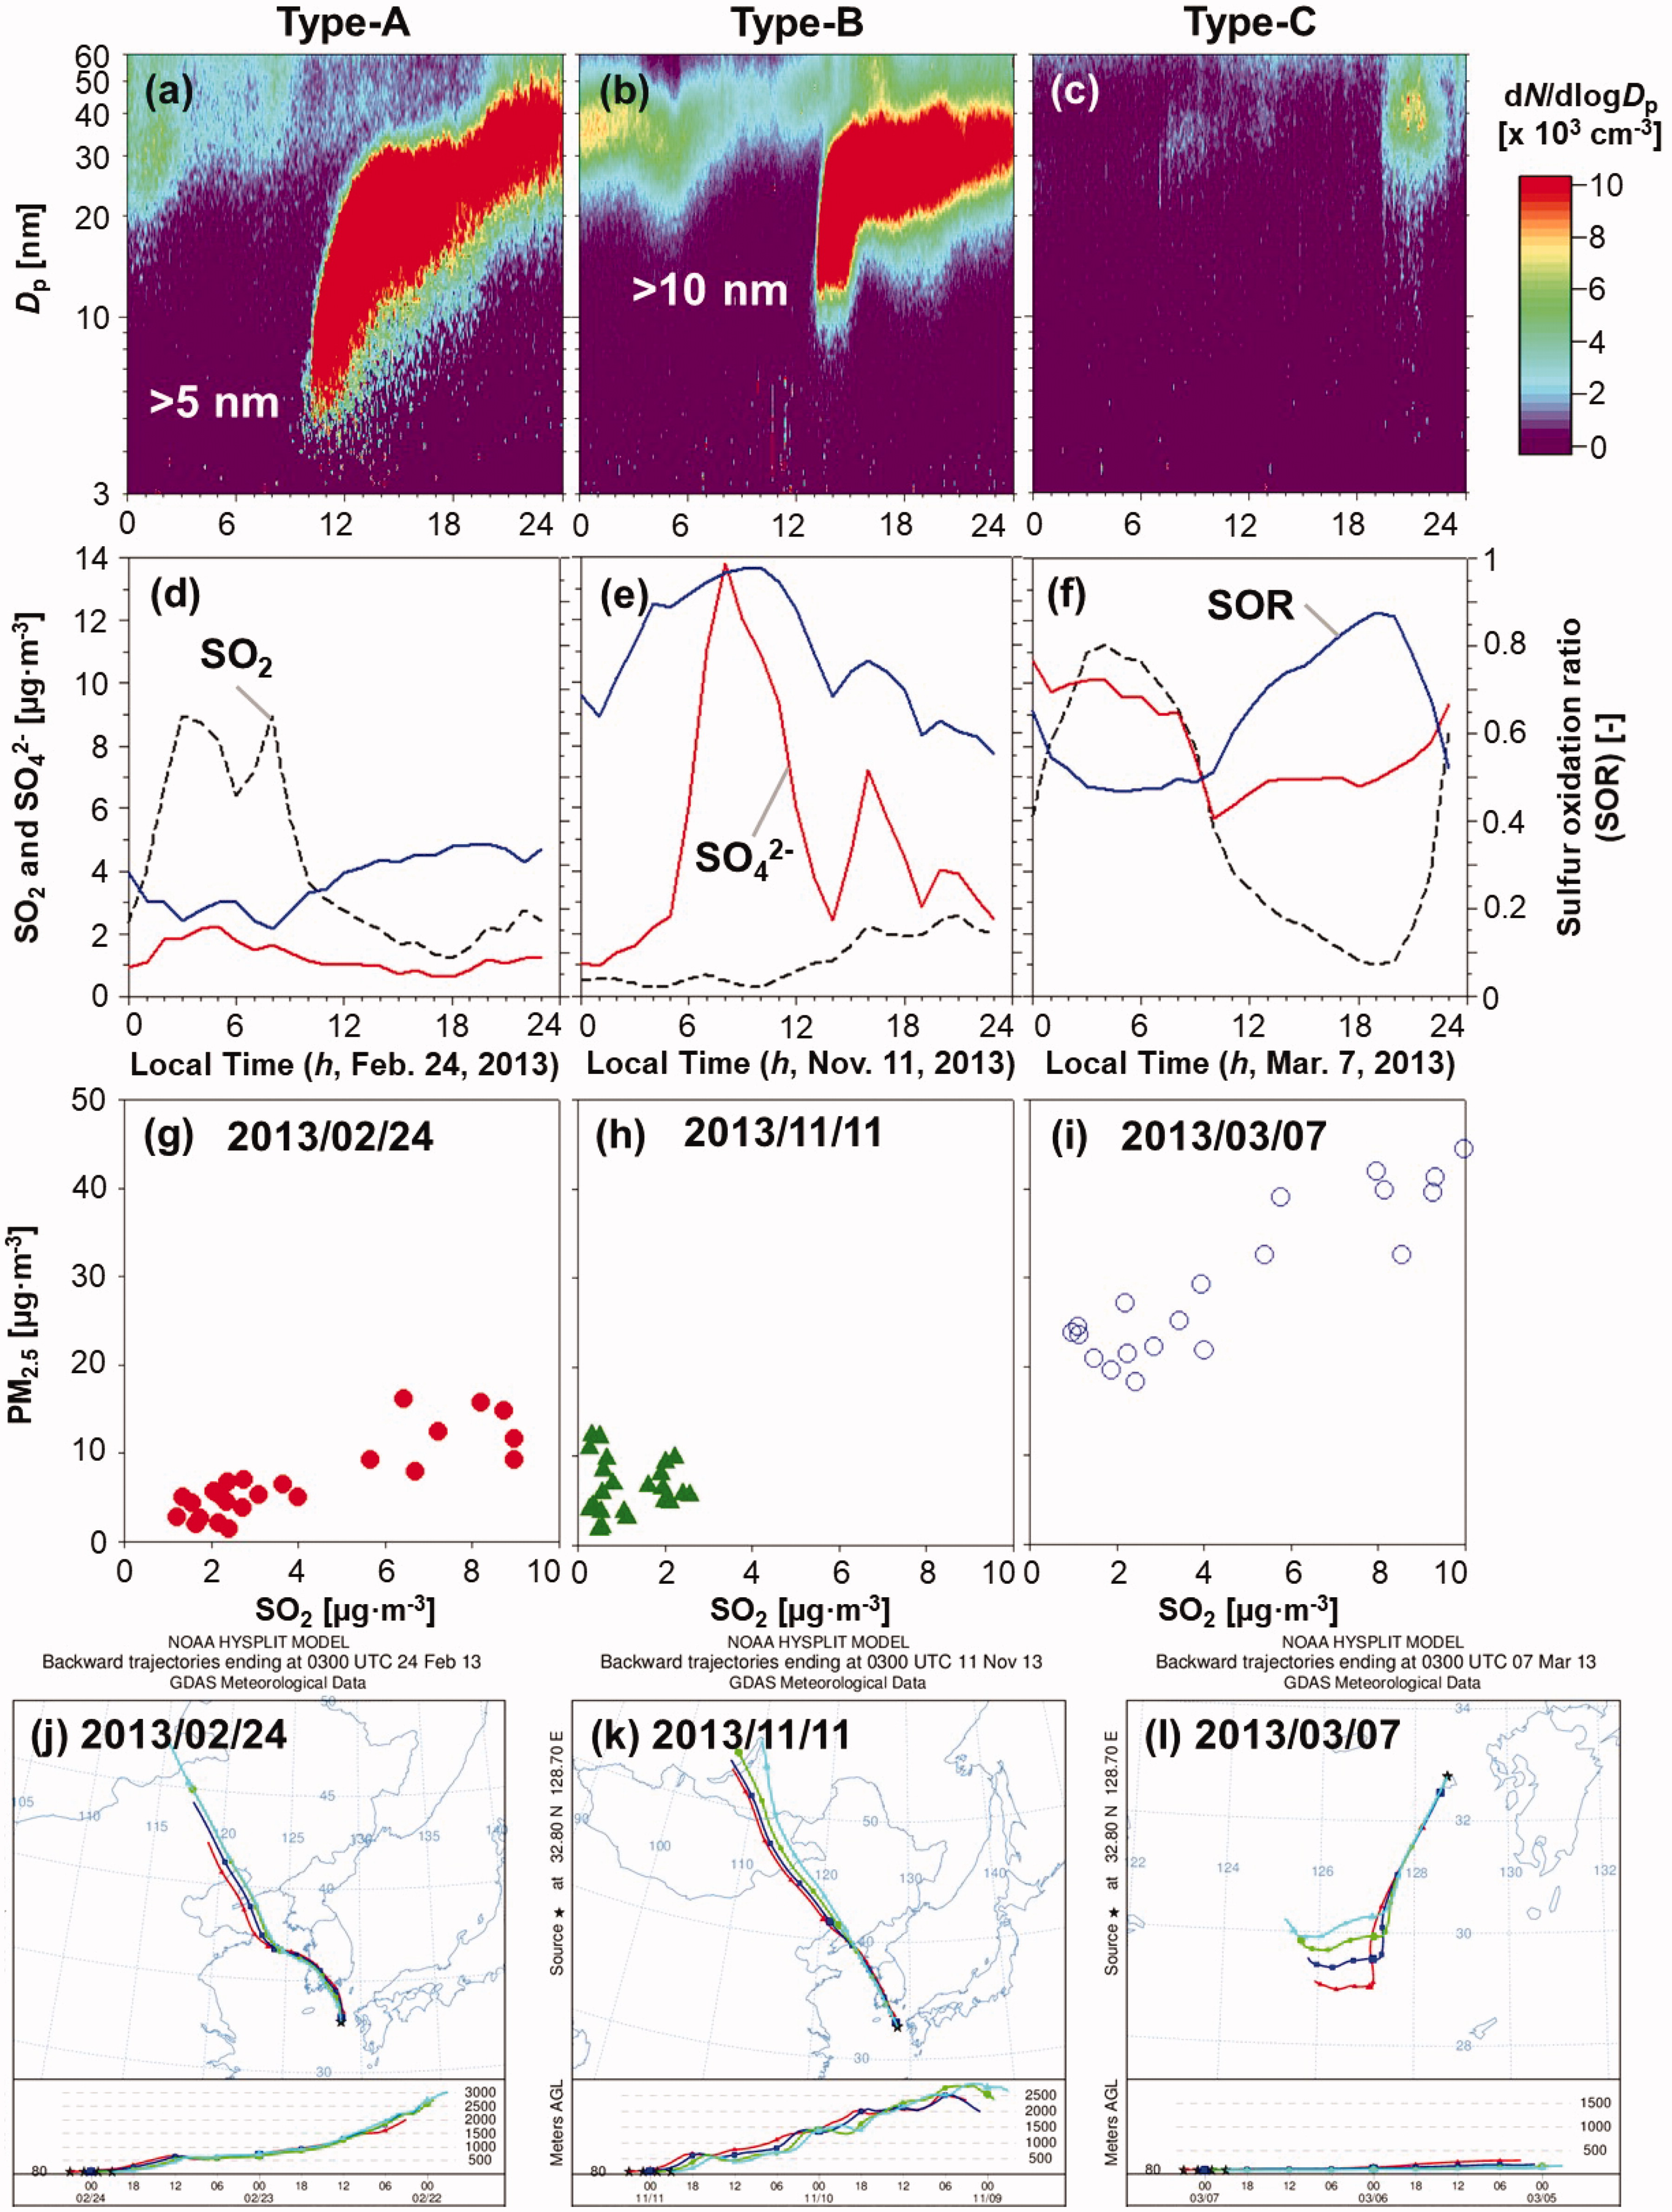
Fig. 3.
The classification of NPF and growth events on Fukue Island, Japan, divided into three types based on the initial stage of the particle formation process, that is, (a) starting from sub-10 nm (type-A), (b) starting from >10 nm (type-B) and (c) exhibiting no detectable formation or growth (type-C). These typical types were identified using SO2 and SO4 2– concentration data and sulfur oxidation ratio (SOR) values ((d)–(f)). The daily average PM2.5 concentration against the daily average SO2 concentration and NOAA HYSPLIT back trajectory for each day are shown in (g)–(l).
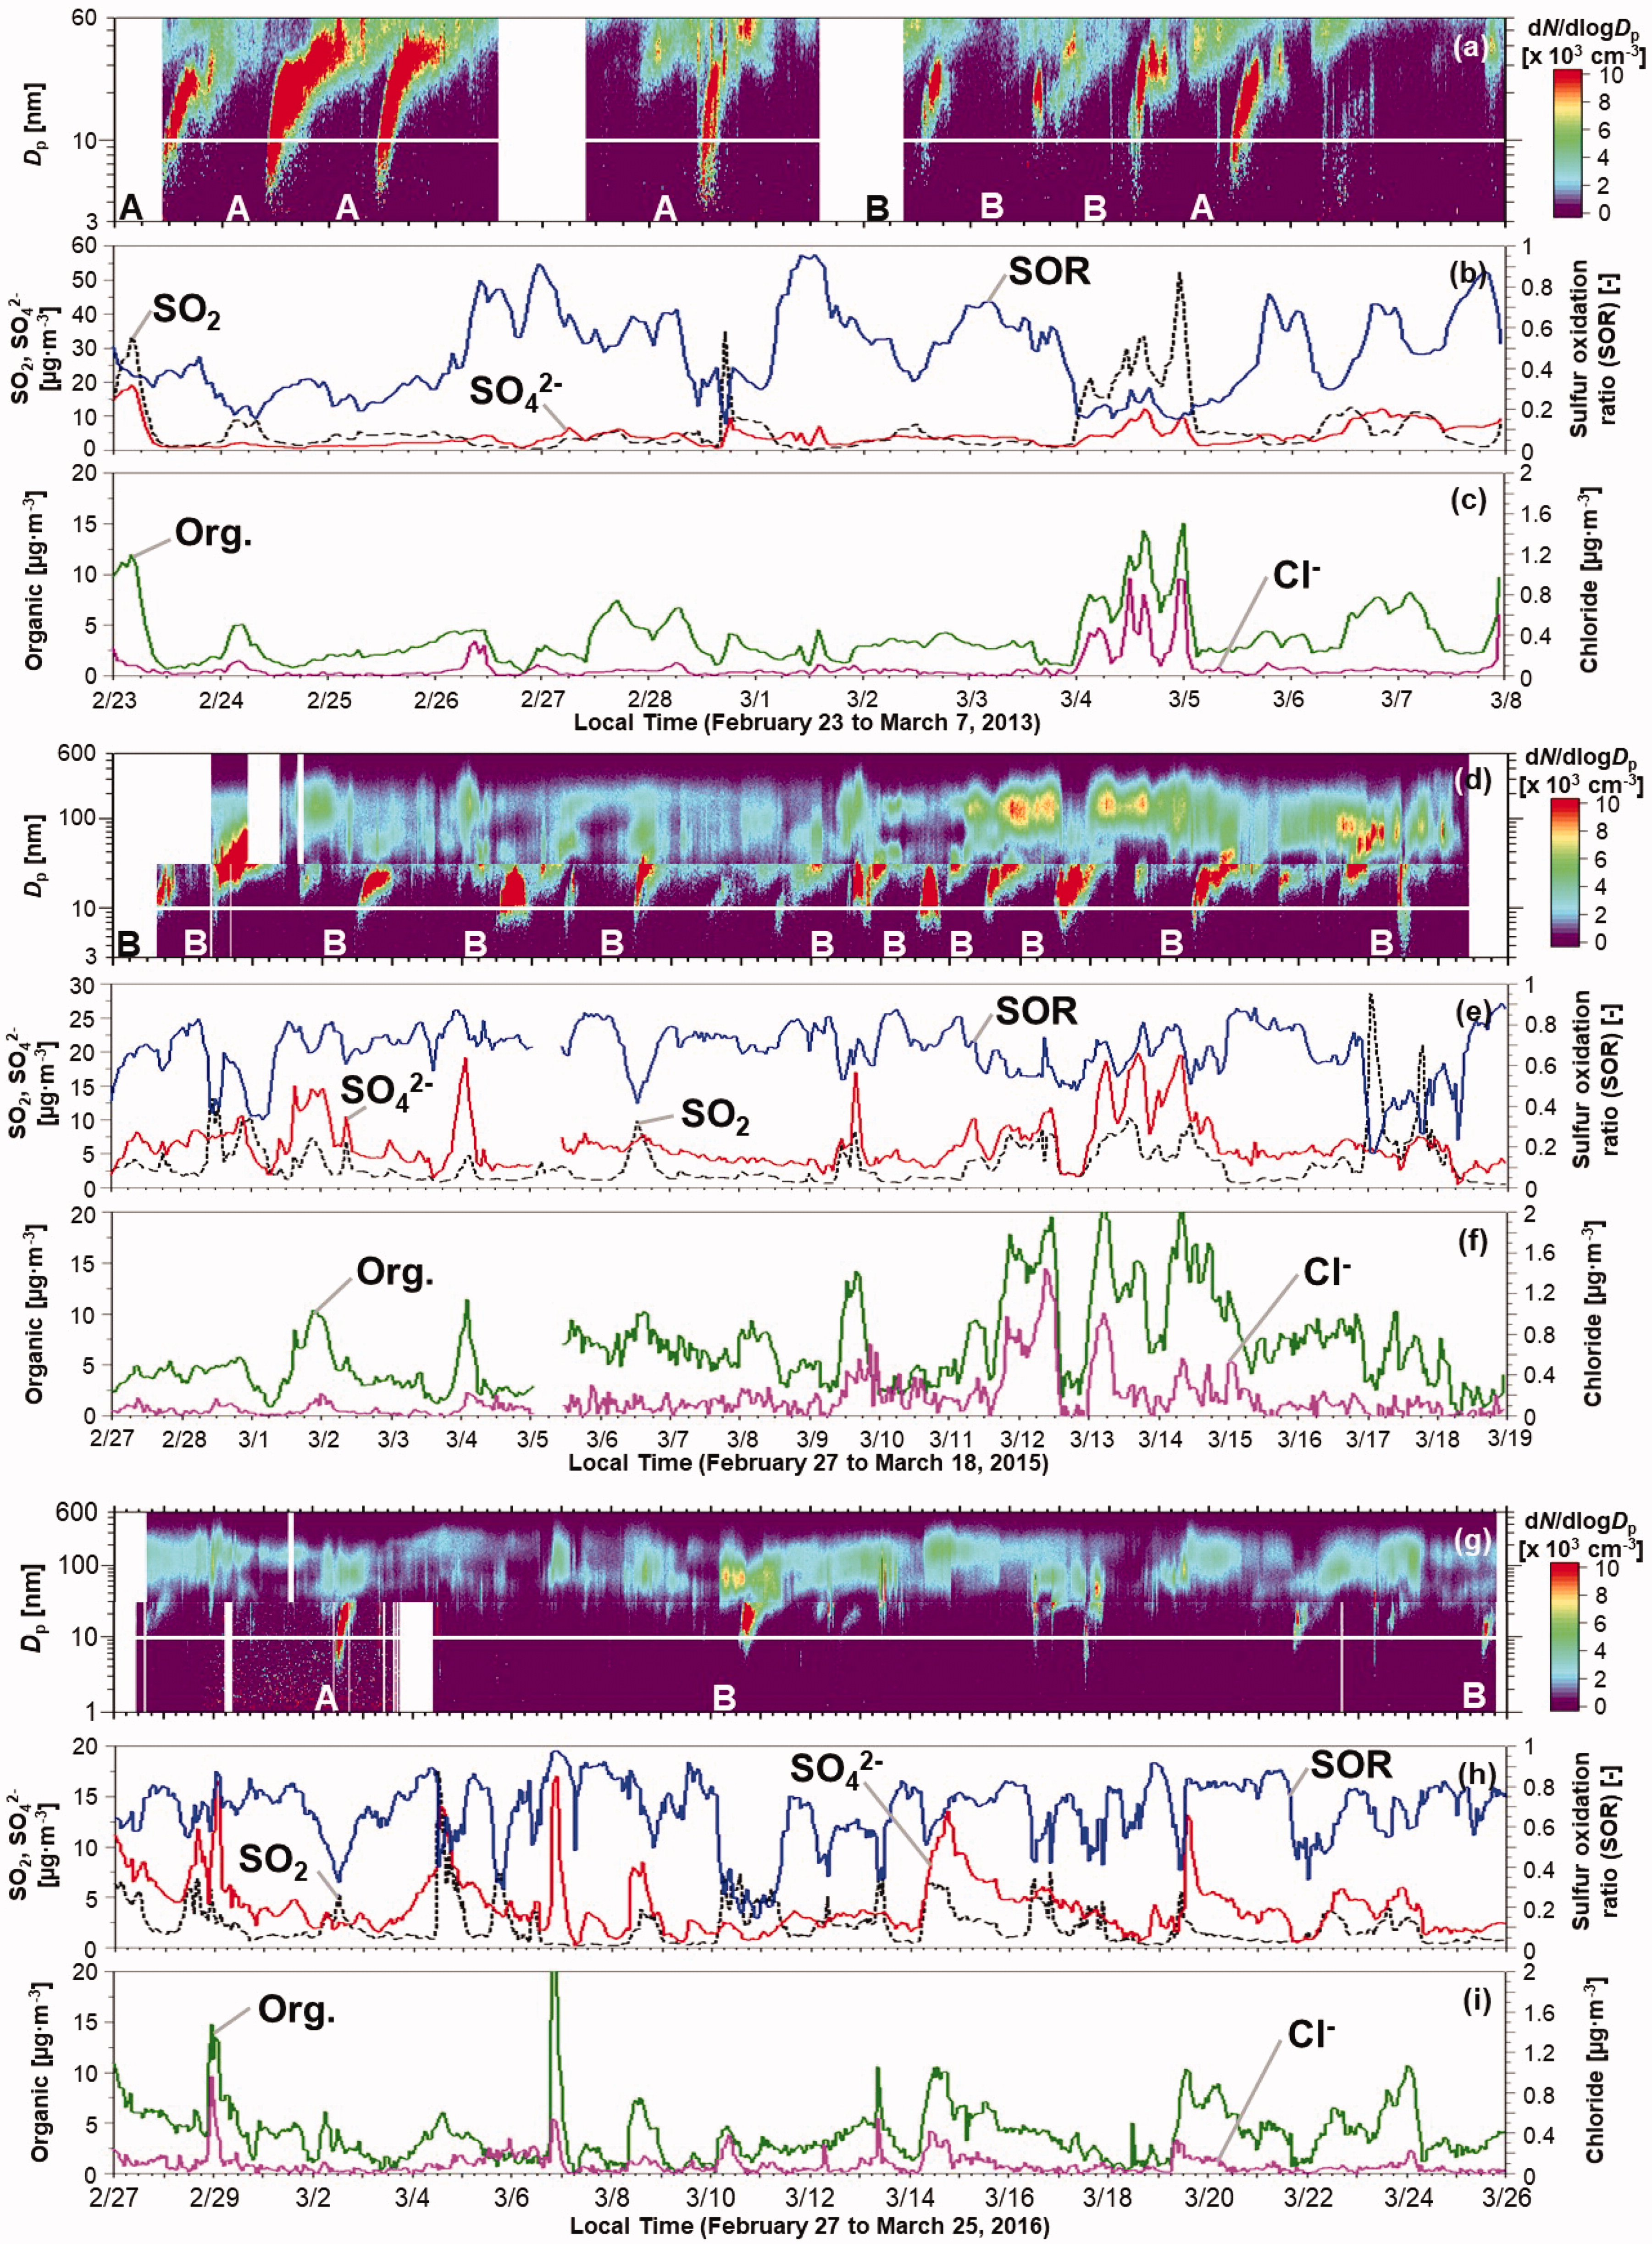
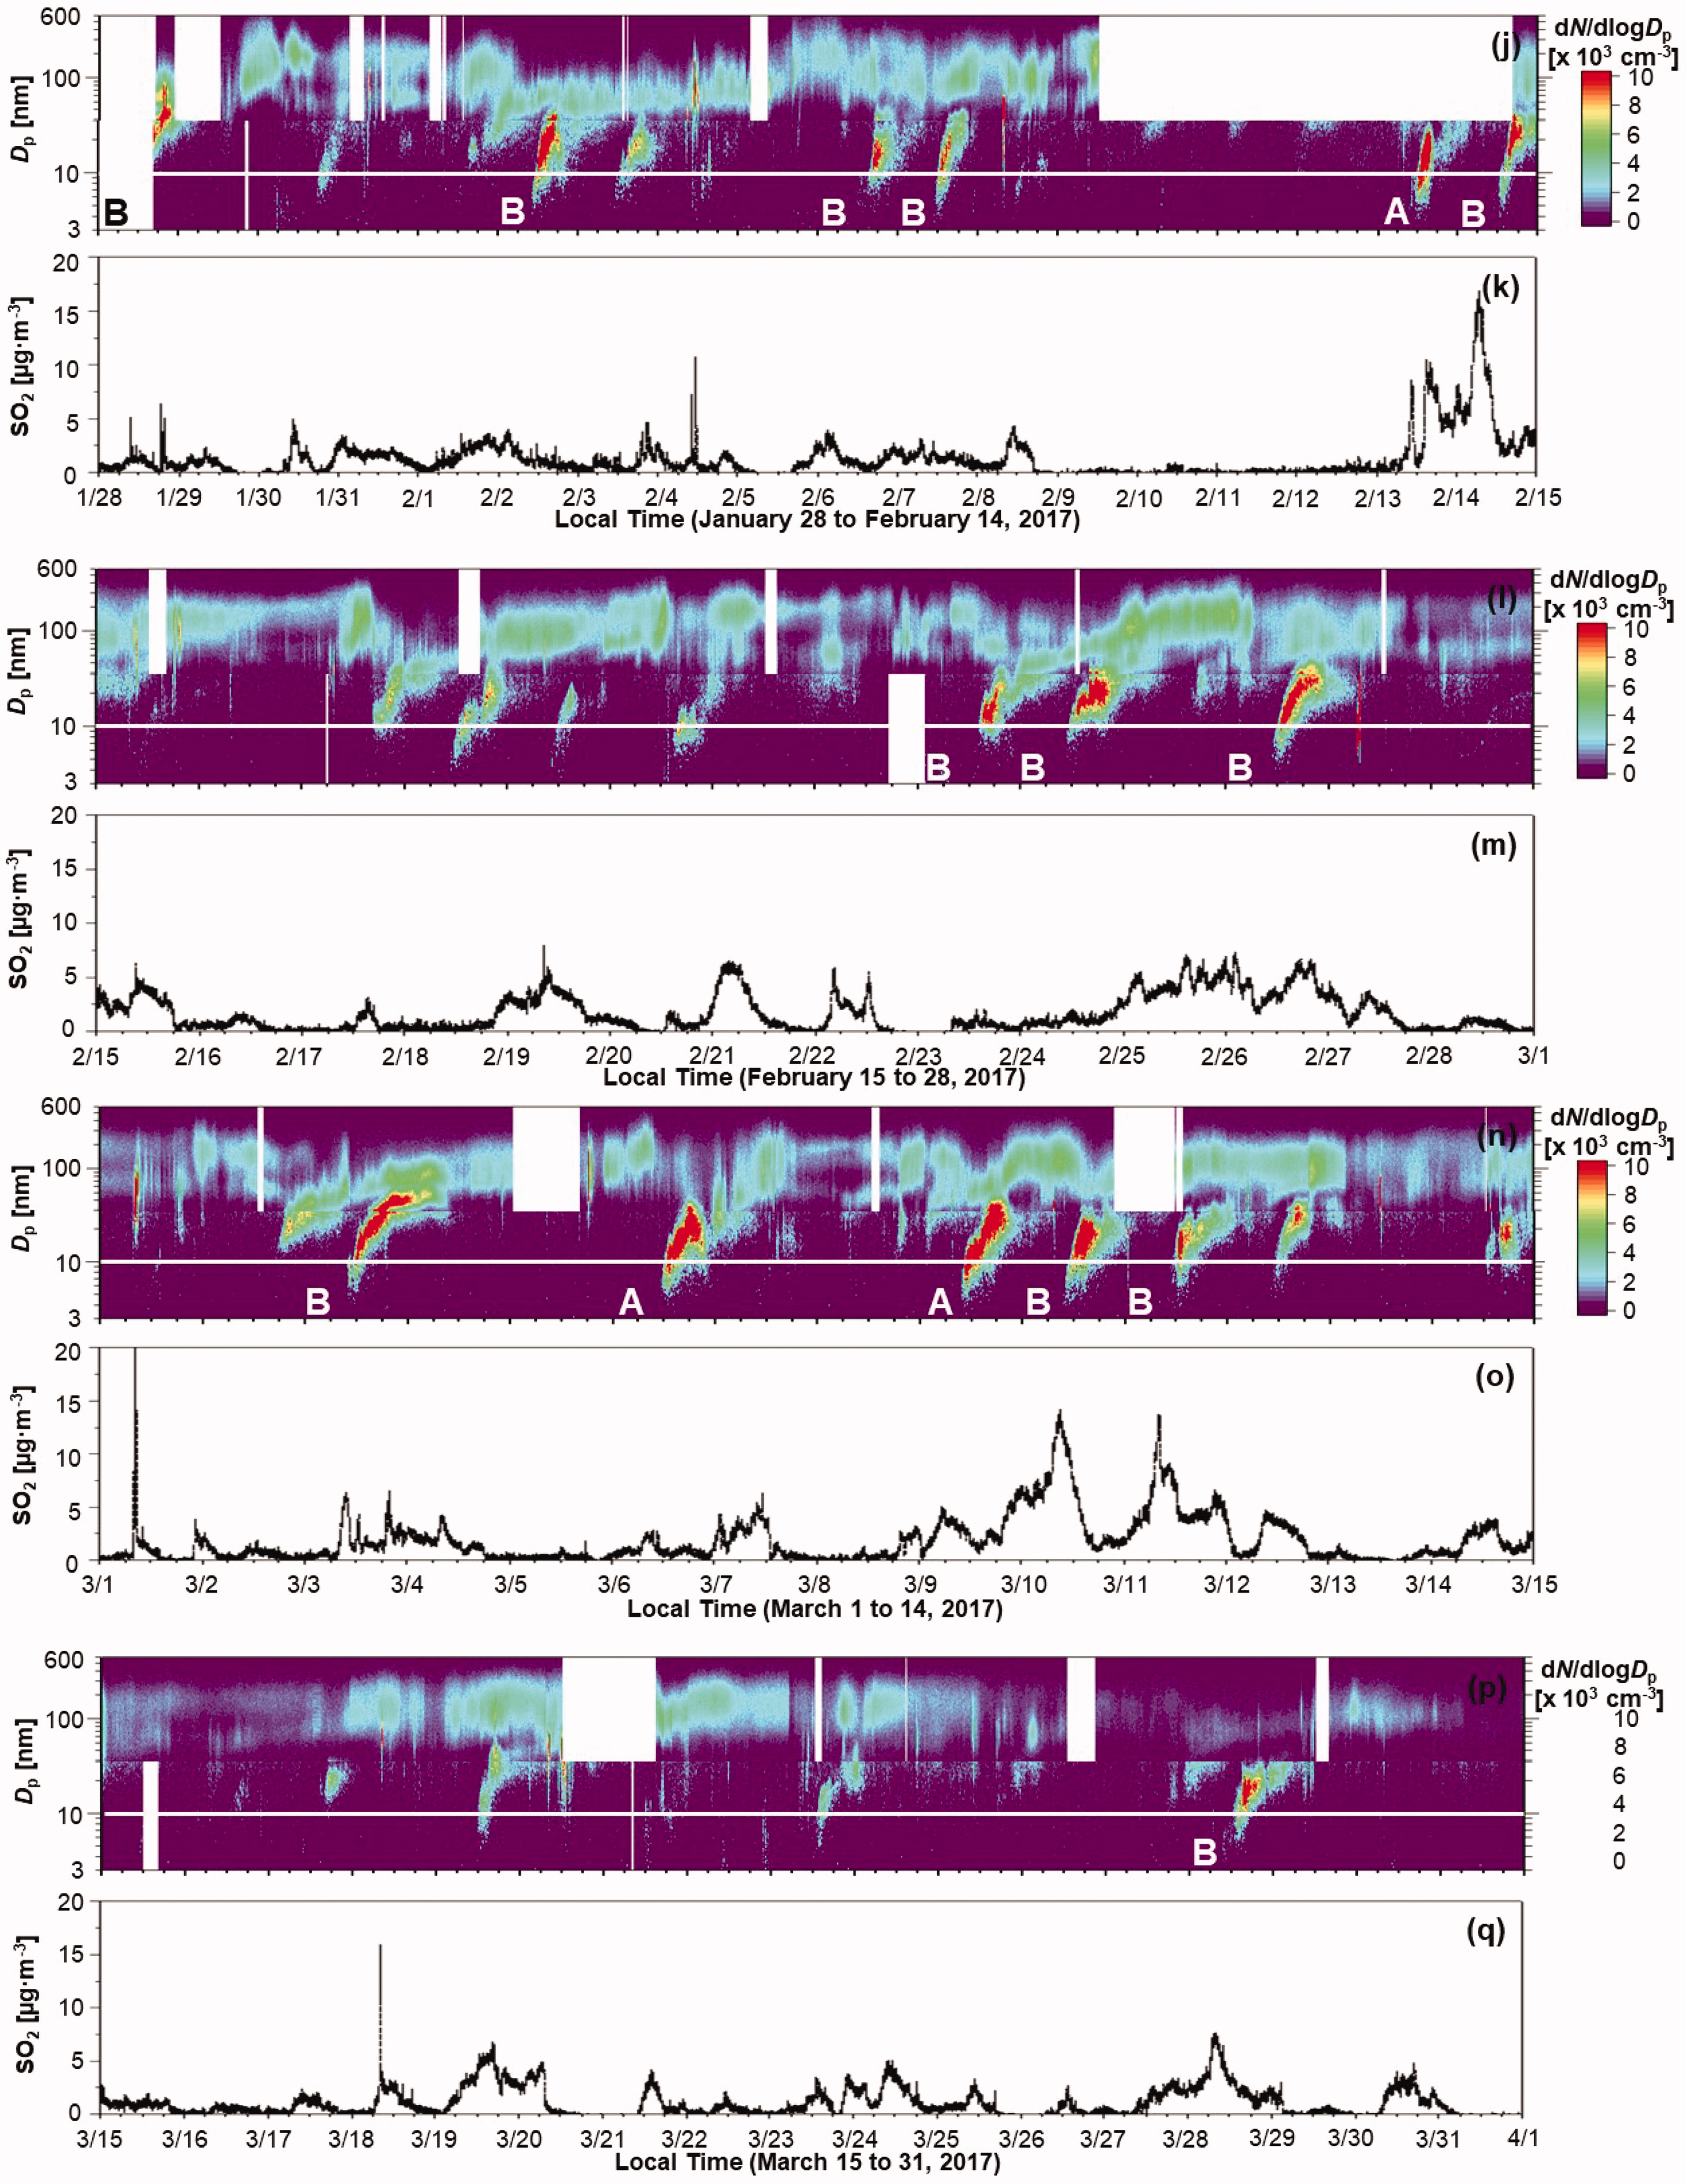
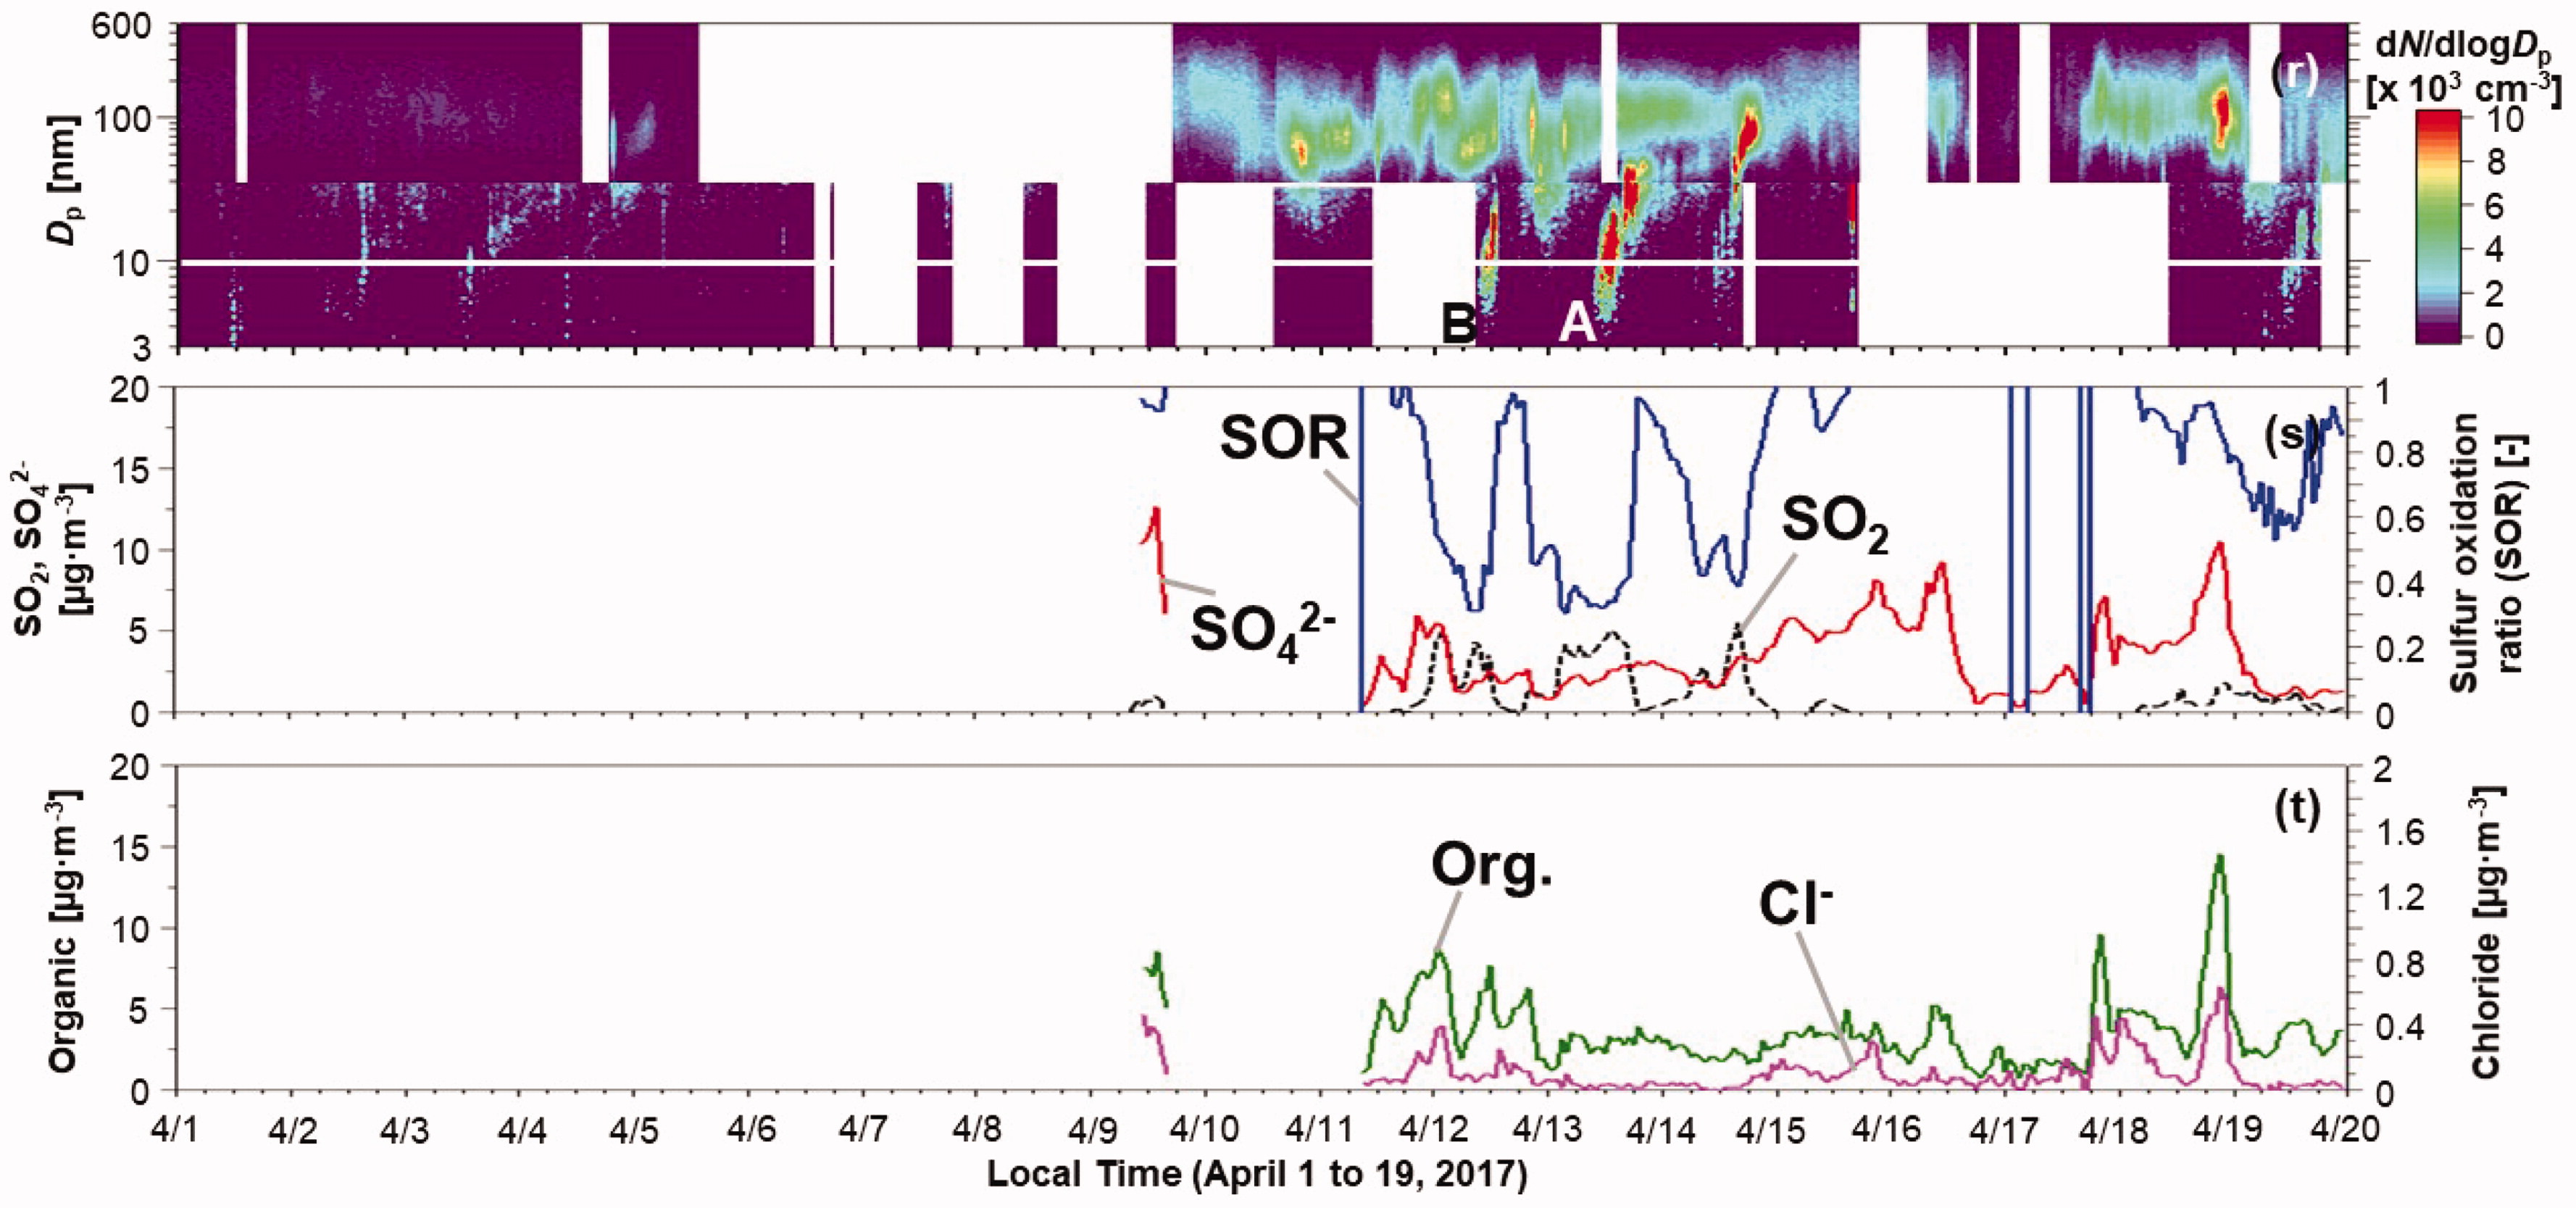
Table 1.
Characteristics of NPF and growth events at the Fukue site.
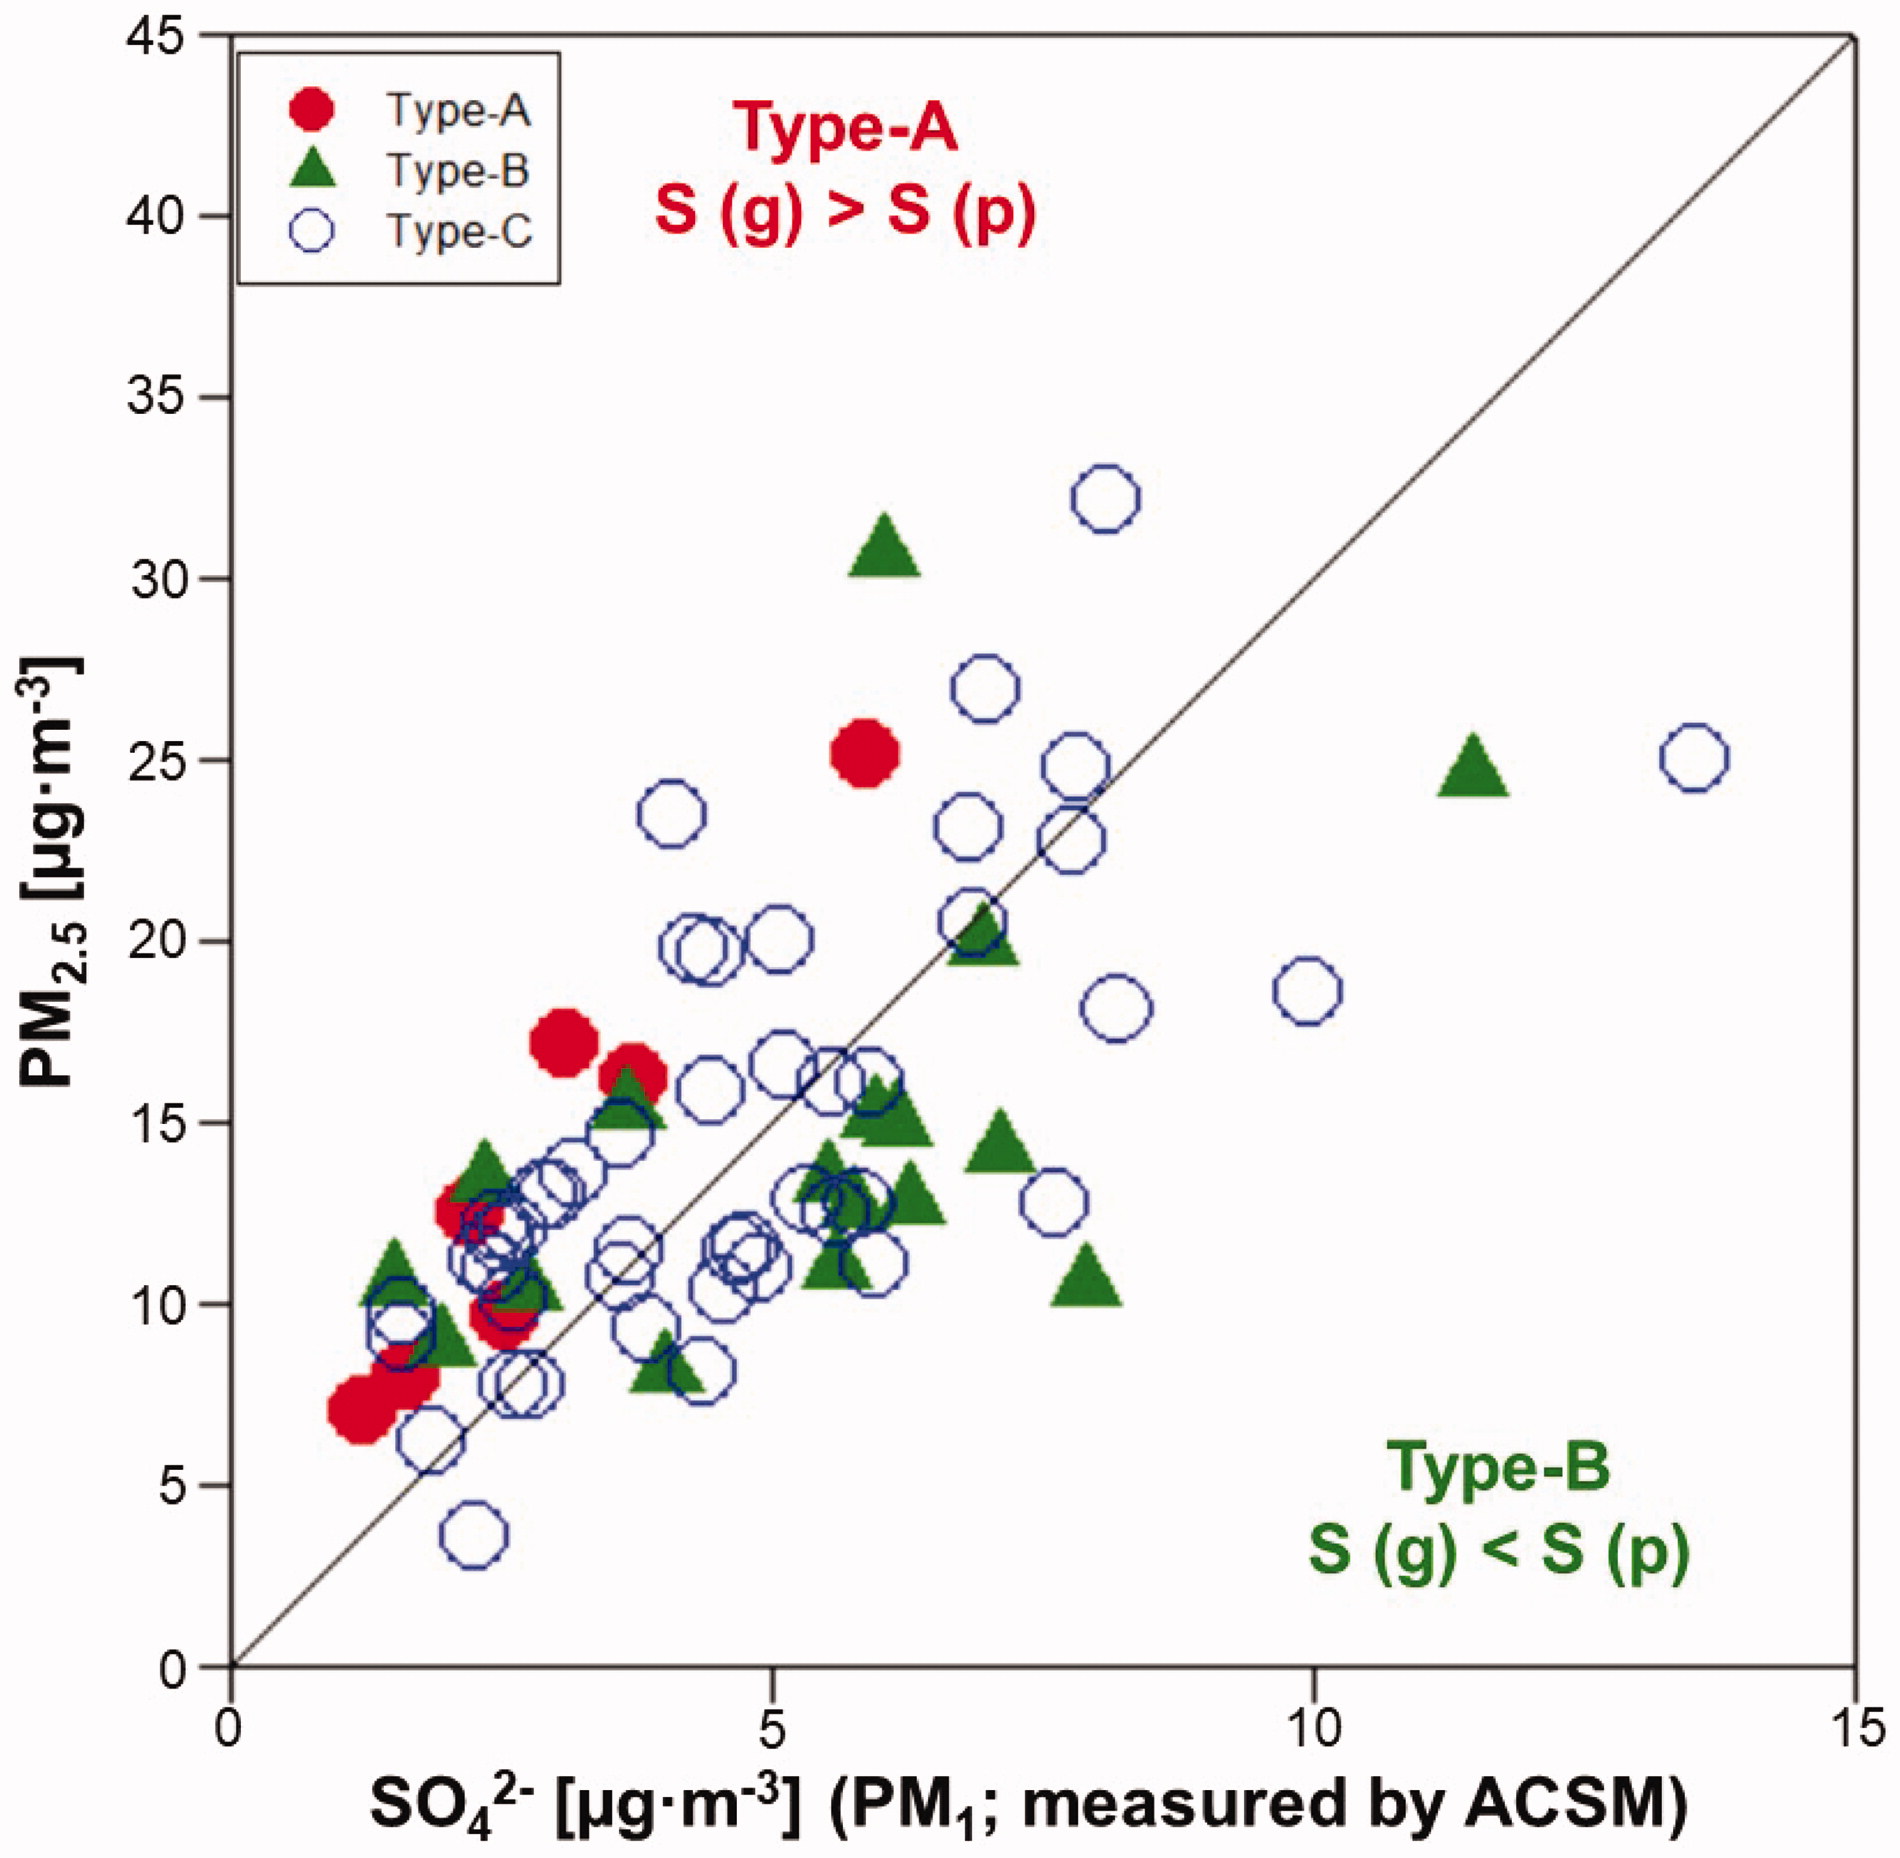
Fig. 5.
The daily average PM2.5 concentration data plotted against the SO4 2– concentration data.
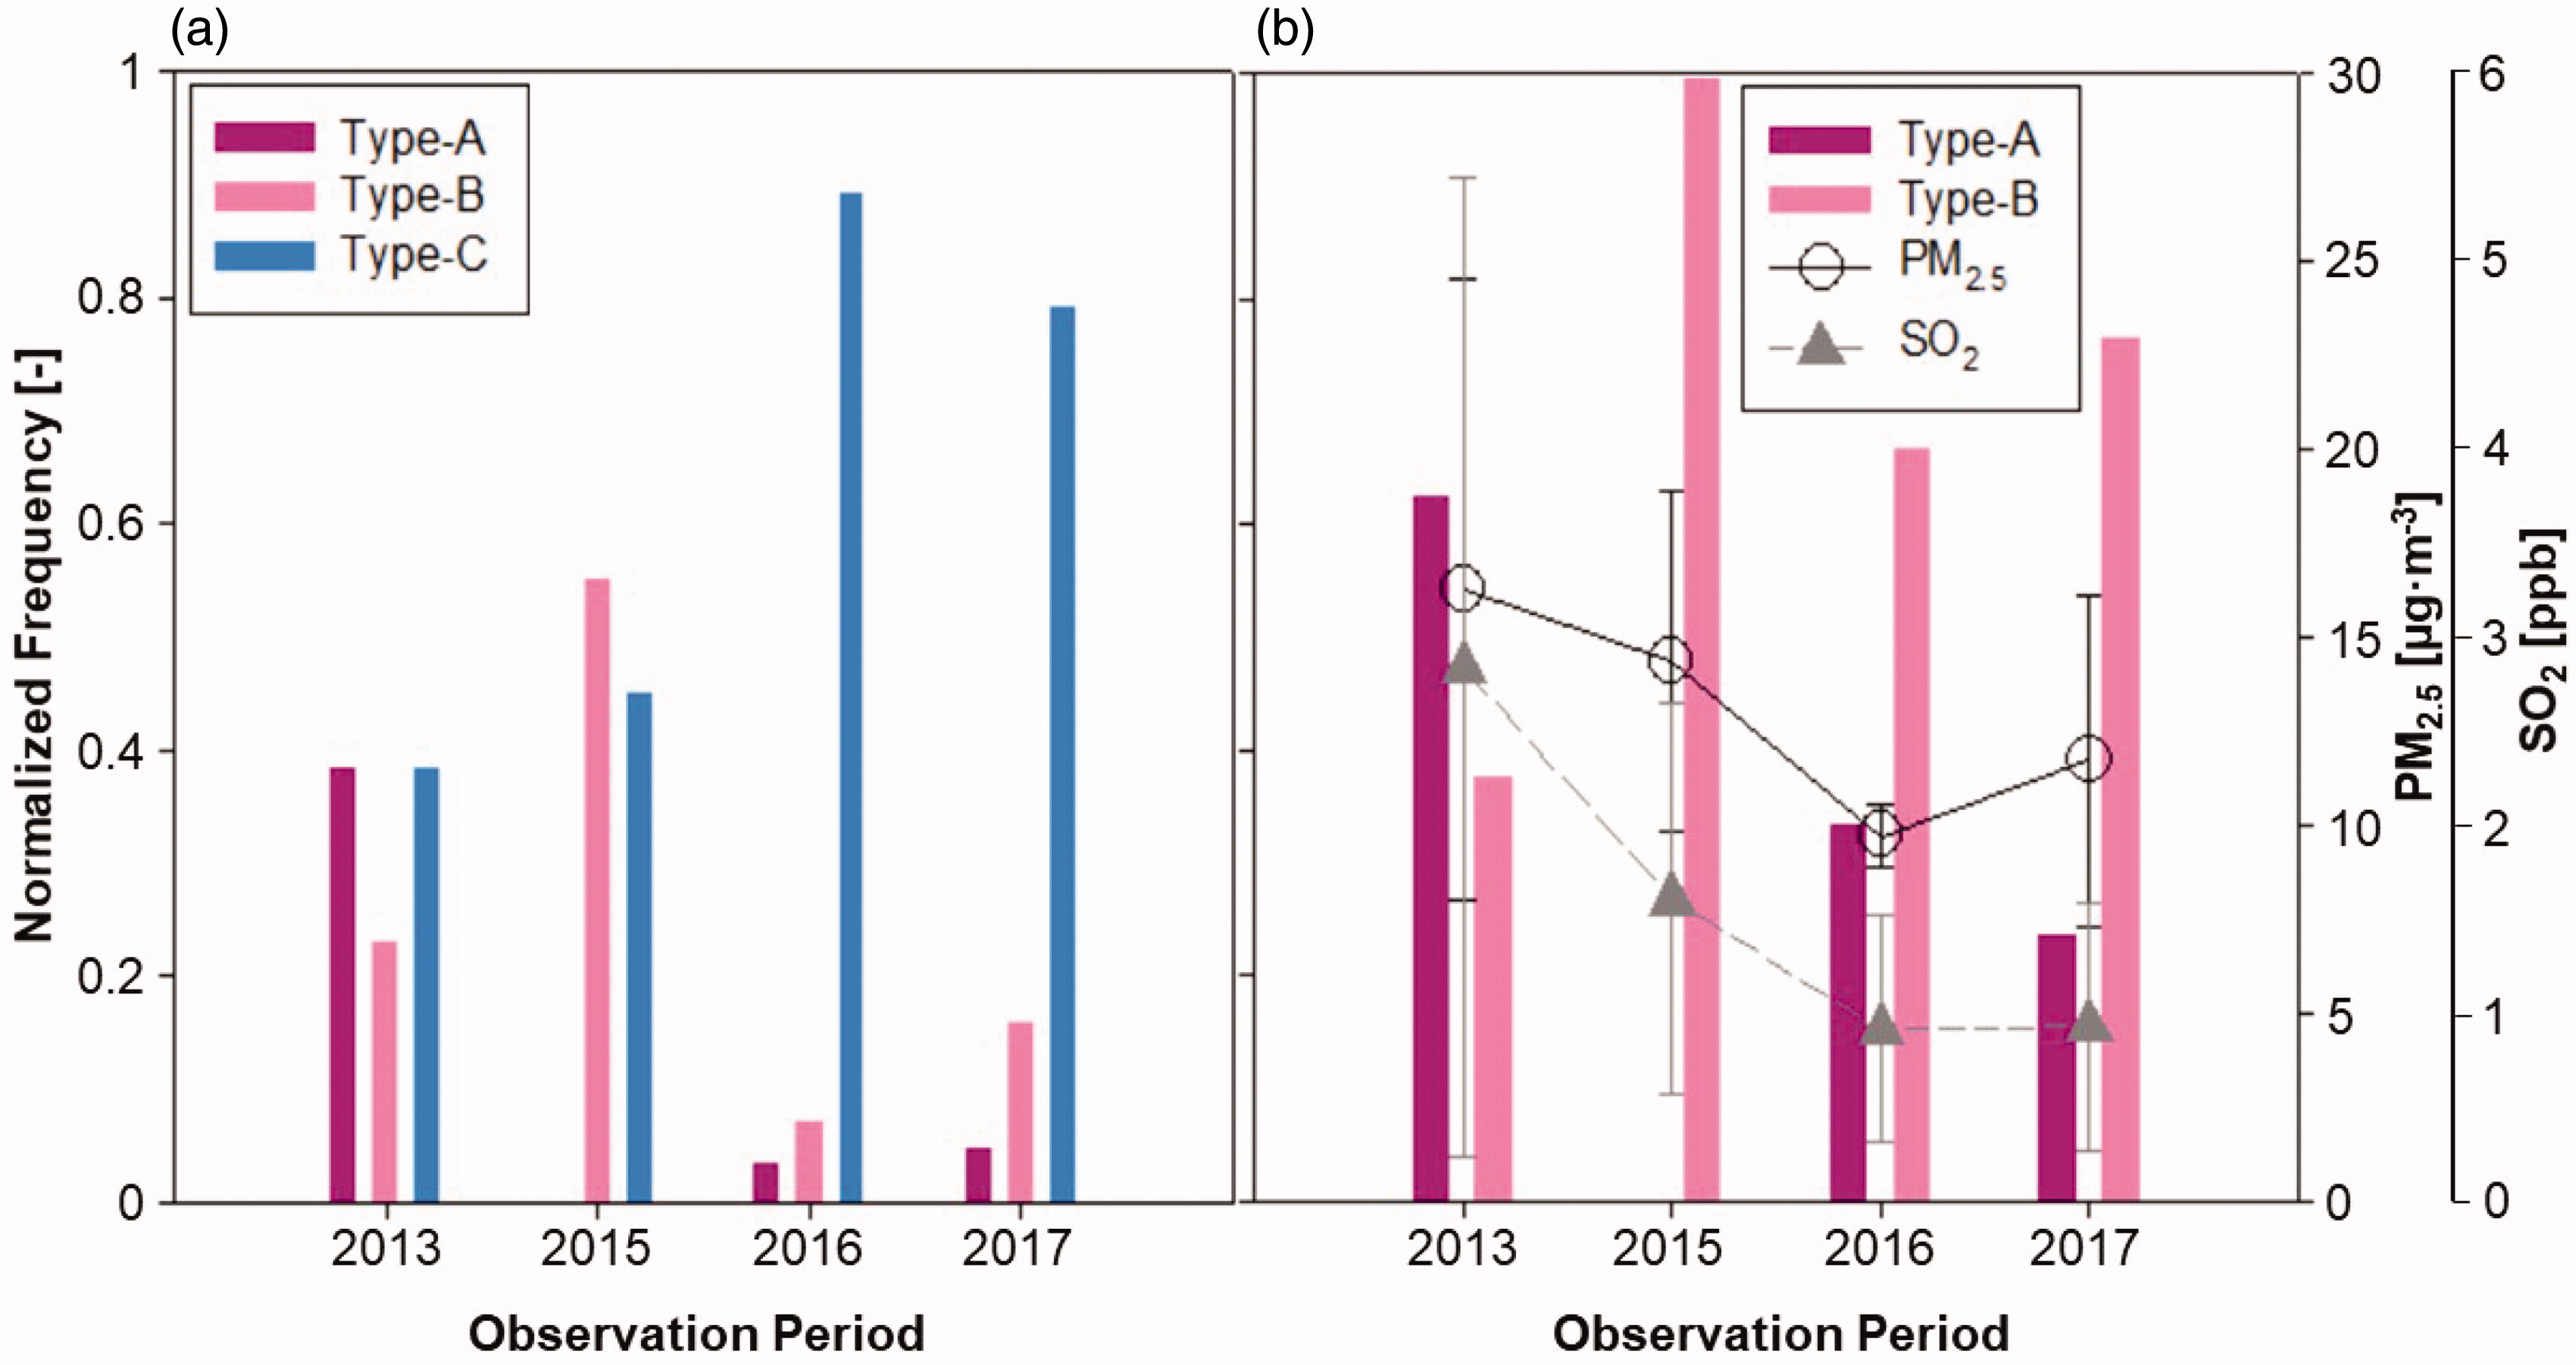
Fig. 6.
The normalized frequency of NPF on Fukue Island, Japan, (a) on event and non-event days during the observation period and (b) only for the event days; PM2.5 and SO2 concentration data represent the average data in each campaign.
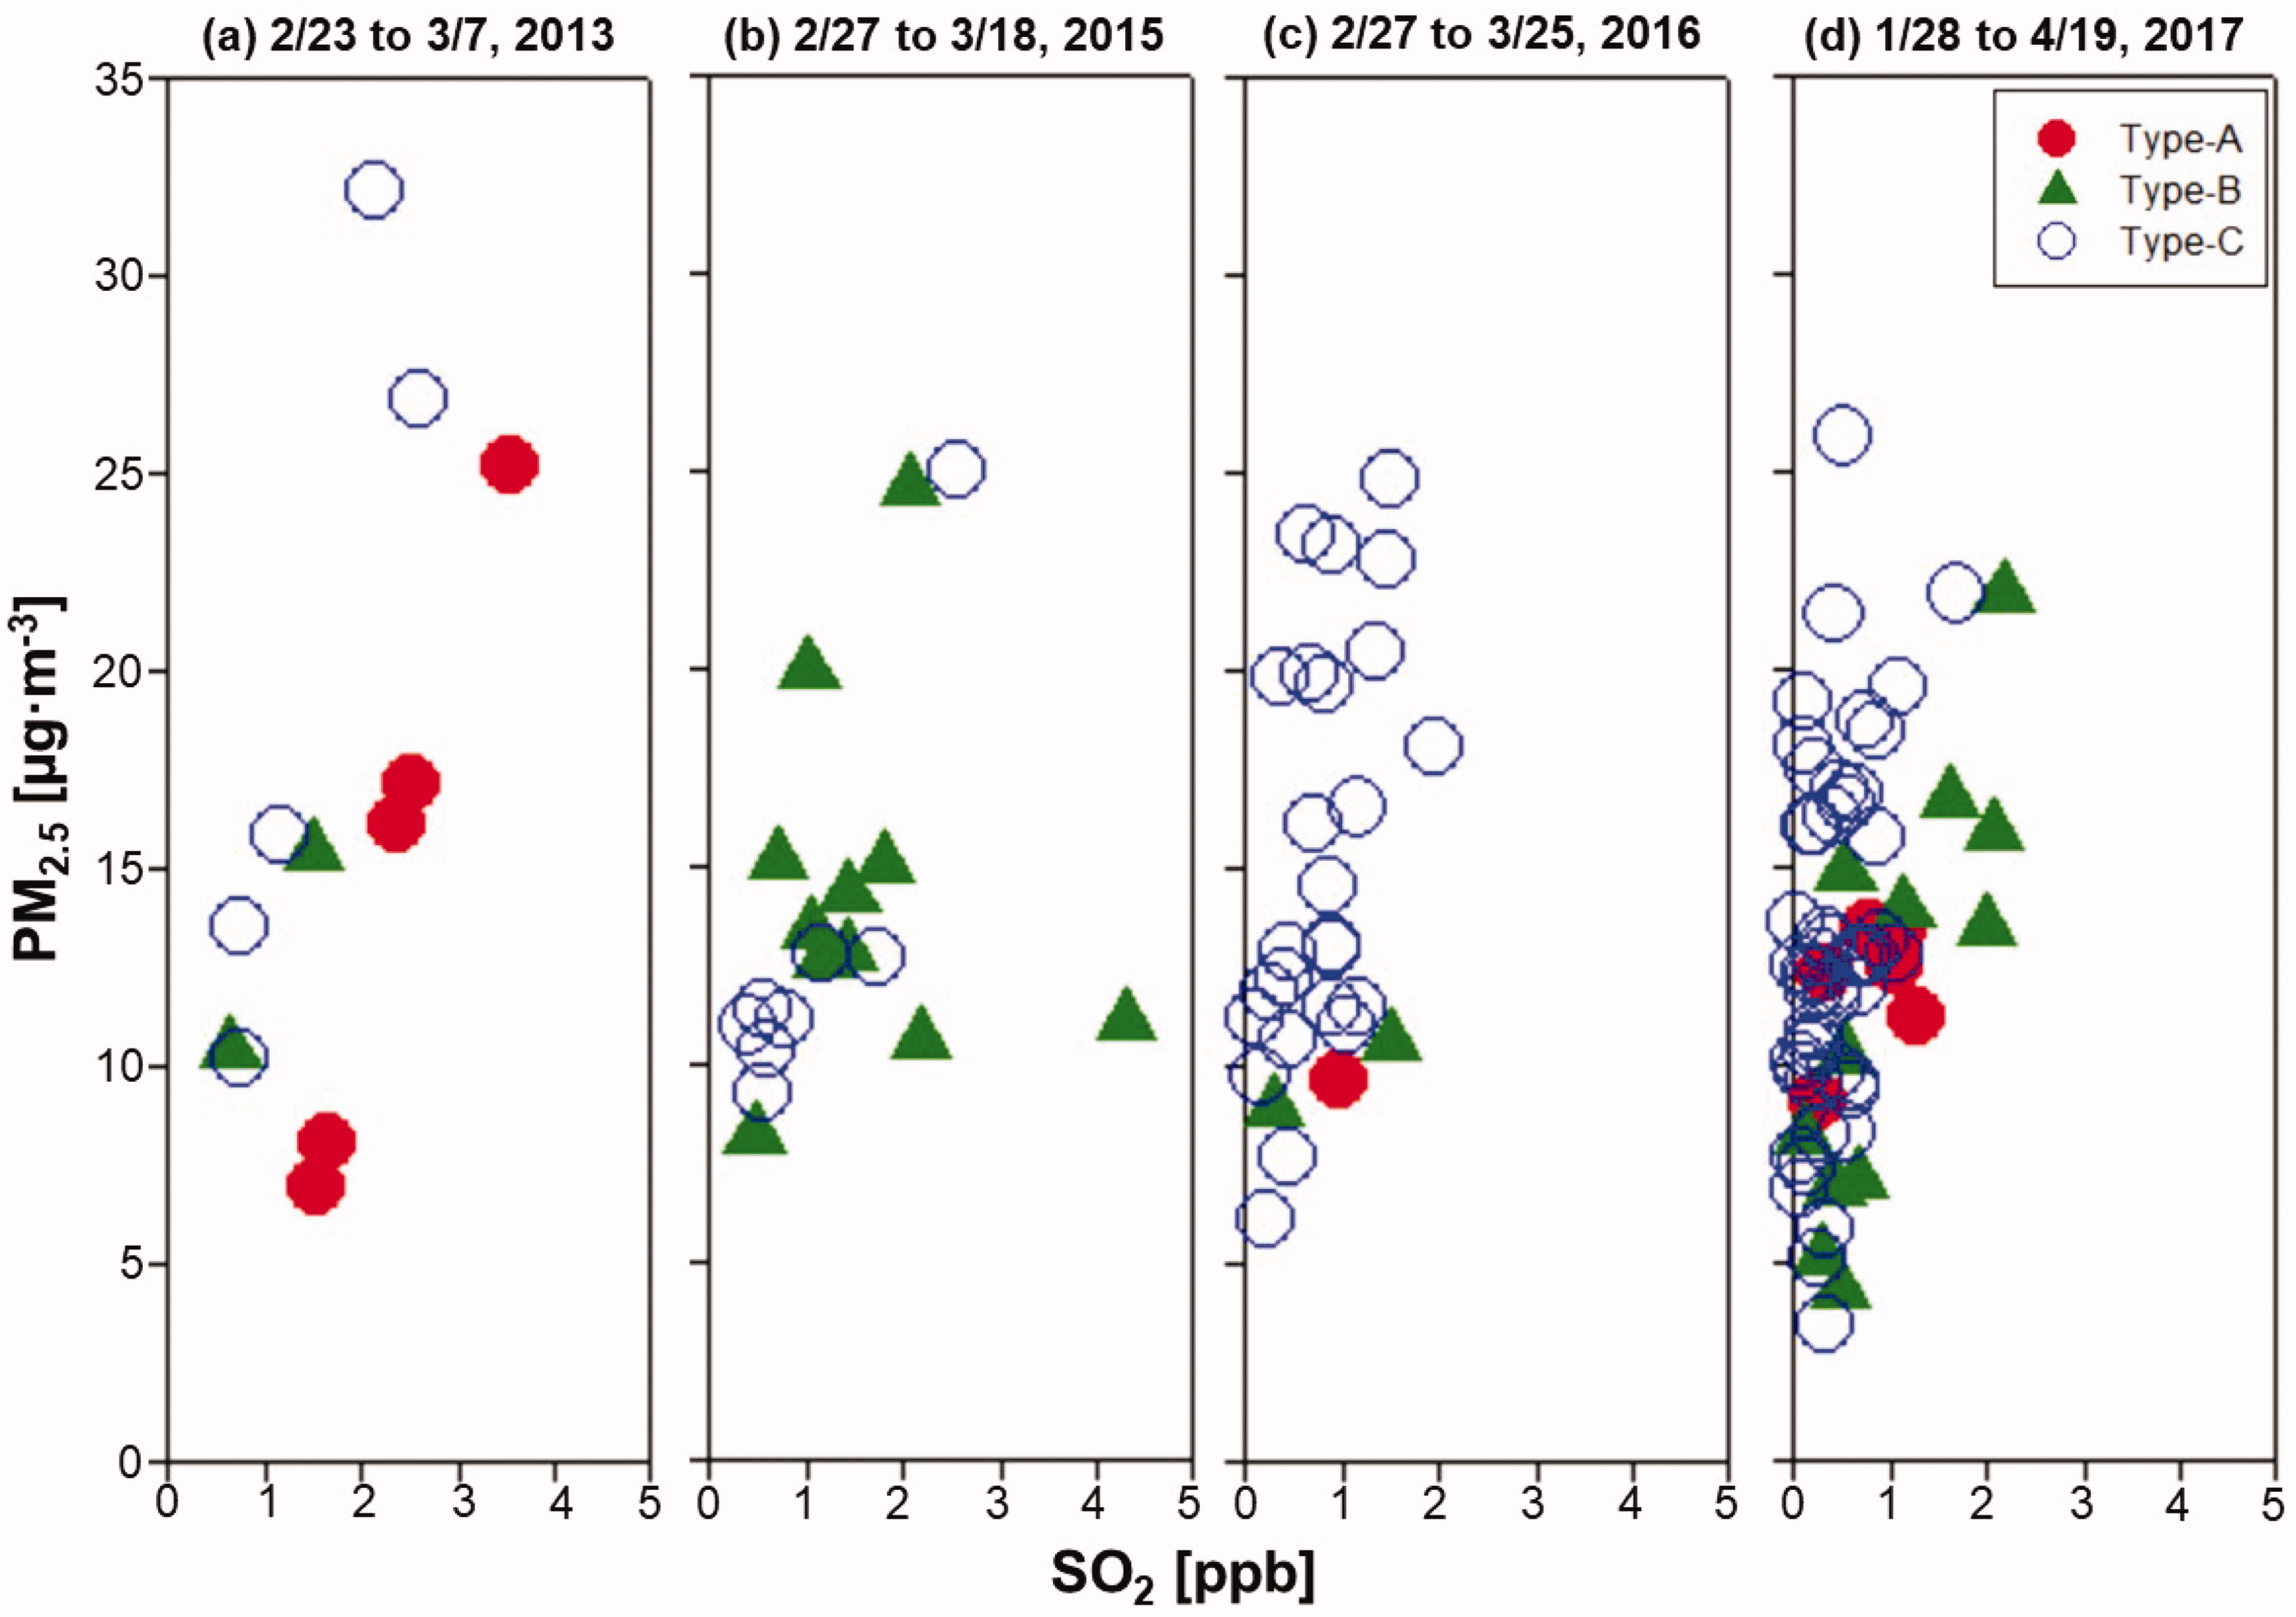
Fig. 7.
The daily average PM2.5 concentration data plotted against the SO2 concentration data for (a) February 23 to March 7, 2013; (b) February 27 to March 18, 2015; (c) February 27 to March 25, 2016 and (d) January 28 to April 19, 2017.