
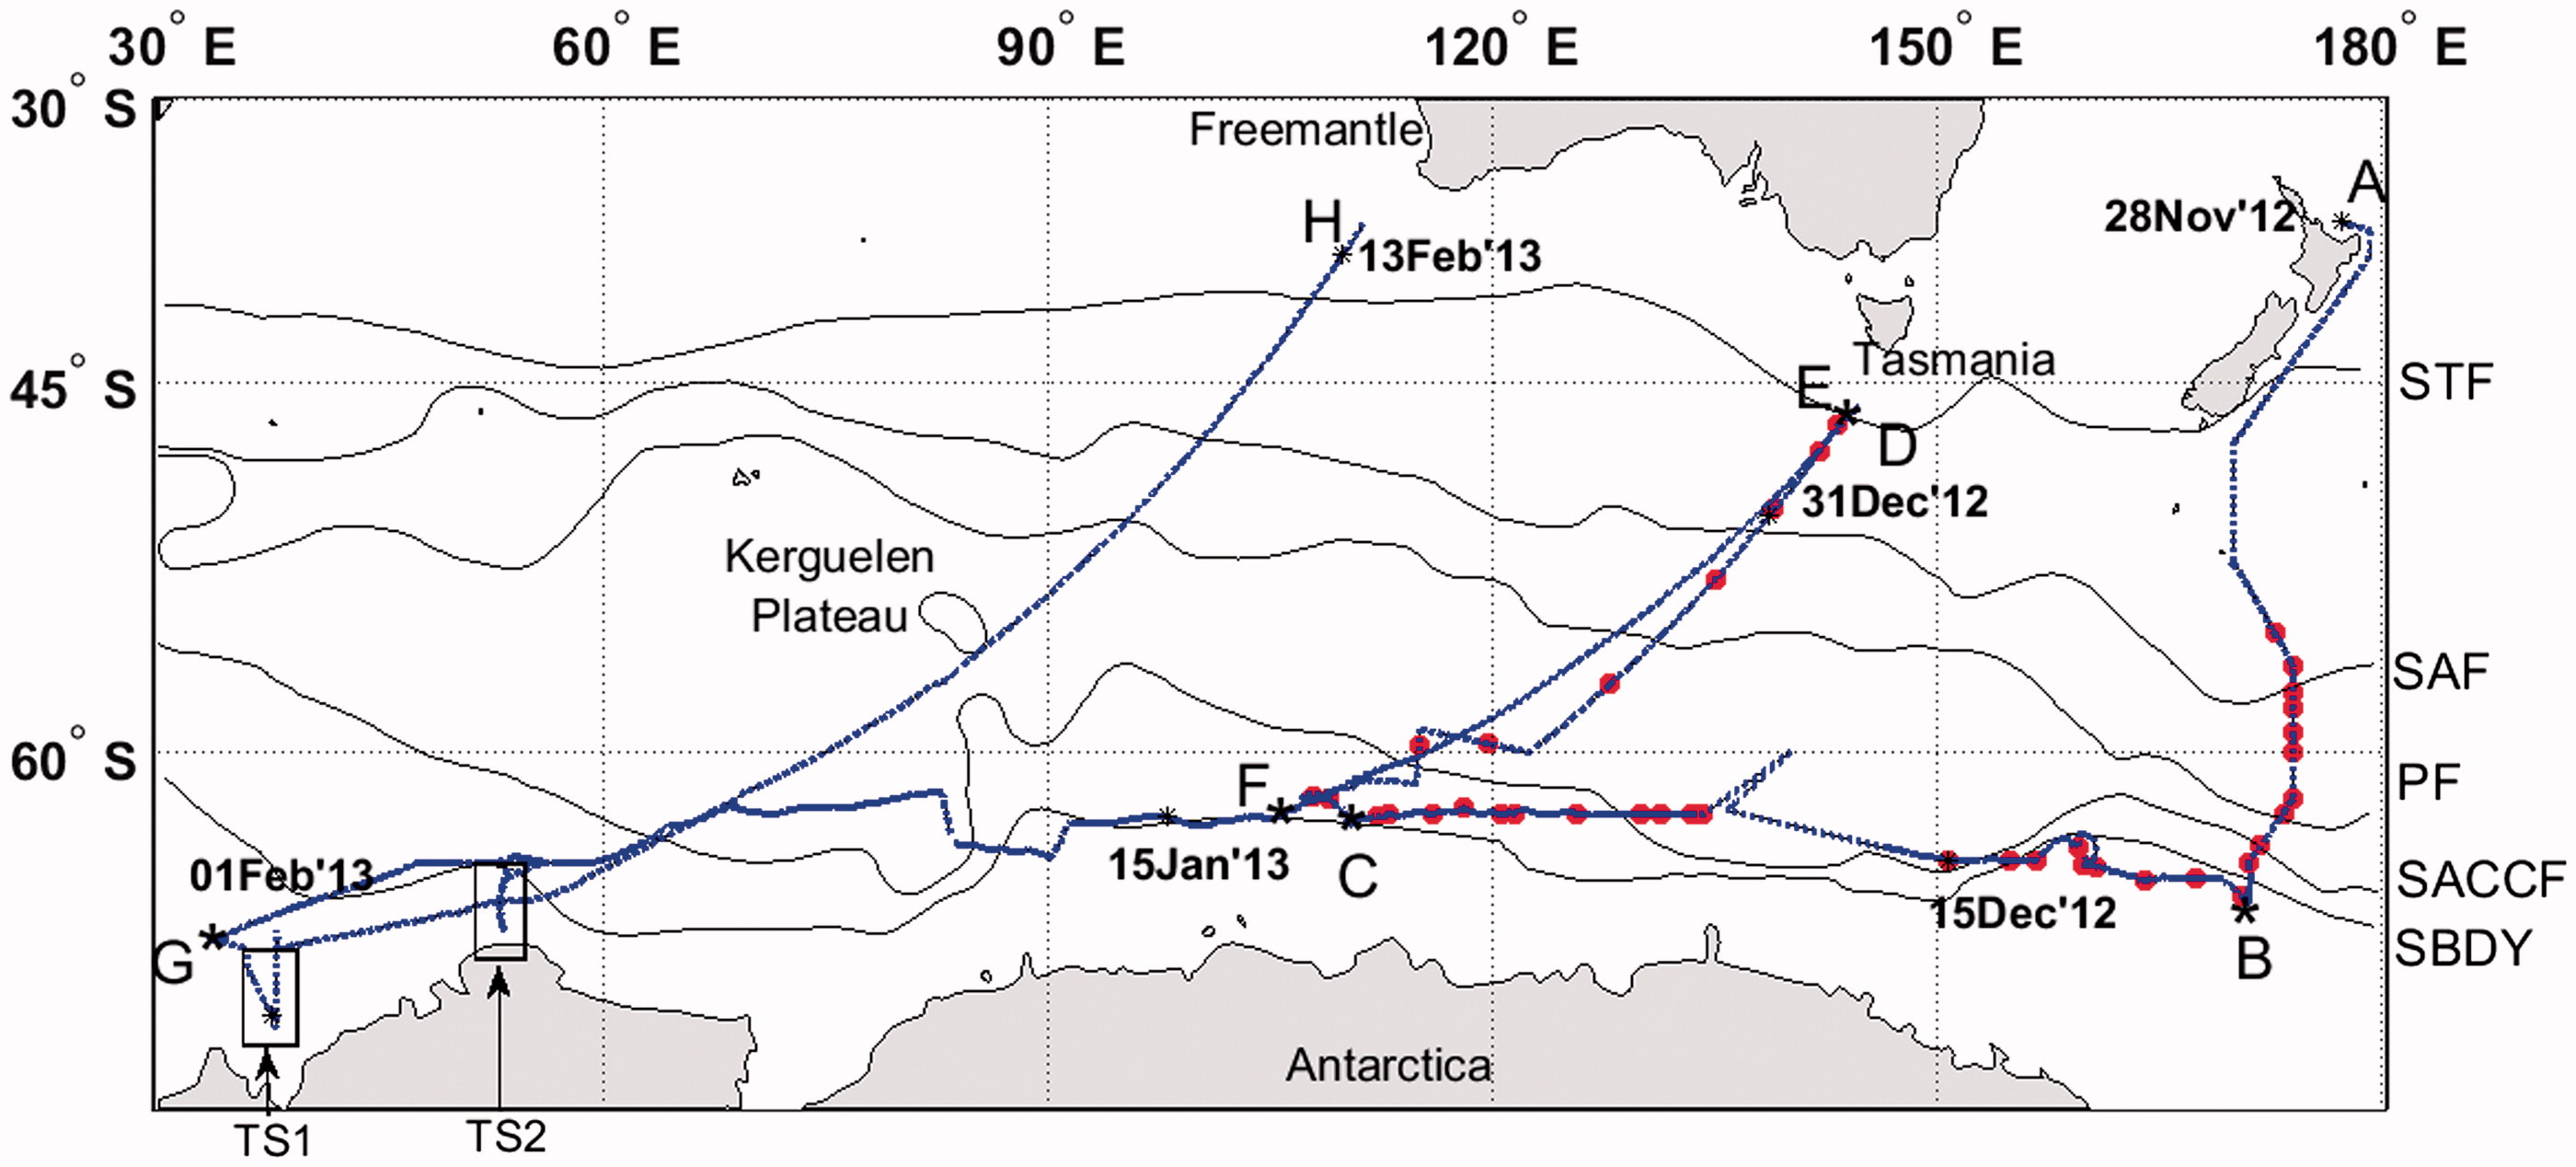
Fig. 1.
Dash-dotted blue line shows the cruise track of R/V Mirai where underway measurements of oceanic CO2 and CH4 were made simultaneously. Red circles show hydrographic stations for measurements of CH4 in discrete water samples (measurement system is described in Supplemental data). Black solid line shows the oceanic fronts from Orsi et al. (1995), and TS1 and TS2 coastal transects at 38oE and 53.5oE, respectively.
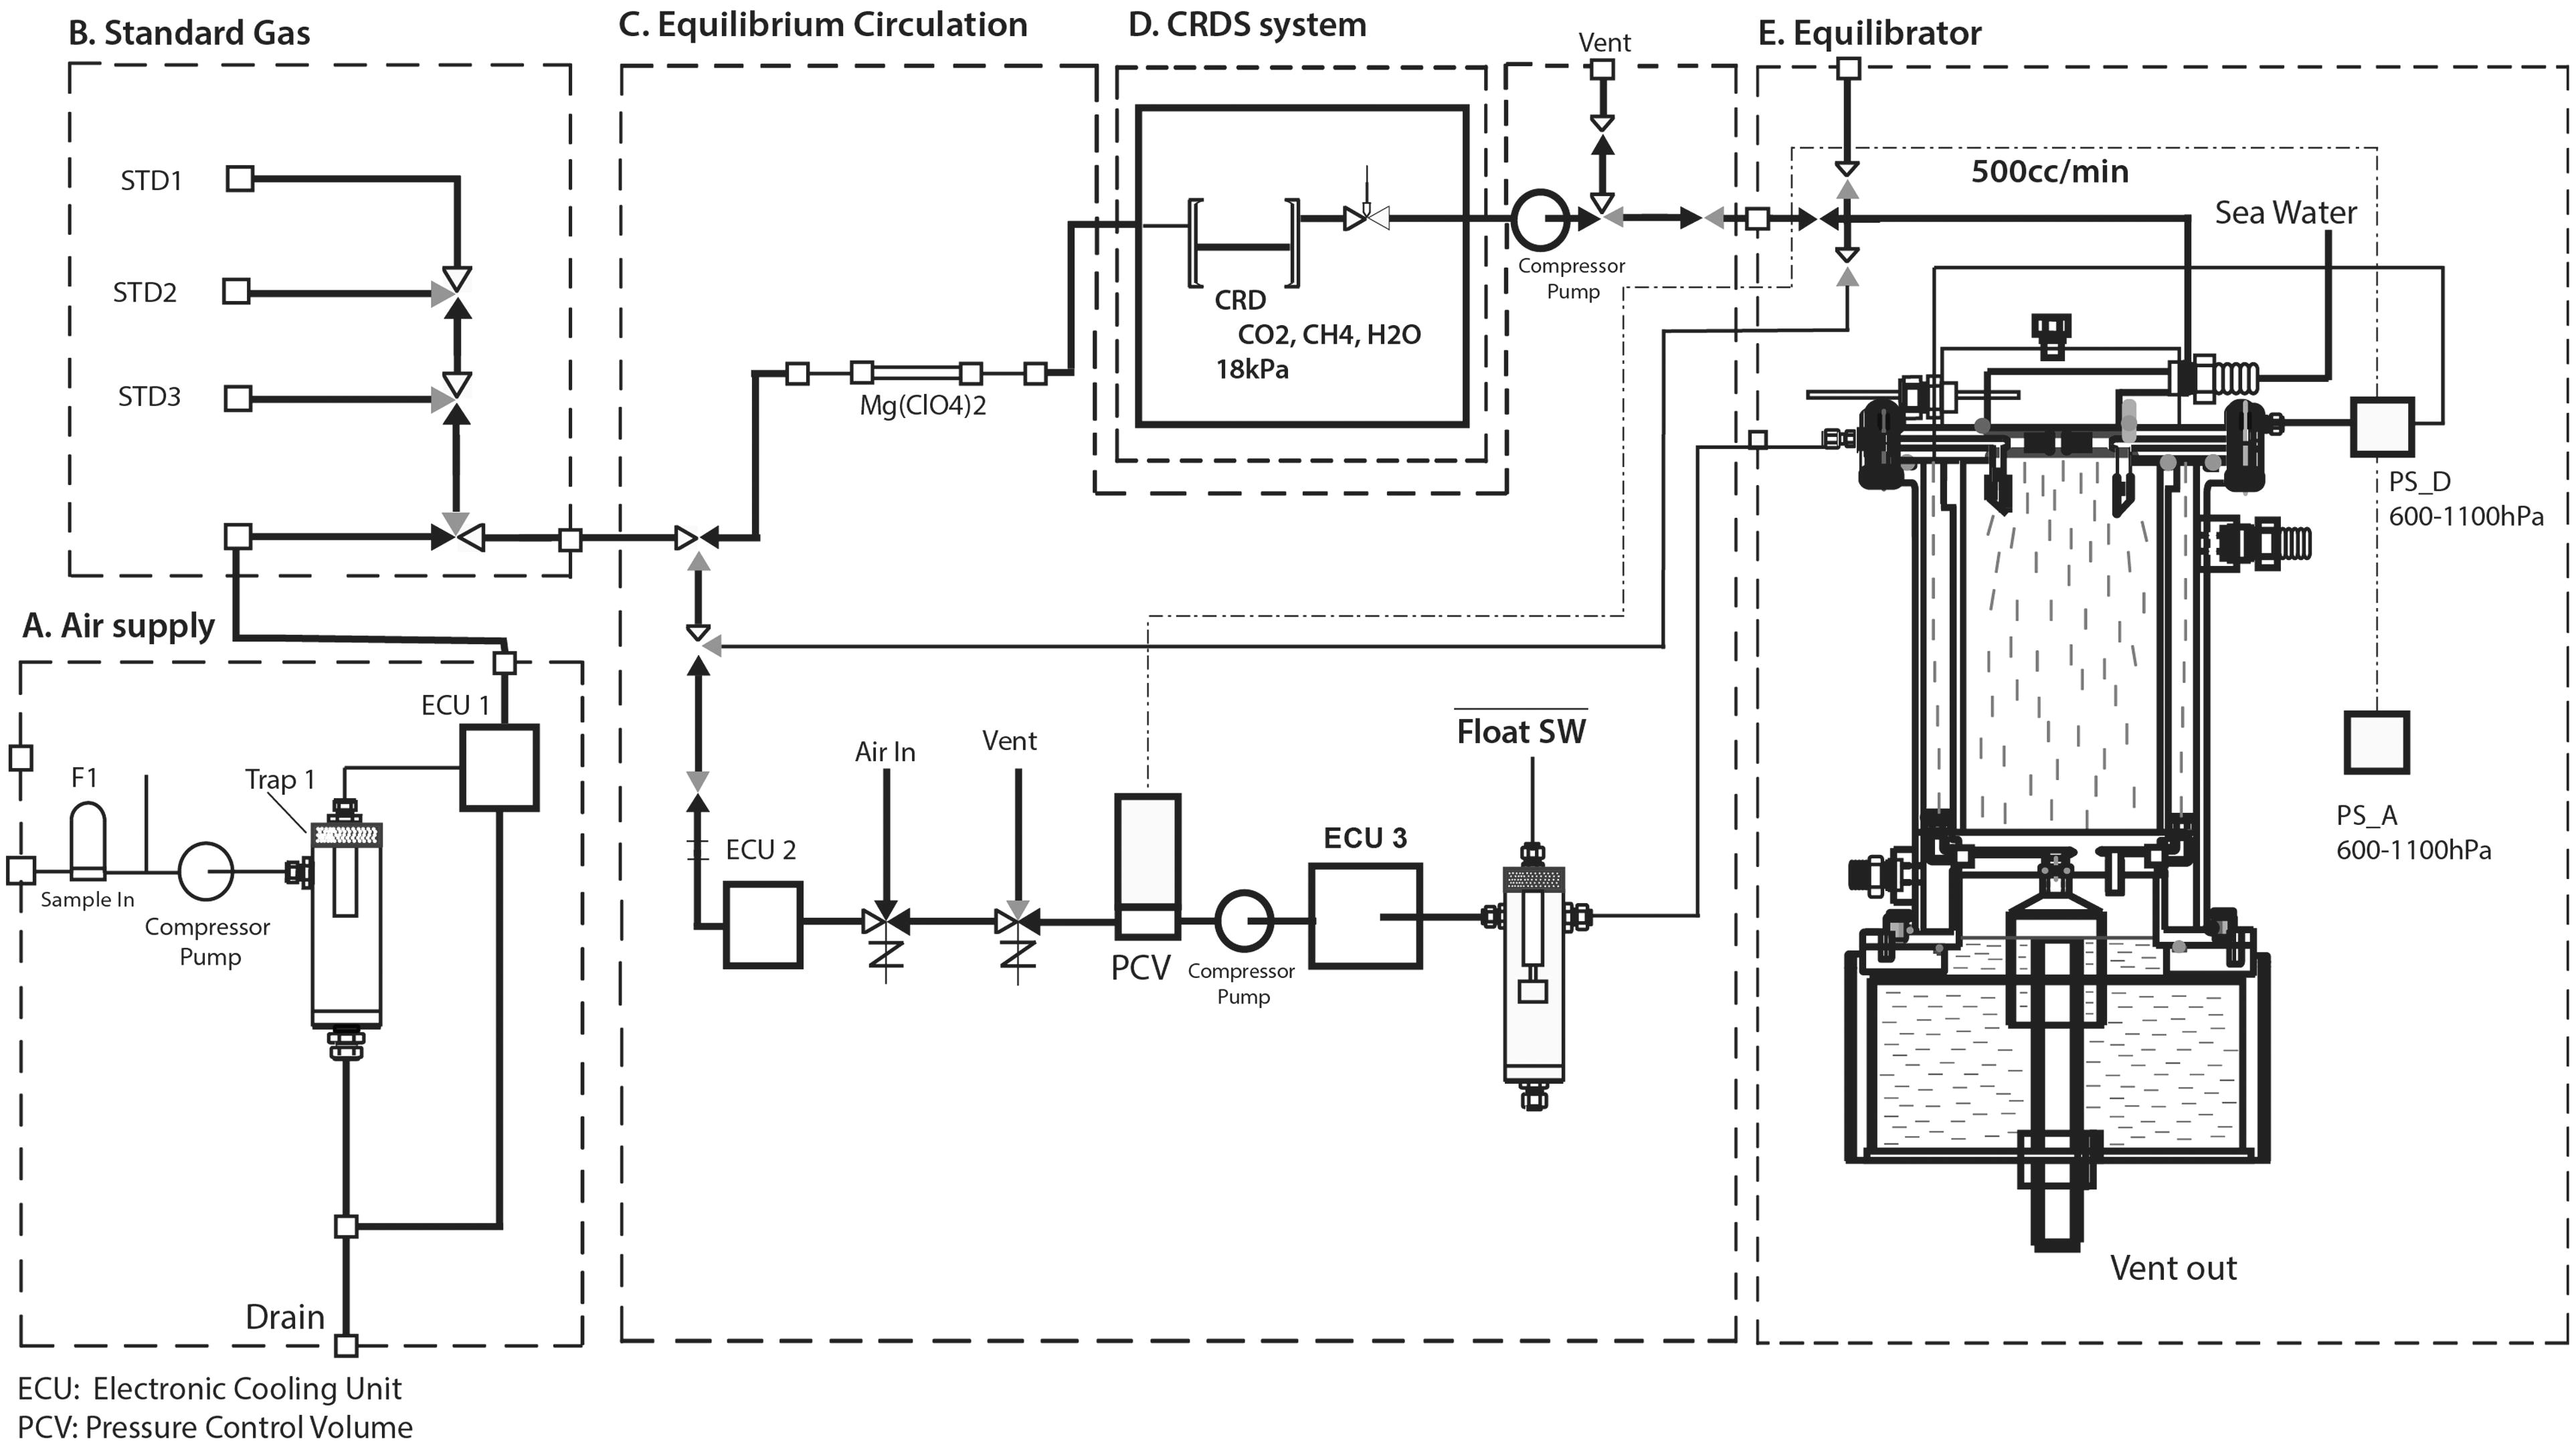
Fig. 2.
Schematic diagram of underway system for measurements of CO2 and CH4, consisting of a CRDS analyser and a shower-head-type equilibrator.
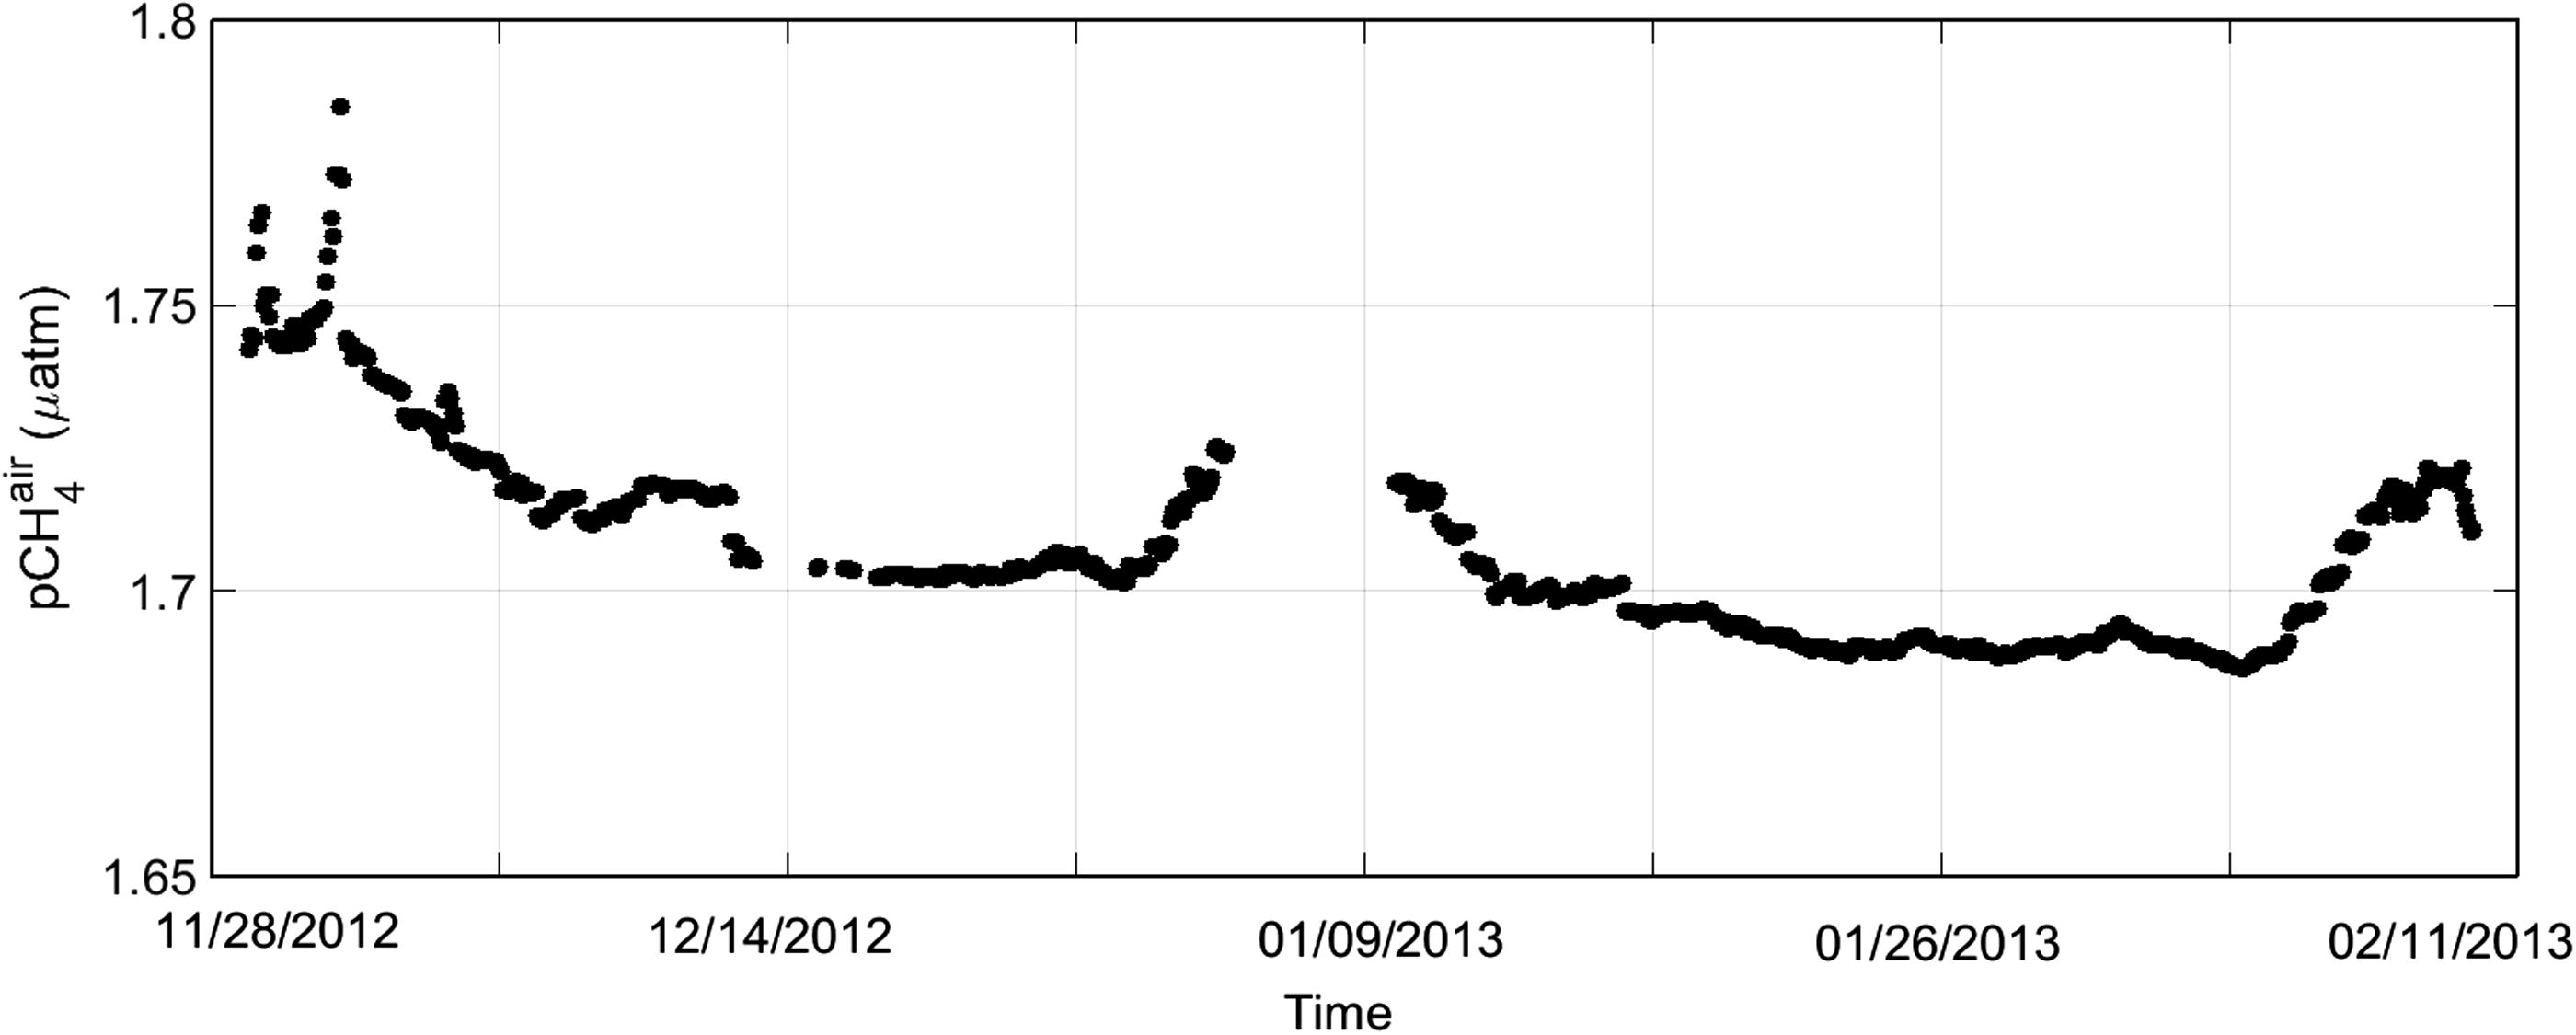
Fig. 3.
Atmospheric CH4 mixing ratios measured by CRDS analyser during the cruise track of R/V Mirai.
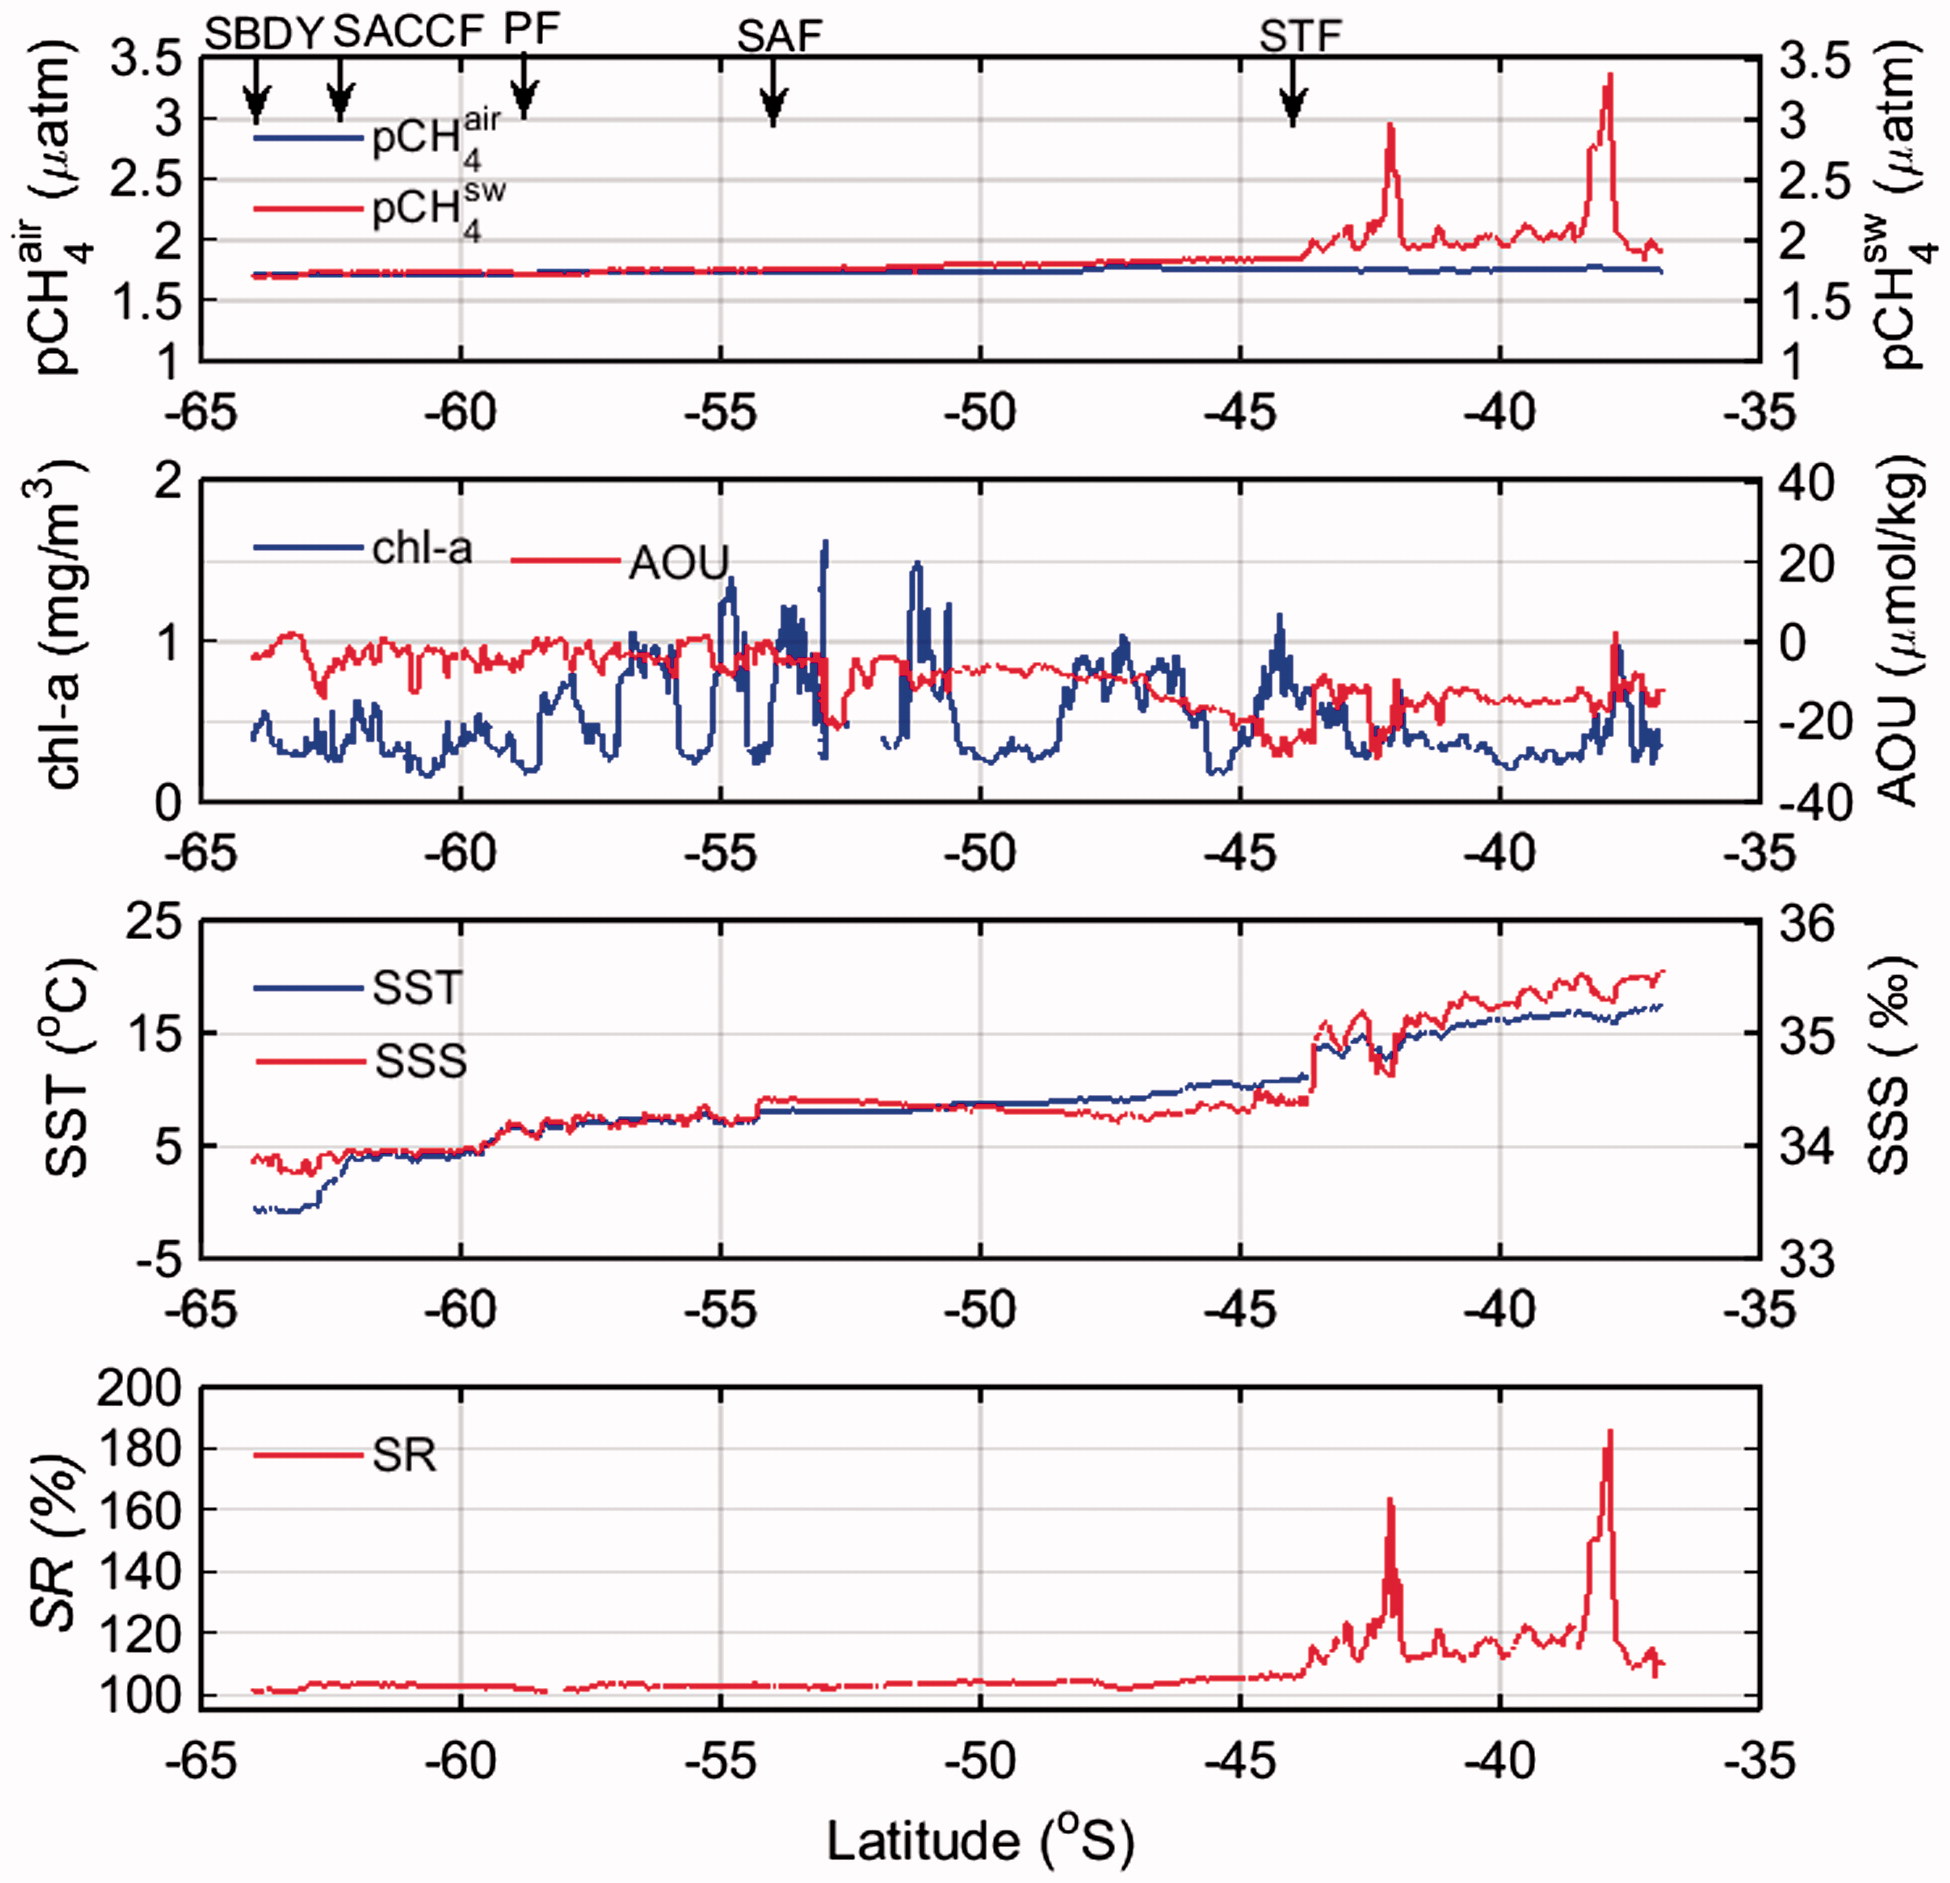
Fig. 4.
Meridional distribution of pCH 4 air , pCH 4 sw , chl-a, AOU, SST, SSS, SR along transect from offshore New Zealand to Antarctica (A–B).
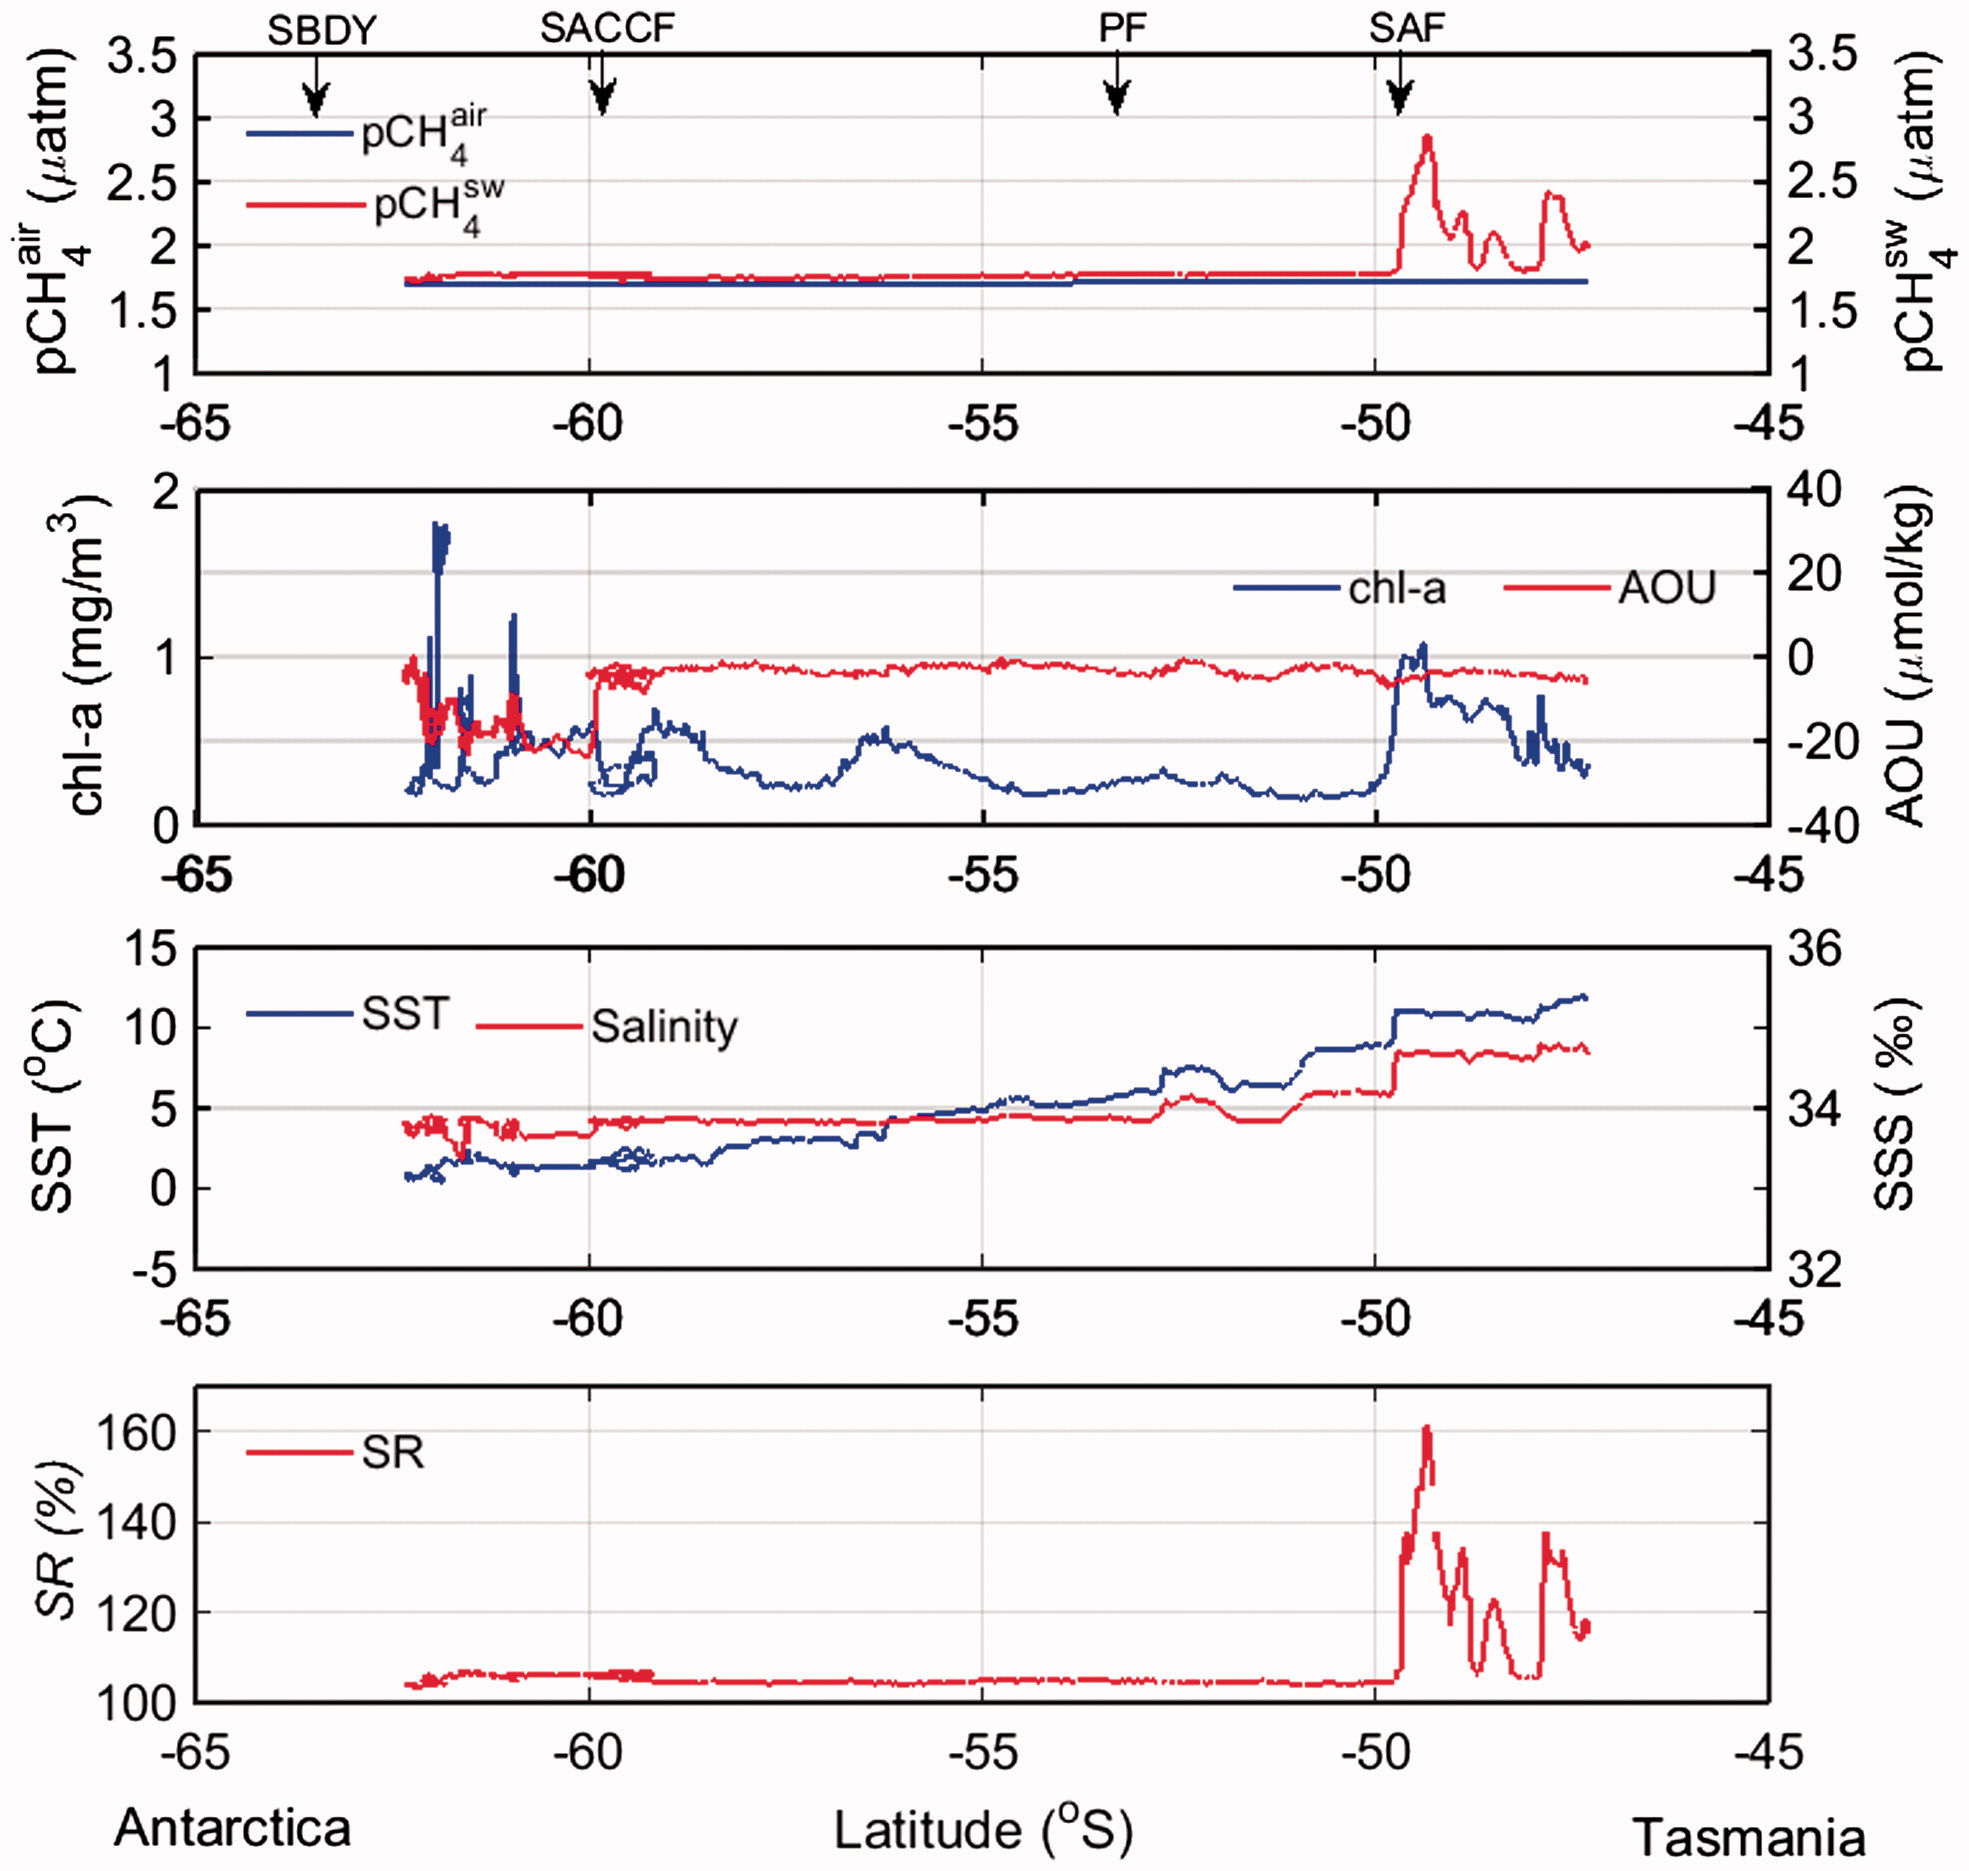
Fig. 5.
Meridional distribution of pCH 4 air , pCH 4 sw , chl-a, AOU, SST, SSS, SR from SBDY to SAF during northbound sailing to Tasmania (Leg 2) (C–D).
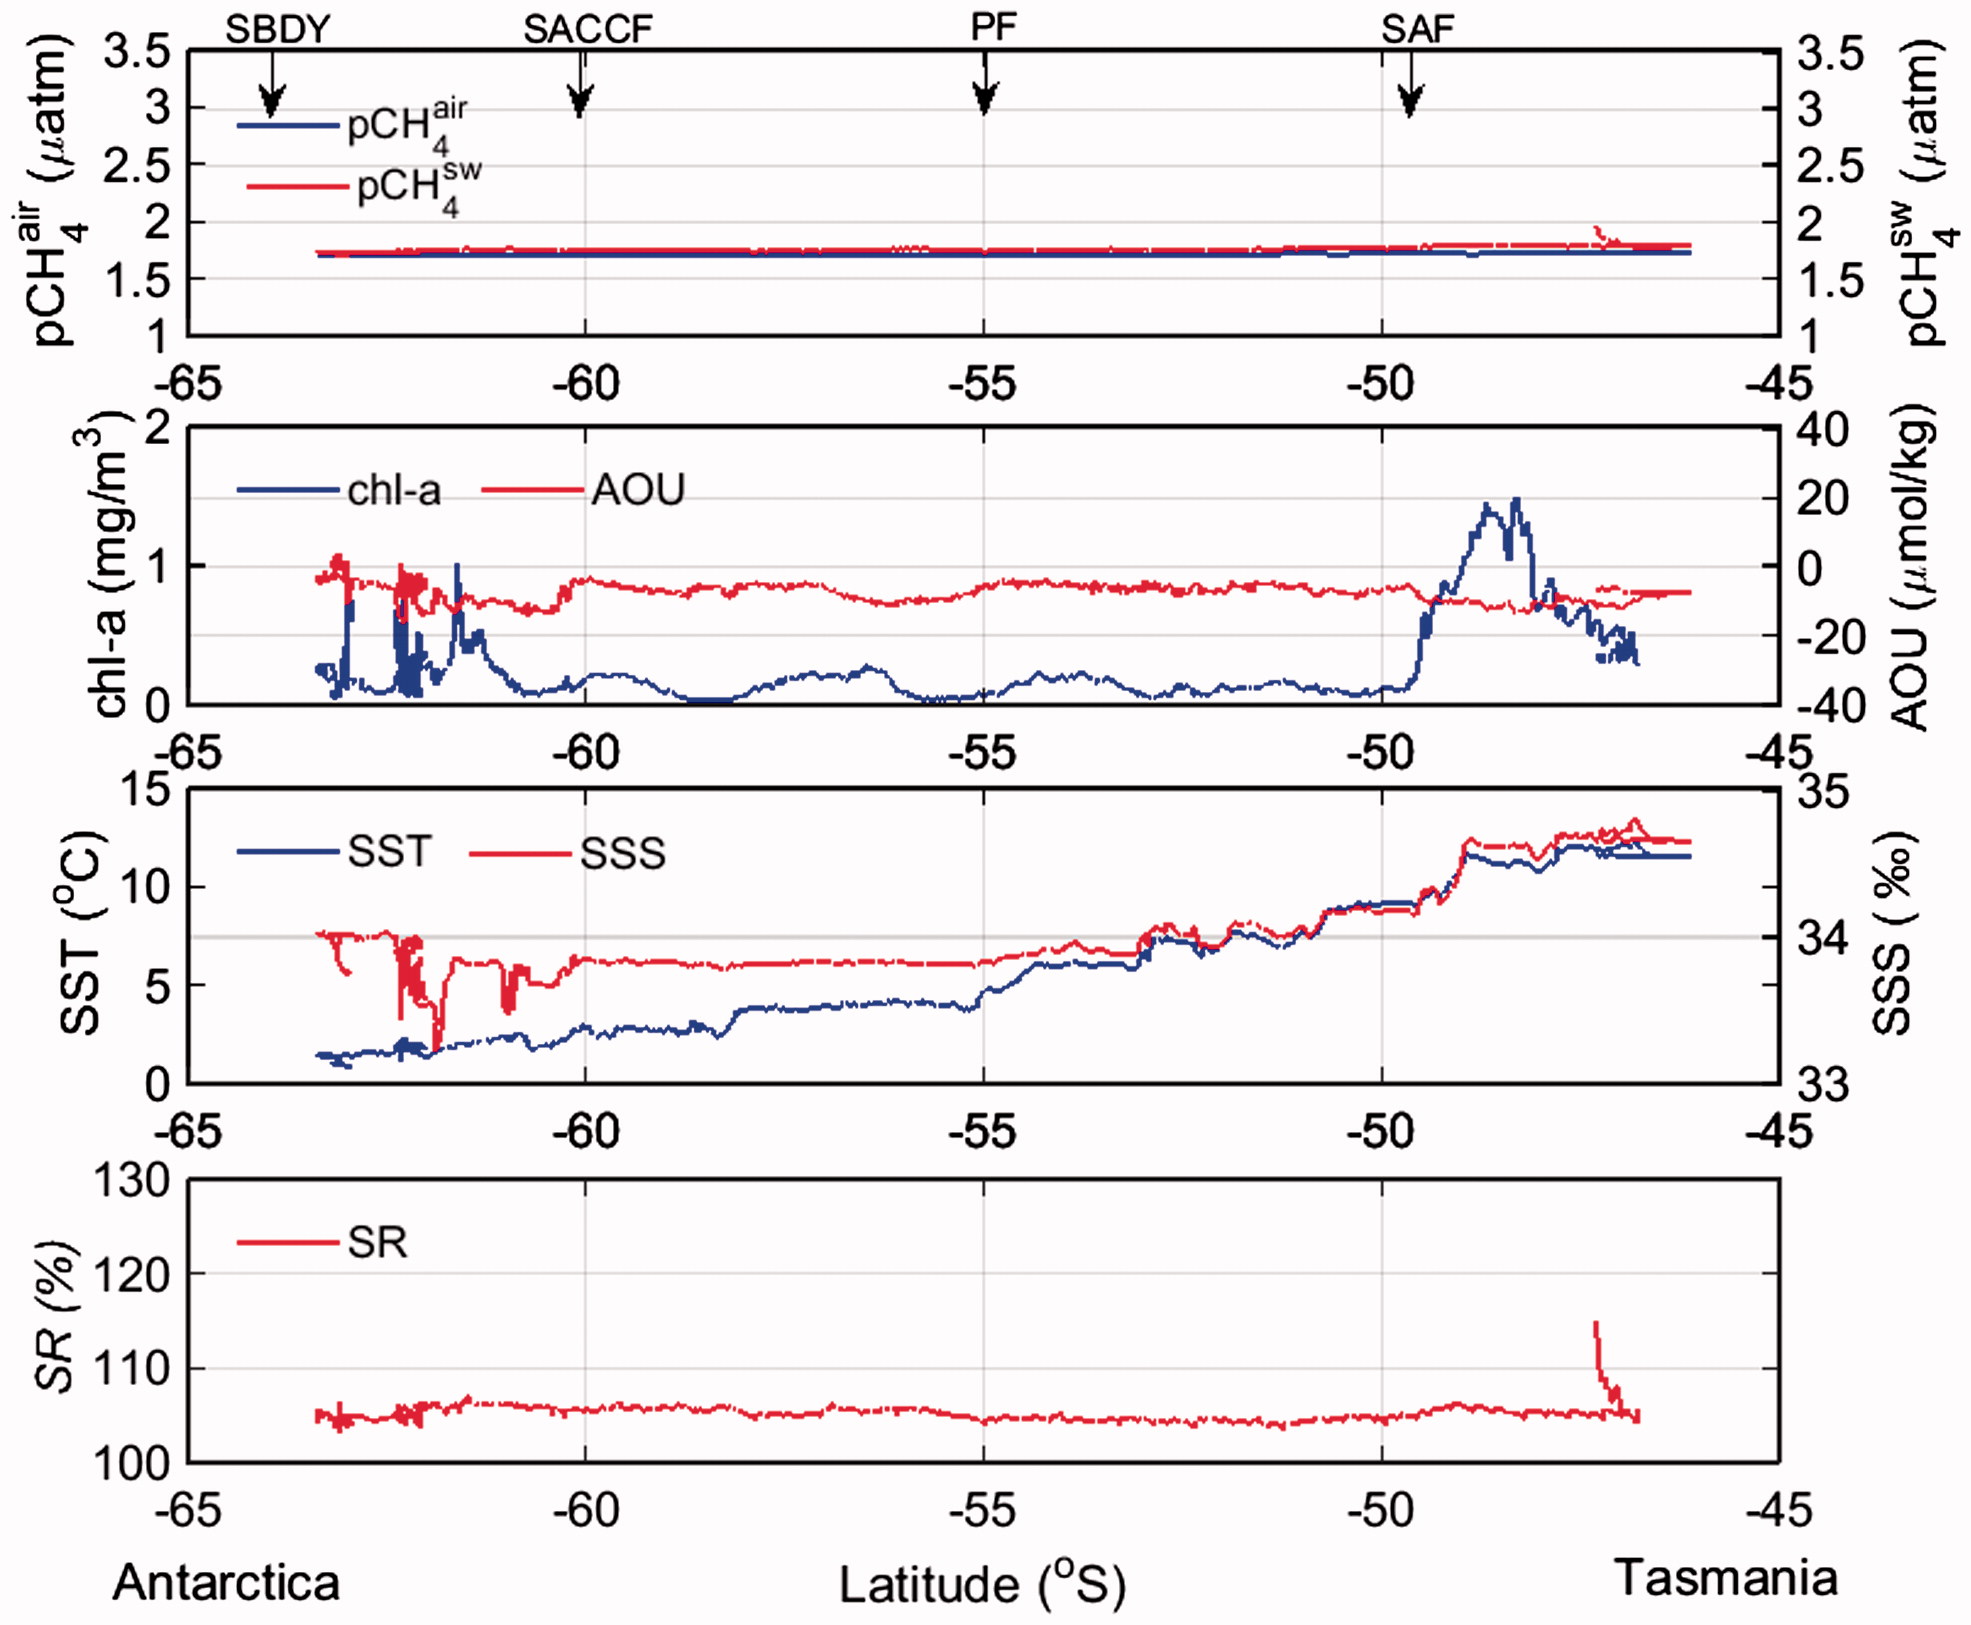
Fig. 6.
Meridional distribution of pCH 4 air , pCH 4 sw , chl-a, AOU, SST, SSS, SR from STF to SBDY during southbound sailing (Leg 3) (E–F).
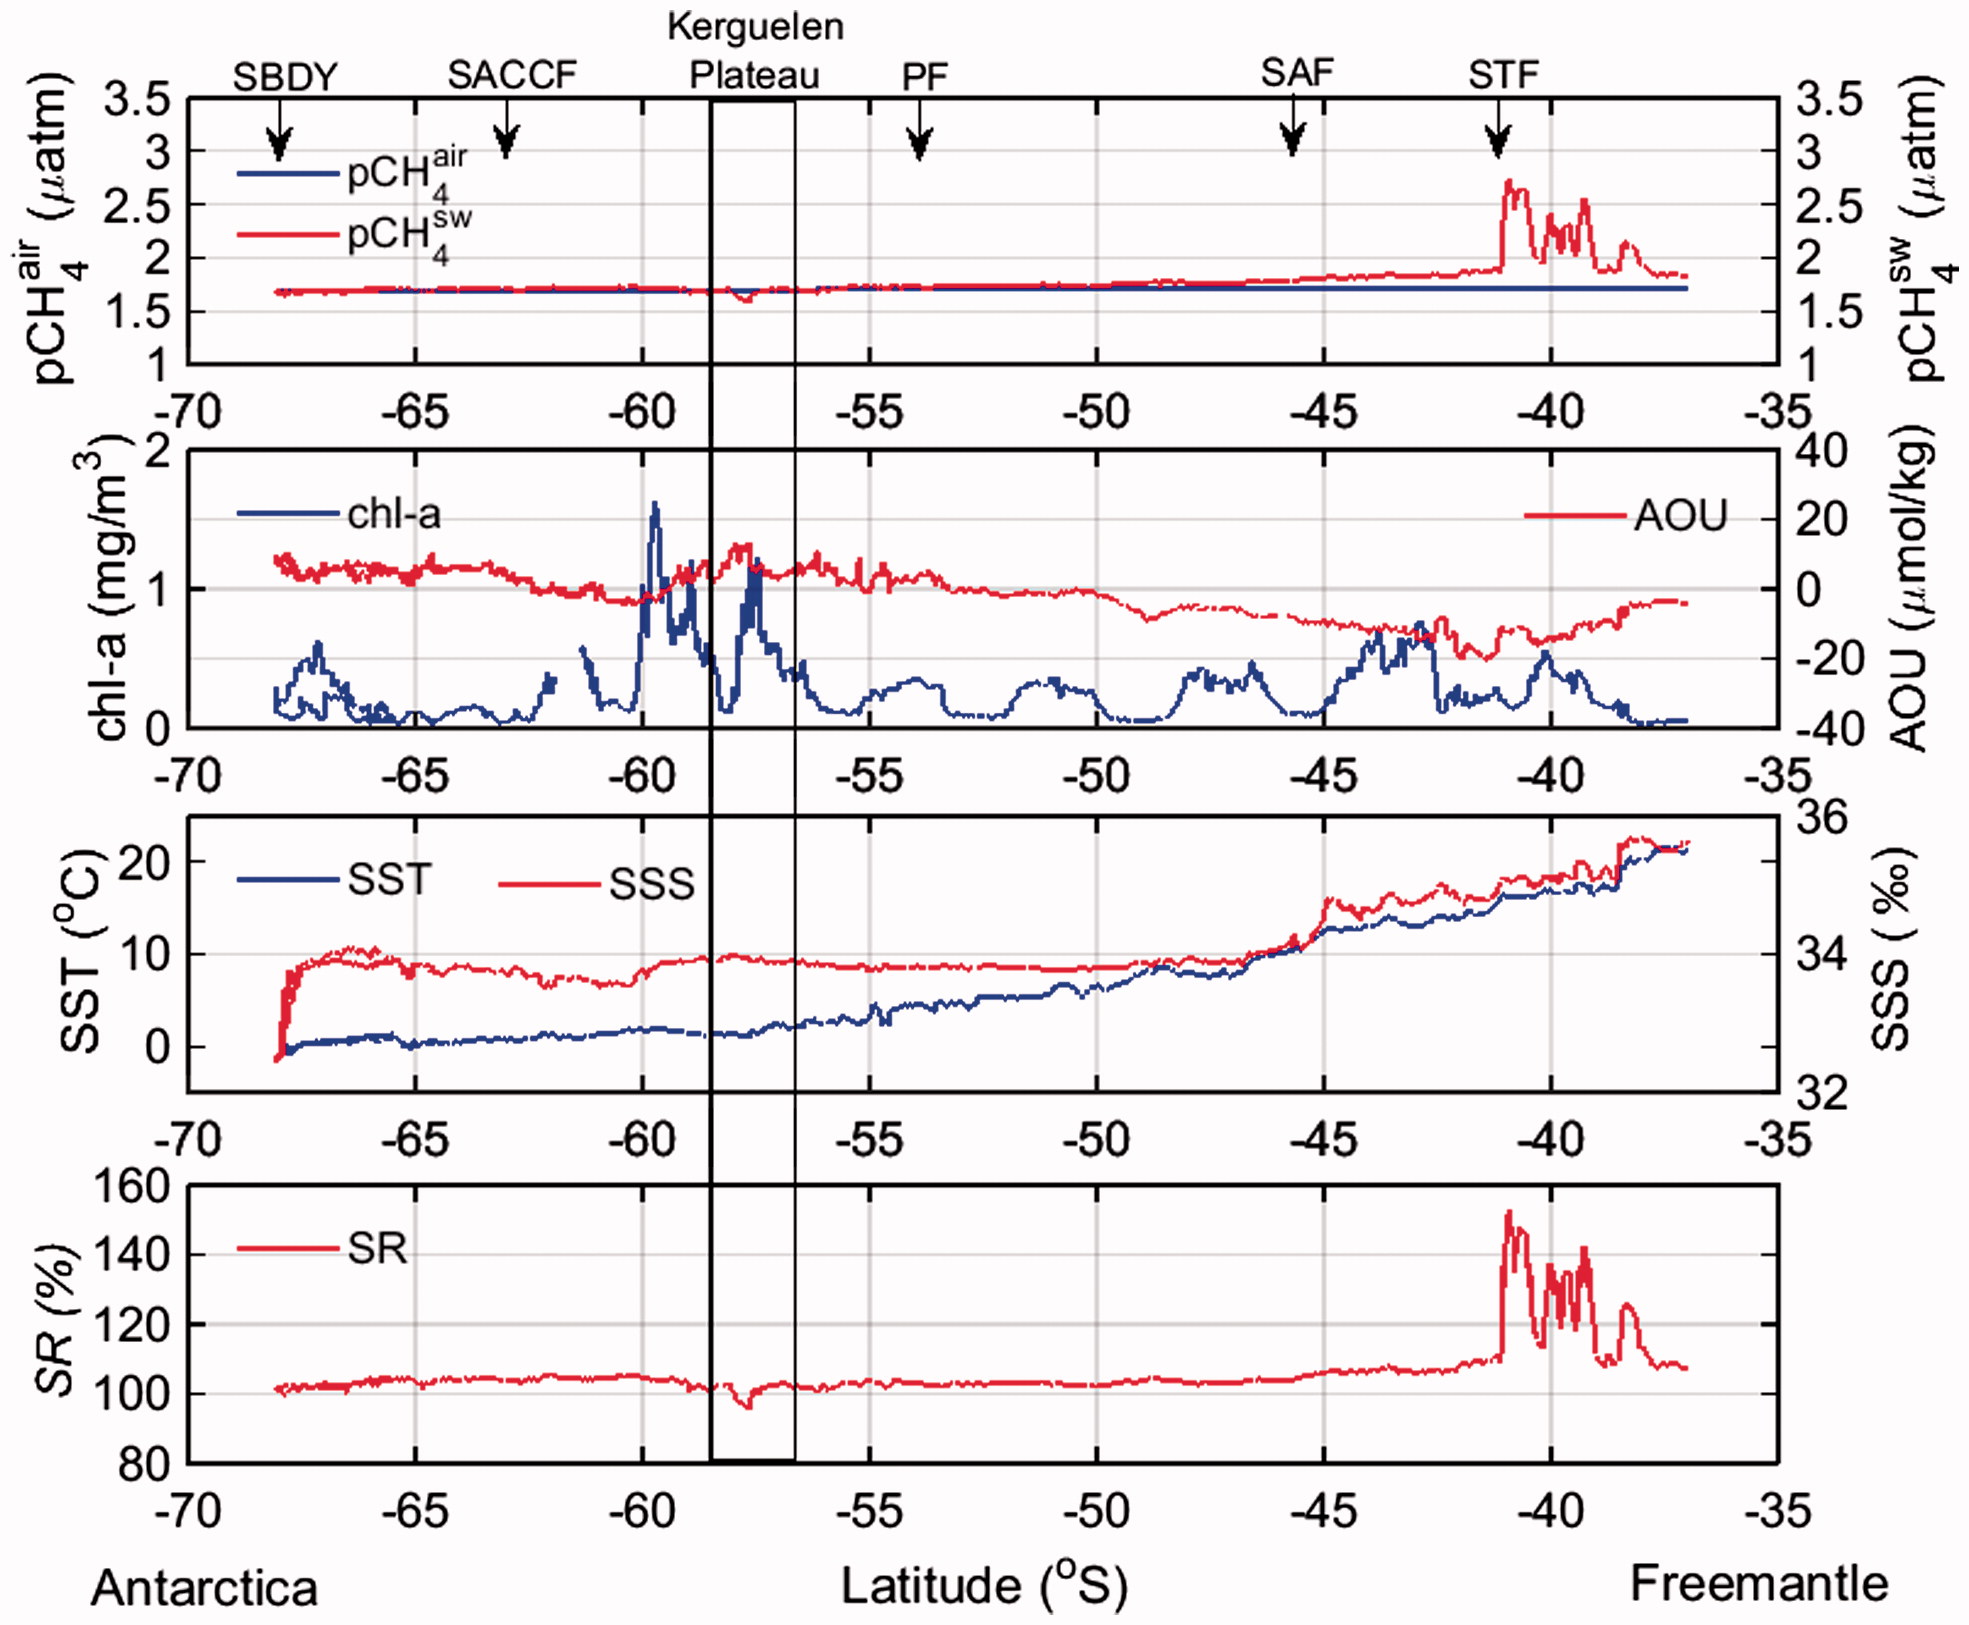
Fig. 7.
Same as in Fig. 6 except from SBDY to STF during northbound sailing to Fremantle (Leg 3) (G–H).
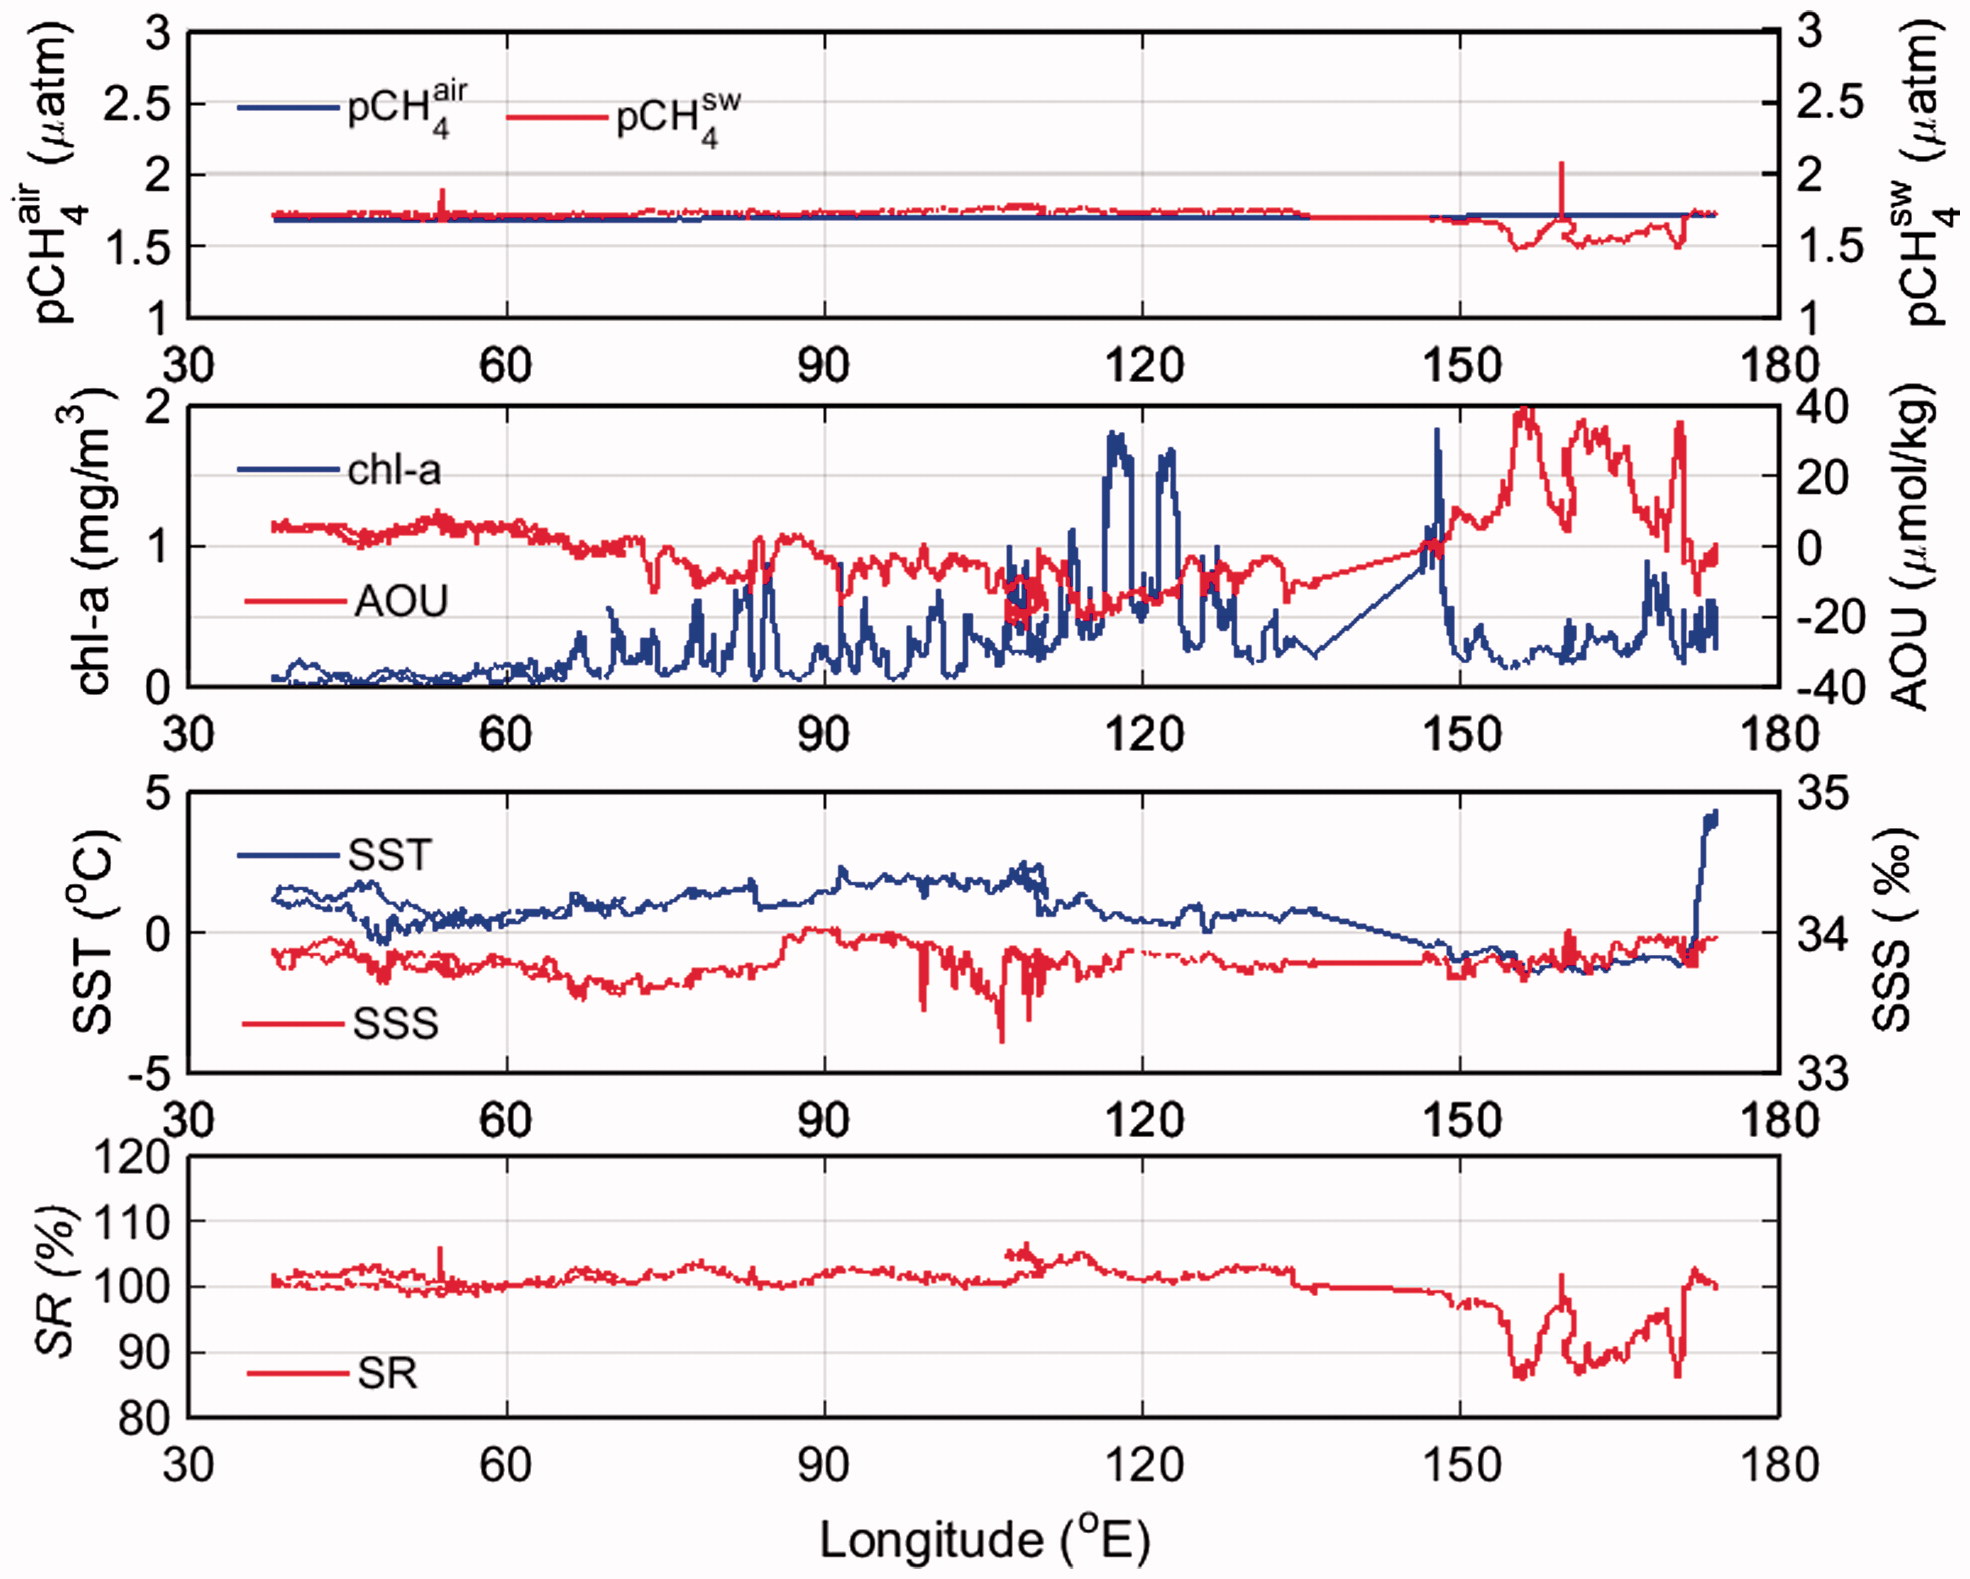
Fig. 8.
Zonal distribution of pCH 4 air , pCH 4 sw , chl-a, AOU, SST, SSS, SR south of 60°S (B–C–G).
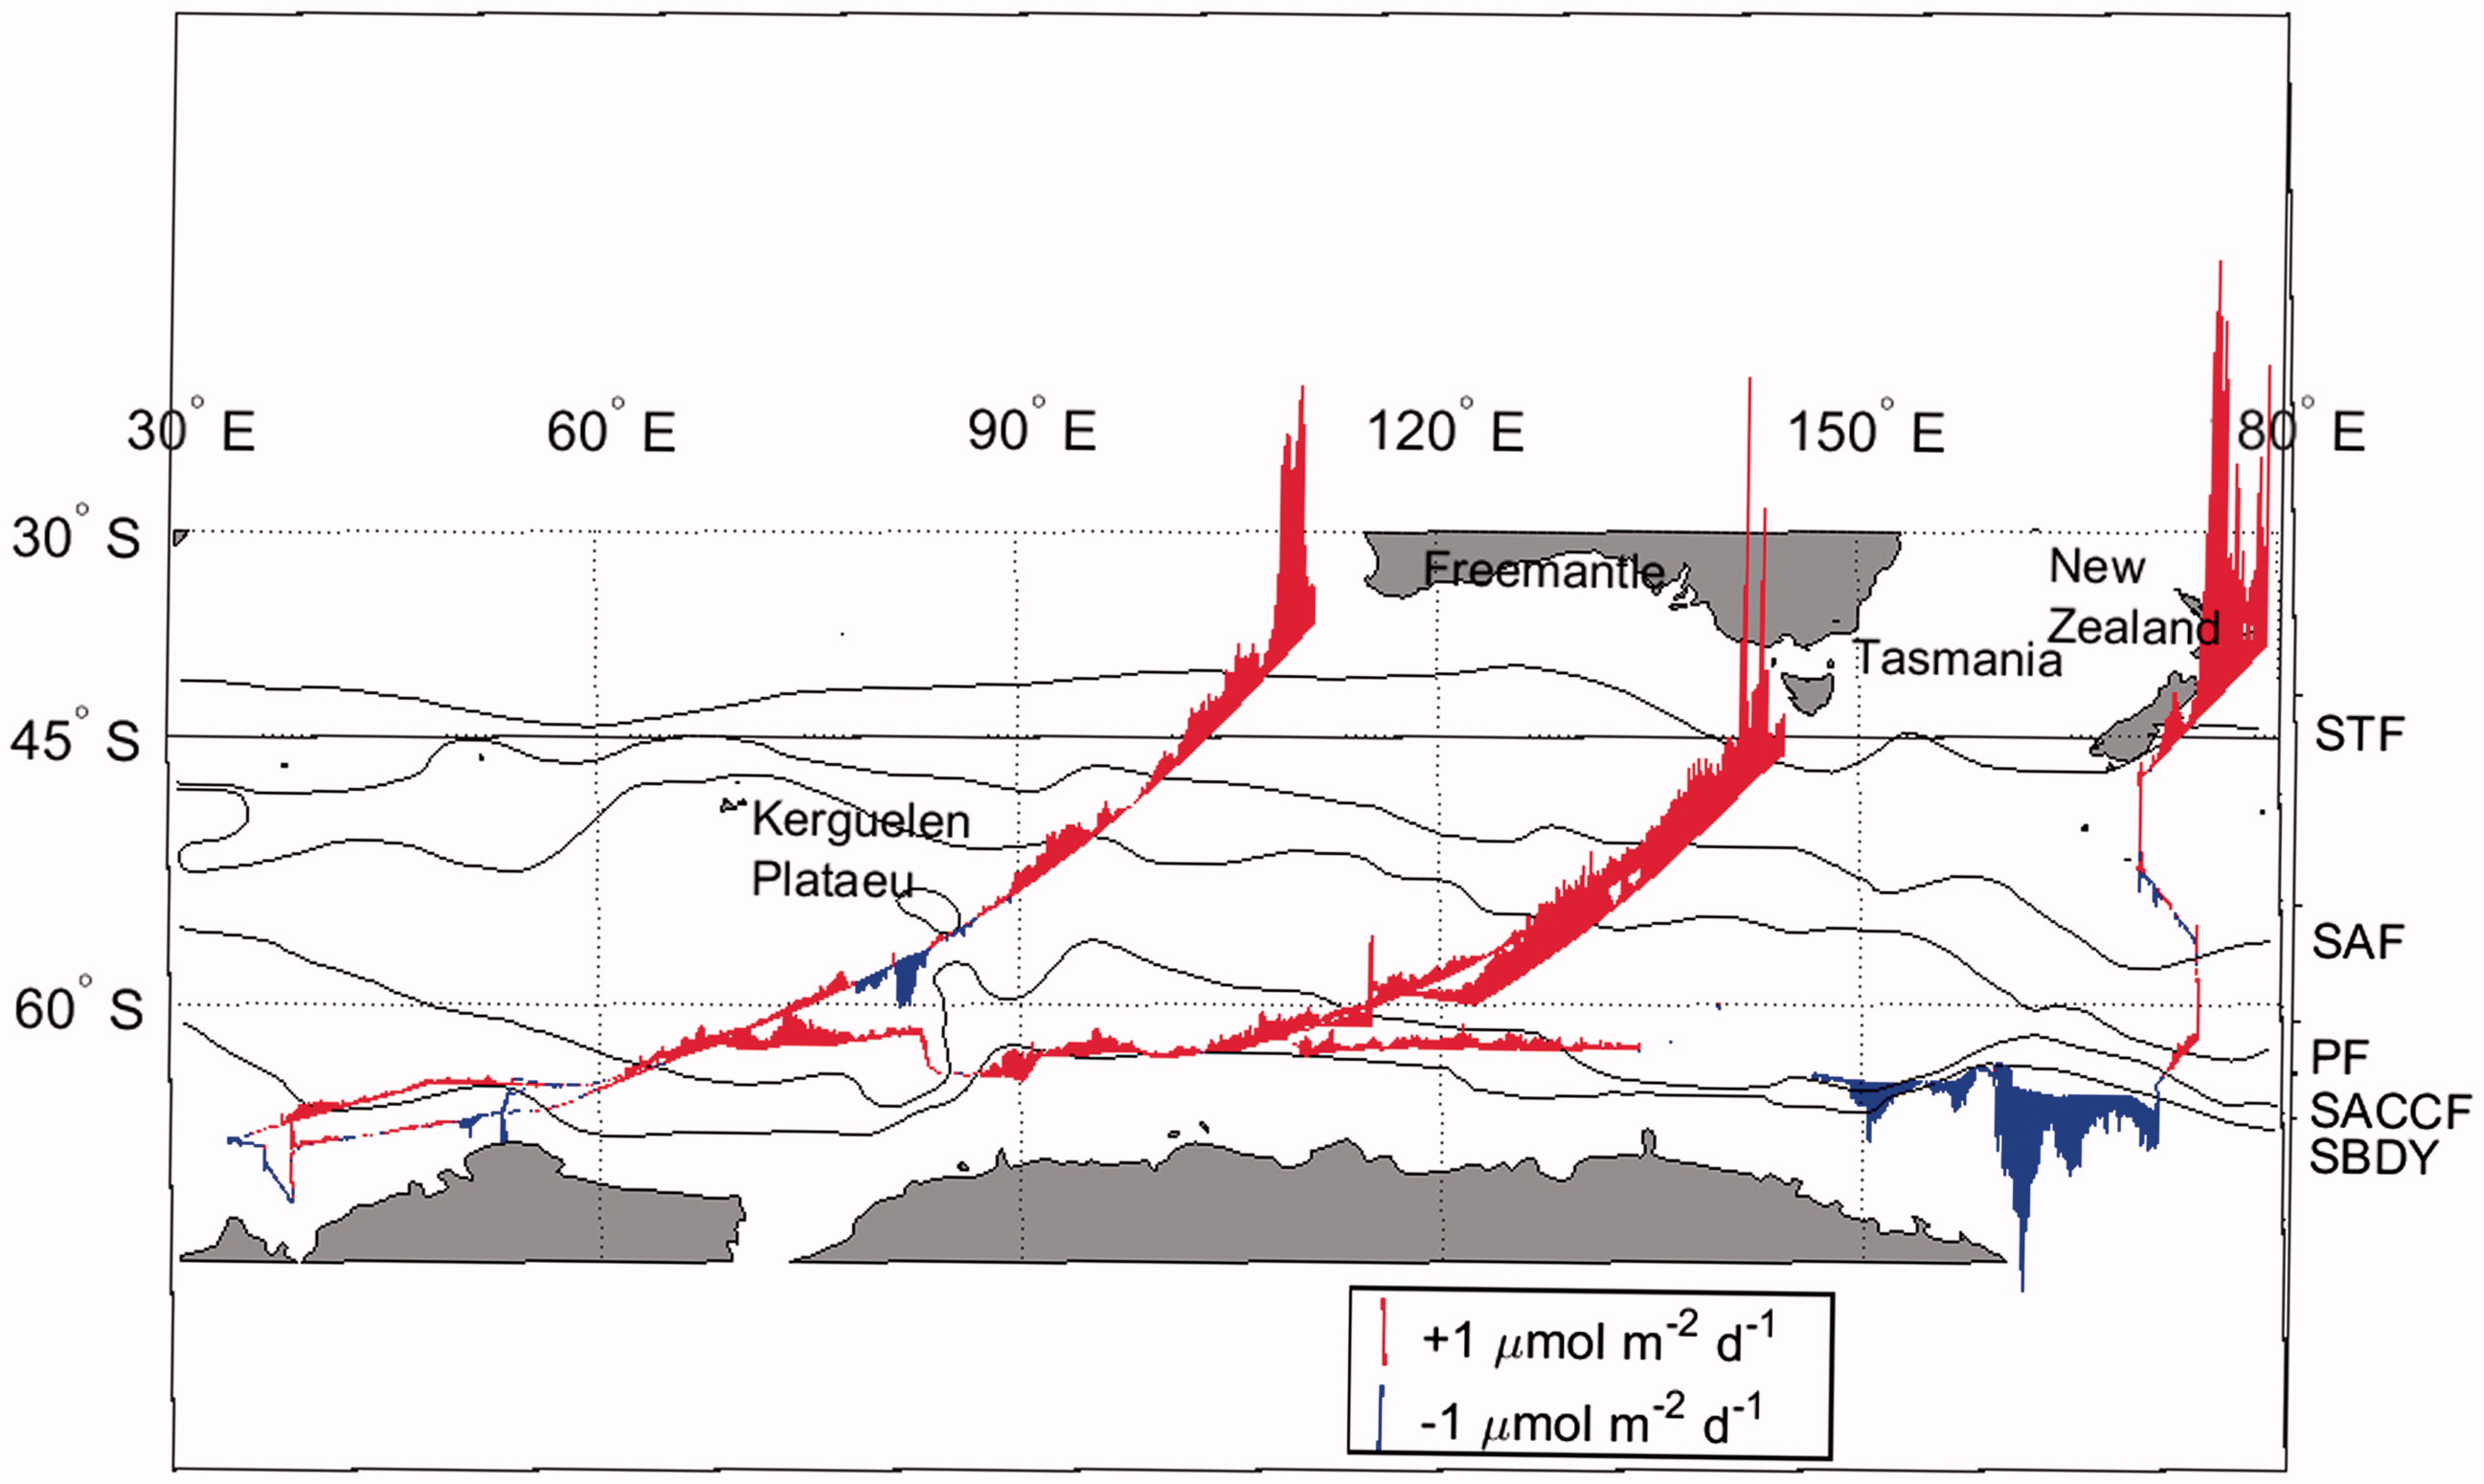
Fig. 9.
The CH4 flux along the cruise track (red color indicates CH4 release, and blue color indicates CH4 uptake in seawater).
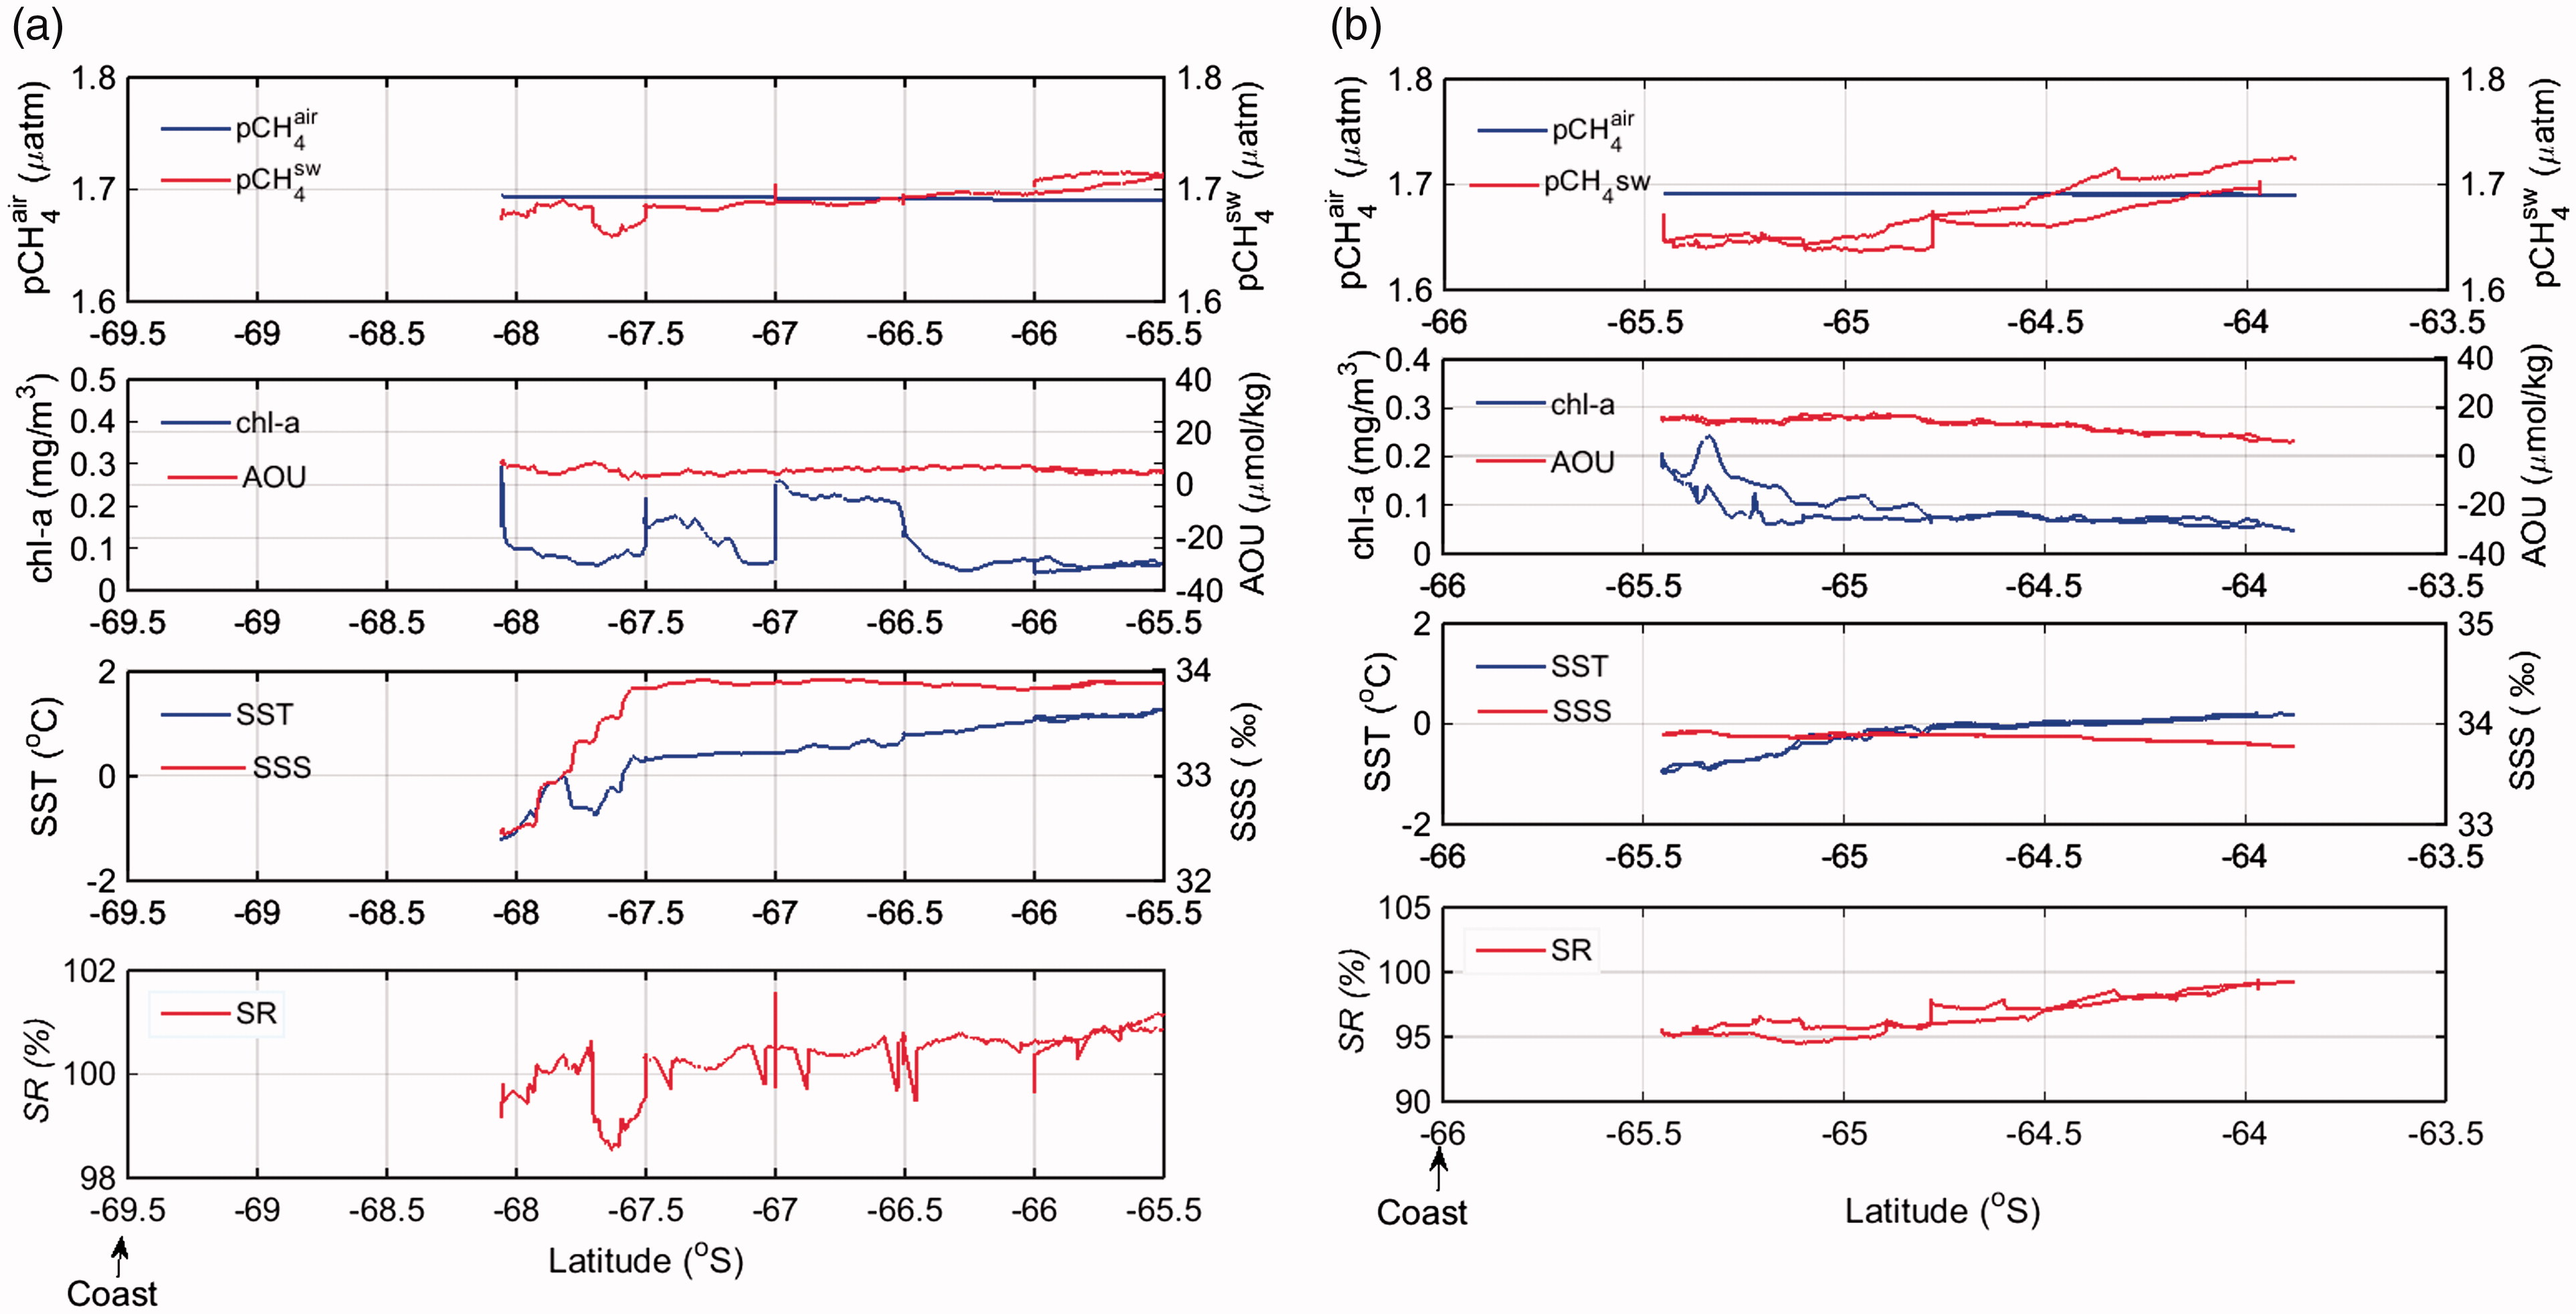
Fig. 10.
Meridional distribution of pCH 4 air , pCH 4 sw , chl-a, AOU, SST, SSS, SR at (a) transect 1 (38°E); (b) transect 2 (53.5°E). An arrow at the bottom indicates the position of the coast.
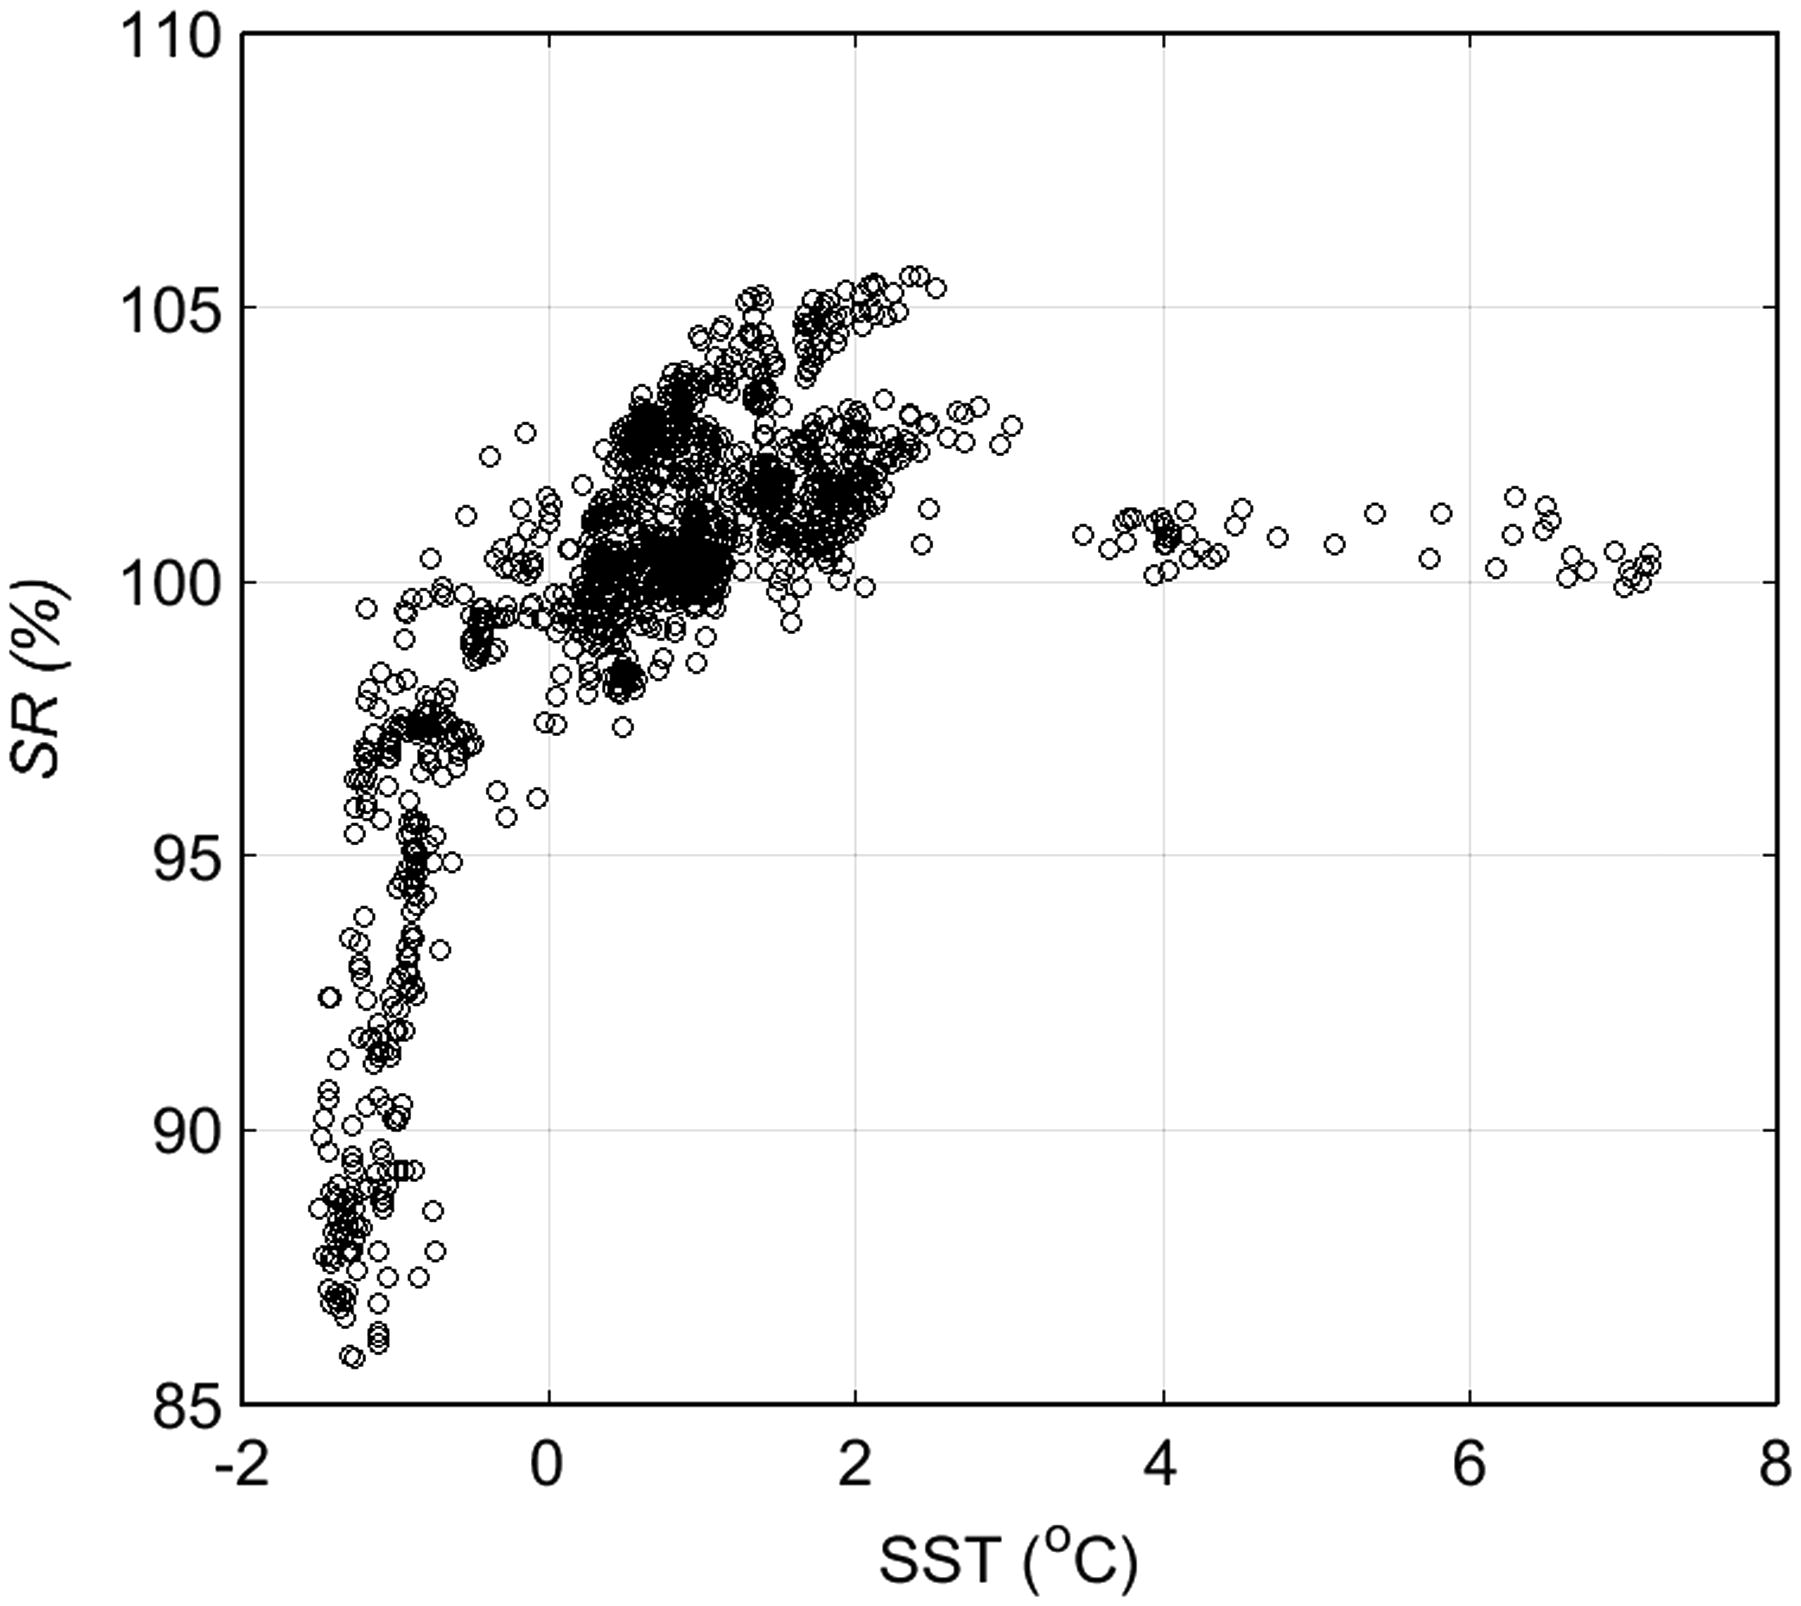
Fig. 11.
The relationship between SR and SST south of 50°S in the Southern Ocean (n = 1549).
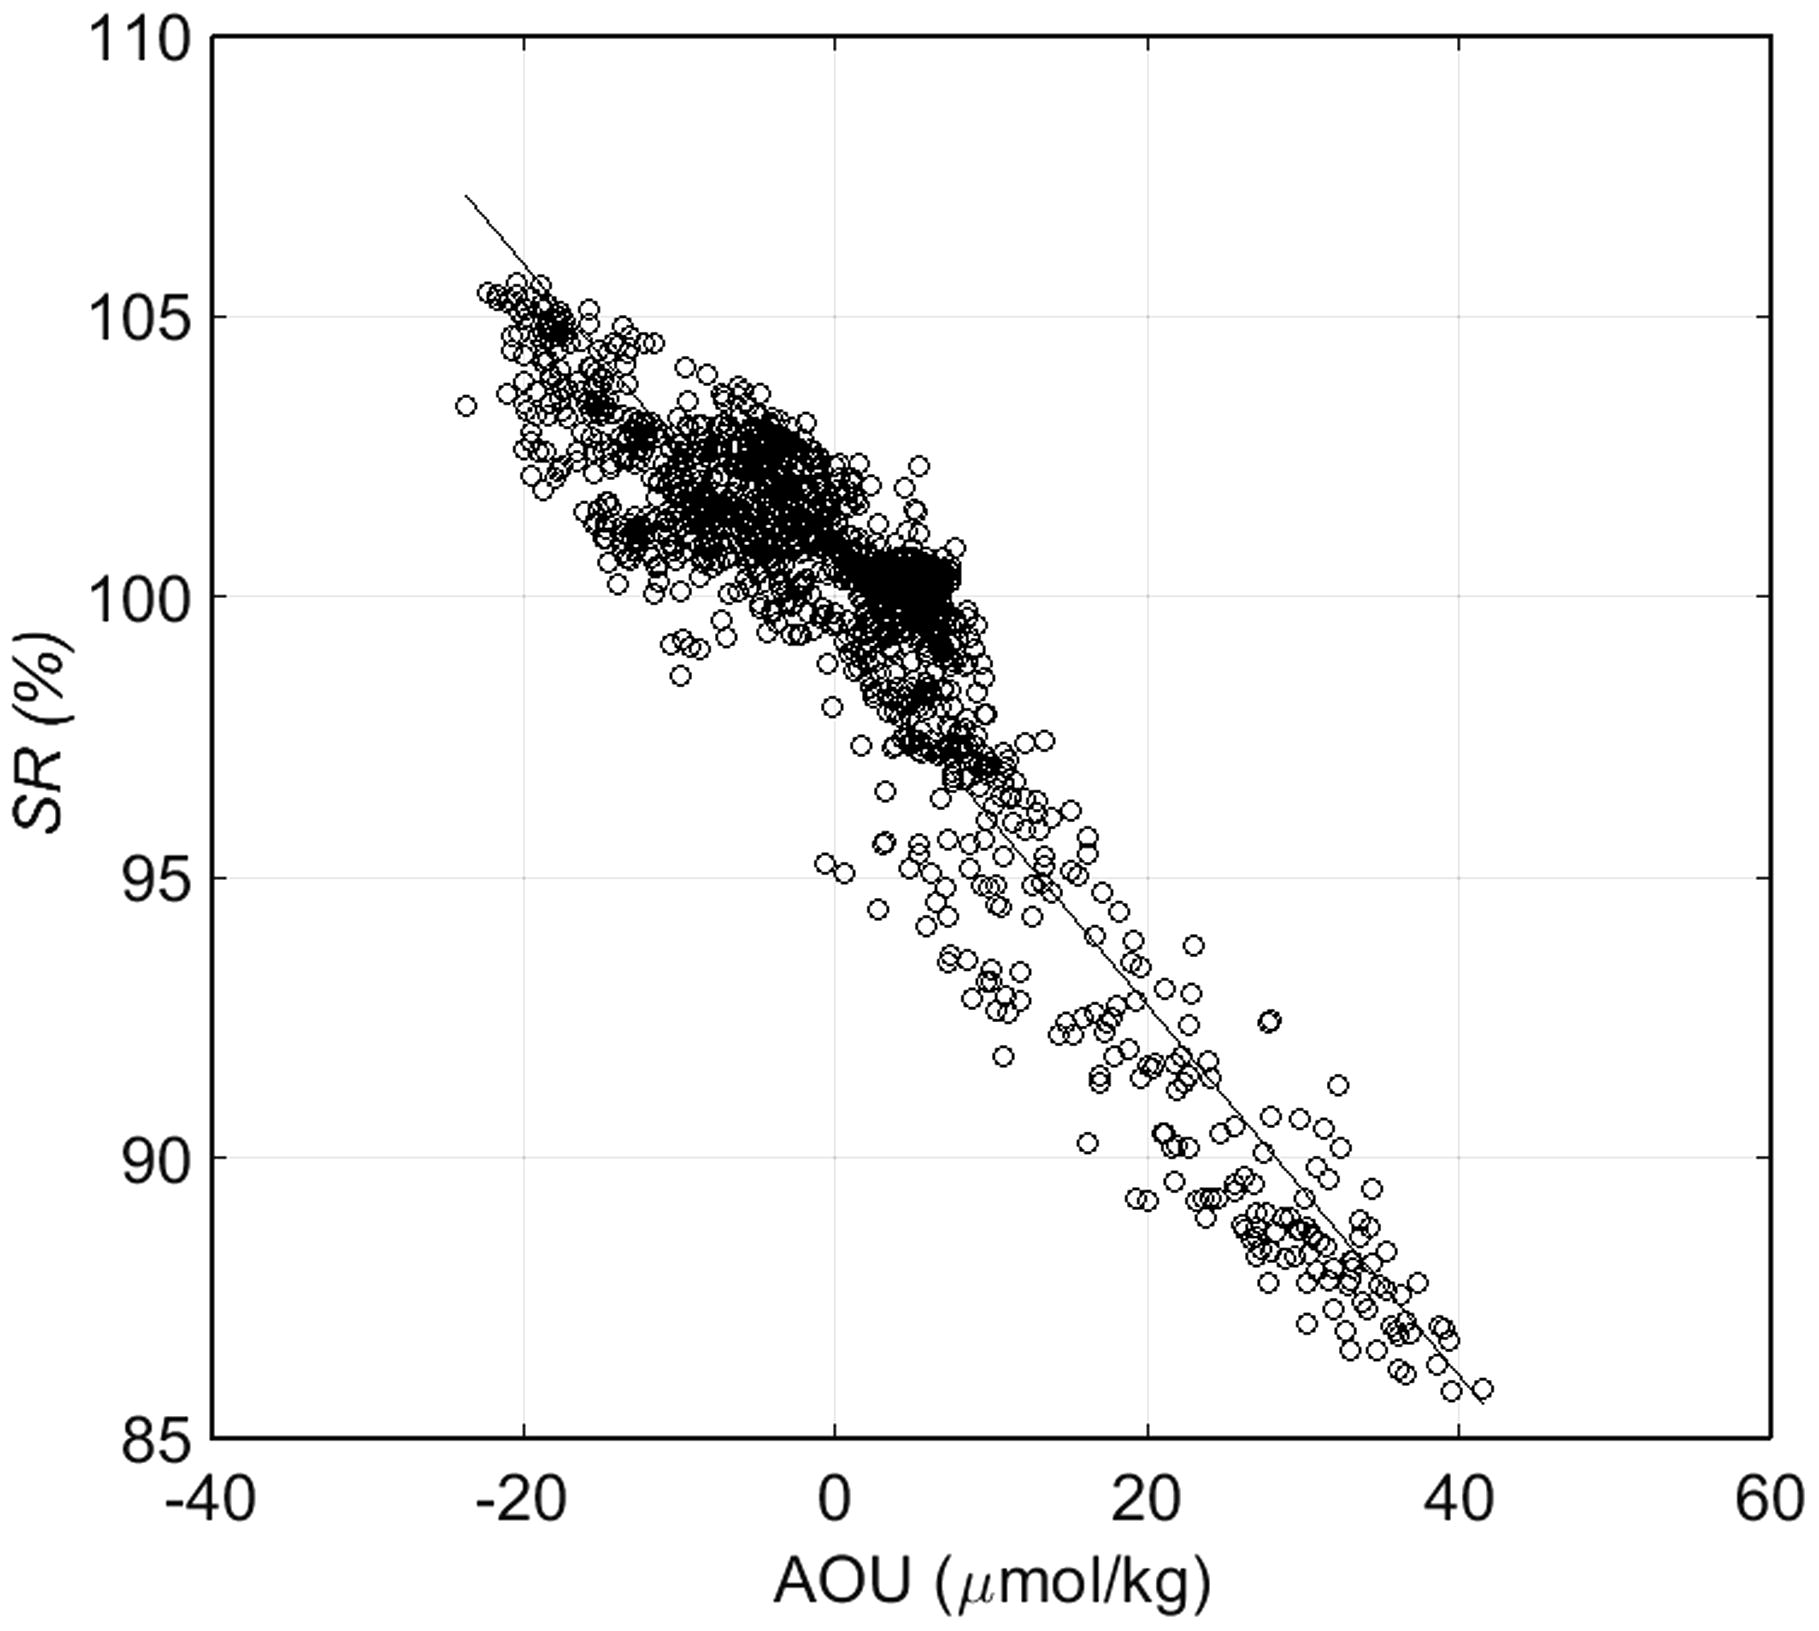
Fig. 12.
The relationship between SR and AOU south of 50oS in the Southern Ocean. Solid line shows the linear relationship between SR and AOU: SR = −0.294 × AOU + 100.093 (r 2 = 0.89, n = 1549).
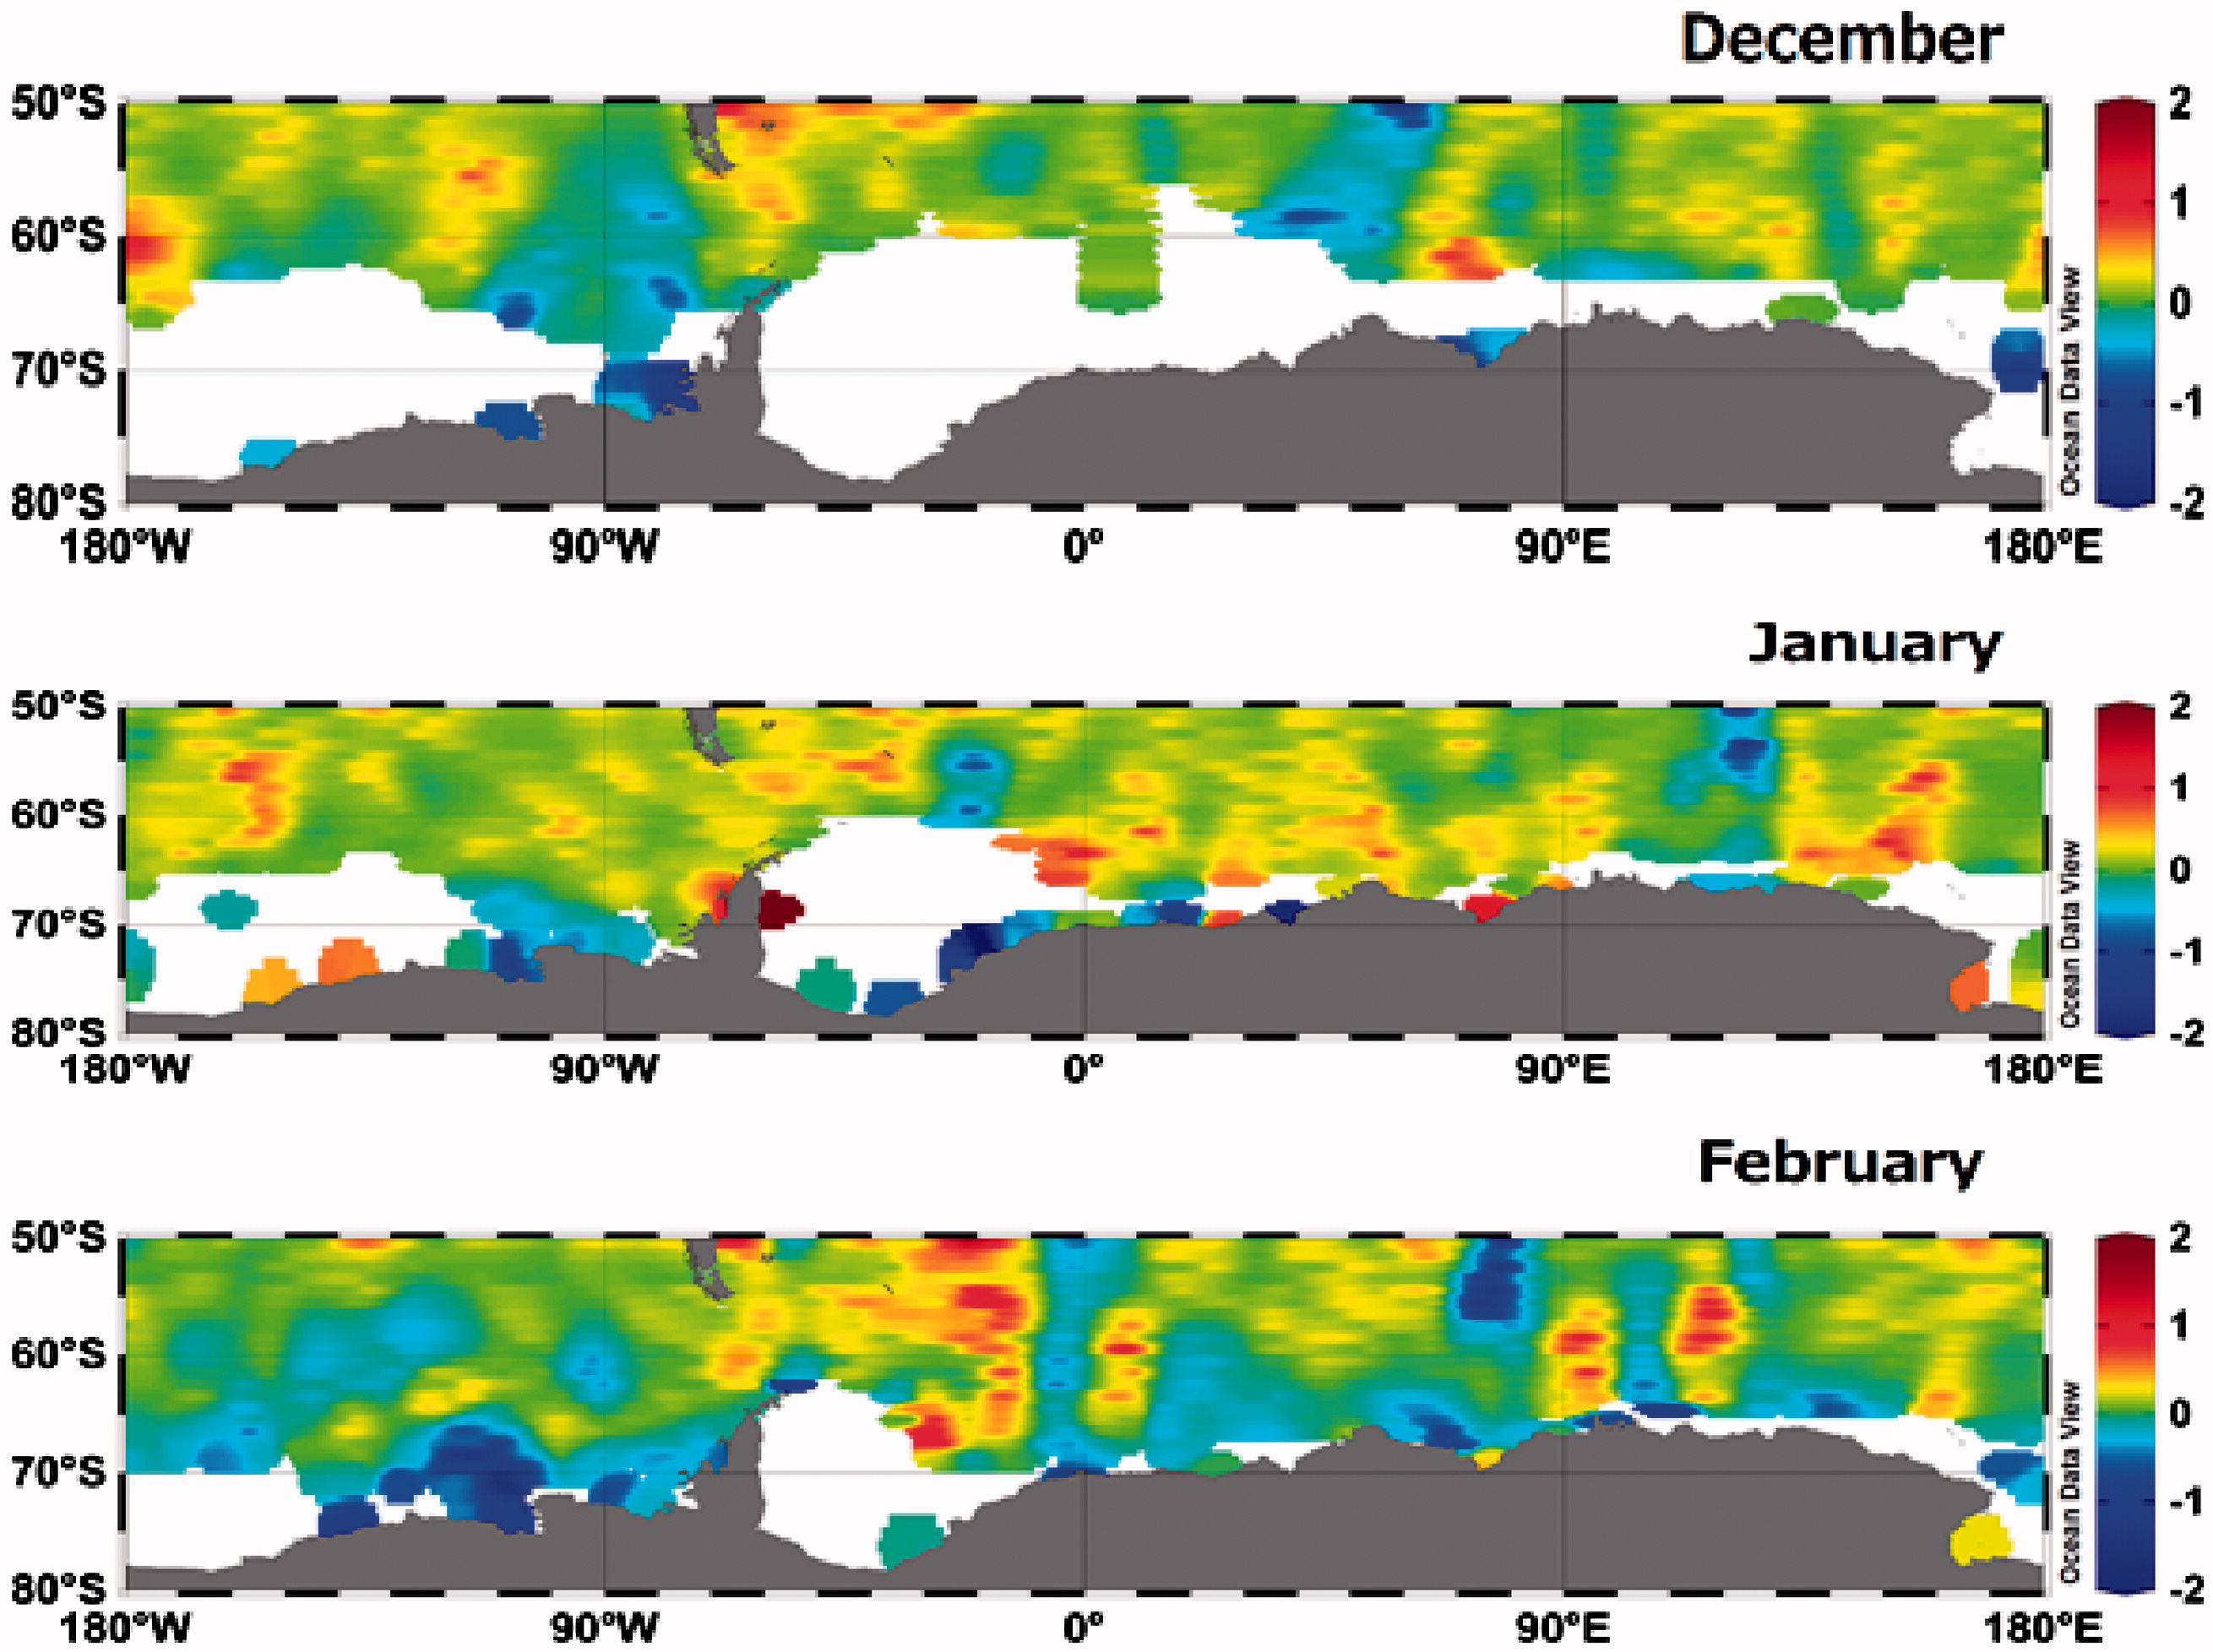
Fig. 13.
Monthly mean sea-air CH4 flux in the Southern Ocean from December to February (from upper panel to bottom panel). White areas is sea ice coverage.
Table 1.
Monthly mean AOU, wind speed, sea-air CH4 flux in the Southern Ocean (south of 50°S).