
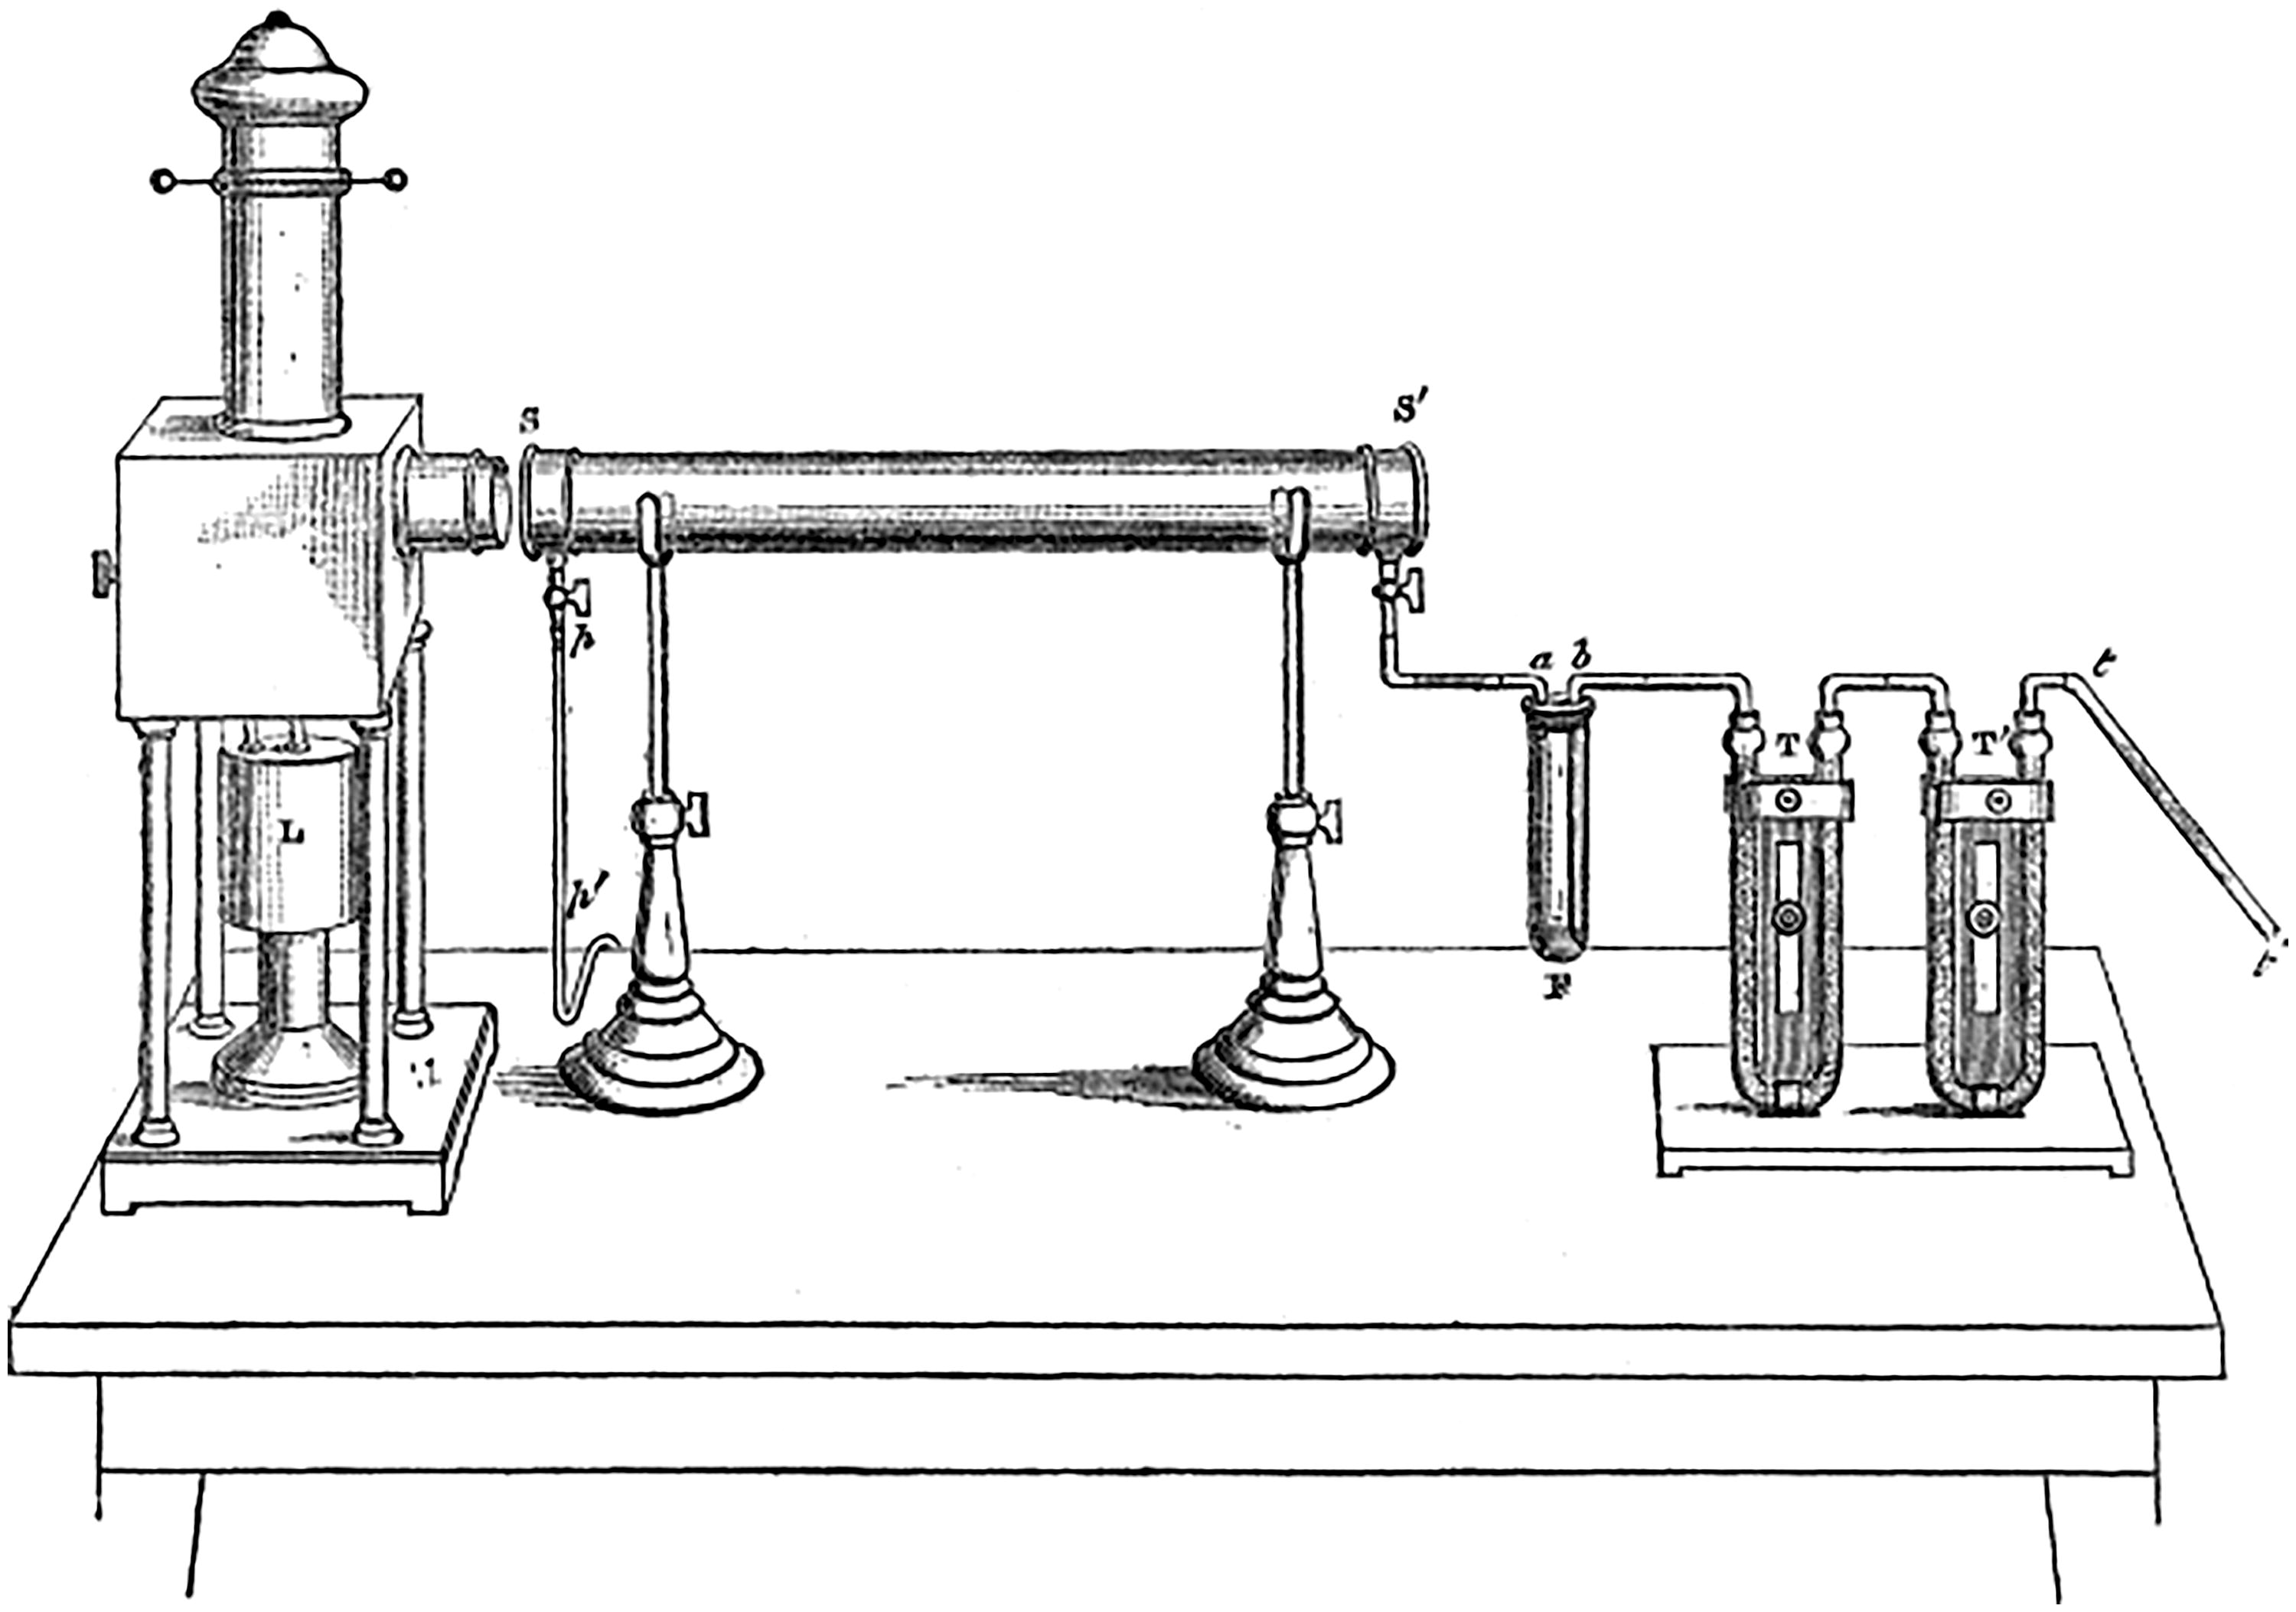
Fig. 1.
The experimental setup used by Tyndall: Light source L is used to illuminate glass tube , into which air is bubbled through the studied liquid in flask F next to two U-tubes located at the right end of the table, and T, containing fragments of glass coated with aqueous sulphuric acid and fragments of marble wetted with caustic potash, respectively, through which the air was admitted. Reproduced from Tyndall (1870).
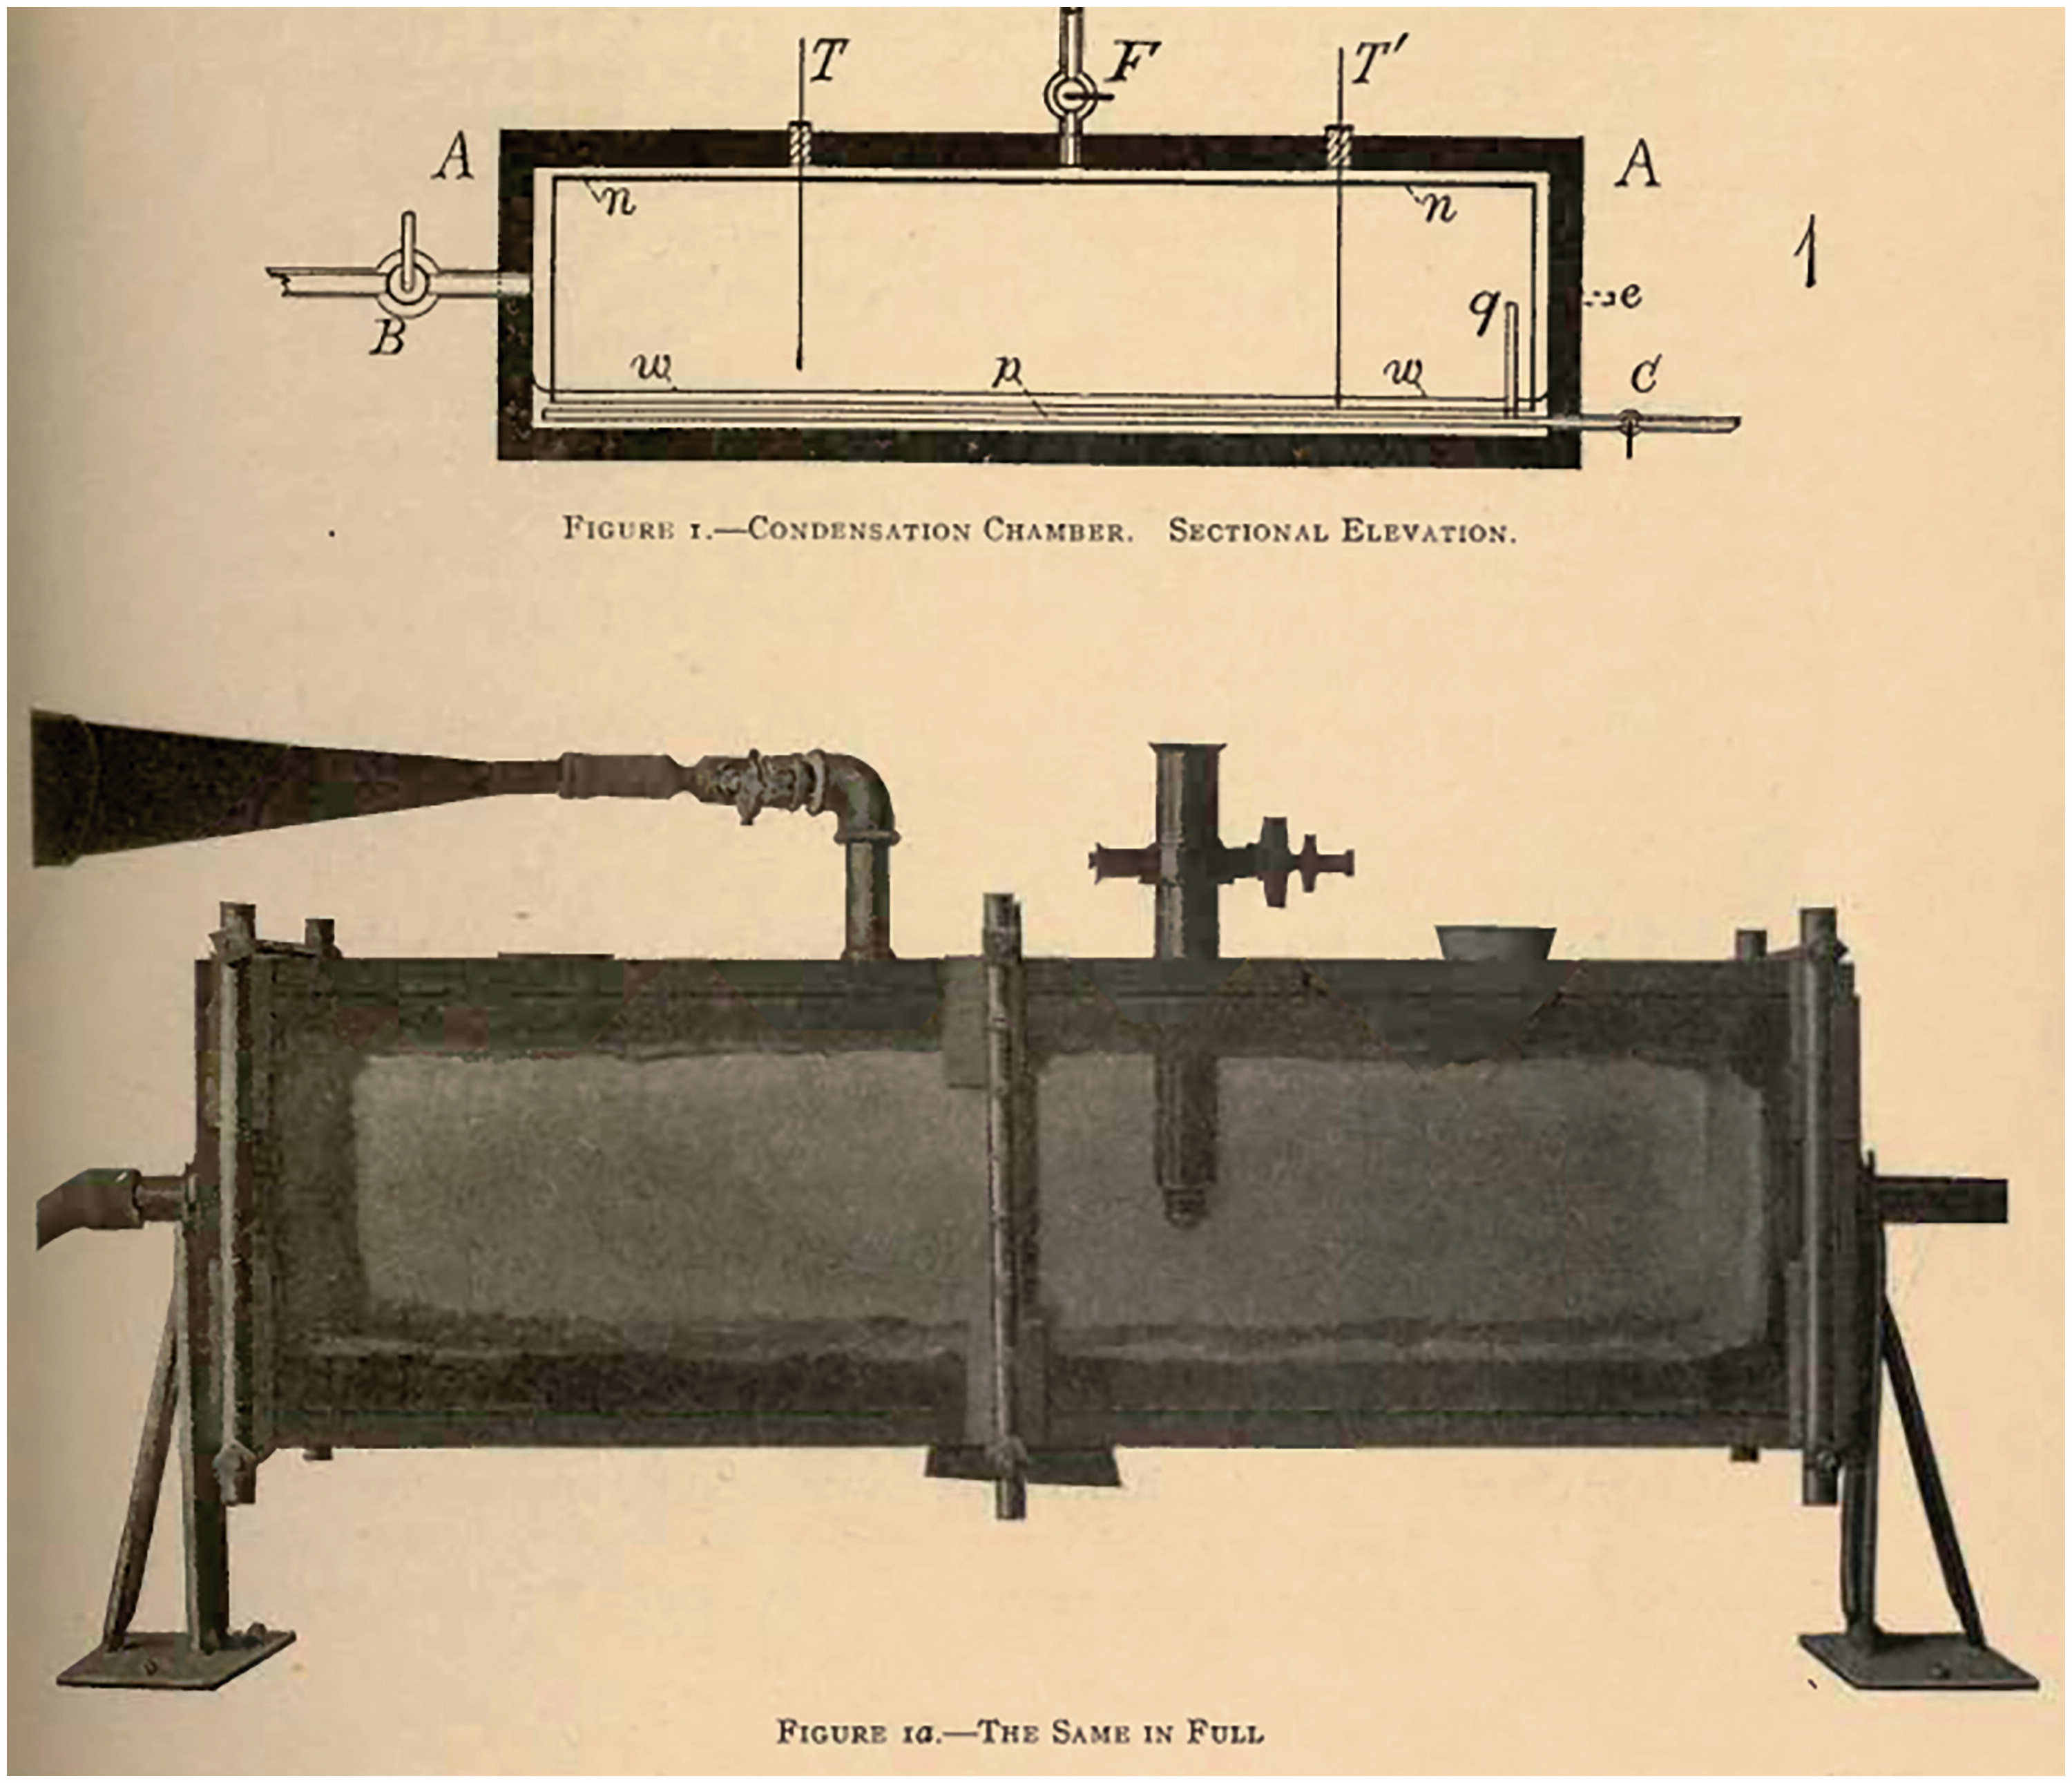
Fig. 2.
The fog chamber used by Barus and his assistants for field measurements. C and q indicate the stopcock and end of inlet for the sampled air, while two stopcocks B (mainly) and F are used for the exhaustion. Water level is marked with w, chamber frame A is made out of waxed wood and e indicates the position of trunnions mounting the chamber, allowing rotation to wet the cotton cloth n lining the chamber. Reproduced from Barus (1905, p. 129).
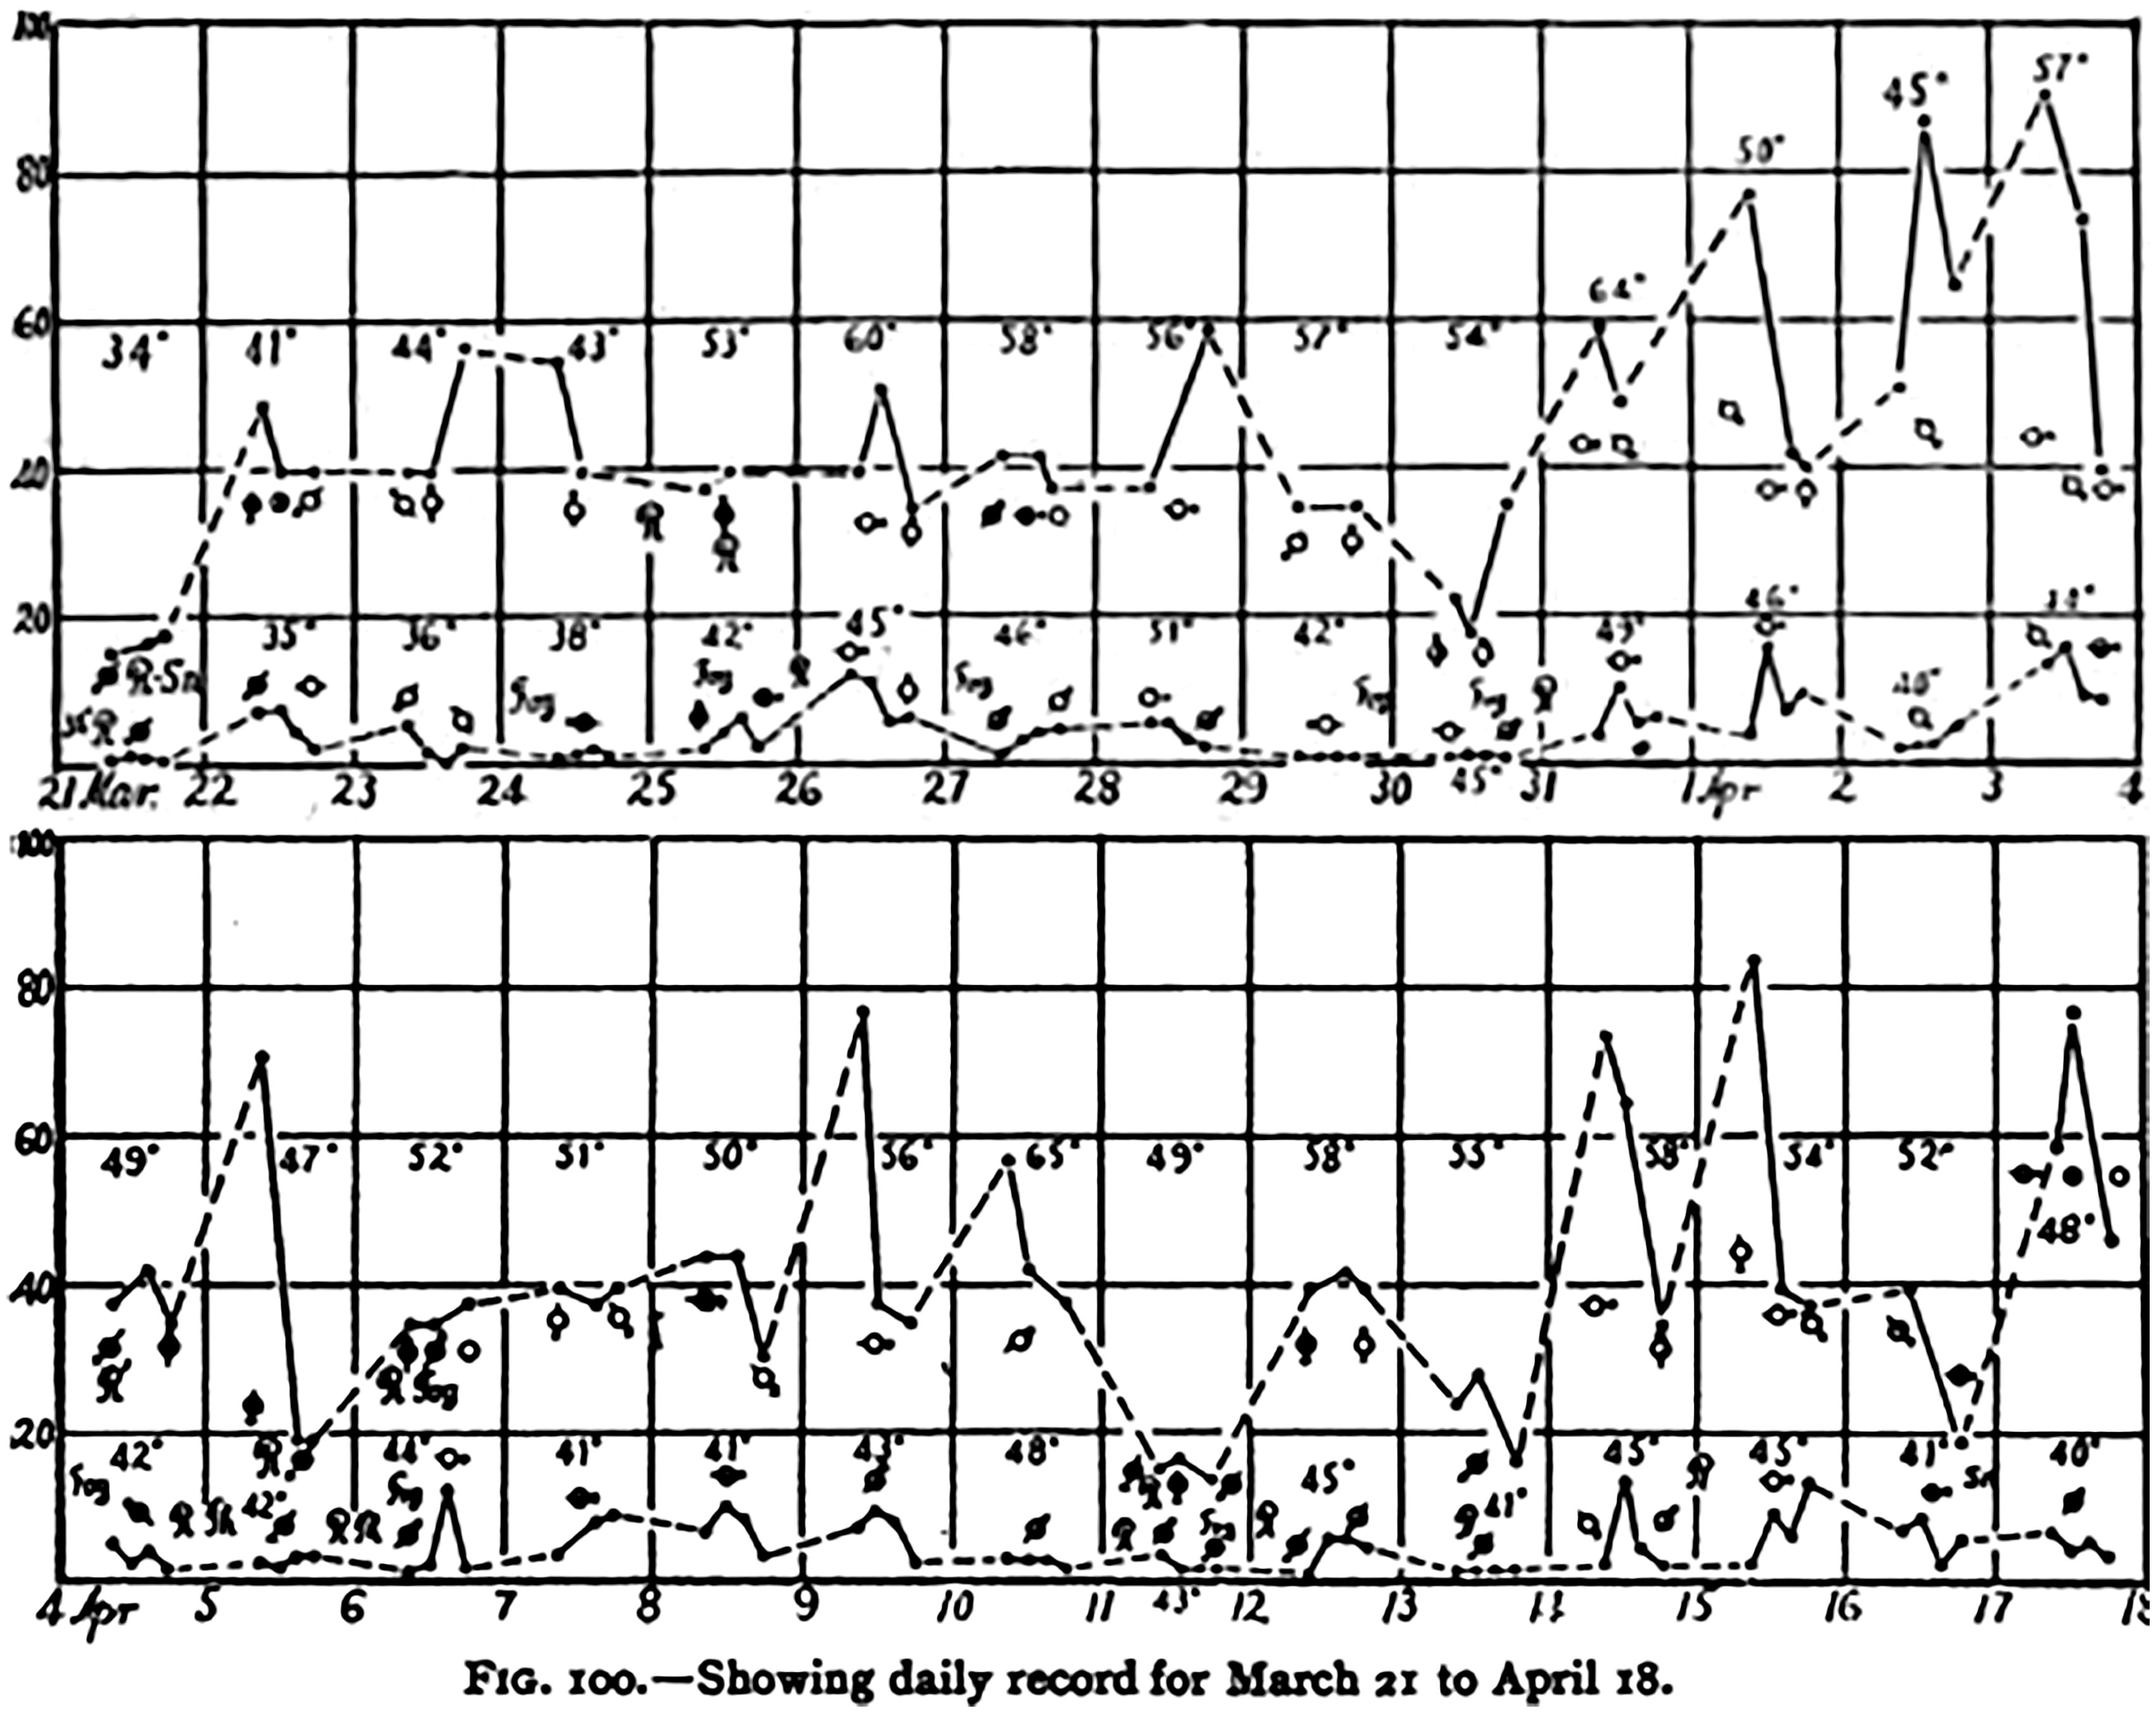
Fig. 3.
An excerpt of simultaneous daily measurements in Providence (upper curves) and Block Island (lower curves) in spring 1905: the vertical axis gives the concentration as thousands of particles in cubic centimeter. Temperatures (in °F), wind directions, and prevailing weather are also indicated. Reproduced from Barus (1906b, p. 125).
Table 1.
A concise timeline of discovering the role of sulphuric acid in atmospheric haze and new particle formation.