Have a personal or library account? Click to login
Anthropogenic fine aerosols dominate the wintertime regime over the northern Indian Ocean Cover

Anthropogenic fine aerosols dominate the wintertime regime over the northern Indian Ocean

Open Access
|Jan 2018

Figures & Tables

Fig. 1.

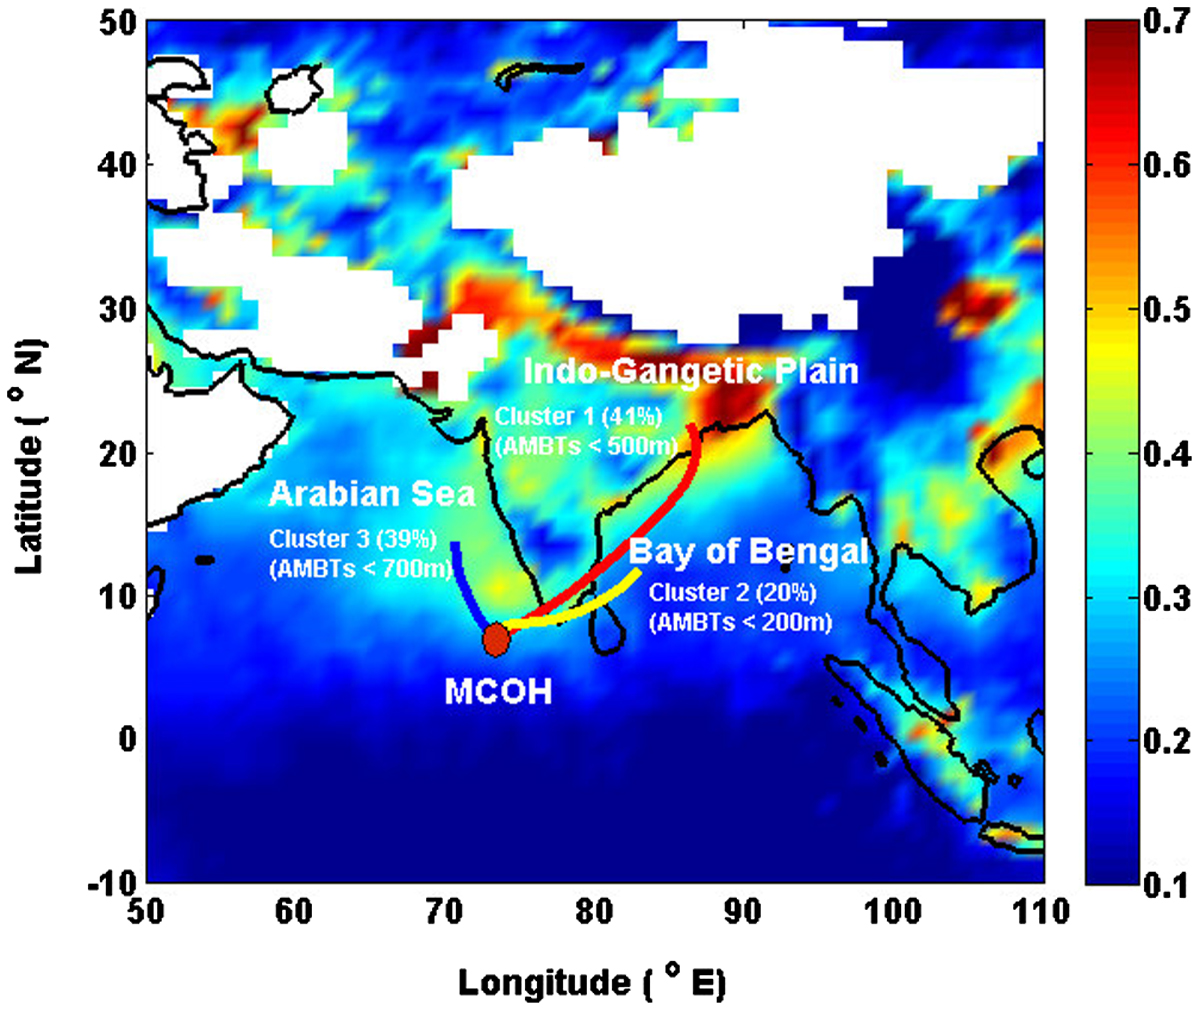
This map depicts a MODIS satellite image, illustrating the typical high loadings of aerosols (aerosol optical depth-AOD at 550 nm, November 2014 to April 2015) over South Asia. Clustered 6-hourly, 7-day air mass back trajectories (AMBTs) means for Hanimaadhoo (total n = 724). The cluster means lines coloured in map indicate three different source regions: Indo Gangetic Plain (red), Bay of Bengal (yellow) and Arabian Sea (blue).

Table 1.

Statistical details of aerosol number, aerosol mass, various ionic concentrations and CO measured at MCOH over the full winter period November 2014 to April 2015.
Source region Particle (#/cm3)Aerosol mass (μg/m3)EC (μg/m3)OC (μg/m3)Nss SO42- (μg/m3)Nss K+ (μg/m3)CO (ppb)PM2.5PM10PM2.5PM10PM2.5PM10PM2.5PM10PM2.5PM10All1300 ± 70018.1 ± 8.2628.7 ± 7.930.59 ± 0.280.60 ± 0.291.22 ± 0.71 1.40 ± 0.722.96 ± 2.903.14 ± 3.070.24 ± 0.130.24 ± 0.13196 ± 64IGP 1700 ± 65022.9 ± 7.43 32.6 ± 5.540.74 ± 0.170.74 ± 0.171.72 ± 0.561.93 ± 0.545.92 ± 3.405.82 ± 3.63 0.29 ± 0.070.29 ± 0.08232 ± 54Bay of Bengal 1500 ± 45019.5 ± 6.3232.1 ± 7.350.72 ± 0.350.73 ± 0.351.23 ± 0.671.33 ± 0.681.56 ± 1.482.50 ± 2.400.30 ± 0.170.30 ± 0.15188 ± 29 Arabia Sea 650 ± 33012.2 ± 5.9822.8 ± 6.690.38 ± 0.200.39 ± 0.190.66 ± 0.410.86 ± 0.430.42 ± 0.370.53 ± 0.520.15 ± 0.110.16 ± 0.11145 ± 61
Fig. 2.

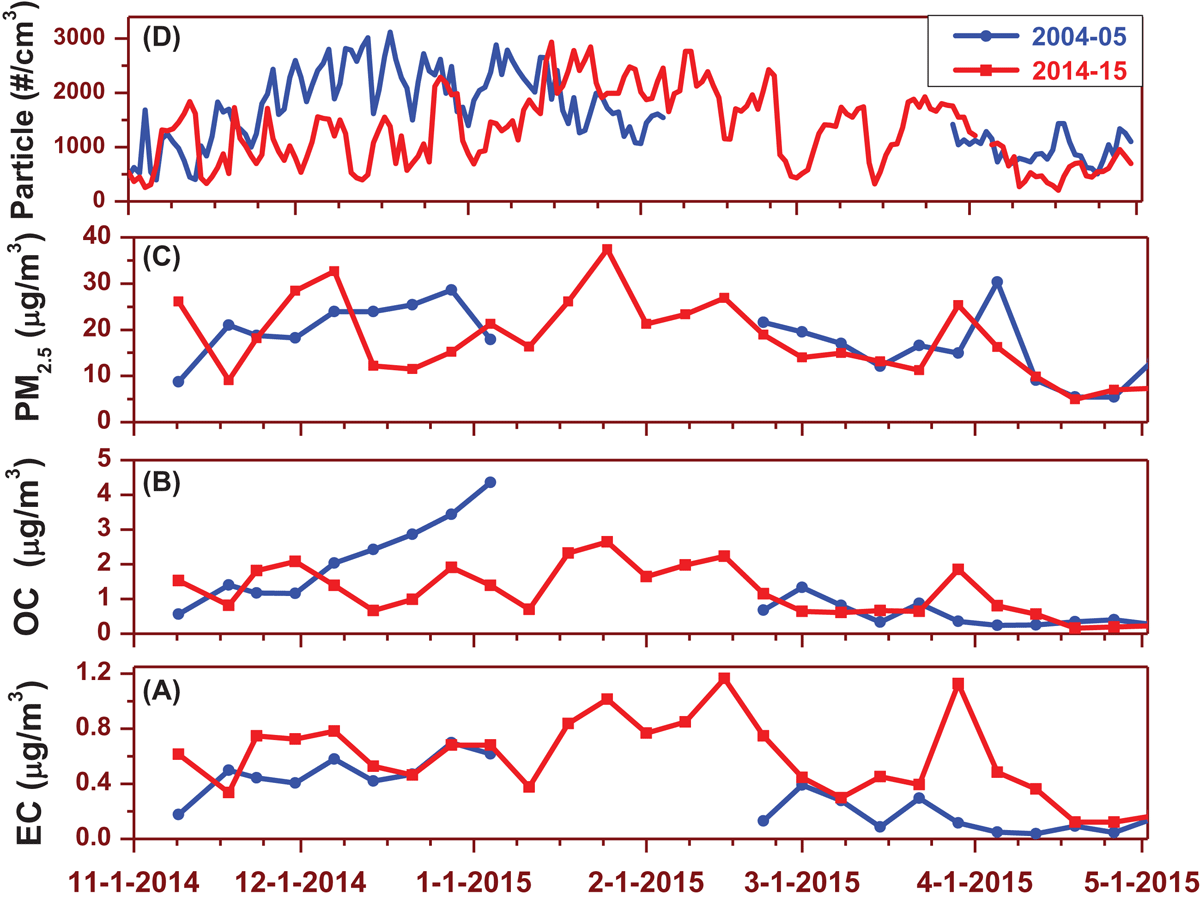
Comparison of EC, OC, PM2.5 (mass) and a daily average of total particle number concentration measured at Maldives Climate Observatory-Hanimaadhoo in full winter seasons ten years apart. The 2004–05 data are from Ramanathan et al. (2007a).

Table 2.

Aerosol mass and carbonaceous species (μg/m3) from different sites in South Asia and adjacent seas and regions.
Station Period SizeMassECOCOC/ECnss SO42-nss K+NO3-ReferenceHanimaadhoo, Maldives Nov’14–Apr’15 PM2.518.10.581.222.03.380.240.08This study Hanimaadhoo, Maldives Jan’13–Apr’13, Nov’13–Dec’13PM2.519.50.491.312.7nananaBudhavant et al. (2015a)Hanimaadhoo, MaldivesNov’ 04- April’05PM2.517.00.271.126.1nananaRamnathan et al. (2007a)Male, Maldives Nov’13–Dec’13PM2.521.20.761.882.4nananaBudhavant et al. (2015a)Bay of Bengal Jan’09PM2.5221.2 2.62.07.440.47naBikkina and Sarin, (2014)Bay of Bengal Jul’09–Aug’09PM2.533.8nanana2.300.090.72Budhavant et al. (2010)Dhaka, Bangladesh Feb’10-Feb’11PM2.58322.823.91.0nananaBegum et al. (2012)Kaula Lumpur, Malaysia2002–2011PM2.525nanana42016.012.8Rahman et al. (2015)Karachi, Pakistan Mar’09-Apr’09PM2.5751.99.75.25.10.281.5Shahid et al. (2016)Lahore, Pakistan Nov’05-Jan’06PM2.519014.7765.212.73.9620Raja et al. (2009)Delhi, IndiaNov’10–Feb’11PM2.527746.3104.42.325.93.8132.8Pant et al. (2015)Kanpur, India Oct’08-Nov’08PM2.51336.236.65.913.52.12.10Ram et al. (2014)Hanimaadhoo, MaldivesNov’14–Apr’15PM1029.30.591.382.22.920.300.64This study Bay of Bengal Jul’09–Aug’09PM1080.9nanana3.310.291.24Budhavant et al. (2010)Karachi, Pakistan Mar’09-Apr’09PM104374.721.84.613.11.065.7Shahid et al. (2016)Delhi, IndiaJan’13-Dec’14PM10233nanana15.26.5512.0Saxena et al. (2017)Lahore, PakistanMarch 2010PM1040621612.9nananaAlam et al. (2014)Ahmedabad, IndiaDec’06–Jan’07PM101714.429.87.513.60.907.2Rengarajan et al. (2011)Kanpur, IndiaDec’08-Feb’09PM102256.2507.819.32.420.6Ram et al. (2012)Chennai, IndiaJan’07–Feb’07PM10na6.59.11.5–––Pavuluri et al. (2011)

[i] Note: na = not available.

Fig. 3.

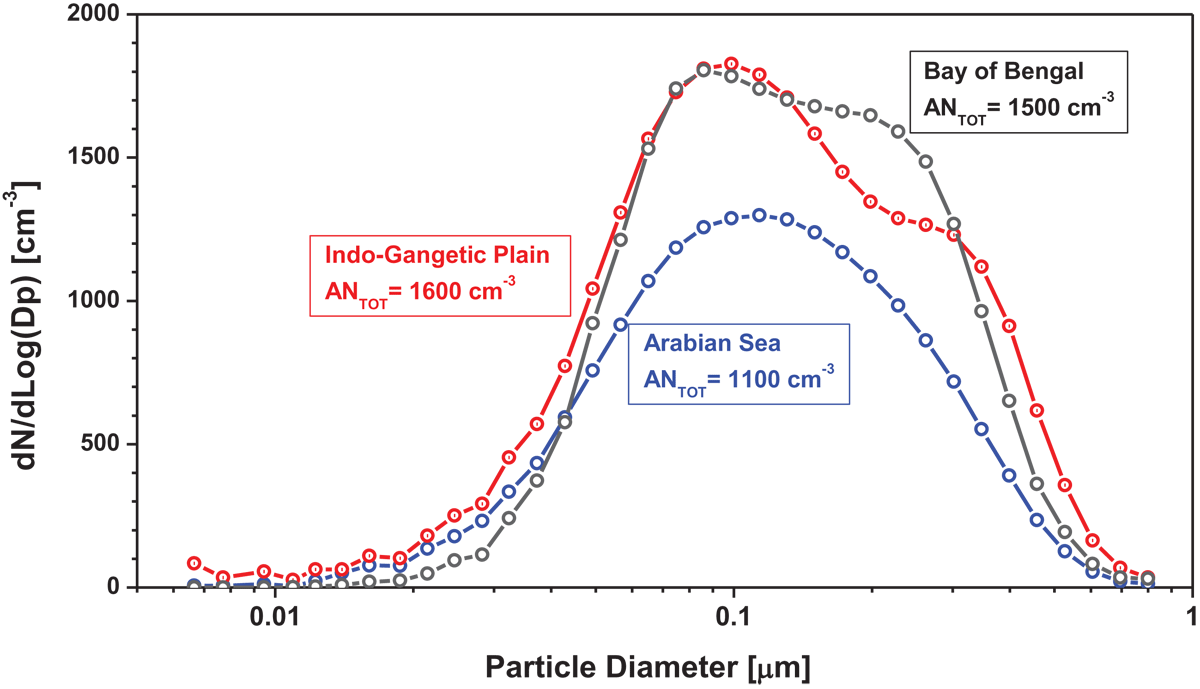
The average particle number size distributions using Differential Mobility Particle Sizer (DMPS), resulting from grouping the data into three source regions. The numbers in coloured boxes present the average total number concentration for each of the sources.

Fig. 4.

Daily average aerosol optical depth (AOD), single-scattering albedo (SSA) and absorption aerosol optical depth (AAOD) measured at Maldives Climate Observatory-Hanimaadhoo using CIMEL Sun photometer during November 2014 to April 2016. Vertical colour shaded bars indicate the three different source regions: Arabian Sea (Cyan), Indo Gangetic Plain (Canary) and Bay of Bengal (Grey).

Fig. 5.

Mass closure of particulate matter in PM2.5 and PM10 measured at Maldives Climate Observatory-Hanimaadhoo from three different source regions: Indo Gangetic Plain (IGP), Bay of Bengal (BoB) and Arabian Sea (AS) during November 2014 to April 2015.
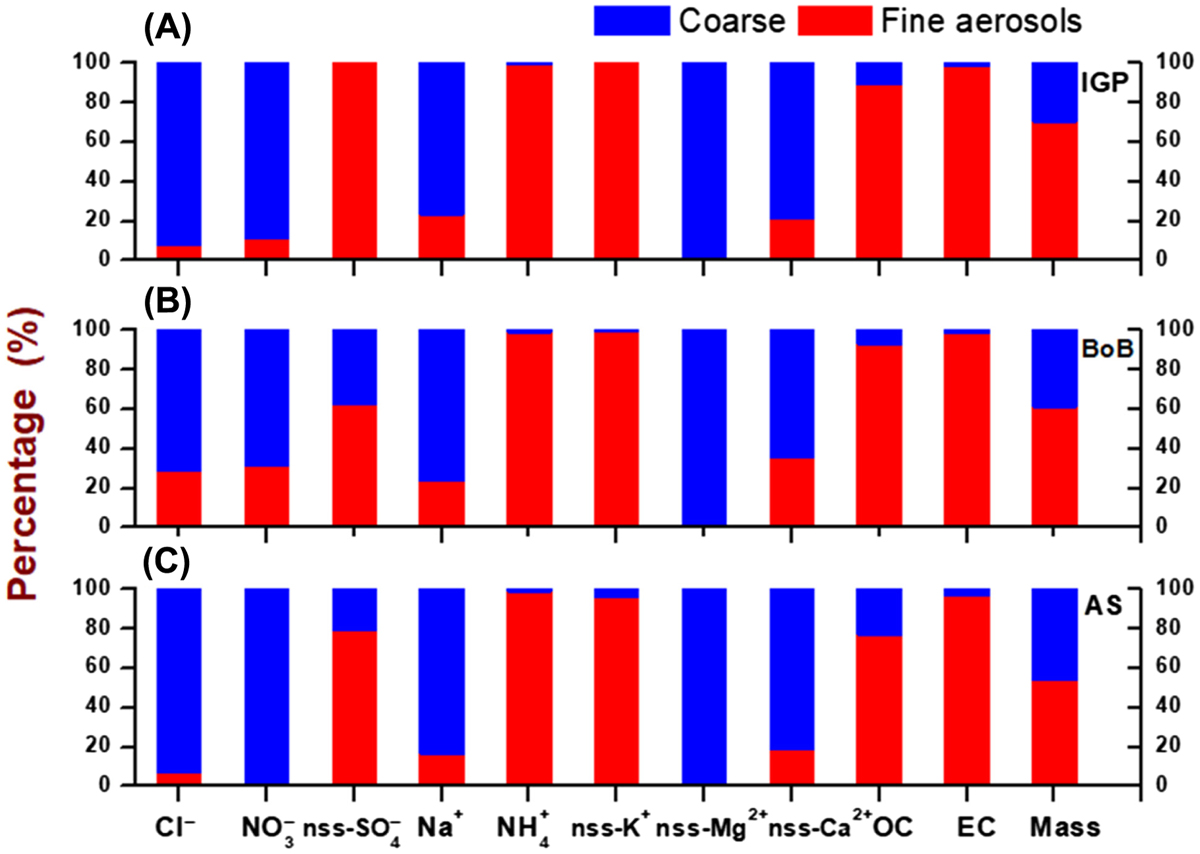
Fig. 6.

Chemical composition and mass concentration of fine (PM2.5, red) and coarse (PM10–2.5 blue) aerosol from different source regions measured at MCOH. Panel A. Indo-Gangetic Plane (IGP), B. Bay of Bengal (BoB) and C. Arabian Sea (AS) during November 2014 to April 2015.
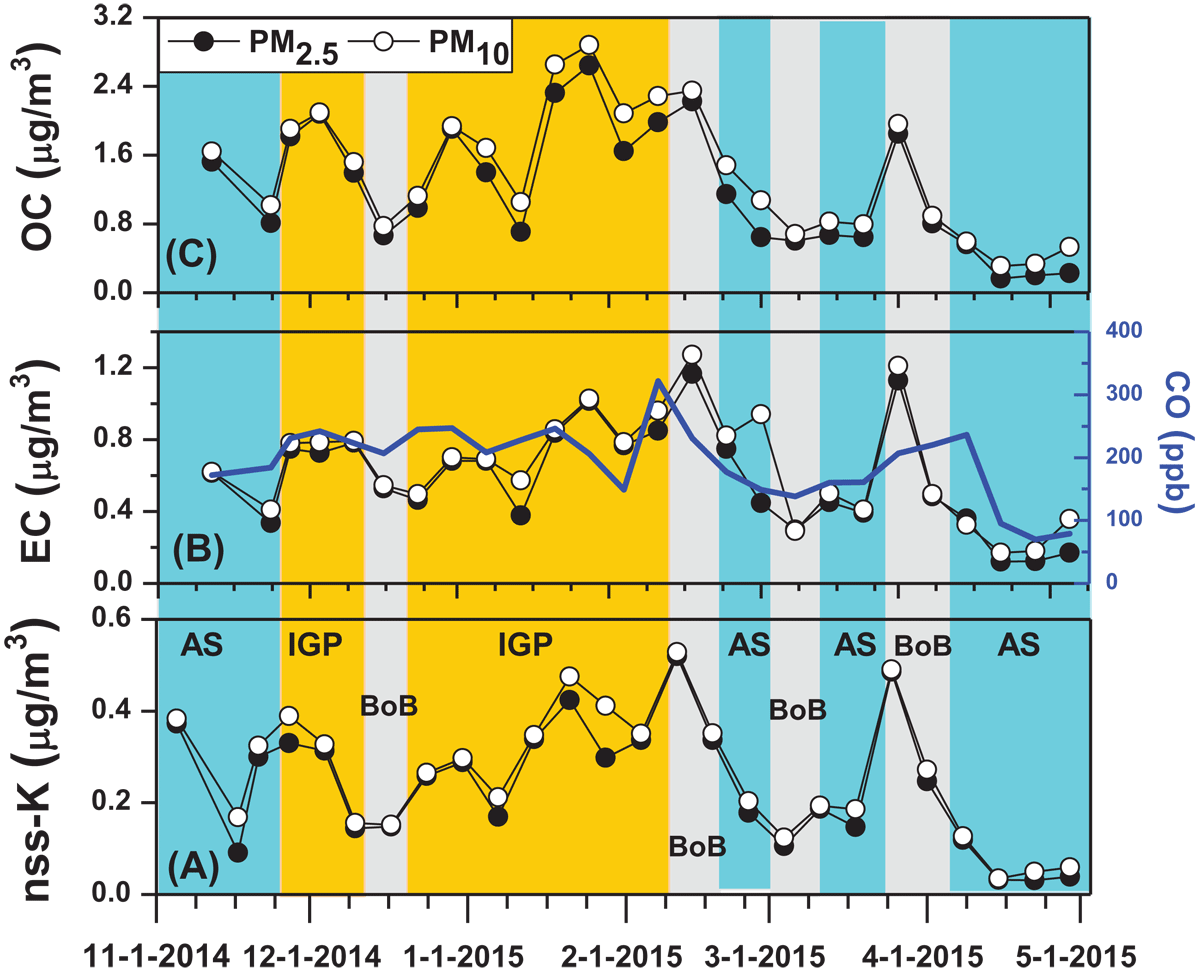
Fig. 7.

Time series of nss K+, EC and CO, as well as OC in PM2.5 and PM10 at Maldives Climate Observatory at Hanimaadhoo during November 2014 to April 2015. Vertical colour shaded bars indicate the three different source regions: Arabian Sea (Cyan), Indo Gangetic Plain (Canary) and Bay of Bengal (Grey).
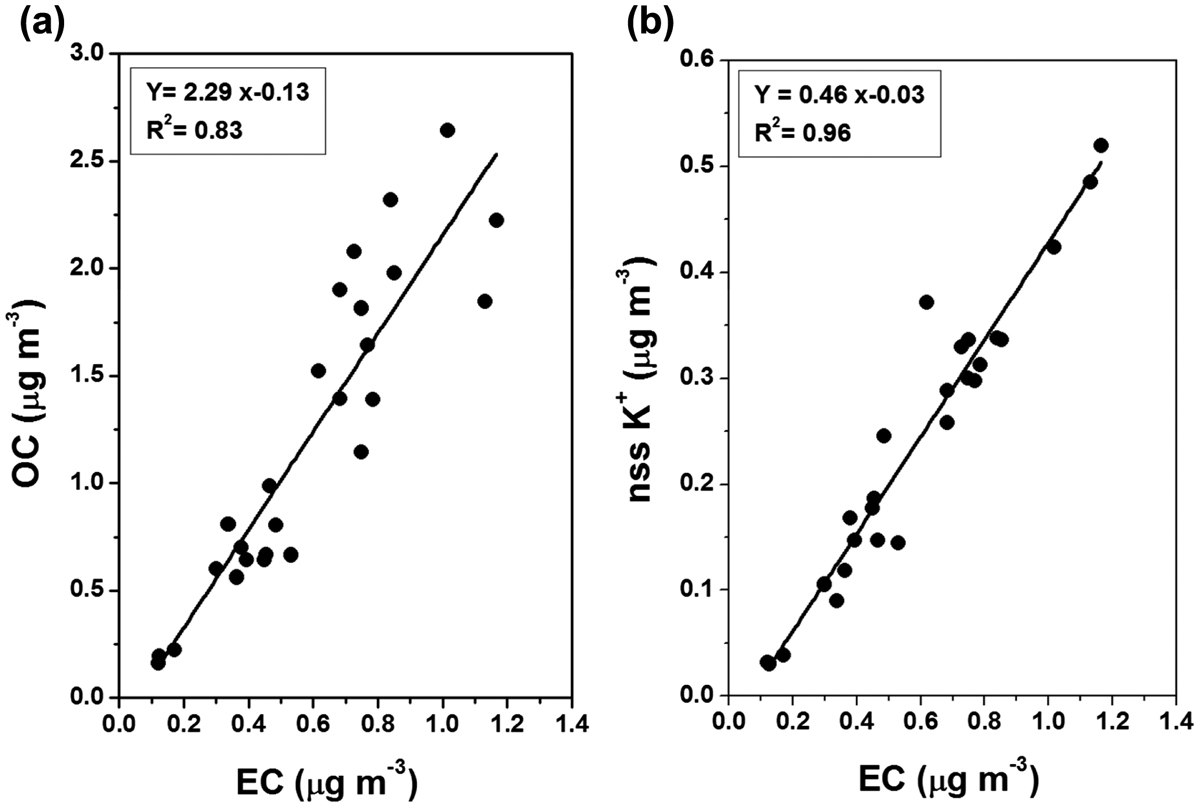
Fig. 8.

Linear regression analysis between mass concentration of EC and (a) organic carbon, OC (b) non-sea-salt water-soluble potassium, (nss-K+) in PM2.5 collected over the MCOH during November 2014 – April 2015.
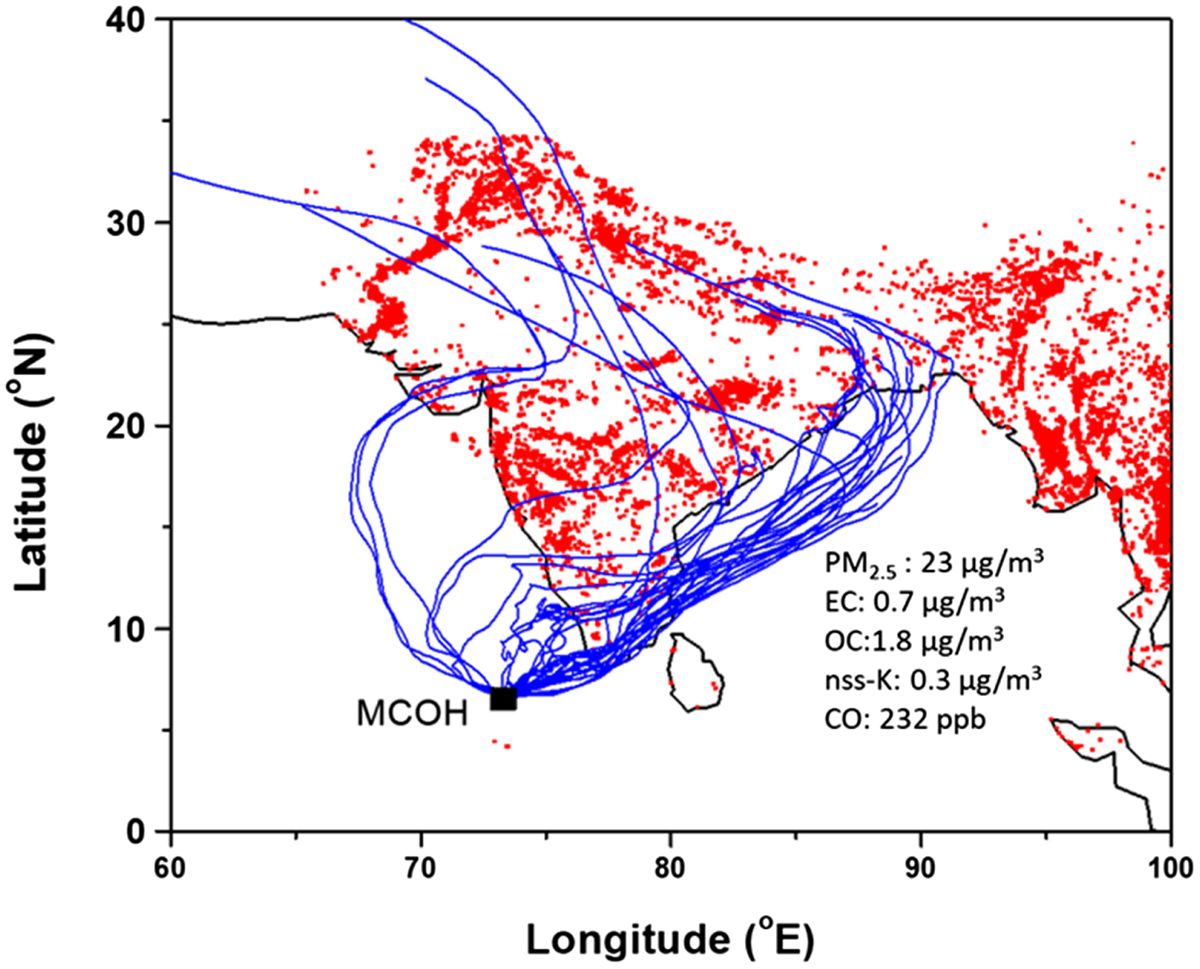
Fig. 9.

Air mass trajectories for 7 days ending at MCOH at 100 m with MODIS /Aqua active fires during the Indo-Gangetic Plain (IGP) outflow.

Language: English
Page range: 1464871 - 1464871
Submitted on: Nov 20, 2017
Accepted on: Apr 5, 2018
Published on: Jan 1, 2018
Published by: Stockholm University Press
In partnership with: Paradigm Publishing Services

© 2018 Krishnakant Budhavant, Srinivas Bikkina, August Andersson, Eija Asmi, John Backman, Jutta Kesti, H. Zahid, S. K. Satheesh, Örjan Gustafsson, published by Stockholm University Press
This work is licensed under the Creative Commons Attribution 4.0 License.