
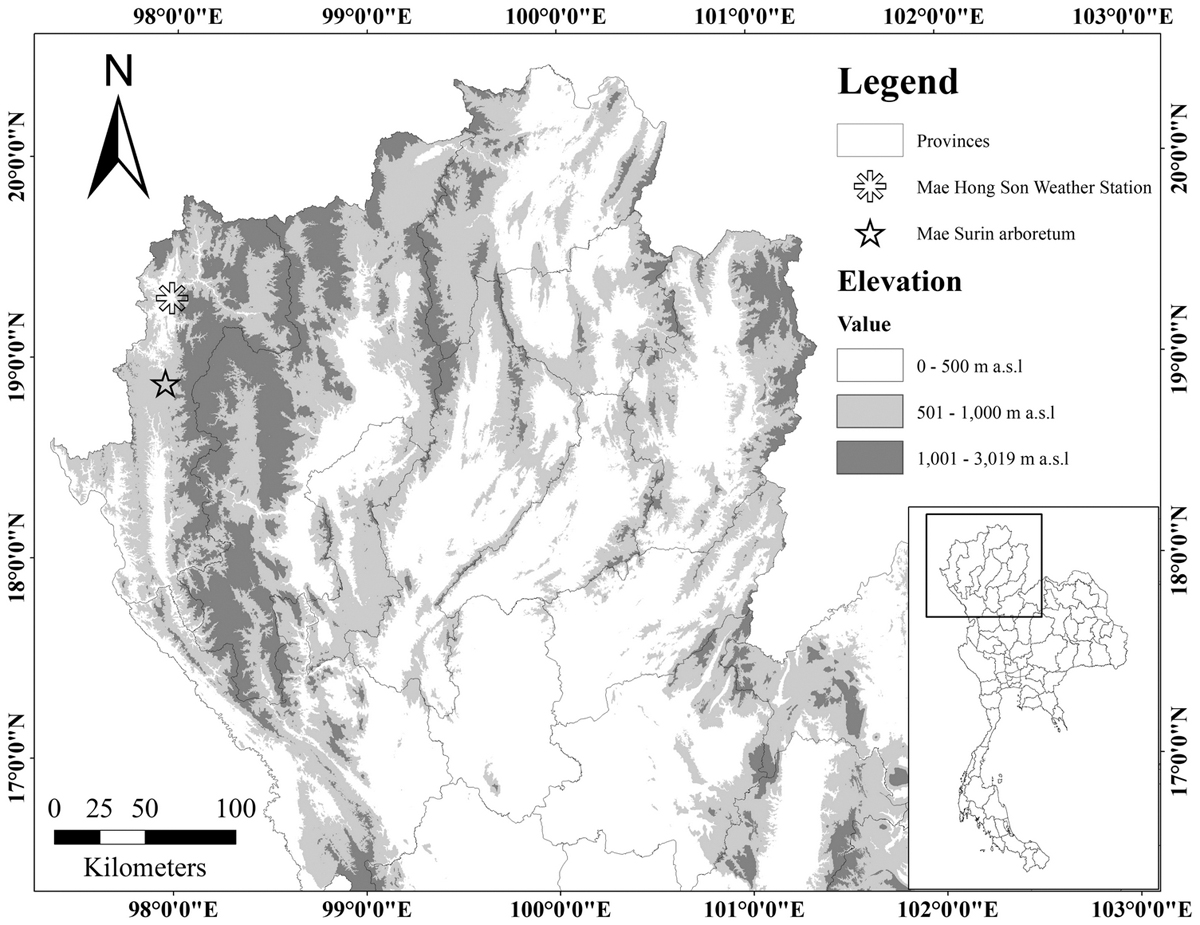
Fig. 1.
The sampling site: Mae Surin arboretum, Mae Hong Son province, northwestern Thailand.
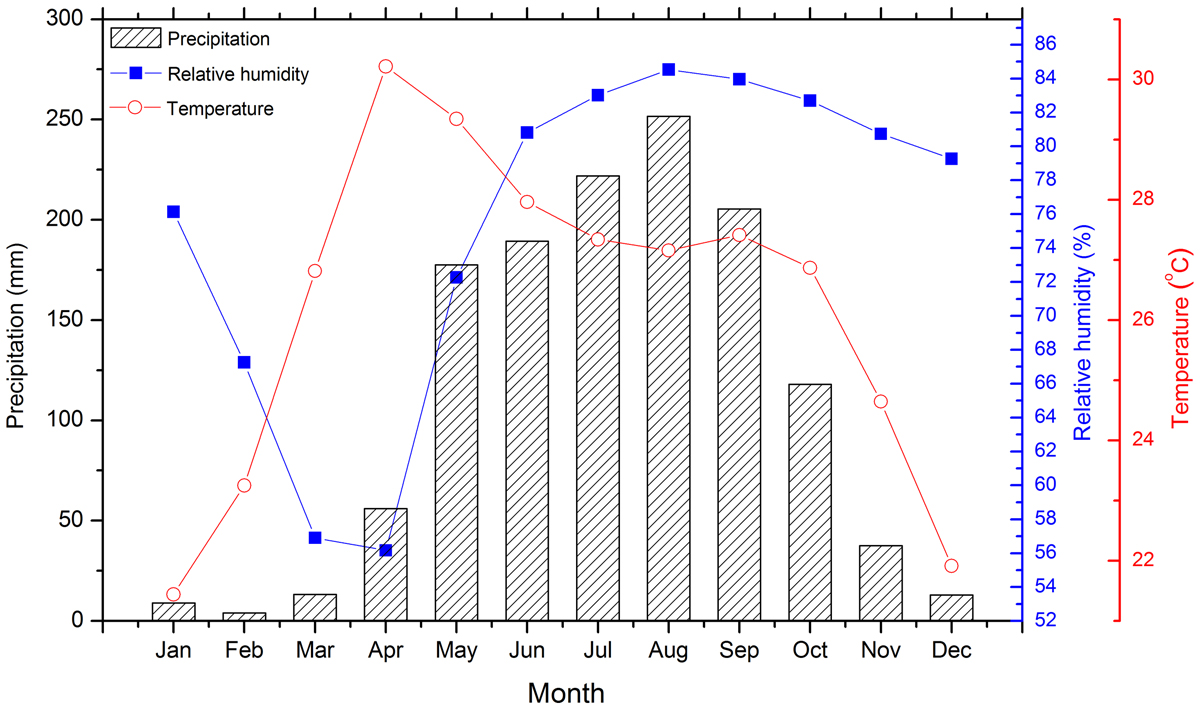
Fig. 2.
Monthly mean temperature, precipitation and relative humidity data since 1951 in Mae Hong Son.
Table 1.
The correlation between the original series (δ13C) and detrended series (∆13C) from Mae Hong Son (1788–2013 AD).
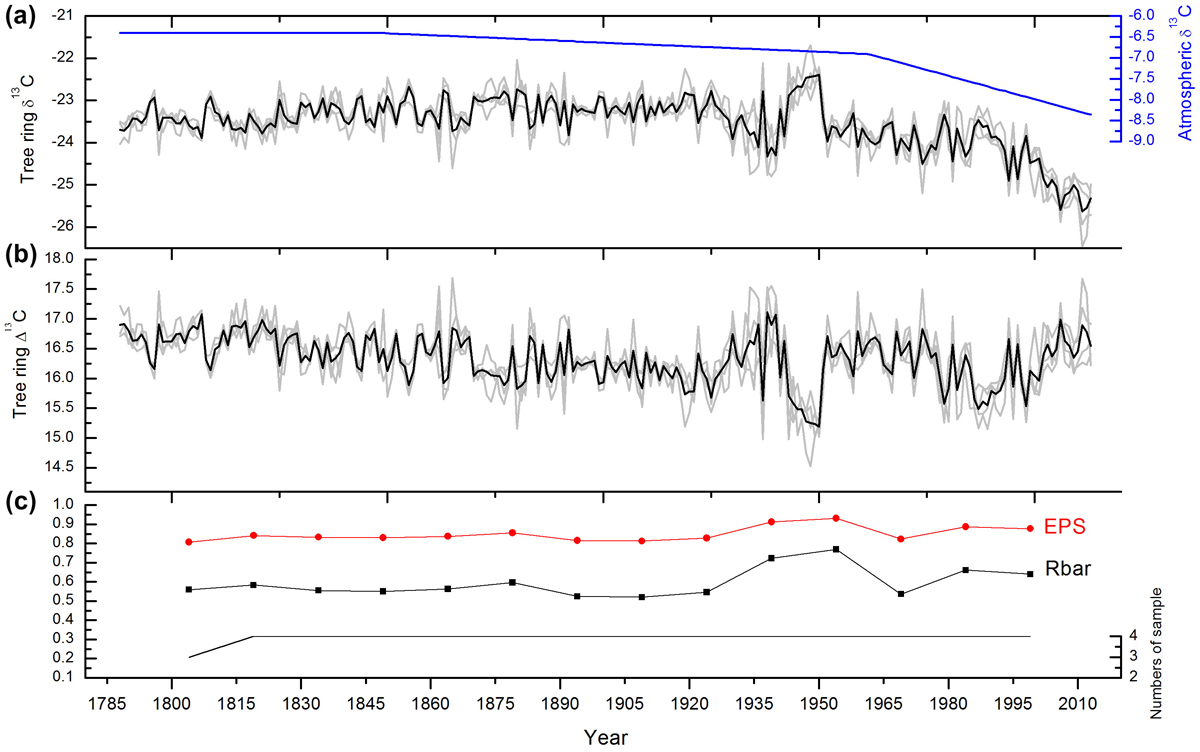
Fig. 3.
(a) Average δ13C (black) values from 4 trees (grey) and δ13C values in the atmosphere (blue); (b) ∆13C series after removing the long-term decreasing trend of δ13C in the atmosphere; (c) the EPS and Rbar statistics of ∆13C.
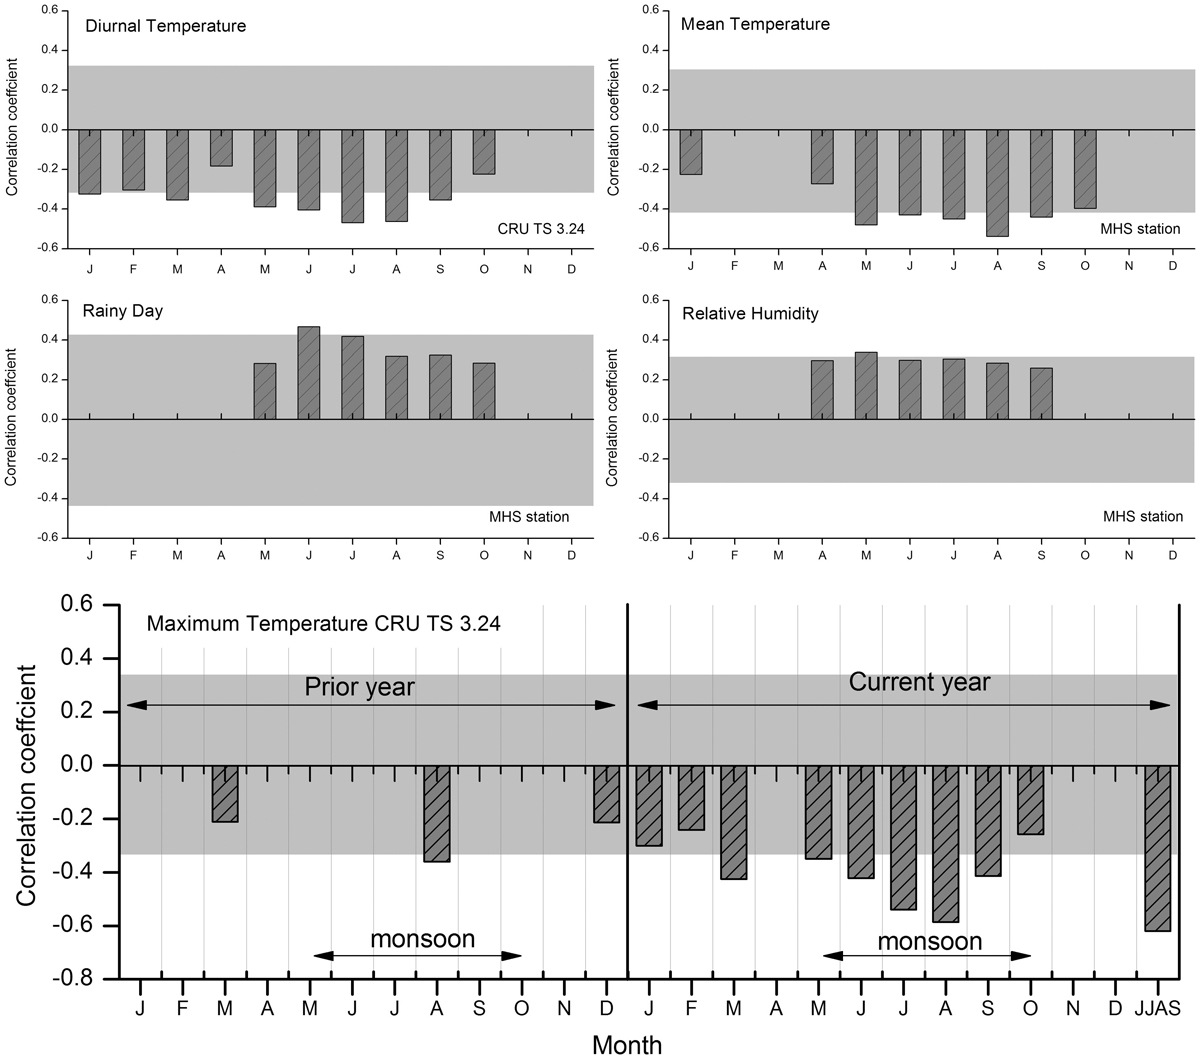
Fig. 4.
Correlations between tree-ring ∆13C chronology and climatic factors obtained from the MHS station (mean temperature, rainy days and relative humidity) and the CRU TS3.24 (diurnal temperature and maximum temperature) at the 95% significance confidence level. The grey area is the 95% confidence limit after the Bonferroni adjustment.
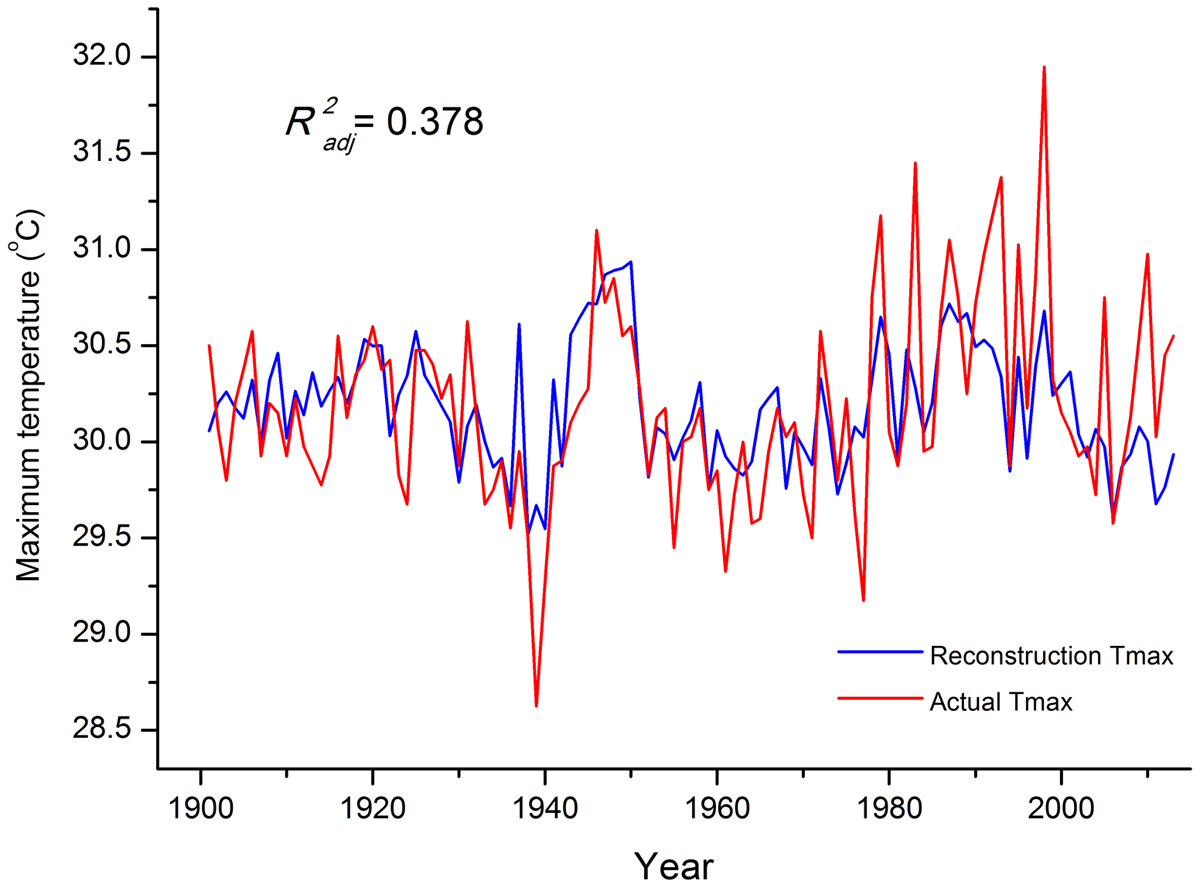
Fig. 5.
Comparison of the reconstructed and actual June–September maximum temperature from 1901–2013.
Table 2.
The split-cross calibration of the June–September maximum temperature reconstruction.
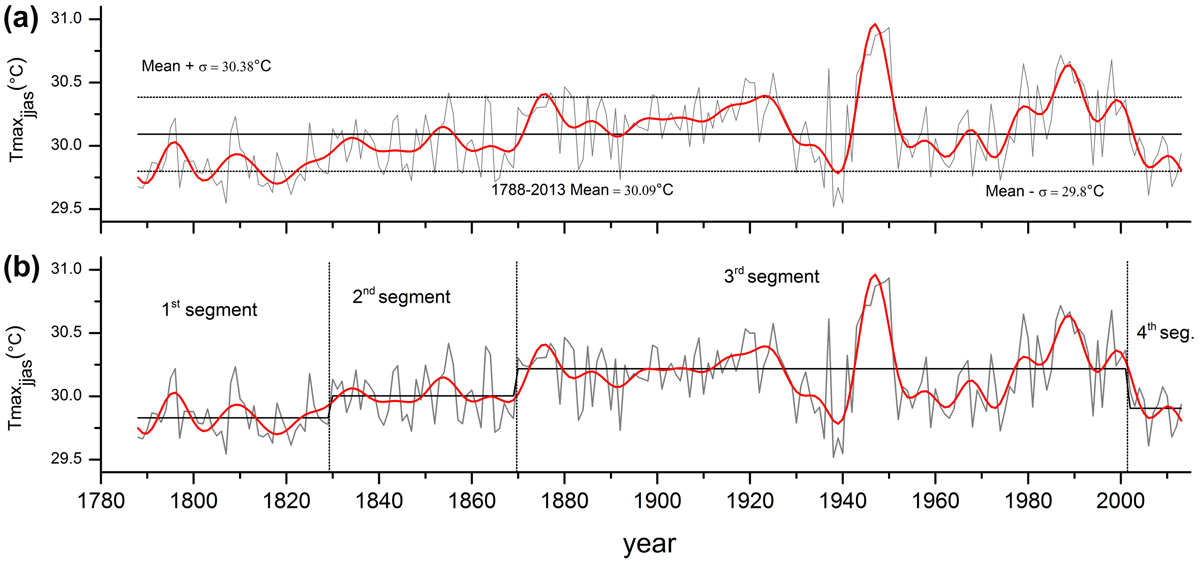
Fig. 6.
The June–September maximum temperature reconstruction (grey line) with a 0.1-Hz low-pass filter (red line). (a) The standard deviation (σ) was ±0.29. (b) Four shifting segments calculated using the Bernaola-Galvan Segmentation Algorithm.
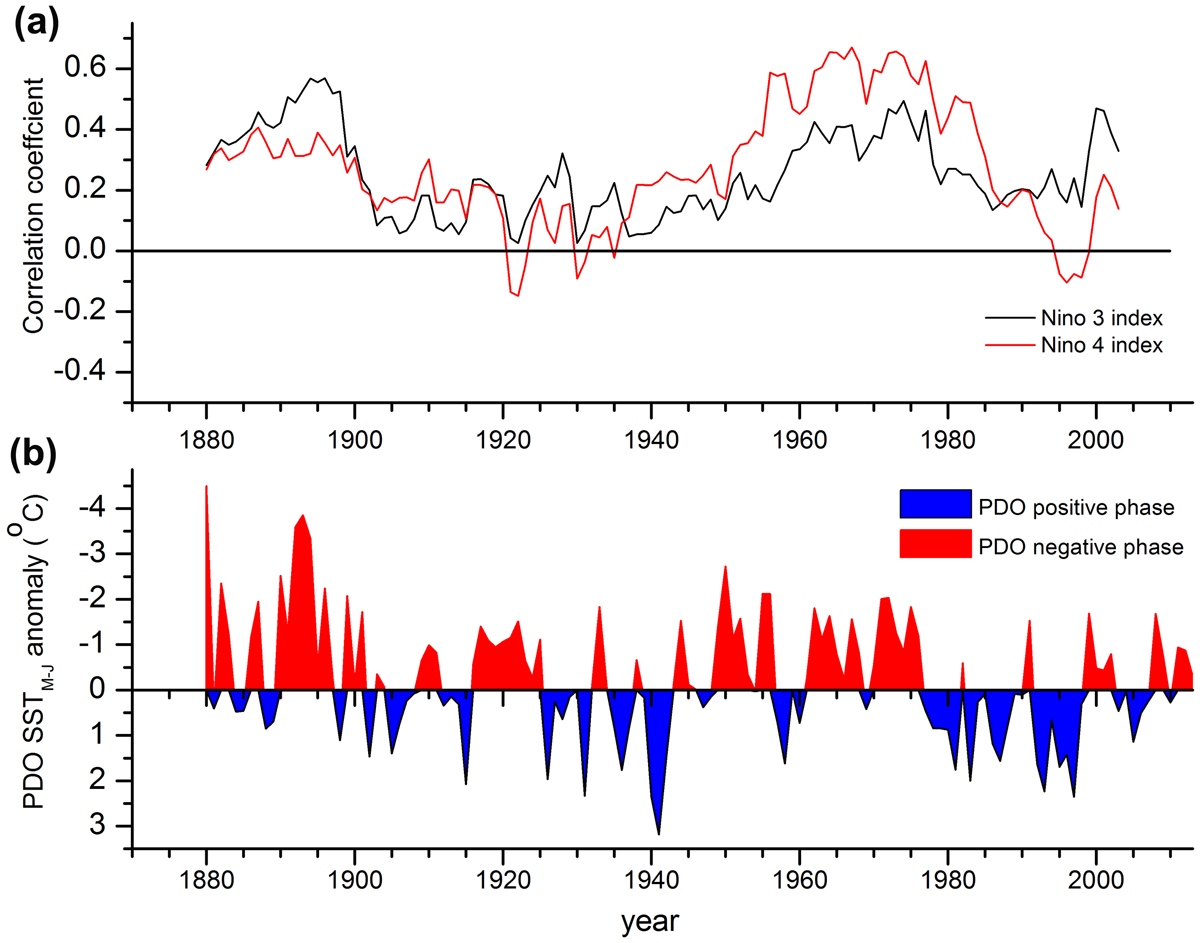
Fig. 7.
(a) 21-year running correlation between June–September T max reconstruction and May–June Nino 3 and Nino 4; (b) May–June sea surface temperature of the PDO index.