
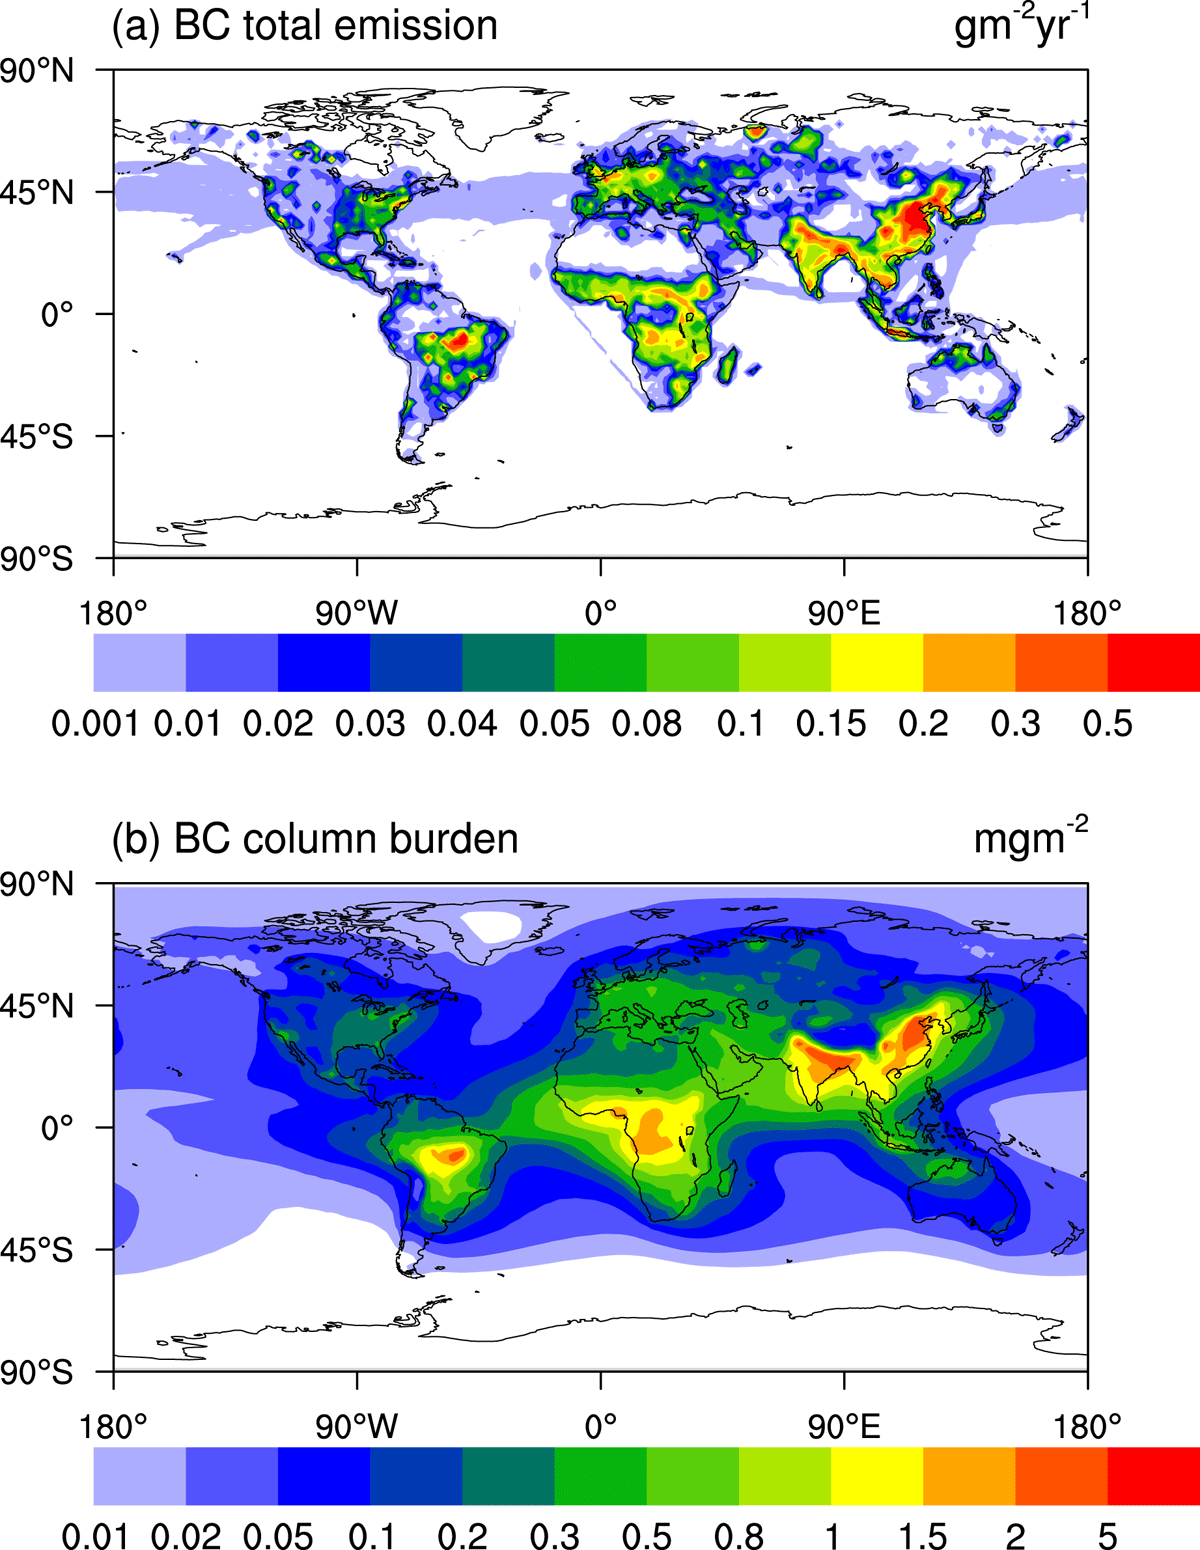
Figure 1.
Spatial distribution of (a) BC emissions (g m yr) in 2005 and multi-year (50-year) mean (b) BC column burden (mg m).
Table 1.
Global-mean values of different variables from the perturbation runs (NOBCAIE and NOBC), estimated as the difference between the CTL and perturbation simulations. ‘CDNC’ denotes the cloud droplet number concentration.
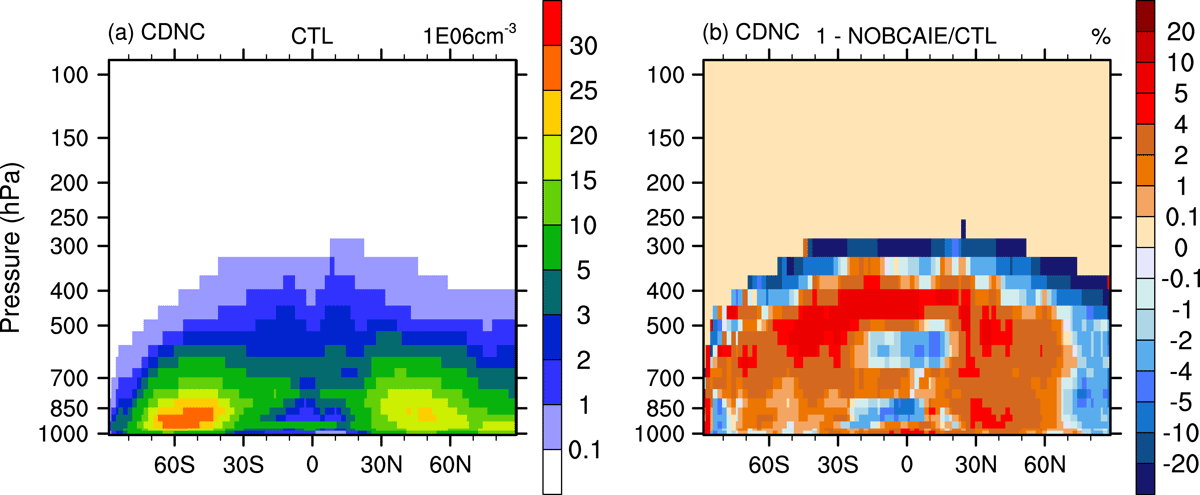
Figure 2.
Zonal mean of the CDNC (10 cm) from (a) the CTL-coupled model simulation and (b) the percentage responses from the NOBCAIE run (1-NOBCAIE/CTL).

Figure 3.
Zonal mean of the cloud water and the cloud cover from the CTL simulation (a), (b) and percentage changes (c) and (d) from the NOBCAIE run (1-NOBCAIE/CTL).
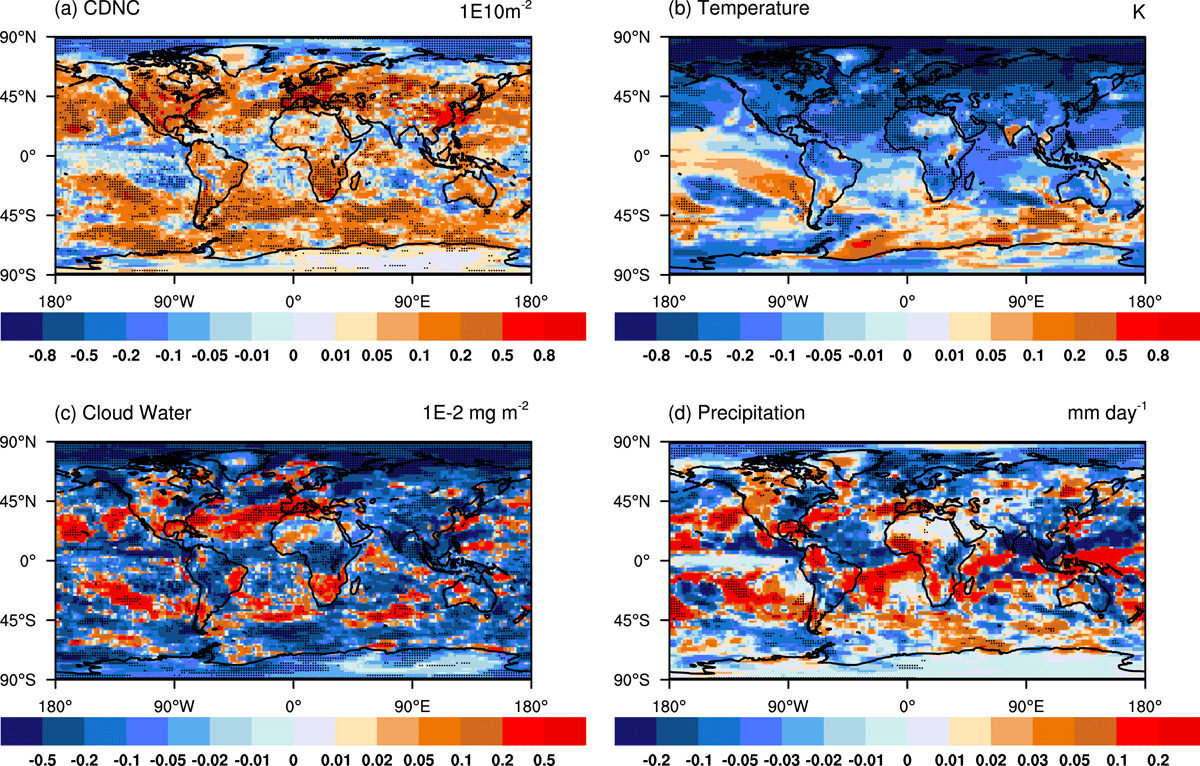
Figure 4.
Spatial distribution of changes (CTL-NOBCAIE) in (a) CDNC burden () , (b) surface temperature (K), (c) vertically integrated cloud water () and (d) total (convective + stratiform) rainfall () from the coupled model simulations. Black dots indicate the grid points where the change is statistically significant at the 95% confidence level.
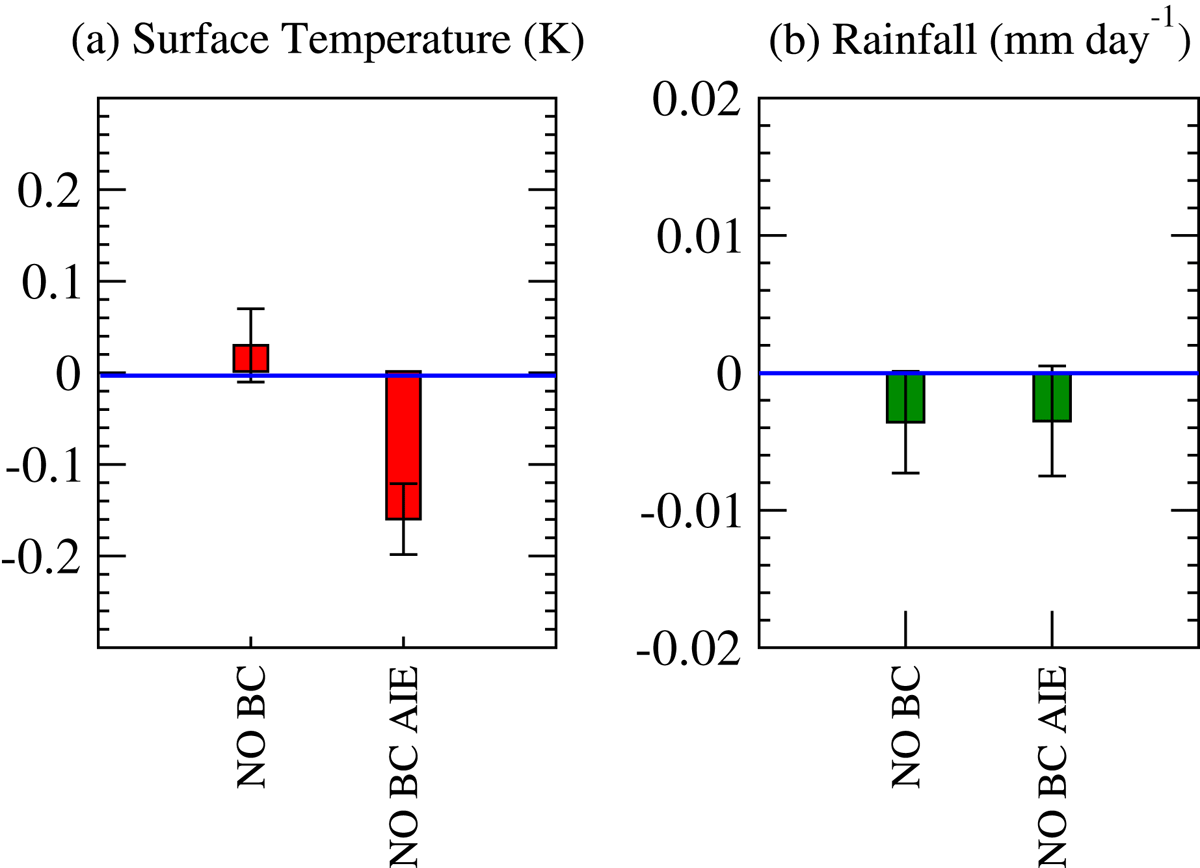
Figure 5.
Global mean annual average changes in (a) surface temperature (K), and (b) rainfall () from the coupled model simulations. Error bars indicate the 95% confidence interval on the error in the mean.
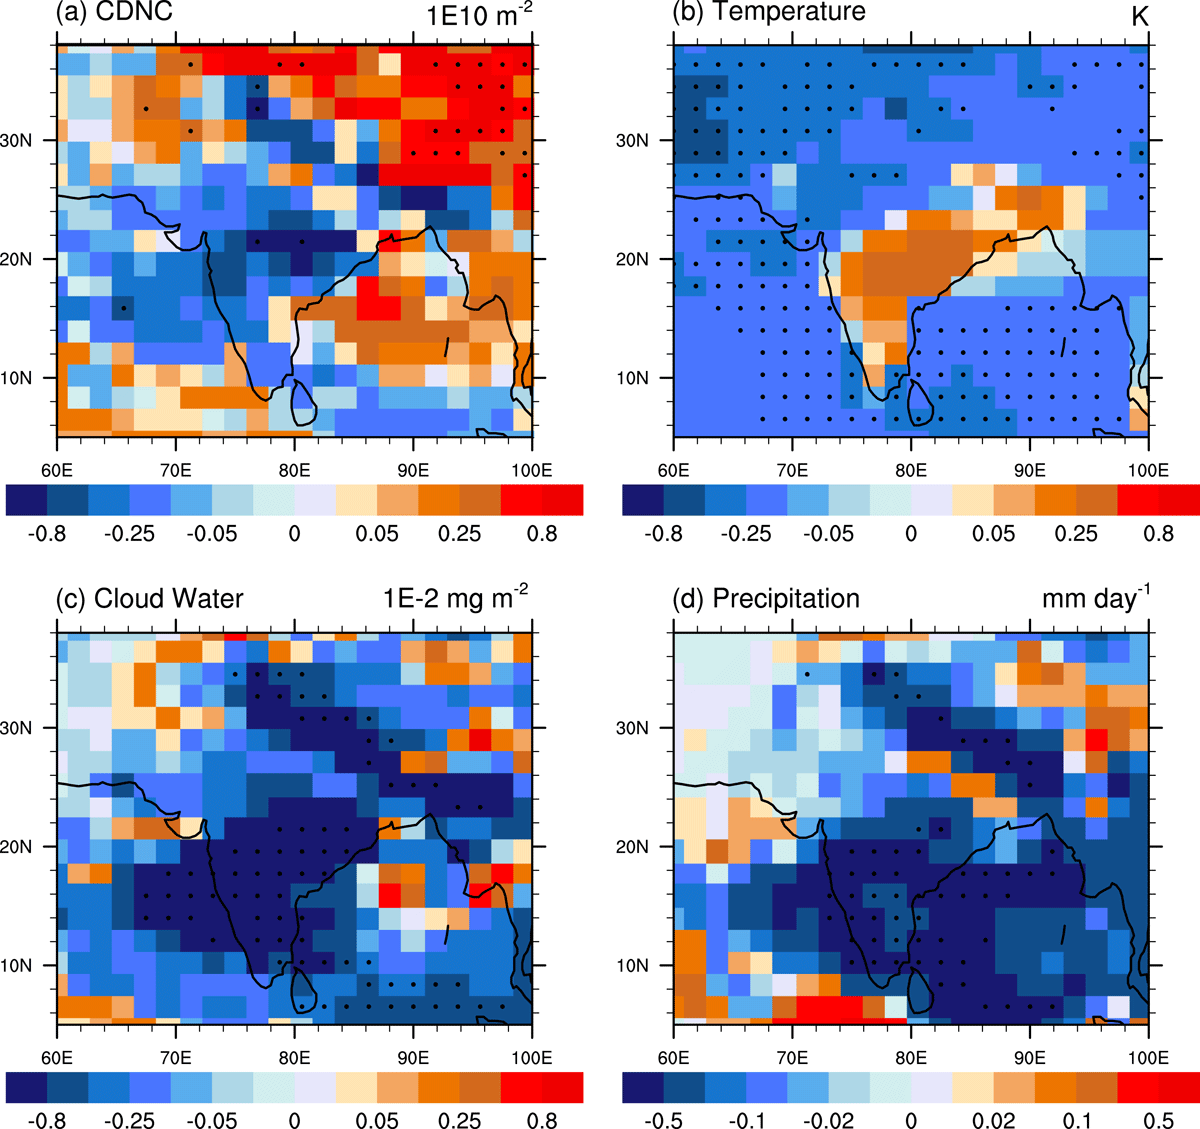
Figure 6.
South-west monsoon season (JJAS) mean changes (CTL-NOBCAIE) in (a) CDNC burden (), (b) surface temperature (K), (c) vertically integrated cloud water () and (d) total (convective + stratiform) rainfall () over the South Asia region. Black dots indicate the grid points where the change is statistically significant at the 95% confidence level.