
Table 1.
Mean, standard deviation and percentile values of the ratio of the absorption coefficient to elemental carbon, EC, ( mass-specific absorption coefficient; ) and PM volume to organic carbon, OC, for the three-day averages. See also Fig. S2 in the supplementary material.
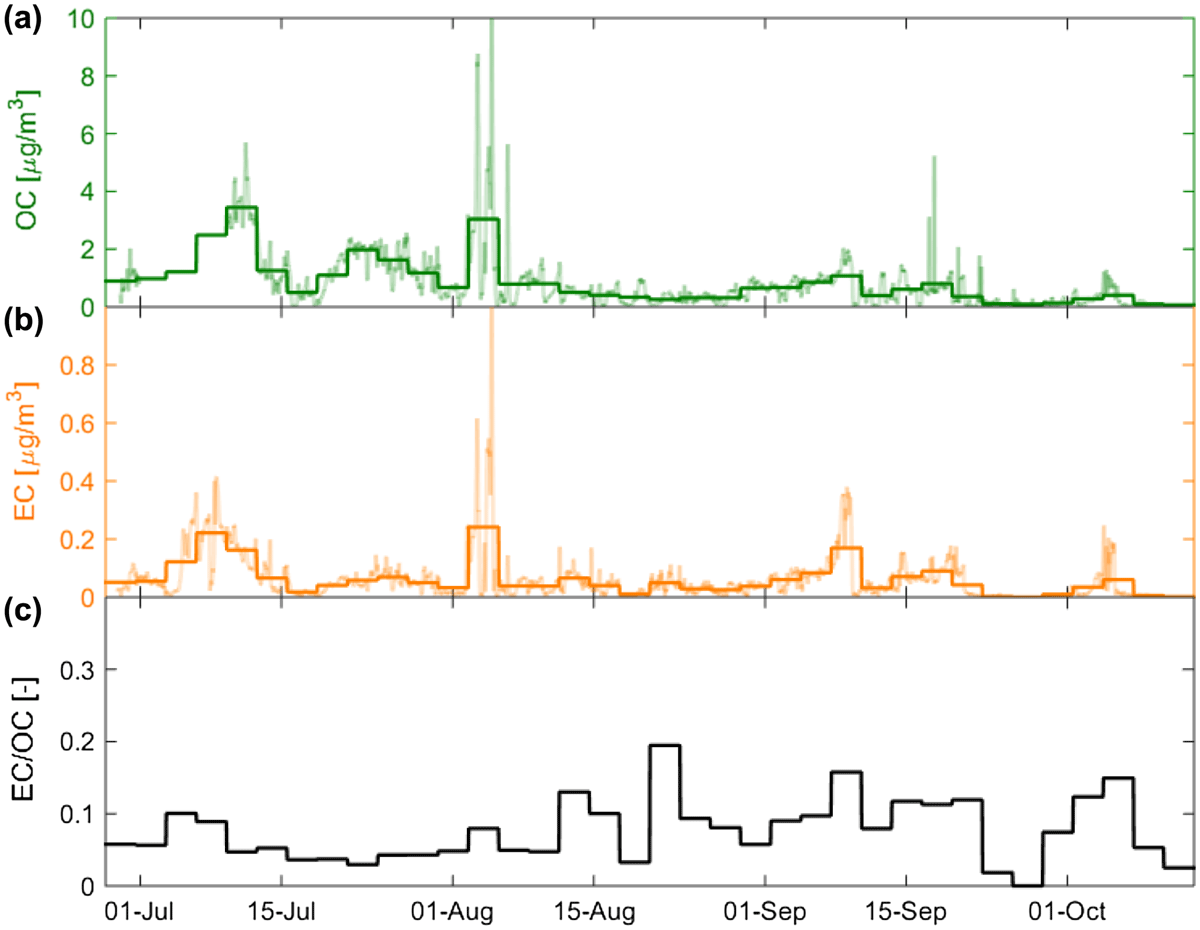
Figure 1.
Time series of (a) OC and (b) EC concentrations and (c) the EC to OC mass concentration ratio (EC/OC). Measured concentrations for all 72 h filter samples collected during the study are displayed as thick lines. A time series with hourly resolution, that was estimated with the help of proxy measurements, is displayed in panel (a) and (b) as thin lines. Note that no particle number size distribution data was available for the period between 1 – 9 July so no hourly variation could be introduced to the 72 h OC concentration data.
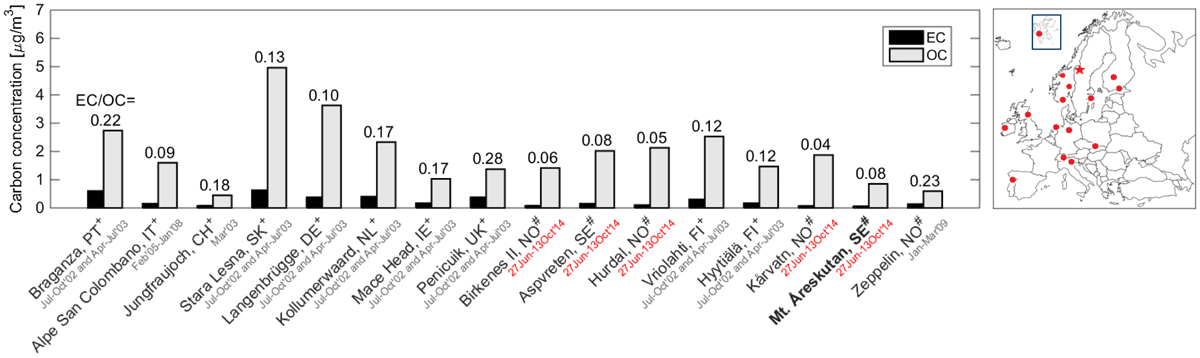
Figure 2.
Carbonaceous aerosol concentrations for various sites in Europe. All sites resemble background locations similar to that at Mt. Åreskutan (see also Table 2). The stations are ordered from South to North by latitude and are marked in the map in the upper right corner. The red star marks Mt. Åreskutan. Numbers above the bars are the carbonaceous mass concentration ratio (EC/OC). All concentration data were determined through thermo-optical transmittance analysis with either the NIOSH or the EUSAAR-2 temperature protocol (marked + or #, respectively). Red dates indicate that the study period overlapped with this study.
Table 2.
Ambient EC and OC concentrations (meanstd) in PM for various remote sites in Europe at different altitudes above sea level (a. s. l.). The sites are ordered from south to north by latitude and divided into the following categories: high alpine (Alp), Arctic (Arc) and rural background (RB). This comparison is illustrated in Fig. 2. Note that at Birkenes II, Apsvreten, Hurdal, Kårvatn, Mt. Åreskutan and Zeppelin the EUSAAR-2 temperature protocol was used, while at all other stations the NIOSH temperature protocol was used.
Values resemble carbonaceous aerosol concentrations in PM. Sampling times:1 July – 1 October 2002 and 1 April – 1 July 2003.February 2005 –January 2008.March 2004.27 June – 13 October 2014.7 – 28 May 2004.6 January – 3 March 2009 (focus on high EC loading events).Note: Bold values refer to the present study.
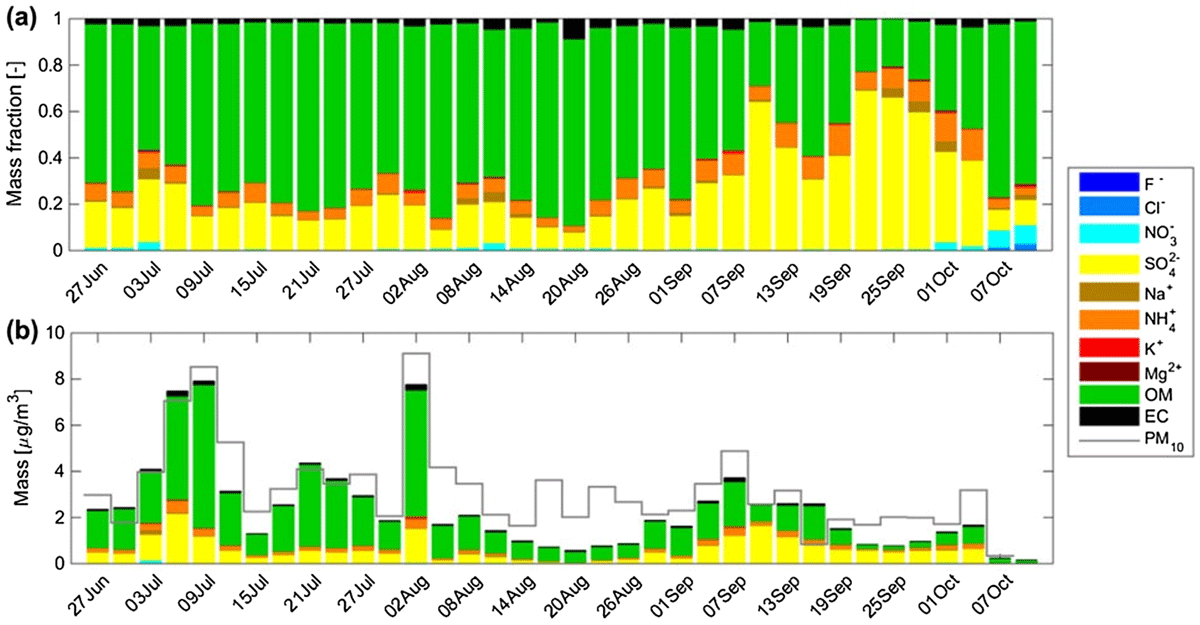
Figure 3.
Time series of (a) the 72 h mean mass fractions of the total analysed mass and (b) the 72 h mean absolute concentrations of the measured aerosol components. The grey line in (b) shows the estimated total aerosol mass for PM derived from particle size measurements with the assumptions that all particles were spherical and that they had a mean aerosol density of 1.5 g cm.
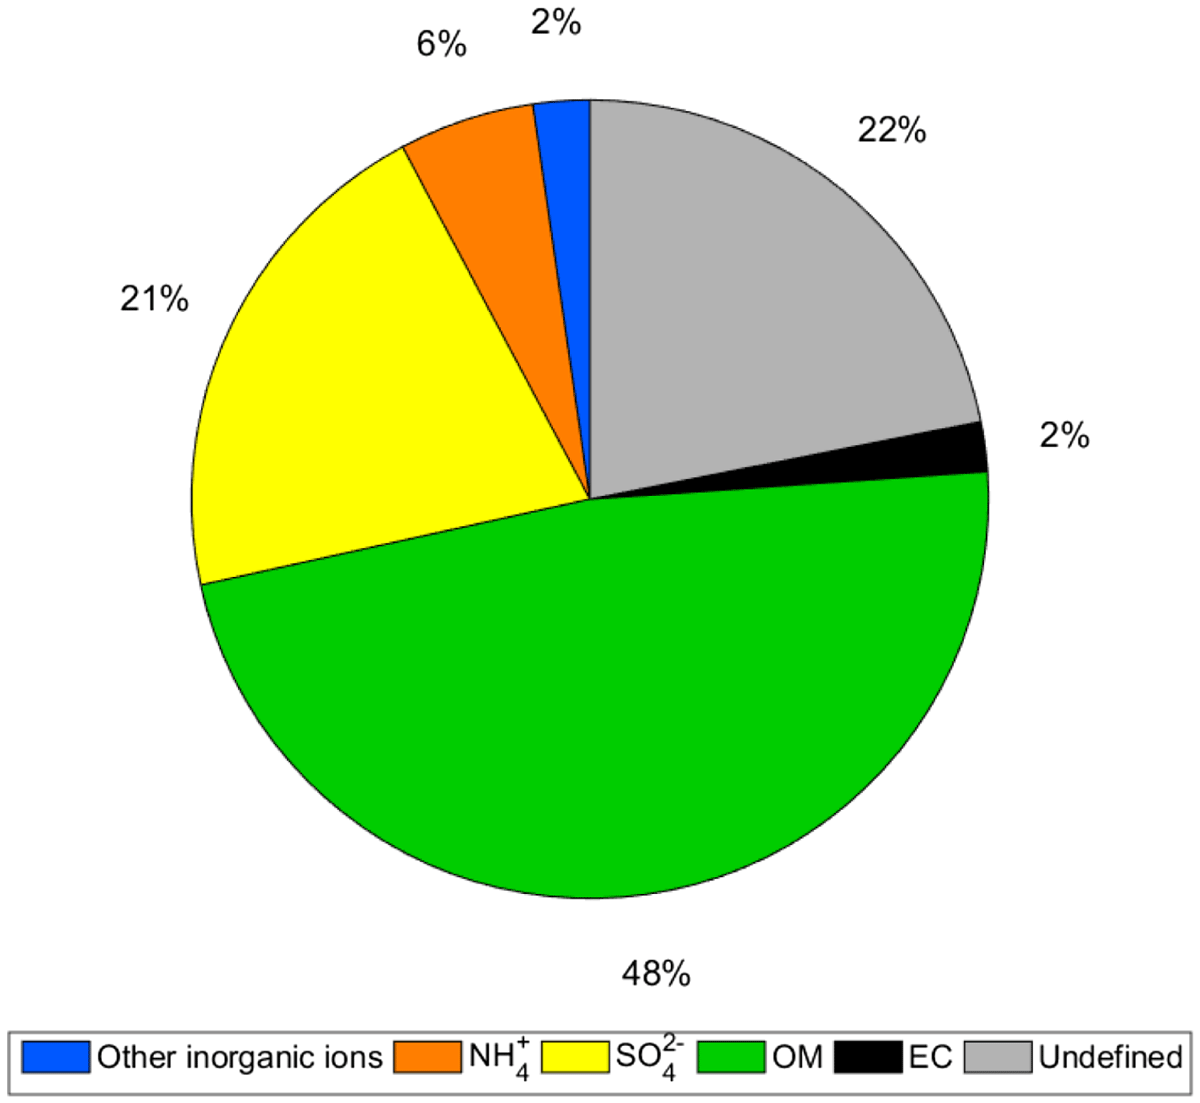
Figure 4.
Mean mass fractions of the dominant aerosol components in PM measured using thermo-optical transmittance analysis and ion chormatography during CAEsAR 2014. The total aerosol mass was obtained by size distribution measurements assuming a mean aerosol density of 1.5 g cm.
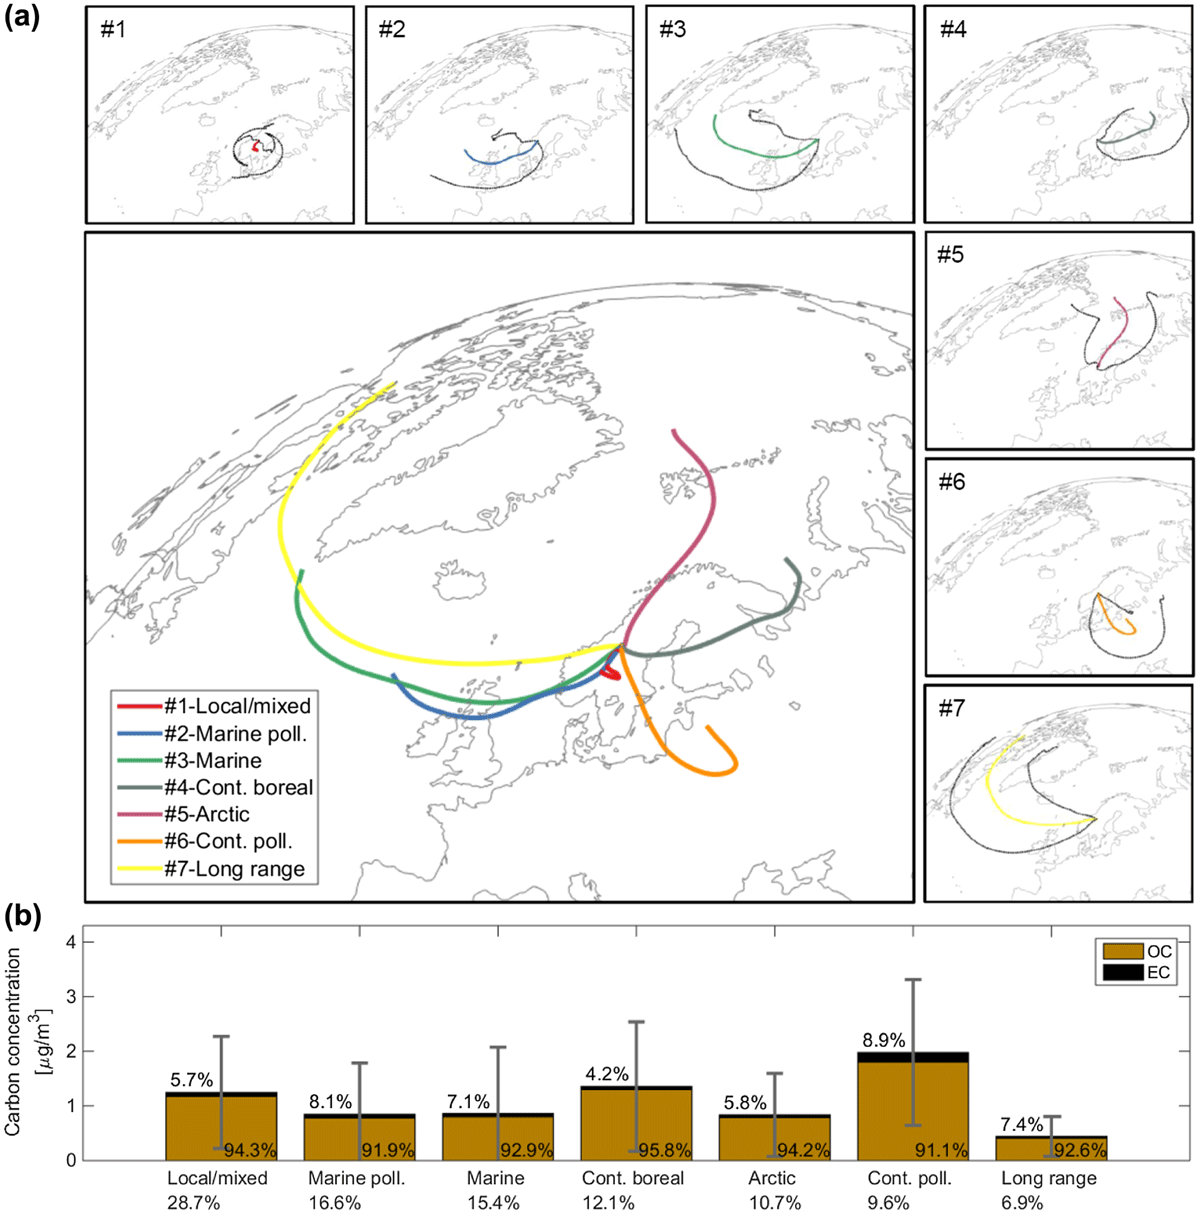
Figure 5.
Average seven-day trajectories for the seven trajectory clusters are shown in (a). Black lines in the graphs around the main figure depict the standard deviation of all trajectories in each cluster to the average trajectory at each time step. The bar plot in (b) shows average carbonaceous aerosol concentrations with which the air masses of each trajectory cluster were associated during the study period (only cloud-free data points). The values in the figure depict the percentage of EC and OC relative to the TC concentration. Error bars show the standard deviation of the TC concentration data for each trajectory cluster (negative values are truncated). Values below the cluster names refer to the frequency with which trajectories in each cluster occurred during cloud-free periods.
Table 3.
Summary of the trajectory clusters and a description of the characteristics of air masses within each cluster. The analysis was based on hourly seven-day back trajectories calculated for the entire period of the study. Each of the trajectories terminated at 1000 m a.s.l. at the coordinates of the research station. The average elemental and organic carbon (EC and OC) concentrations with which trajectories of each cluster were associated are shown. The clusters are sorted according to the relative fraction of out-of-cloud trajectories (total fractional occurrence are shown in parenthesis) during the study period.
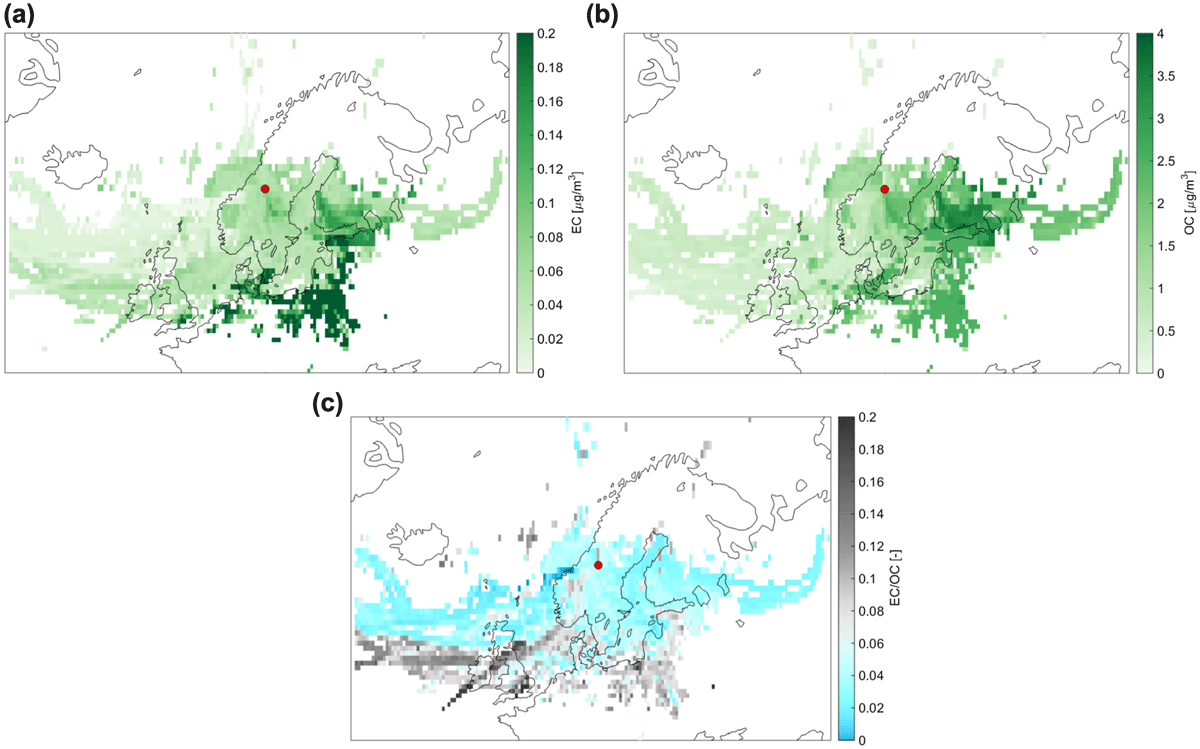
Figure 6.
Results of the back trajectory analysis. Apportioned levels of the median (a) EC concentrations, (b) OC concentrations and (c) the EC/OC mass ratio measured at Mt. Åreskutan (red dot) during the study period. Grid cells were assigned concentration values of air masses analysed at Mt. Åreskutan if the air mass trajectory was located within the PBL at the location of the cell.
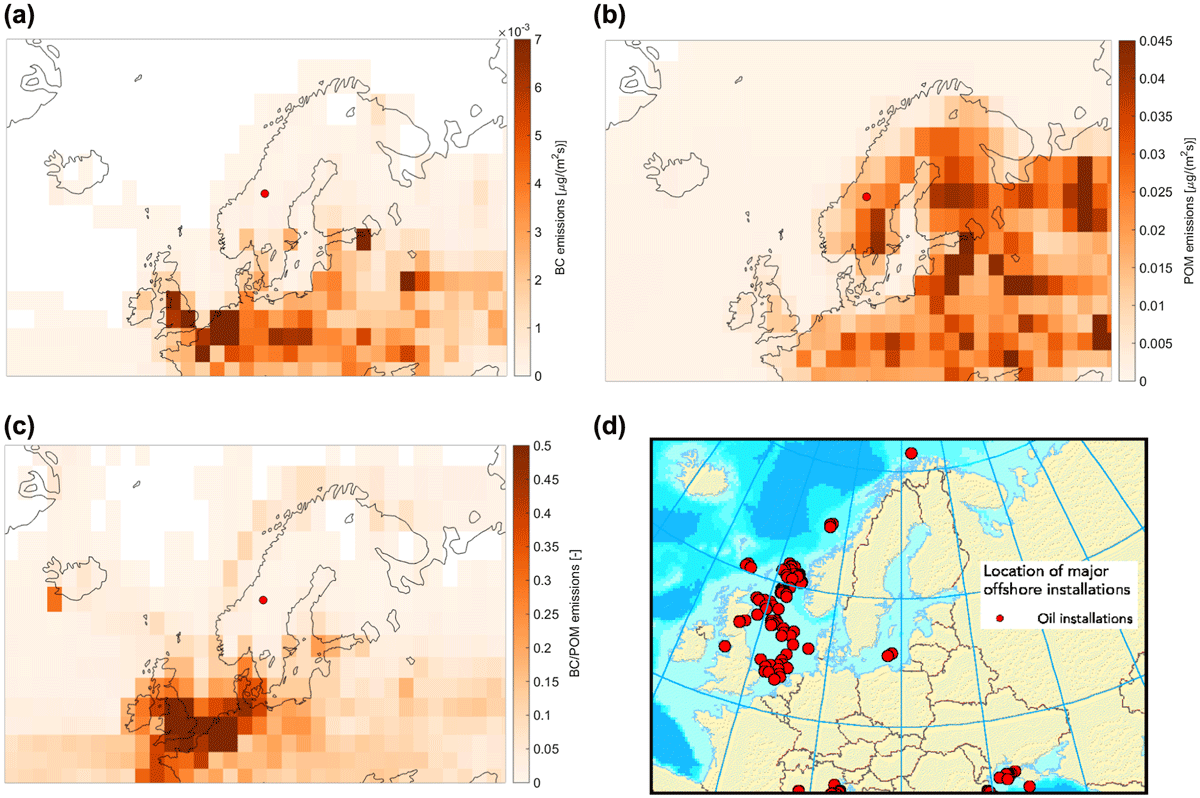
Figure 7.
Aerosol emission fields used in the Norwegian Earth System Model (NorESM). Displayed are emission fields of (a) black carbon (BC), for which EC is the carbon-based proxy, (b) particulate organic matter (POM), which corresponds to OM and (c) the ratio of BC to POM emissions. The model emissions are mean present-day natural and anthropogenic emissions for the months of July, August and September. The figure in (d) shows major offshore oil installations (source: European Environment Agency; europa.eu).