
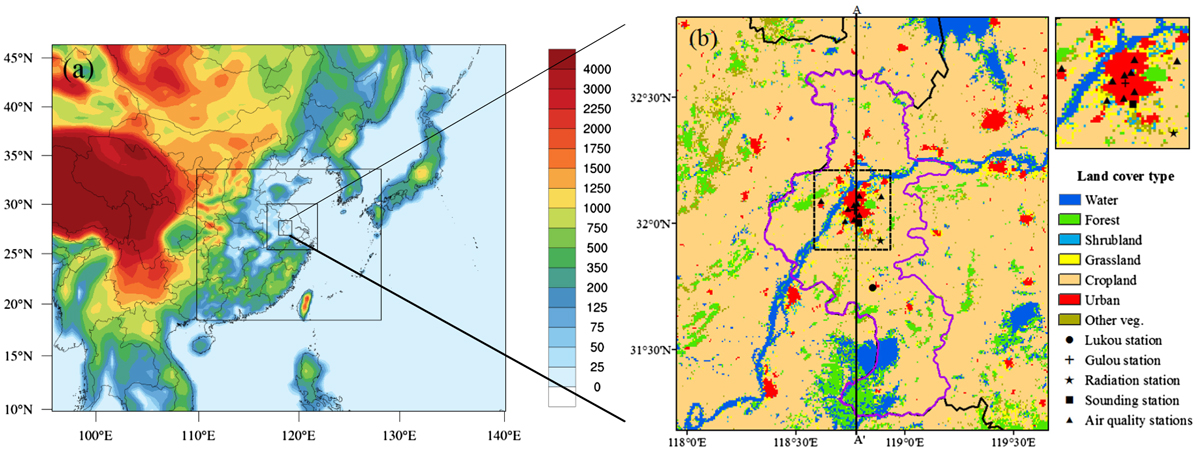
Fig. 1.
(a) WRF-Chem domains and terrain height (m); (b) Land-cover map and observational stations in the innermost domain. The administrative boundary of Nanjing City is marked with purple lines. An enlarged figure of the monitoring sites in downtown Nanjing is shown in panel (b).
Table 1.
Statistical metrics for surface meteorological and chemical variables in EXP_CTRL.
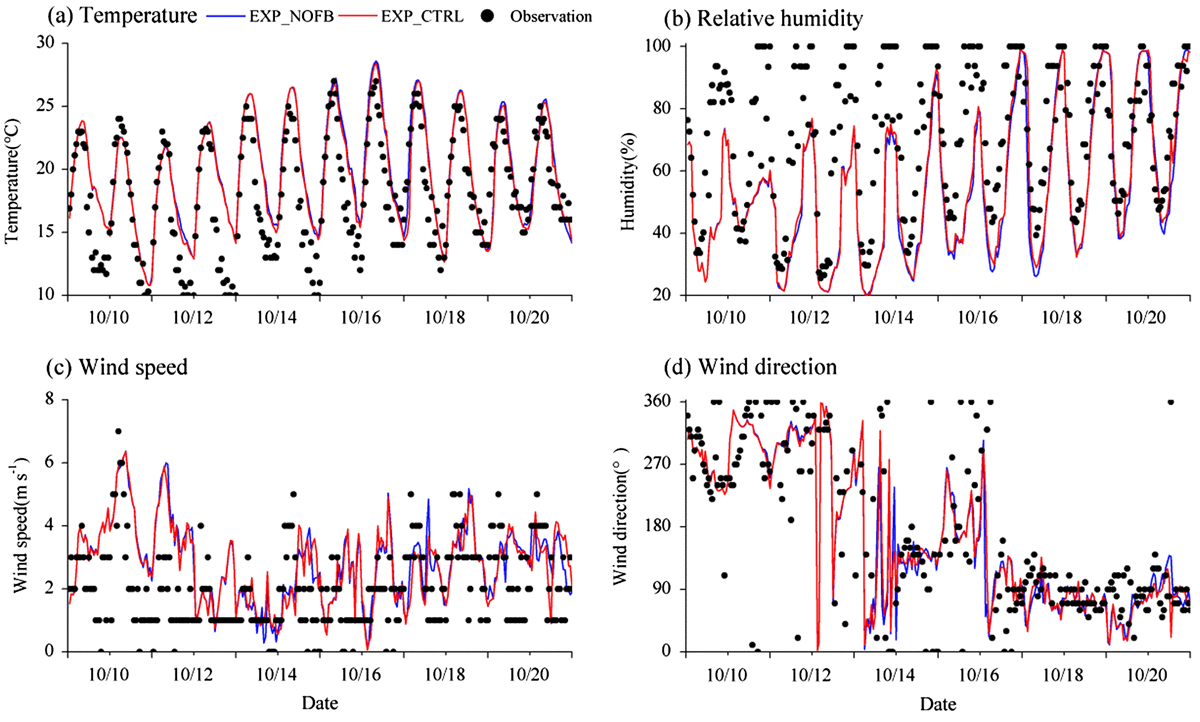
Fig. 2.
Time-series comparisons of (a) 2-m temperature, (b) 2-m relative humidity, (c) 10-m wind speed and (d) wind direction for simulations and observations at Lukou station.

Fig. 3.
Vertical profiles of temperature, relative humidity, wind speed and wind direction for simulations and radiosonde observations at Nanjing station.
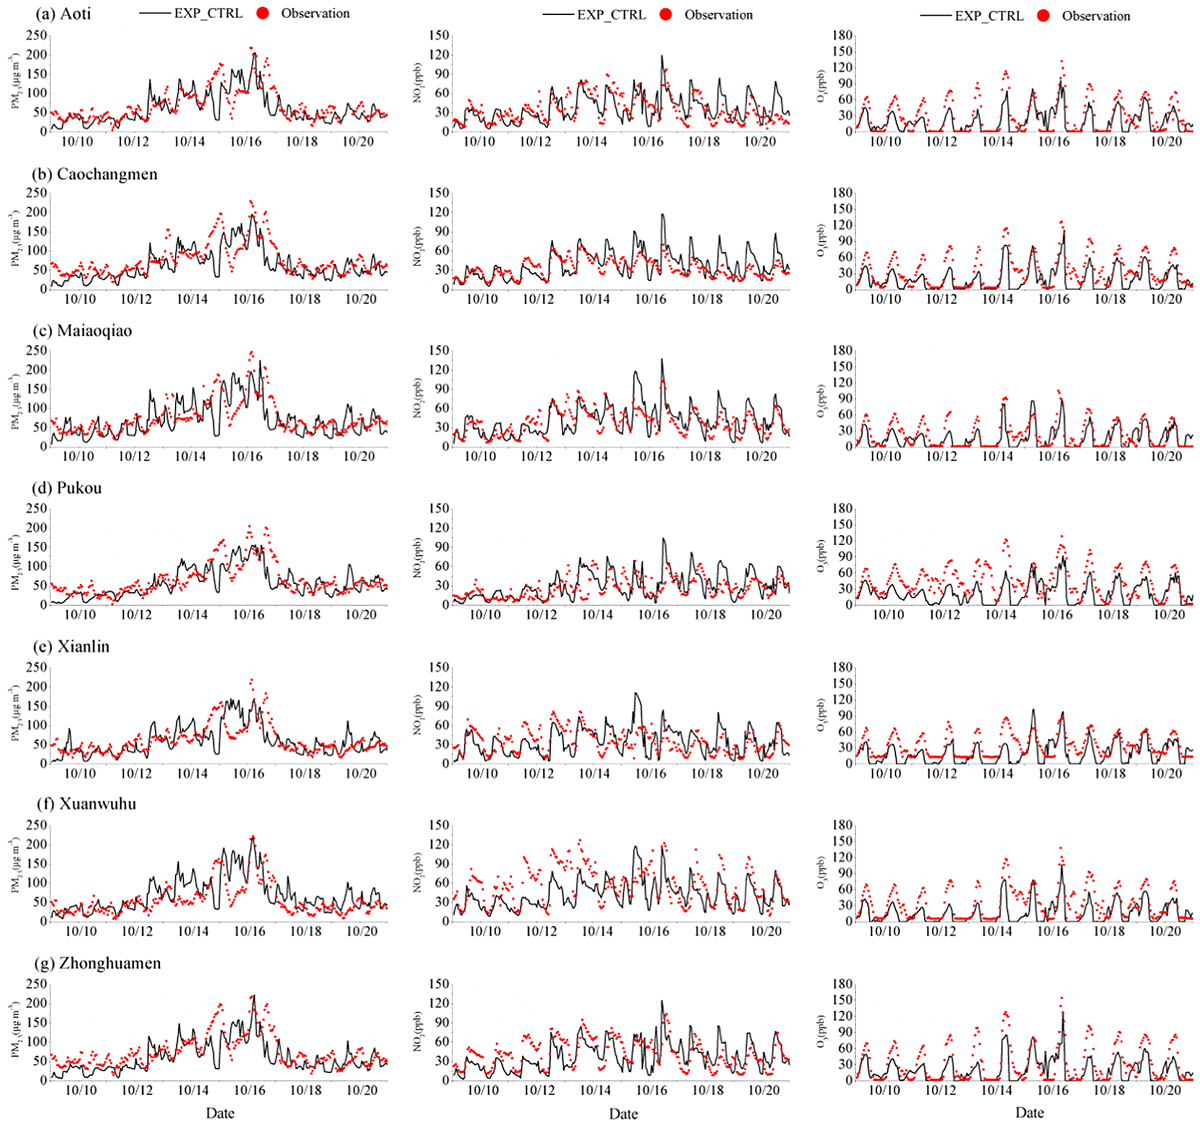
Fig. 4.
Time-series plots of PM2.5 (left panels), NO2 (middle panels) and O3 (right panels) in the EXP_CTRL simulation (black lines) and observations (red dots) at several representative sites.
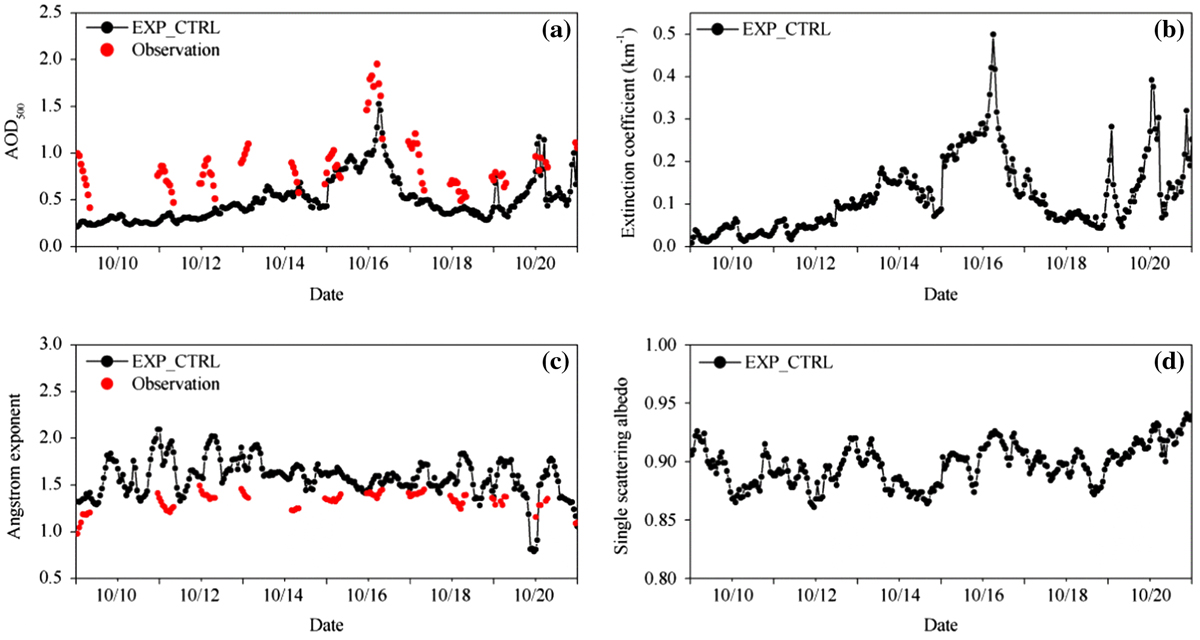
Fig. 5.
Time-series plots of (a) AOD500, (b) extinction coefficient, (c) Ångström exponent and (d) single scattering albedo in the EXP_CTRL simulation (black lines) and observations (red dots) at Gulou site.
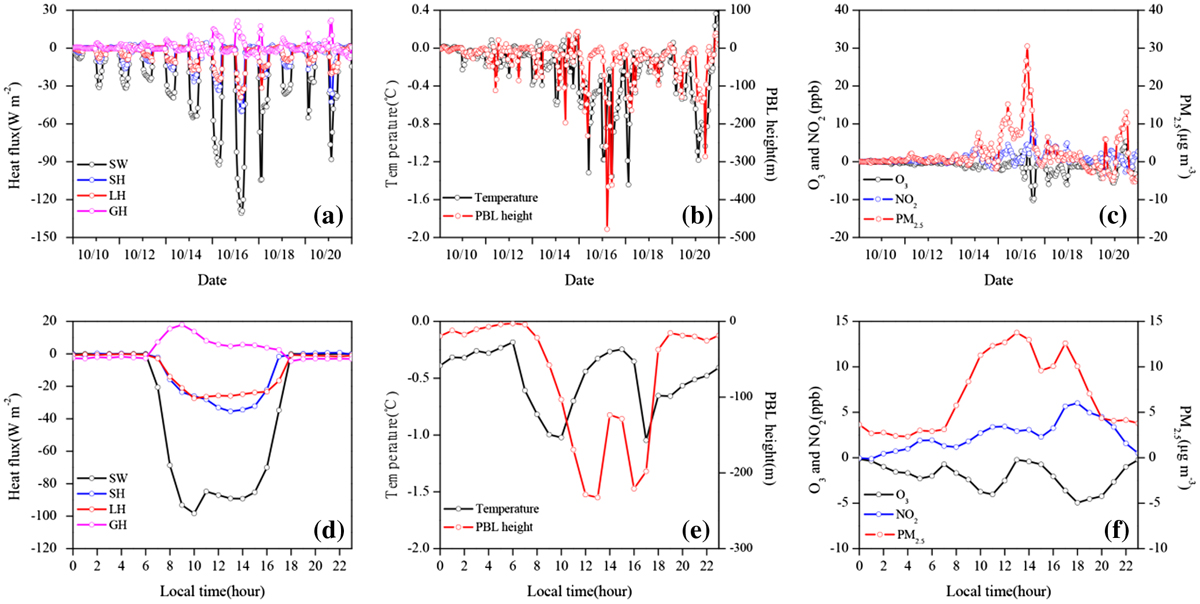
Fig. 6.
Day-to-day (upper panels; 9–20 October) and diurnal (bottom panels; 15–17 October) variations of aerosol-induced changes in (a, d) surface energy budget, (b, e) meteorological variables and (c, f) pollutant concentrations averaged over Nanjing. SW, SH, LH and GH in panels (a) and (d) refer to short wave radiation, sensible heat flux, latent heat flux and ground heat flux, respectively.
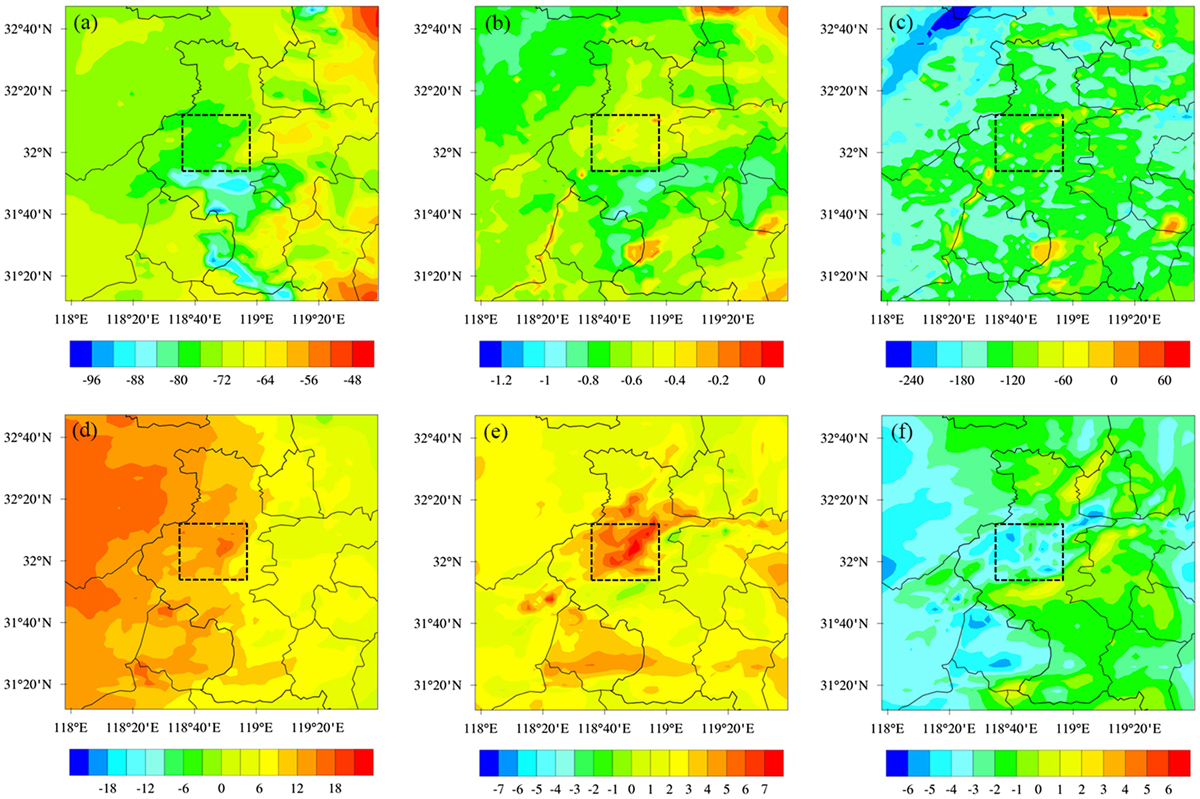
Fig. 7.
Aerosol-induced changes in (a) short wave radiation (W m−2), (b) 2-m temperature (°), (c) PBL height (m), (d) PM2.5 (μg m−3), (e) NO2 (ppb) and (f) O3 (ppb) between EXP_CTRL and EXP_NOFB averaged over 07:00–17:00 LT during 15–17 October. The city area of Nanjing is marked with black rectangle.
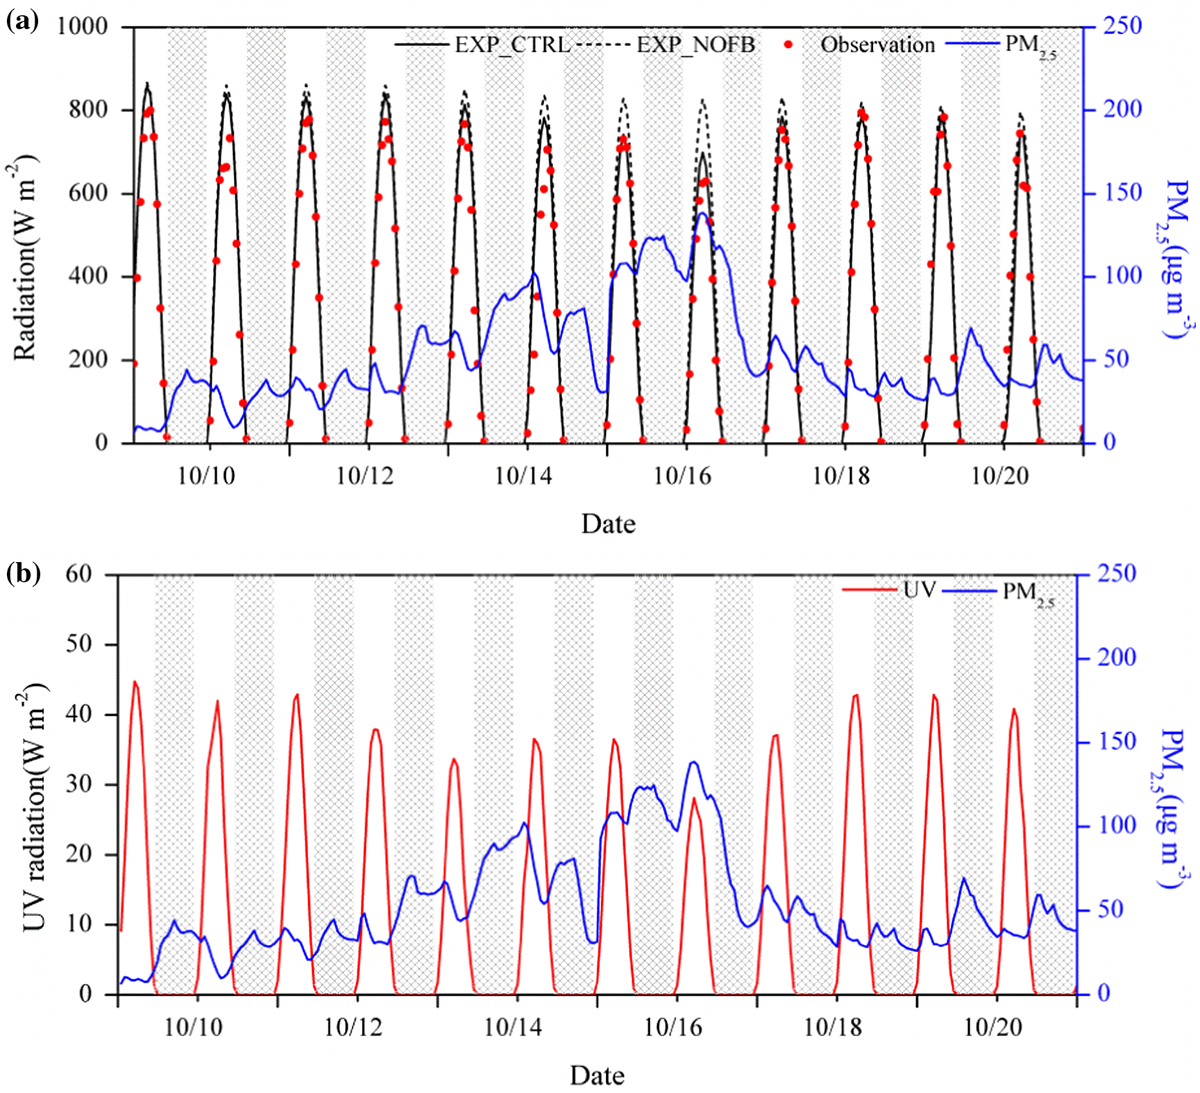
Fig. 8.
Time-series plots of surface (a) solar radiation (black lines for simulations and red dots for observations), and (b) UV radiation observed at Gulou station along with simulated PM2.5 concentration in EXP_CTRL (blue lines) during 9–20 October. Night-time hours are marked with black shade.
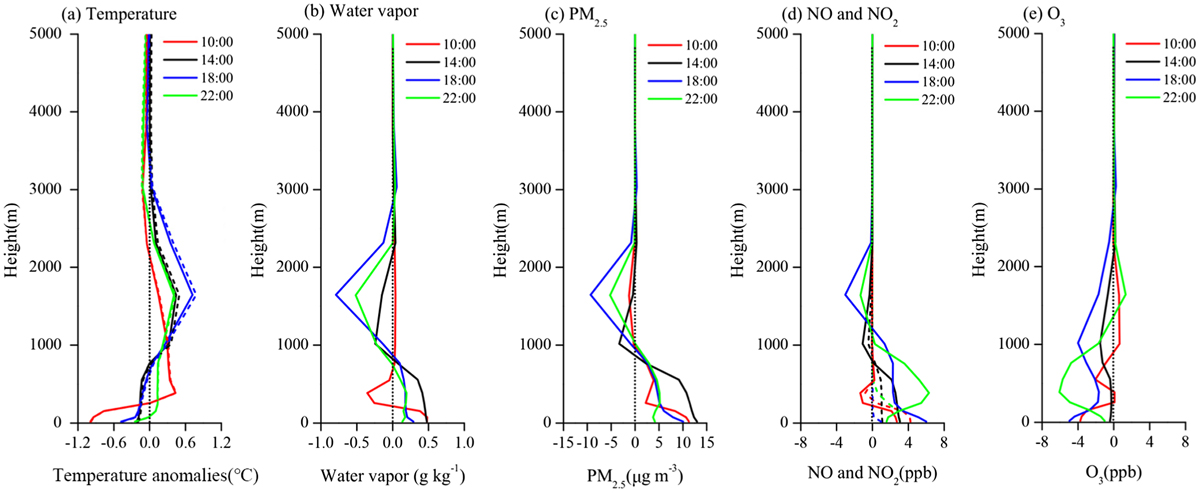
Fig. 9.
Aerosol impacts on the vertical profiles of (a) air temperature (solid lines) and potential temperature (dash lines), (b) water vapor mixing ratio, (c) PM2.5, (d) NO and NO2 and (e) O3 at 10:00 LT, 14:00 LT, 18:00 LT and 22:00 LT averaged over Nanjing during 15–17 October.
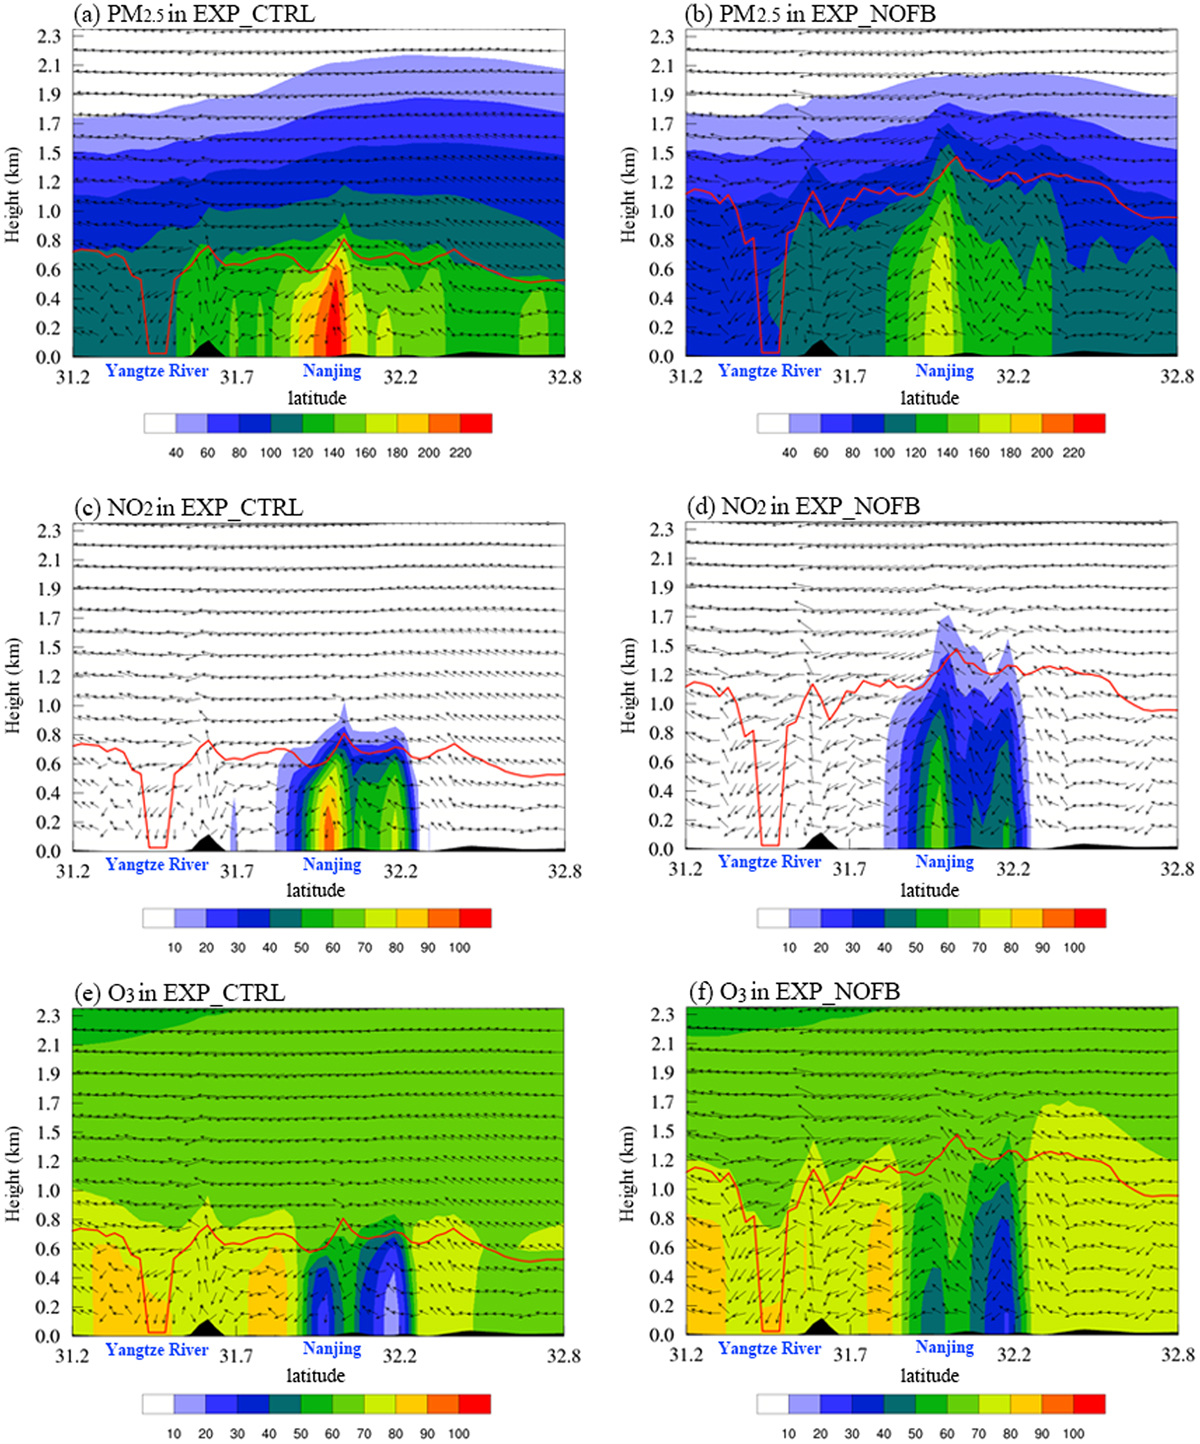
Fig. 10.
Cross-sections of simulated (a, b) PM2.5 (μg m−3), (c, d) NO2 (ppb) and (e, f) O3 (ppb) with wind fields along AA′ (as depicted in Fig. 1b) at 12:00 LT on 16 October. The red lines represent PBL height; the black shaded areas represent terrain.

Fig. 11.
Aerosol impacts on the vertical profiles of (a) J[NO2] and (b) J[O1D] averaged over Nanjing during 15–17 October.