
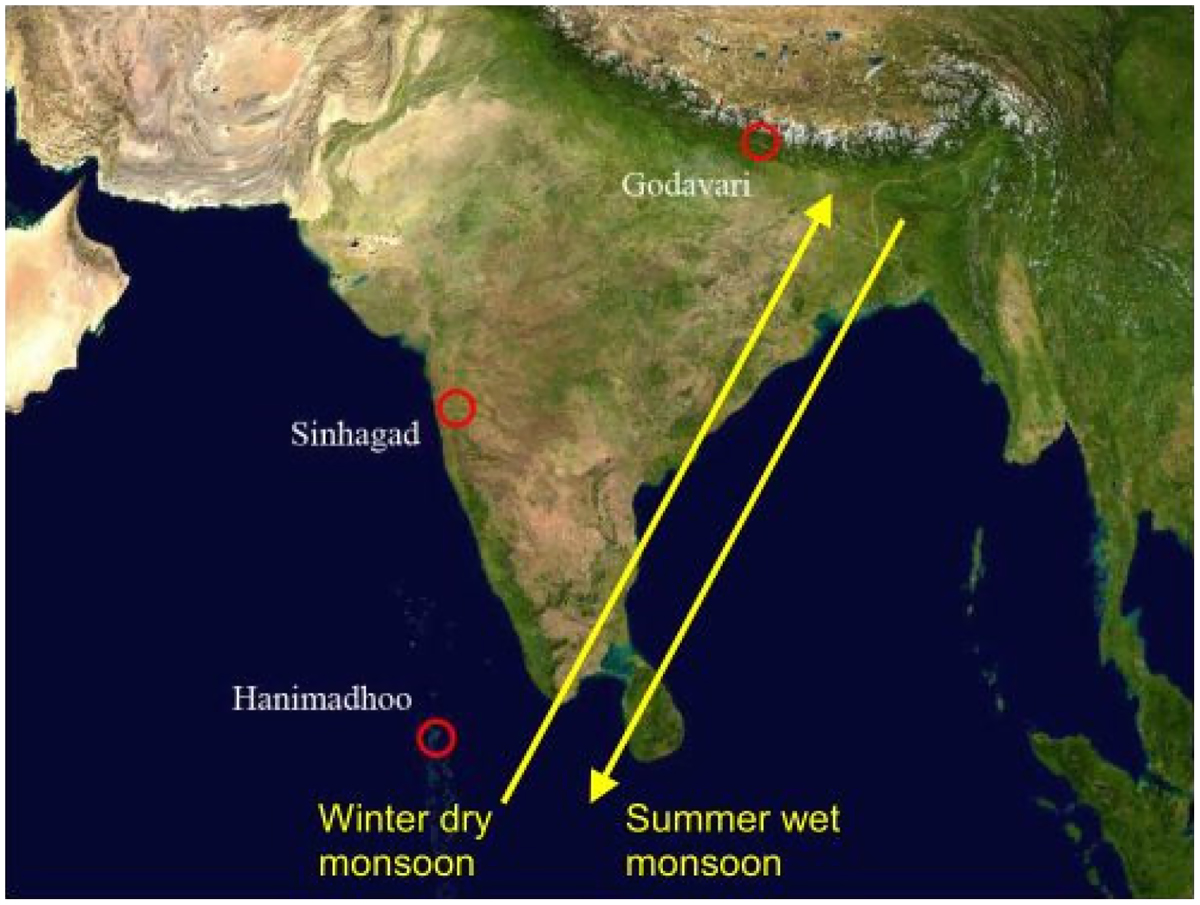
Fig. 1.
The location of the ABC observatories in Nepal (Godavari, longitude E85°23′20″, latitude N27°35′31″), India (Sinhagad, longitude E73°45′17″, latitude N18°21′58″) and the Maldives (Hanimaadhoo, longitude E73°10′59″, latitude N6°46′34″). Also shown is the main direction of the monsoon wind.
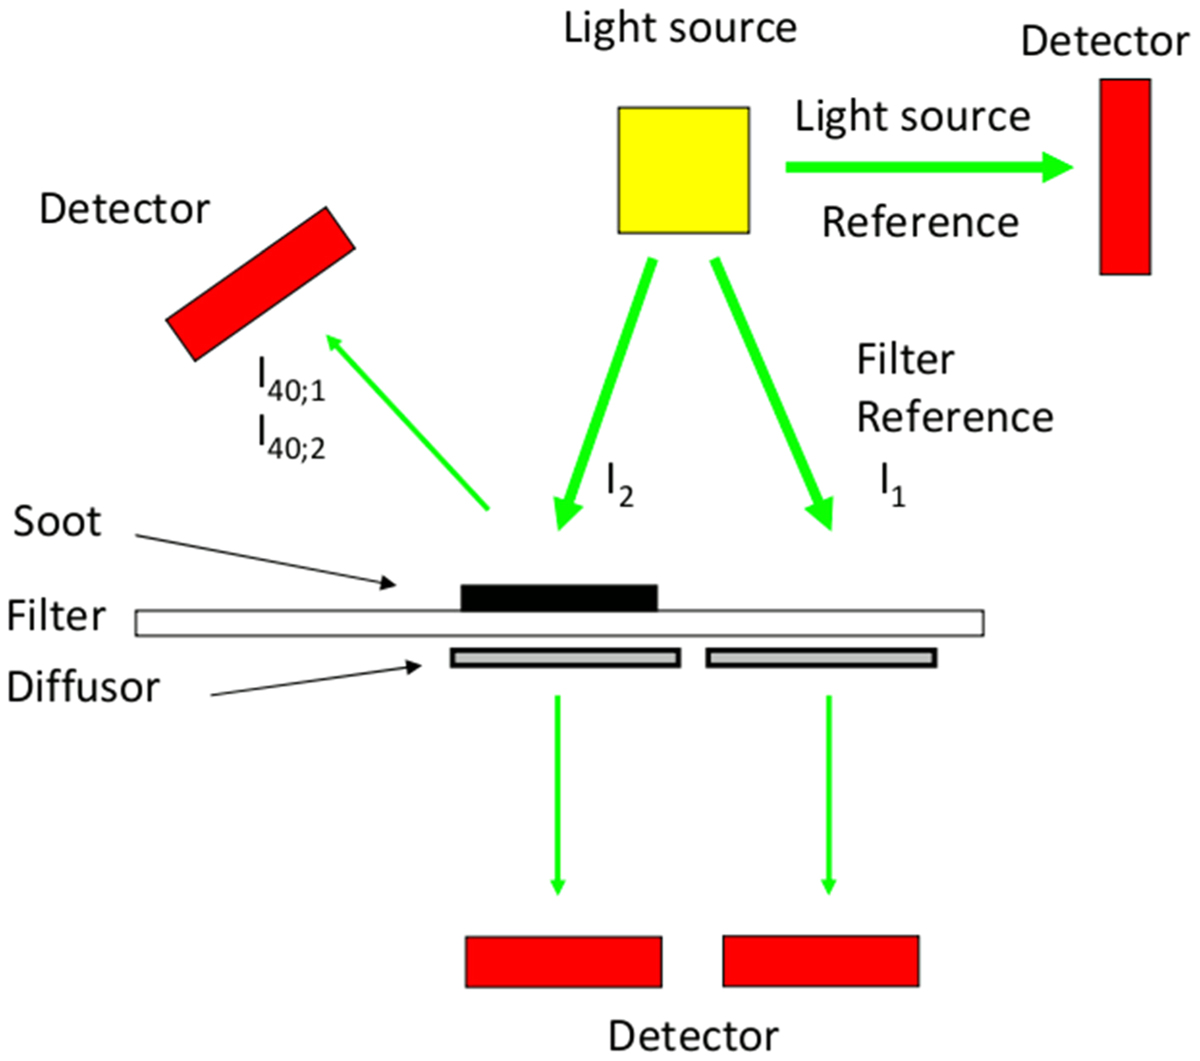
Fig. 2.
The principle of the BC-photometer instrument.
Table 1.
Sampling frequency and yield for the three observatories.
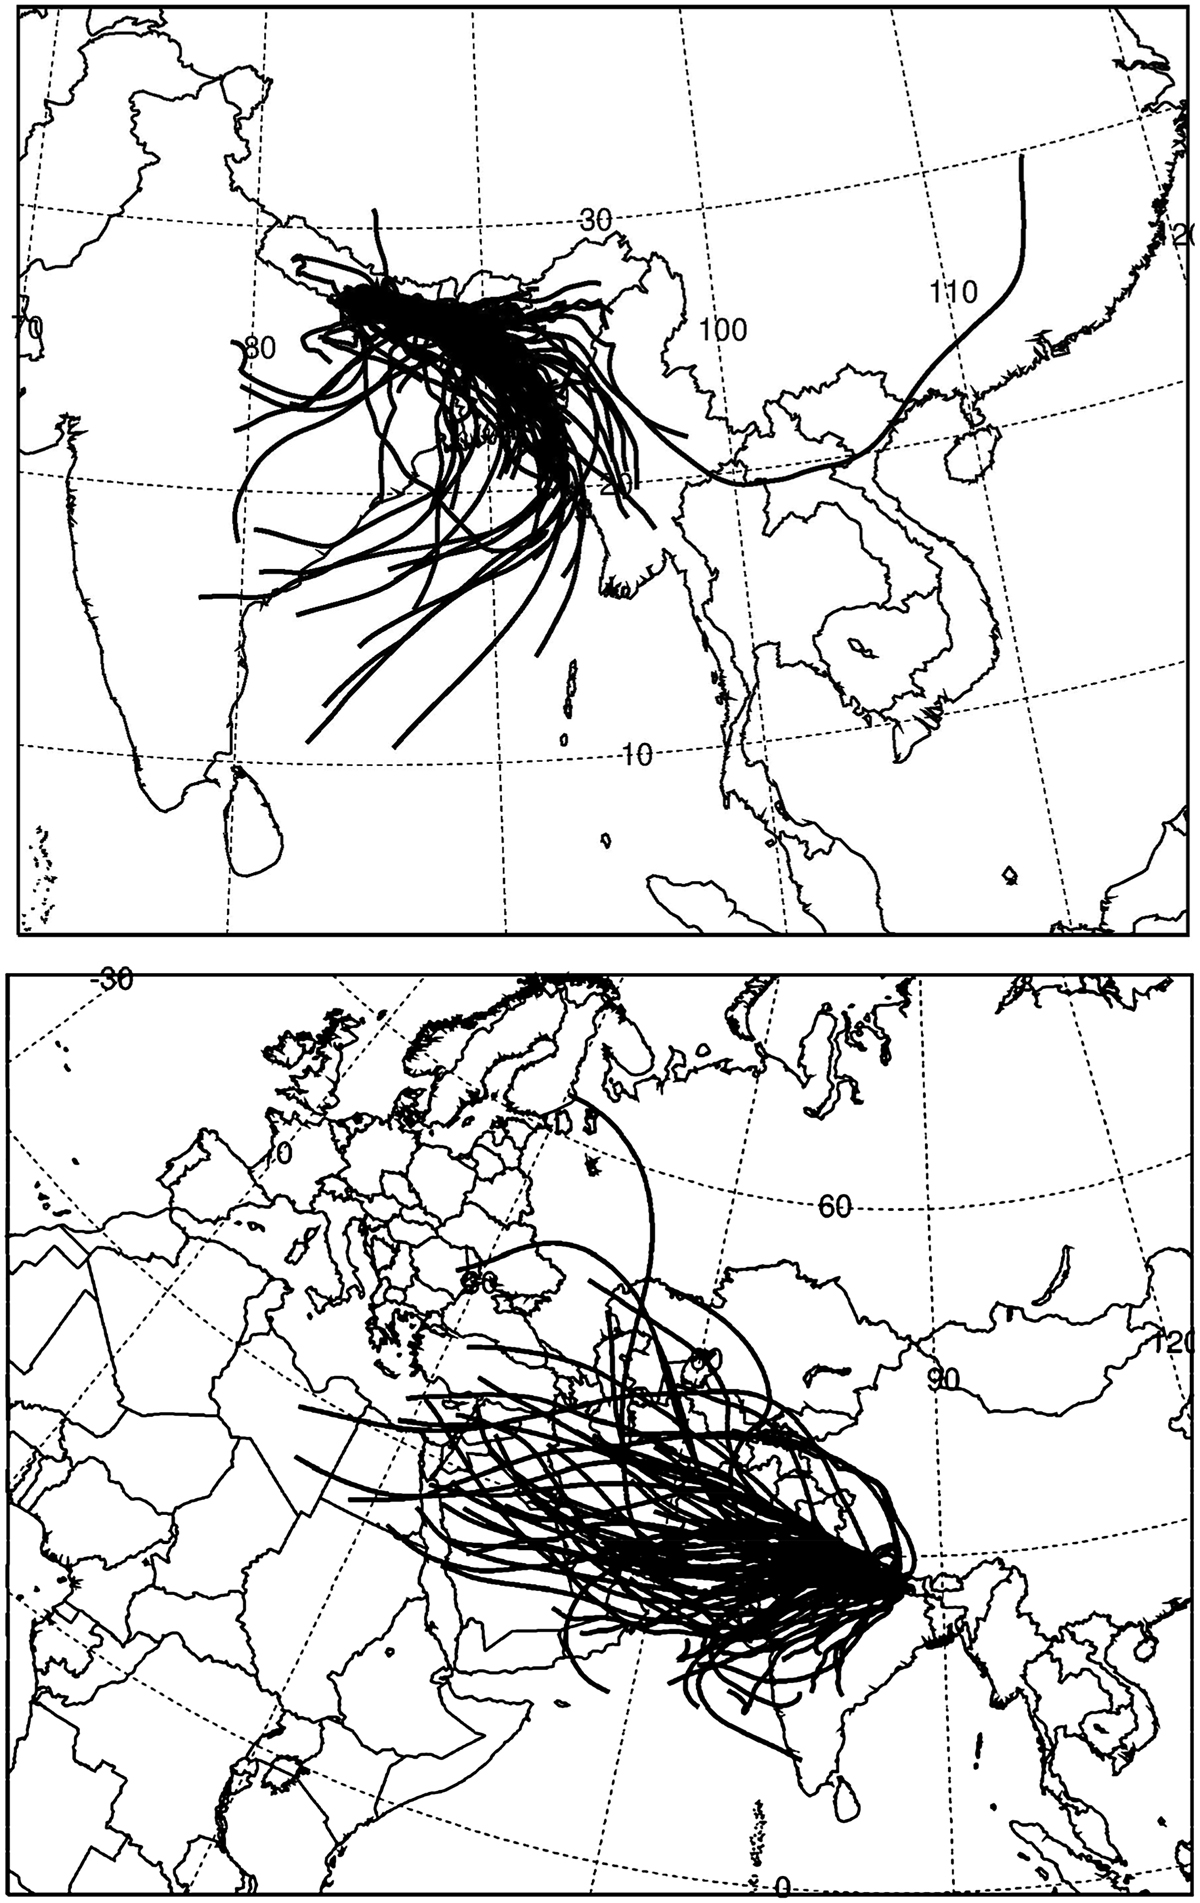
Fig. 3.
Five days trajectory clusters arriving at Godavari. Only days with quality insured samples are included. The panels show trajectories in the clusters ‘Southerly Transport’ (upper, 53%), ‘Westerly Transport’ (lower, 47%). In total 237 trajectories were clustered. Latitude and longitude notations are inside the panels.
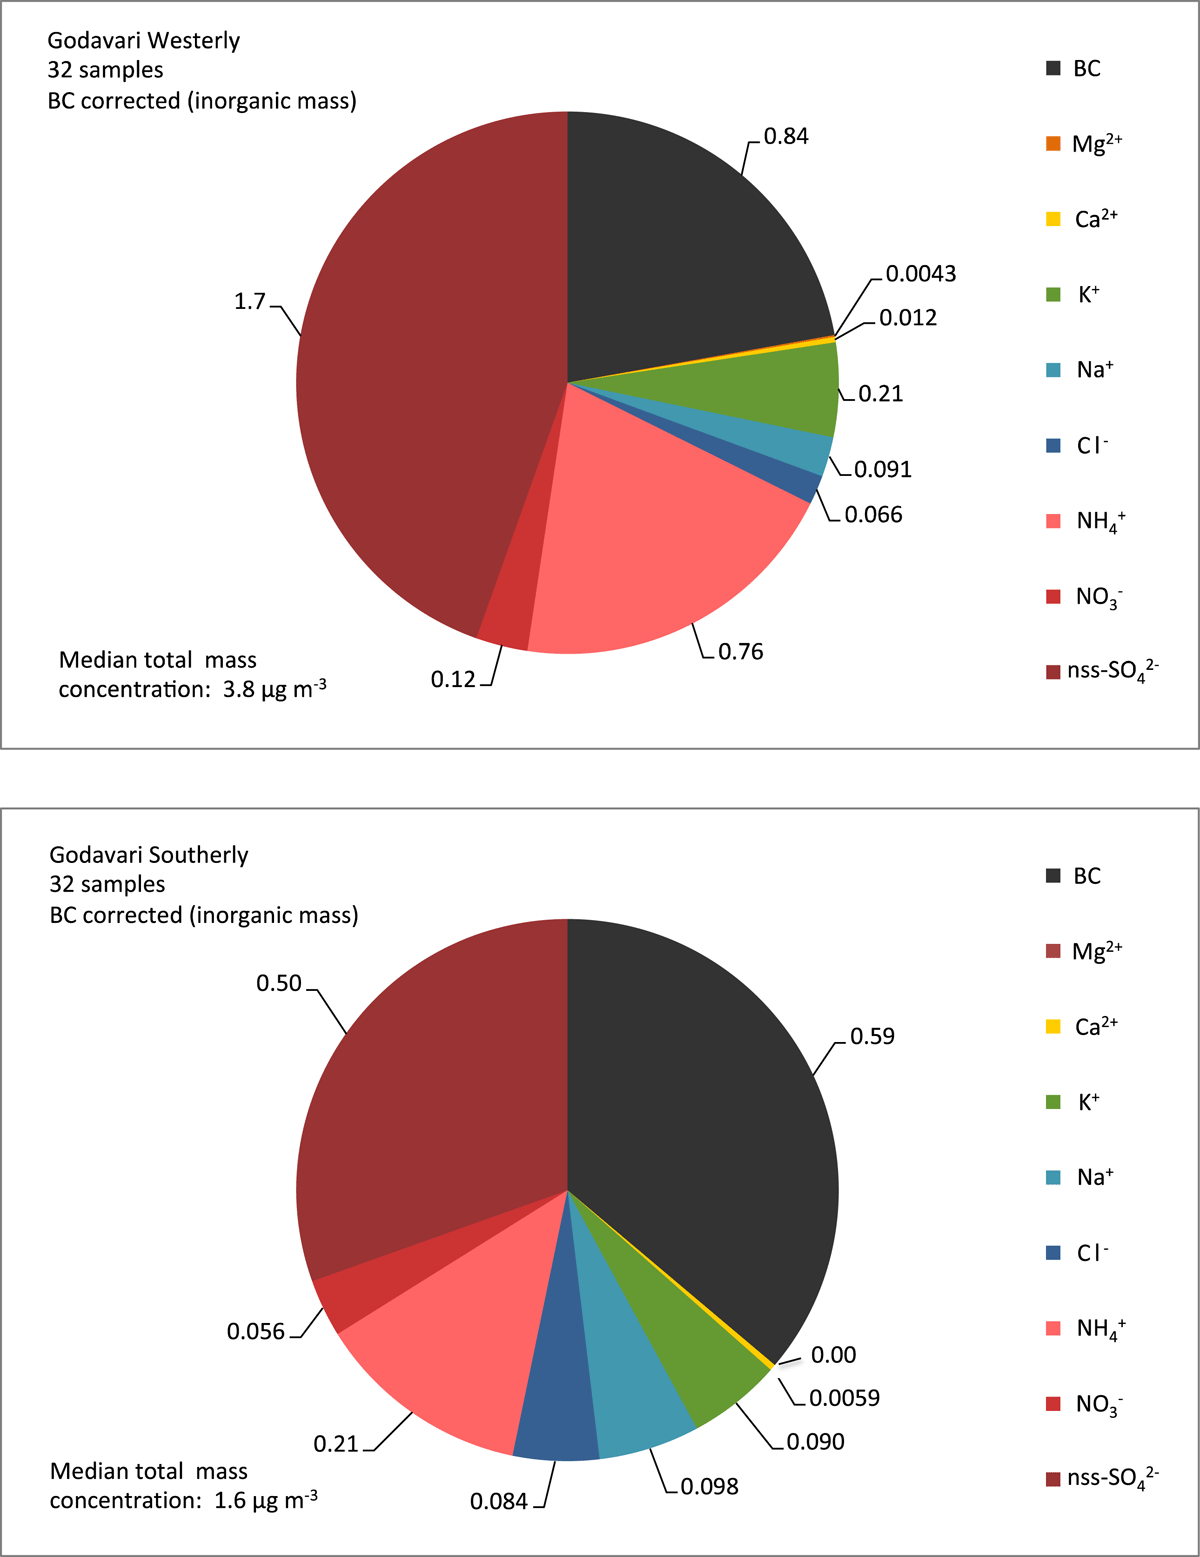
Fig. 4.
Chemical composition of aerosol particles collected at Godavari for the Westerly Cluster (upper) and the Southerly cluster (lower).
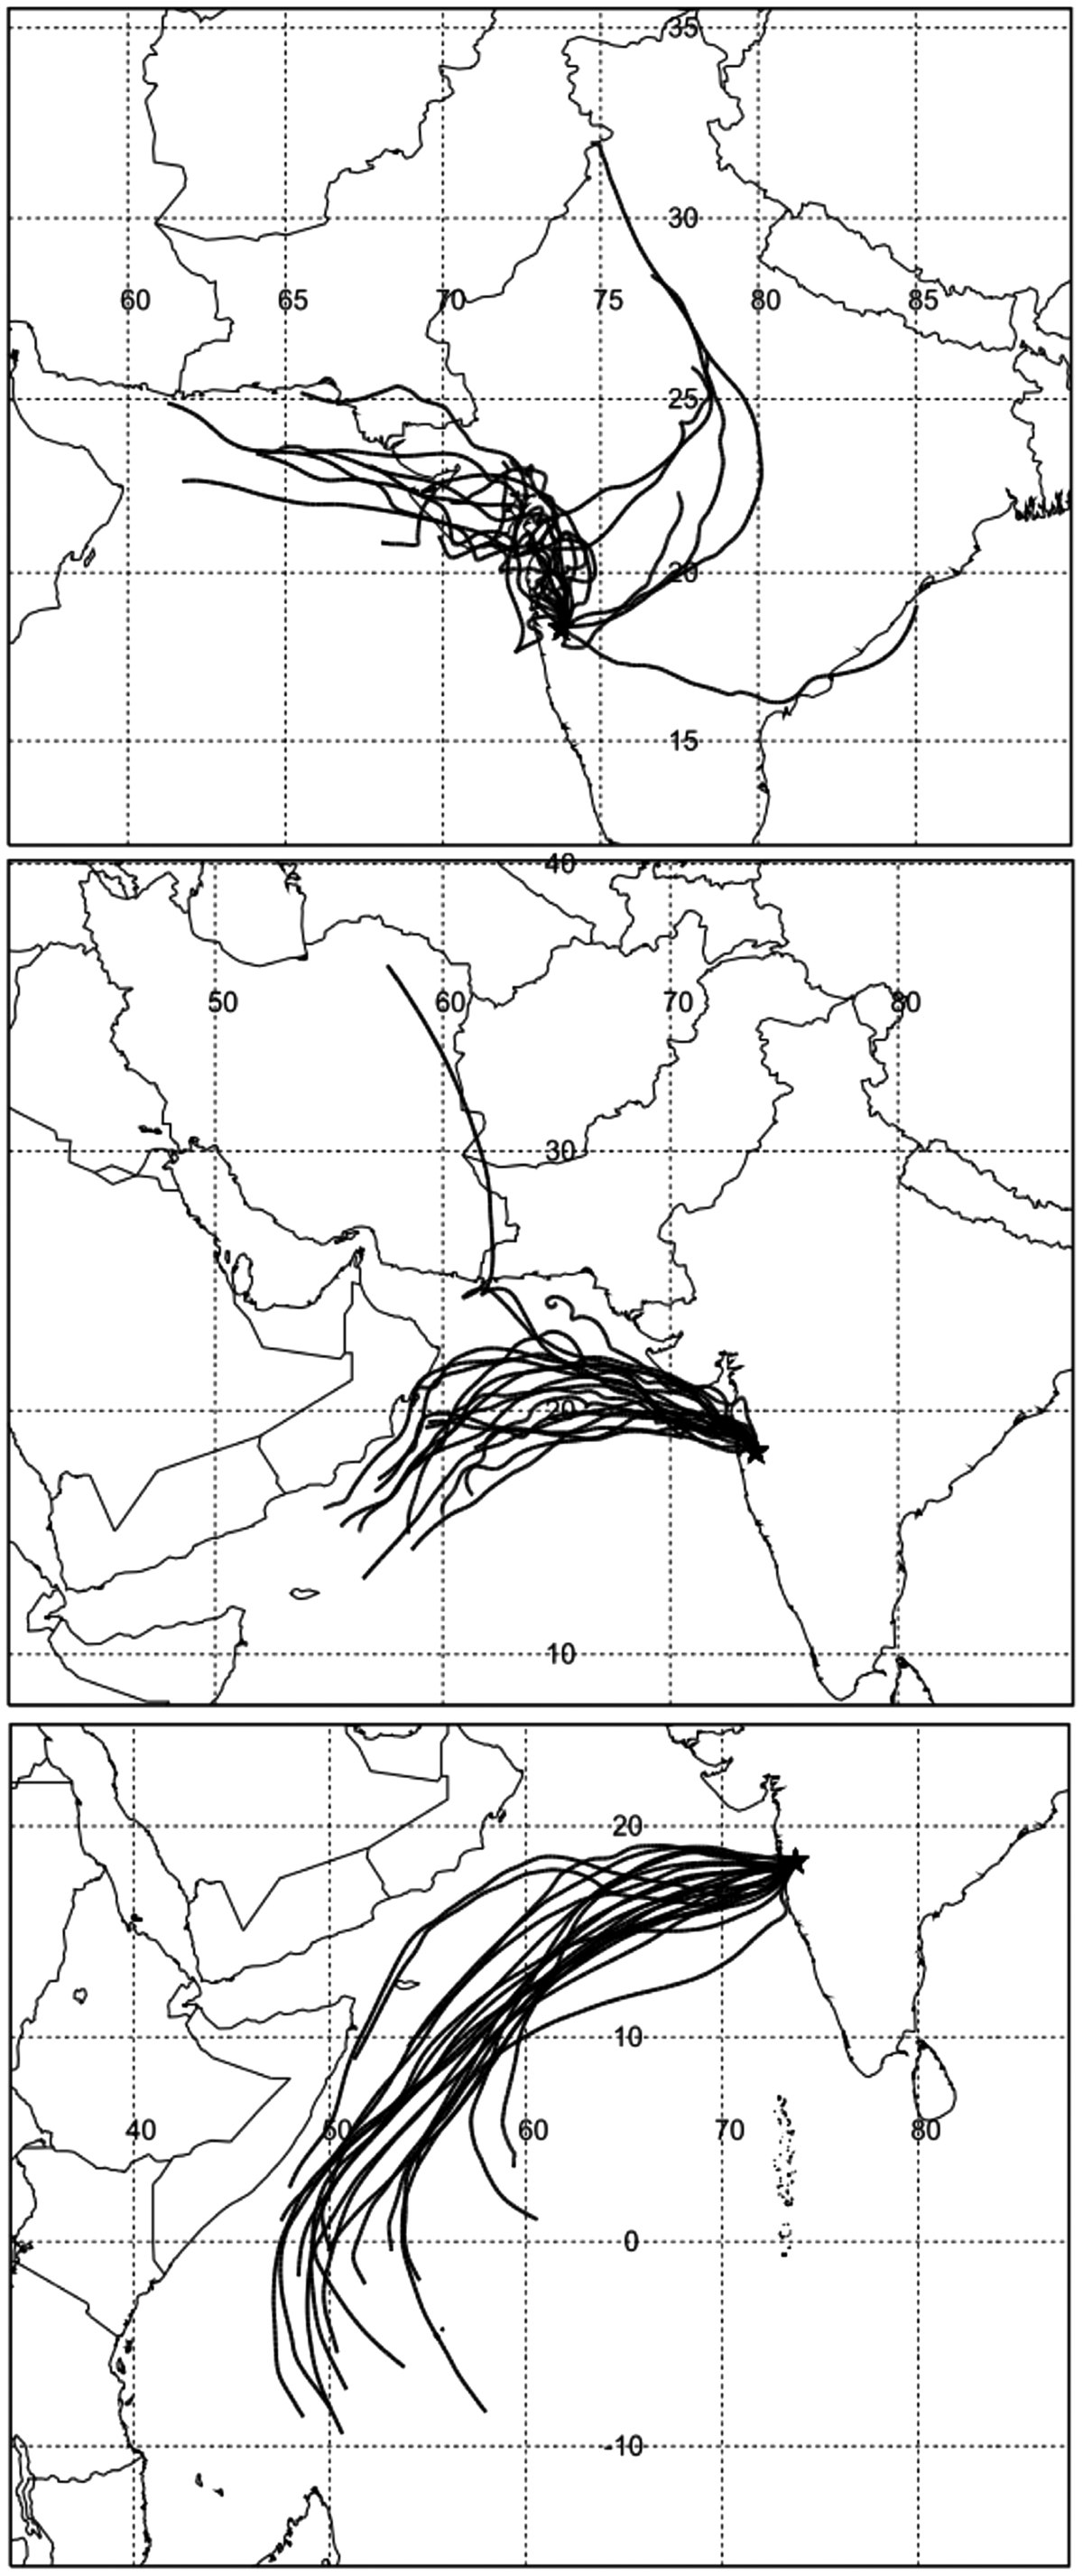
Fig. 5.
Five days trajectory clusters arriving at Sinhagad. Only days with quality insured samples are included. The panels show trajectories in the clusters ‘Indian Subcontinent’ (upper, 32%), ‘Arabian Sea’ (middle, 32%) and ‘Indian Ocean’ (lower, 36%). In total 57 trajectories were clustered. Latitude and longitude notations are inside the panels.
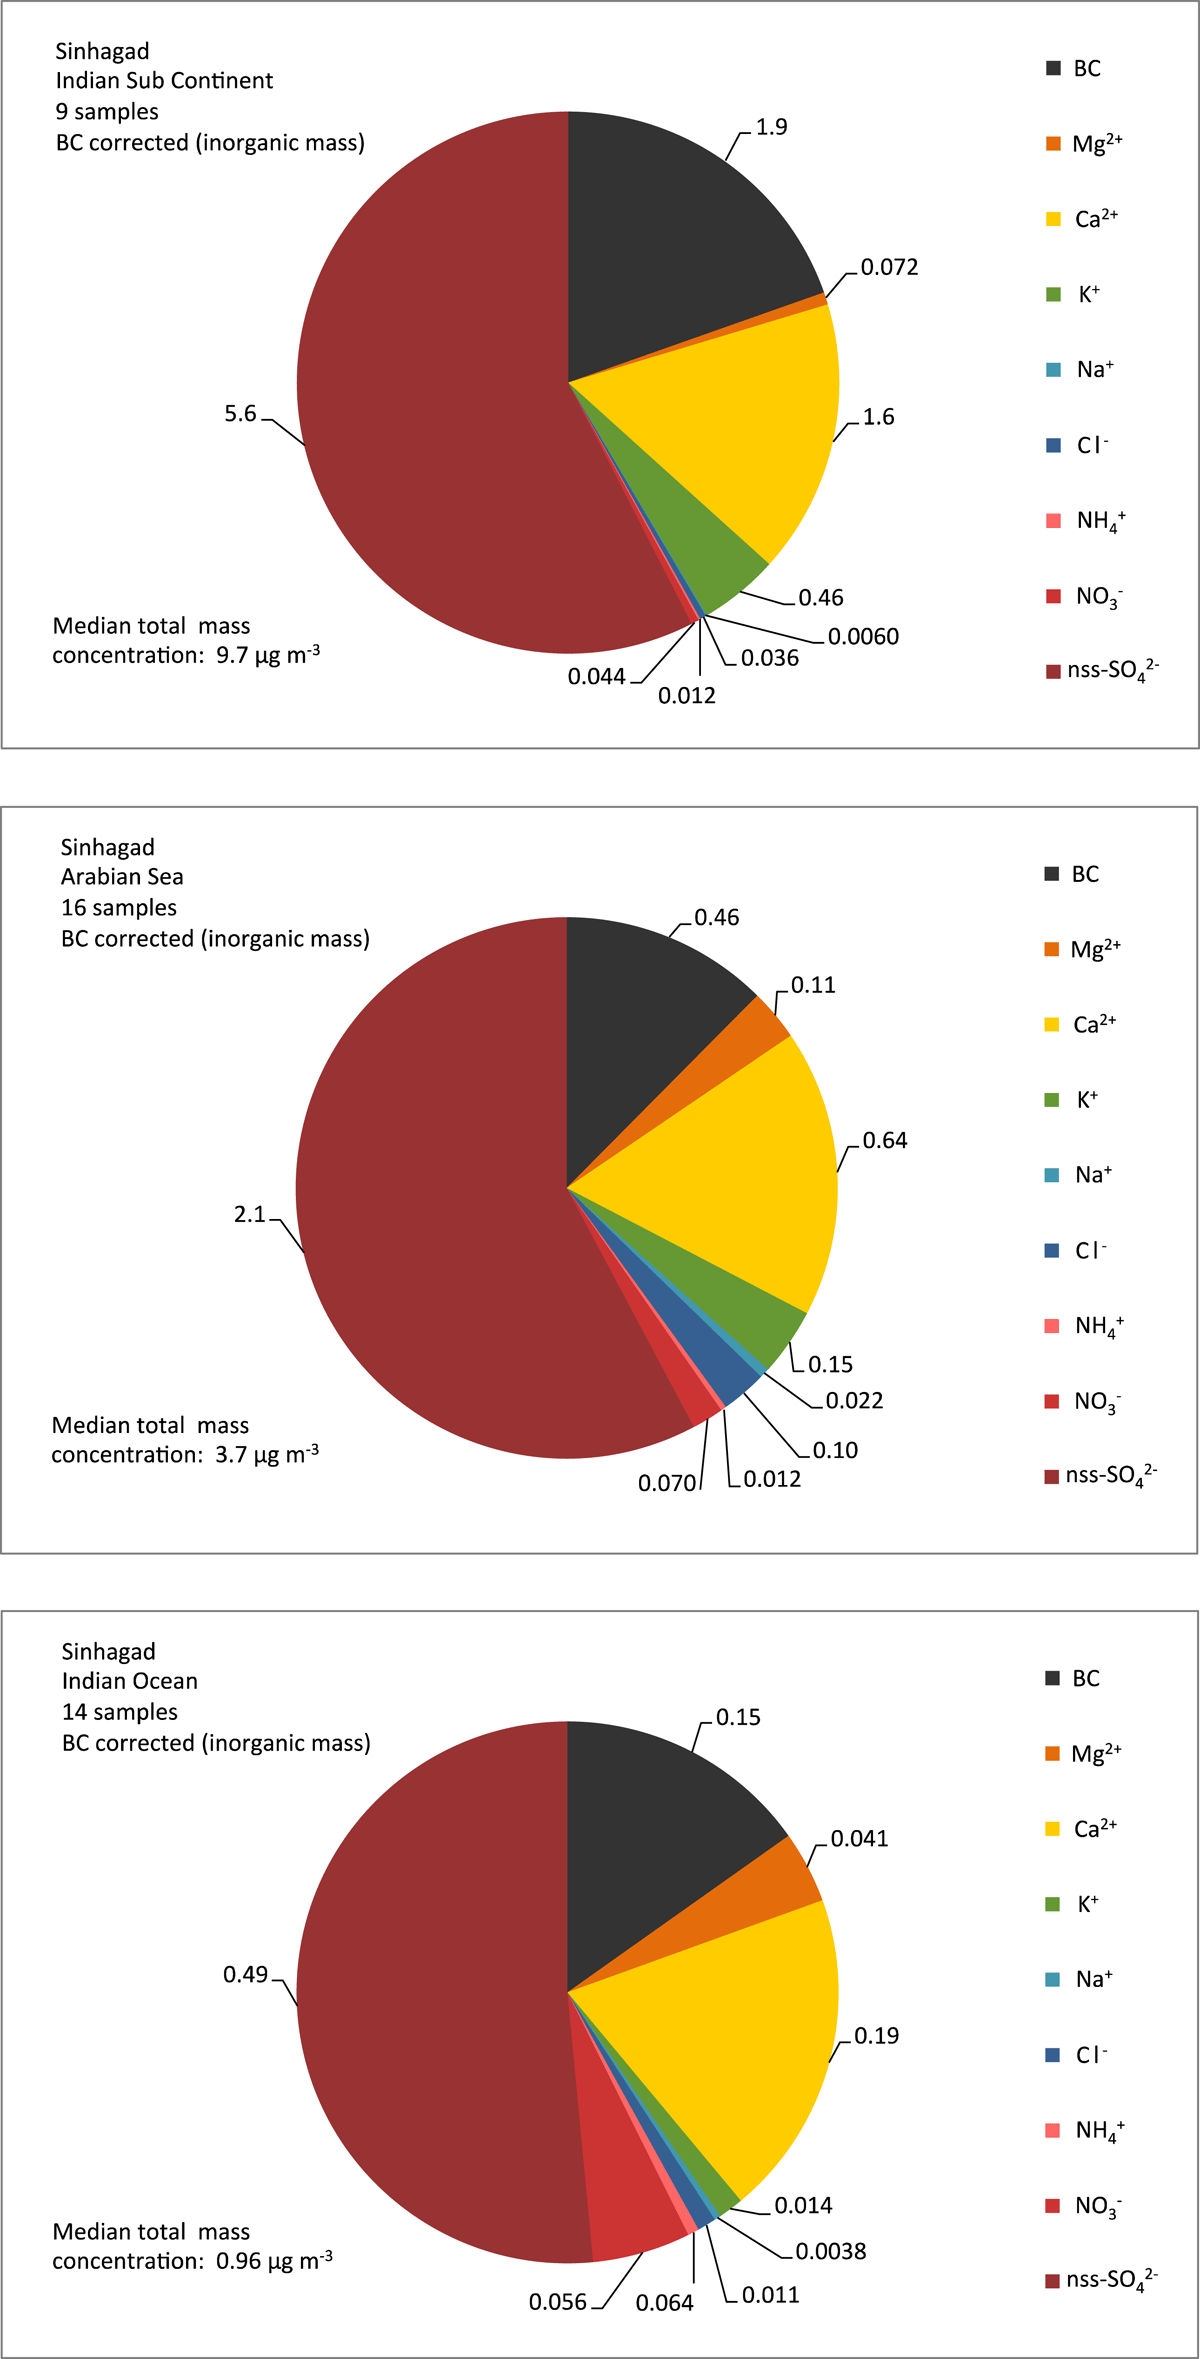
Fig. 6.
Chemical composition of aerosol particles collected at Sinhagad for the Indian Sub Continent cluster (upper), Arabian Sea (middle) and Indian Ocean (lower).

Fig. 7.
Five days trajectory clusters arriving at Hanimaadhoo. Only days with quality insured samples are included. The panels show trajectories in the clusters ‘Indian Subcontinent’ (upper, 19%), ‘Arabian Sea’ (middle, 42%), ‘Indian Ocean’ (lower, 39%). In total 623 trajectories were clustered. Latitude and longitude notations are inside the panels.
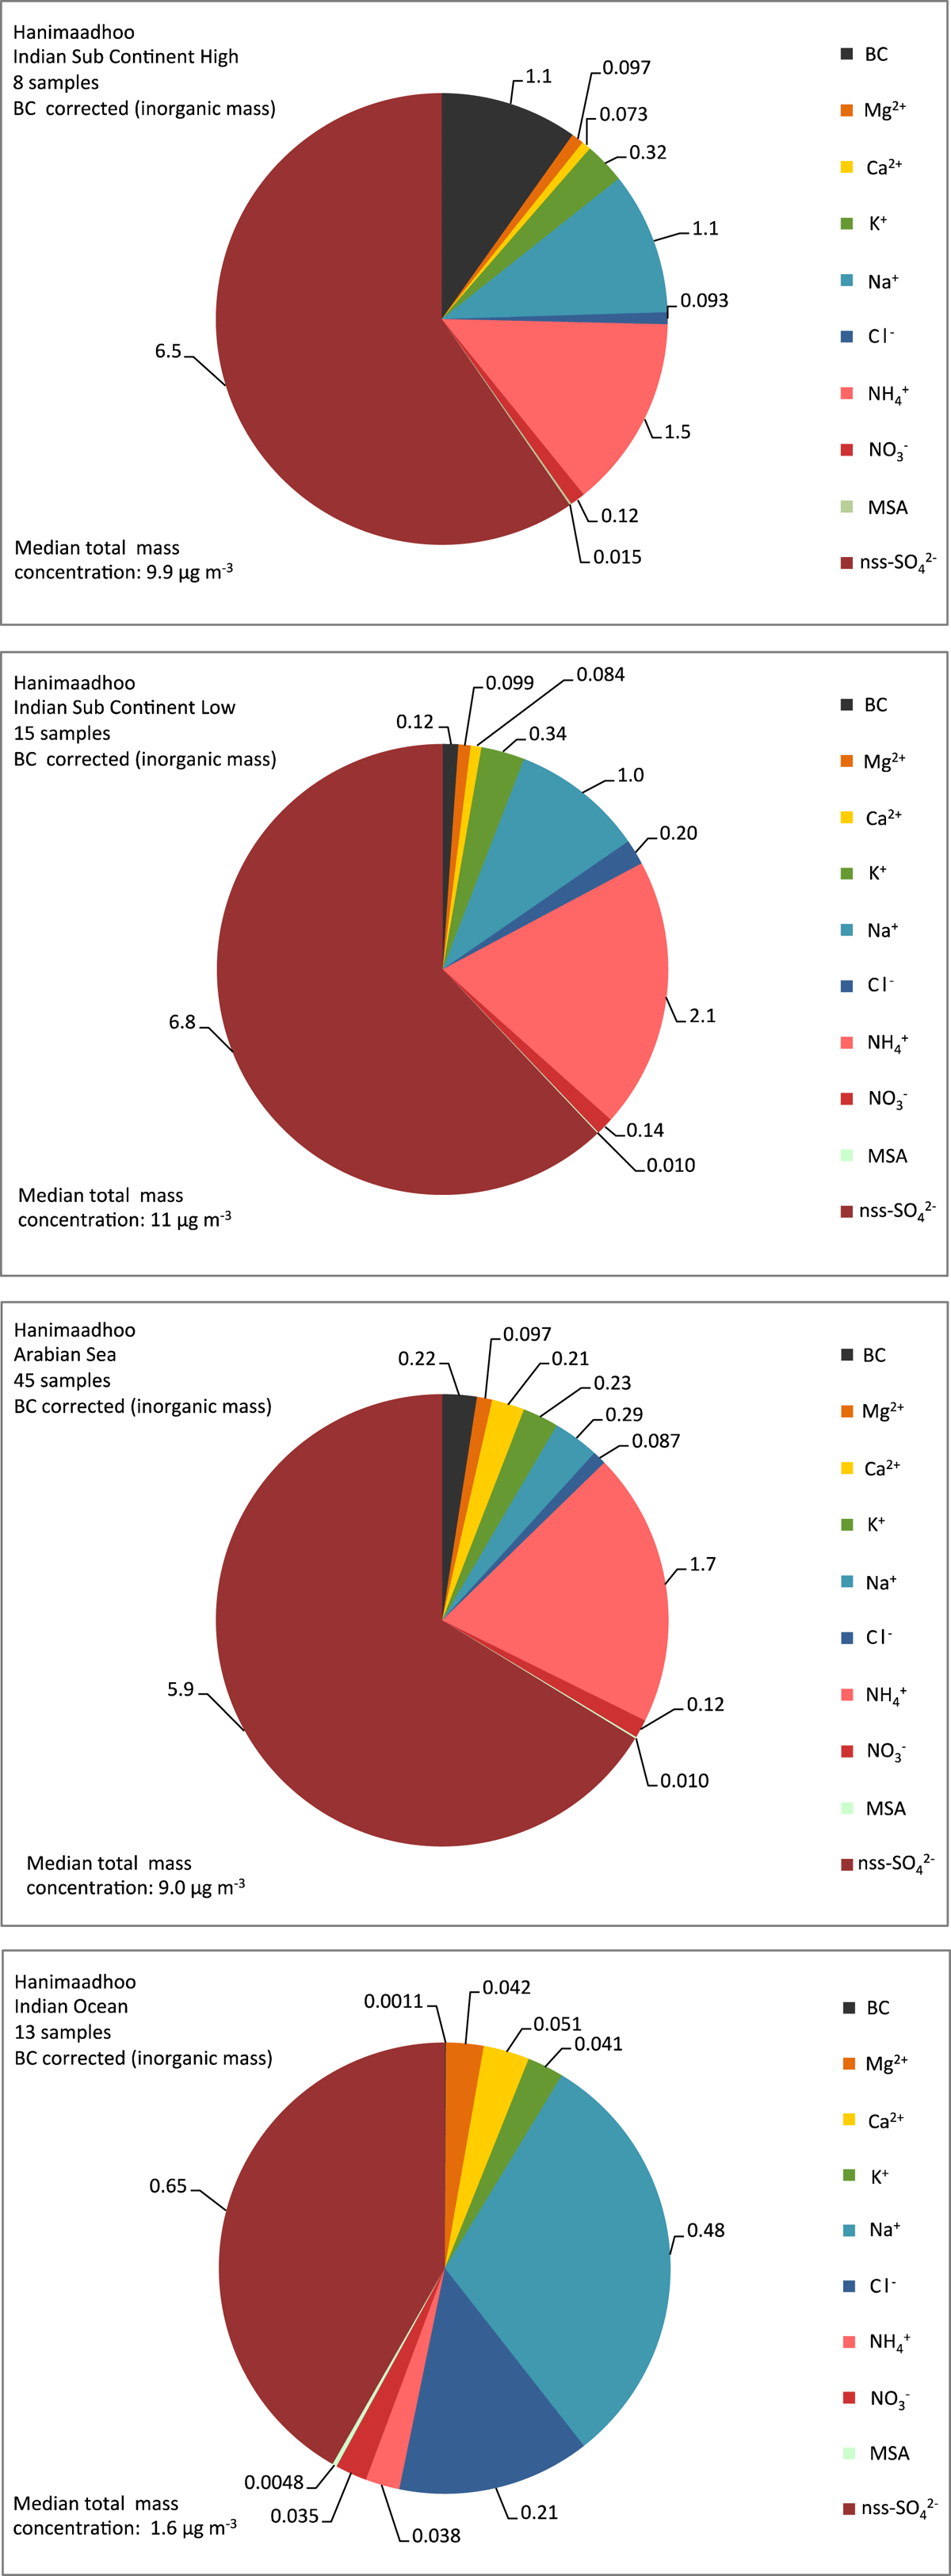
Fig. 8.
Chemical composition of aerosol particles collected at Hanimaadhoo for the Indian Sub Continent high cluster (top), the Indian Sub Continent low cluster (upper middle), Arabian Sea (lower middle) and Indian Ocean (bottom).
Table 2.
The light absorption coefficient of black carbon (Mm−1) in air at the three observatories during 1 June 2005 to 30 May 2009 from optically corrected MISU-PSAP values.
Table 3.
Quality insured filter cassette samples (Section 2.4.1) collected in air at the three observatories during 1 June 2005 to 30 May 2009. Data shown are the total inorganic mass analysed, the mass ratio of BC equivalent to total inorganic analysed mass, the optically and chemically corrected light absorption coefficient of BC (σ ap) and the corresponding reduction of the uncorrected σ ap (σ apuncorr). Also shown are values of the scattering coefficient (σ sp) calculated for the samples.
Note: The calculations were based on a subpopulation of the samples reported in Table 2, but analysed on the BC photometer. The Indian Sub Continent cluster were split in high and low BC content for the chemically BC correction. All values represent median values (50% percentile).
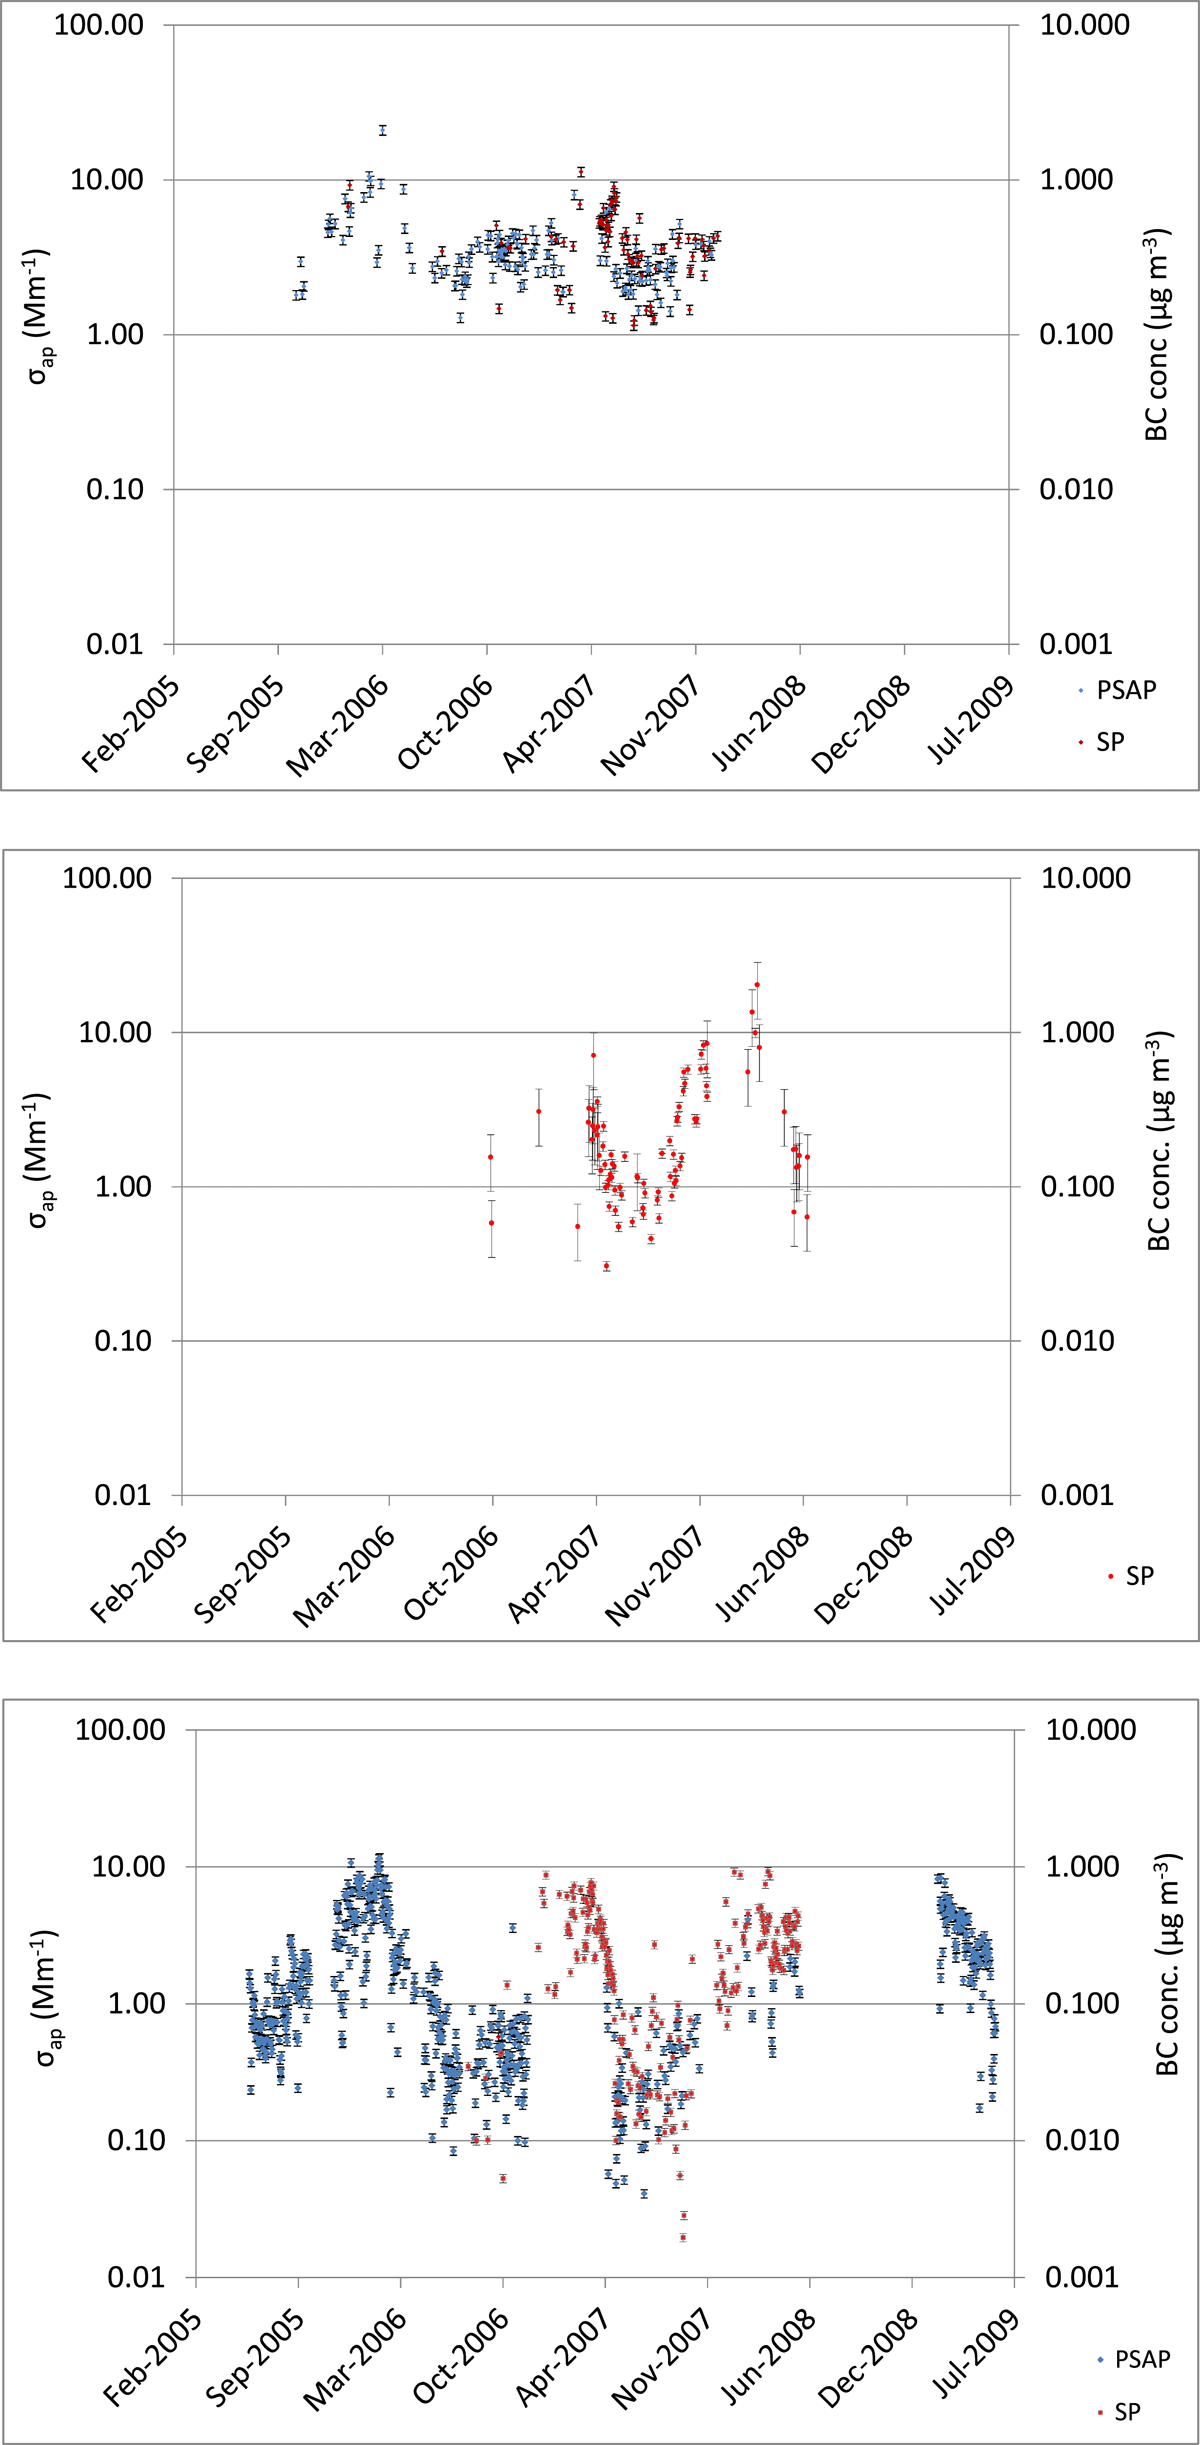
Fig. 9.
The observed light absorption coefficient (σ ap) at 528 nm of BC (black carbon) and corresponding equivalent BC mass concentration in air at Godavari, Nepal (upper), Sinhagad, India (middle) and Hanimaadhoo, Maldives (lower). Blue markers indicate PSAP and red soot photometer (SP). Error bars show the coefficient of variation. The larger variation for the Sinhagad data is due to uncertainties in sampling volume.
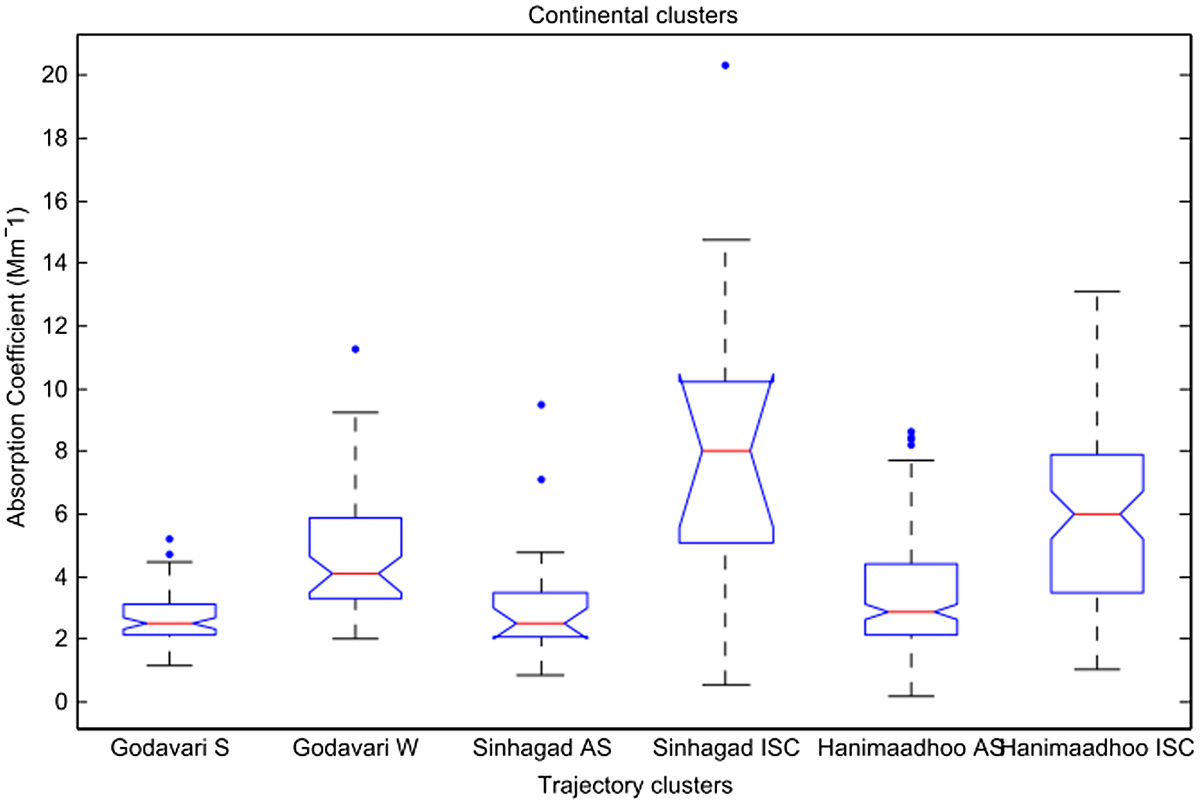
Fig. 10.
Median light absorption coefficients of BC (red lines) for continentally influenced clusters at Godavari, Sinhagad and Hanimaadhoo, associated with the clusters shown in Figs. 3–5. Boxes indicate 75 and 25 percentile values. Bars have the length of the inter-quartile range times 1.5. Blue dots are values outside the inter-quartile range. If the notches around the median values do not overlap, the true median values do differ with 95% confidence. Southerly = S, Westerly = W, Arabian Sea = AS, Indian Subcontinent = ISC.
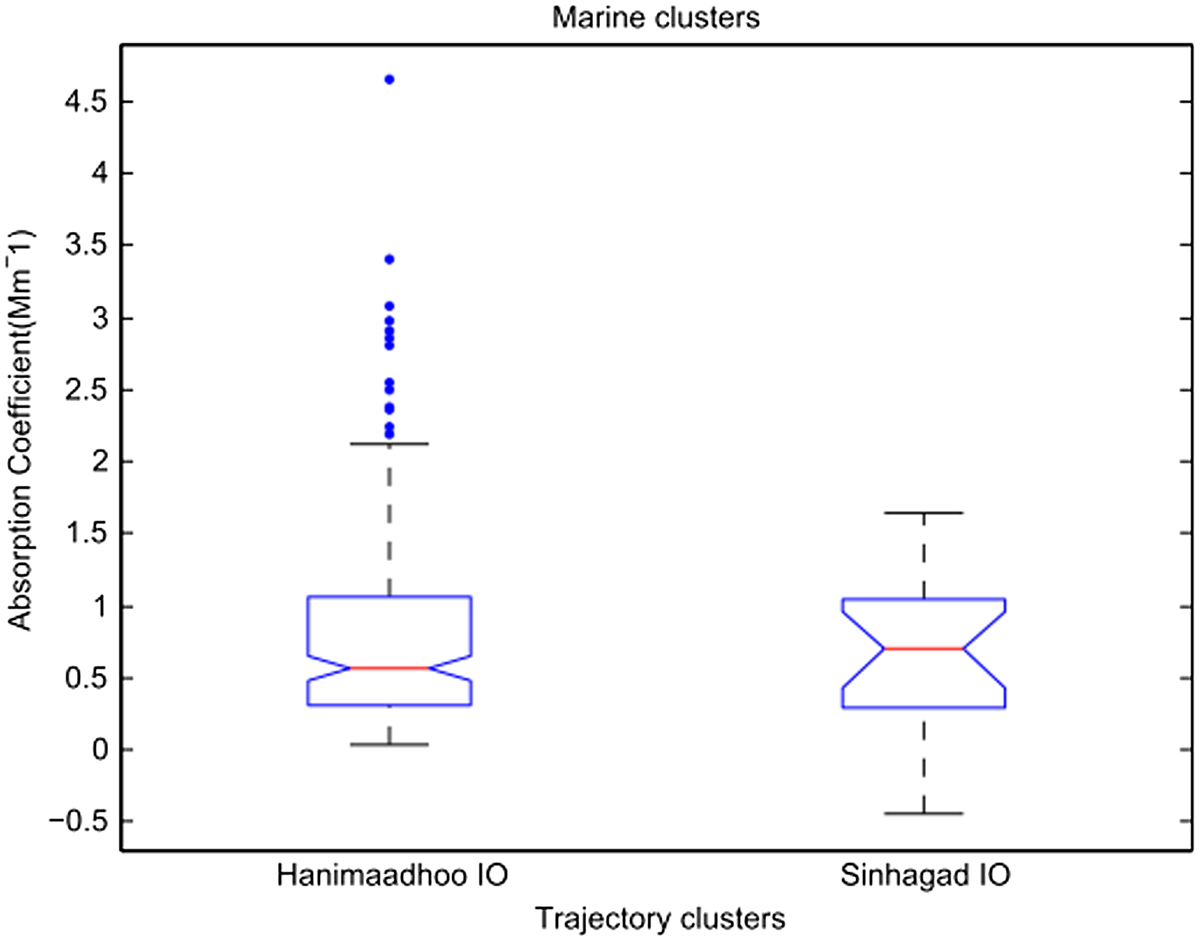
Fig. 11.
Median light absorption coefficients of BC (red lines) for marine influenced clusters at Sinhagad and Hanimaadhoo associated with clusters shown in Figs. 3–5. Boxes indicate 75 and 25 percentile values. Bars have the length of the inter-quartile range times 1.5. Blue dots are values outside the inter-quartile range. If the notches around the median values do not overlap, the true median values do differ with 95% confidence. Indian Ocean = IO.
Table 4.
BC (black carbon) mass concentrations (μg m−3) in air measured with optical techniques at locations over the Indian subcontinent and the Indian Ocean.
* BC mass concentration was calculated applying a mass absorption efficiency of 10 m2 g−1 (Heintzenberg, 1982).