
Table 1.
Evaluation scores for the MATCH and EMEP models during two different historical time periods. Obs. is the arithmetic average of the n multi-year observations during the respective period. FO2 is the fraction of modelled multi-year averages that fall within a factor of two of the corresponding observational multi-year average. Bias and RMSE are the average bias and root mean square error of model results. Correlation coefficient denotes the correlation between the n modelled and observational multi-year values (i.e. the spatial correlation).
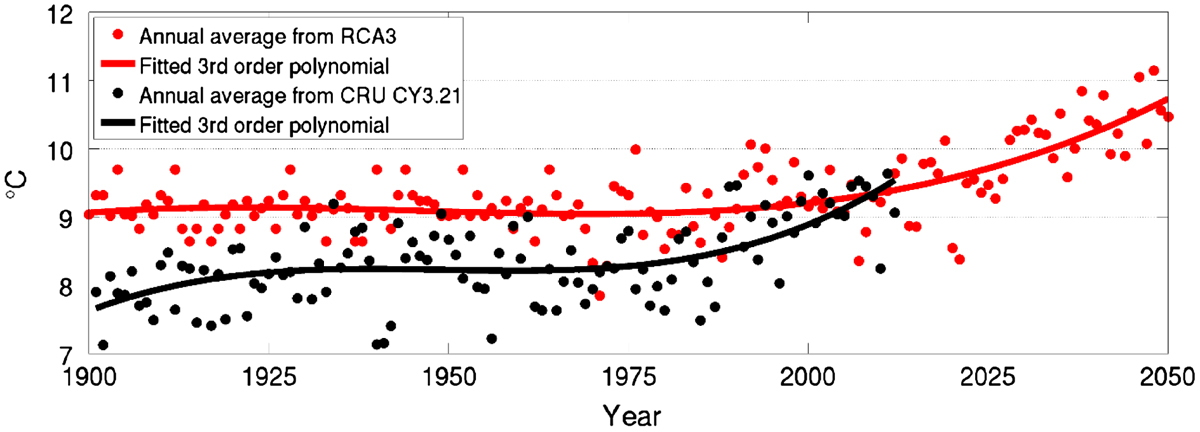
Fig. 1.
Trends of annual average 2 m temperatures in EU28+. RCA3 data from 1900–1959 are copies of random years during the period 1960–1969. Observational data, 1901–2012, are formed from area-weighted country averages in CRU CY3.21.
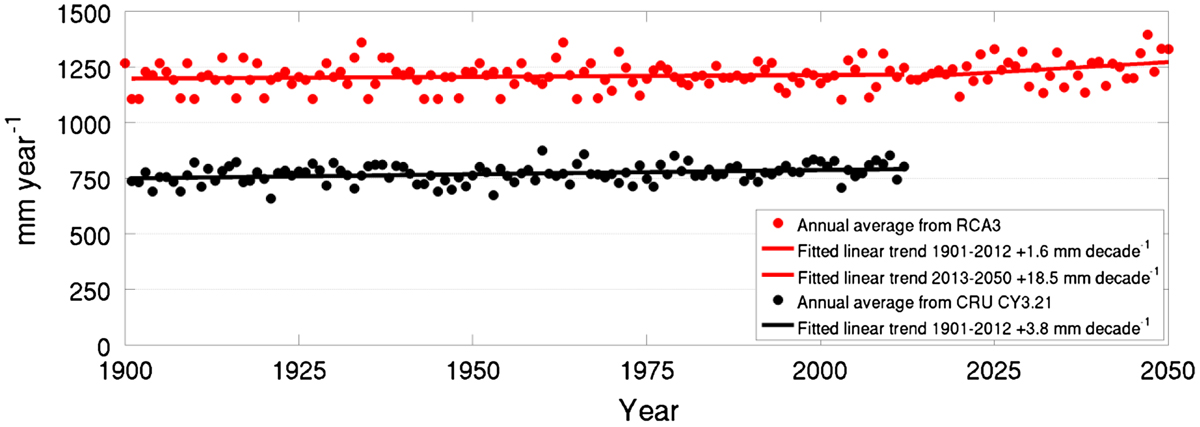
Fig. 2.
Trends of annually accumulated average precipitation in EU28+ . RCA3 data from 1900–1959 are copies of random years during the period 1960–1969. Observational data, 1901–2012, are formed from area-weighted country averages in CRU CY3.21.
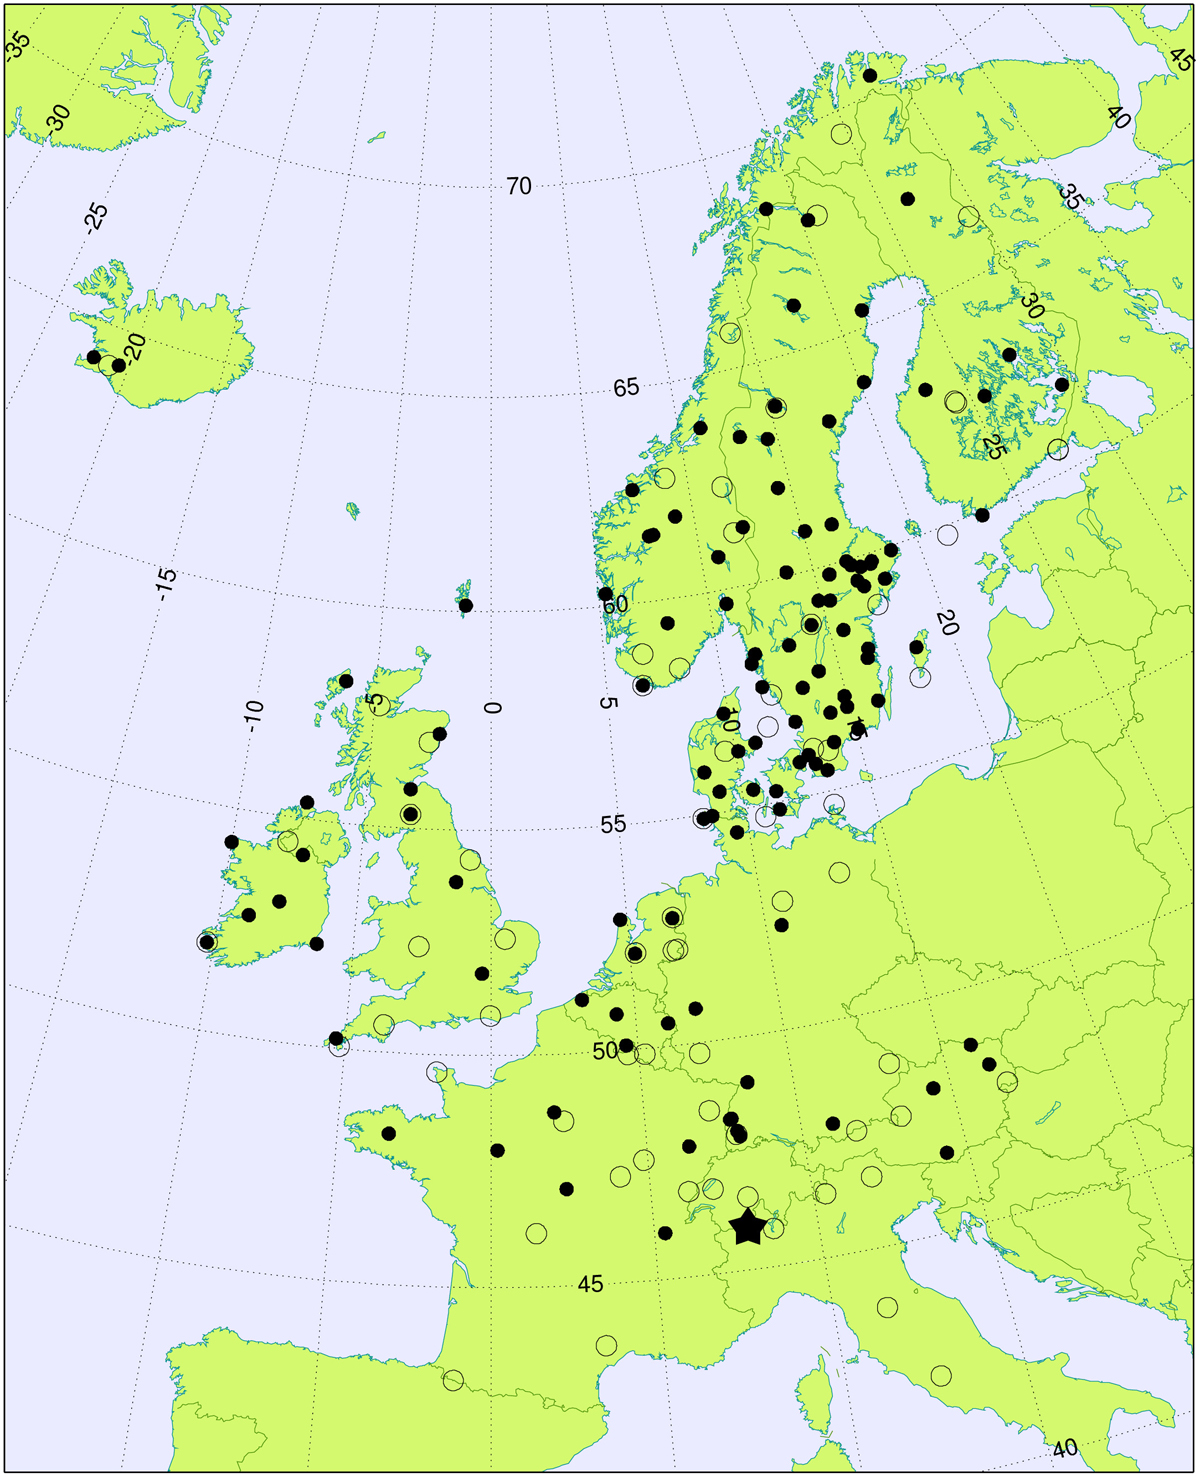
Fig. 3.
Locations of EACN stations with a valid 9-year average concentration during 1958–1966 (solid black circles). Unfilled circles indicate the locations of the EMEP sites with at least one annual mean concentration during the 8-year period of 1983–1990. The location of Colle Gnifetti is indicated with a star.
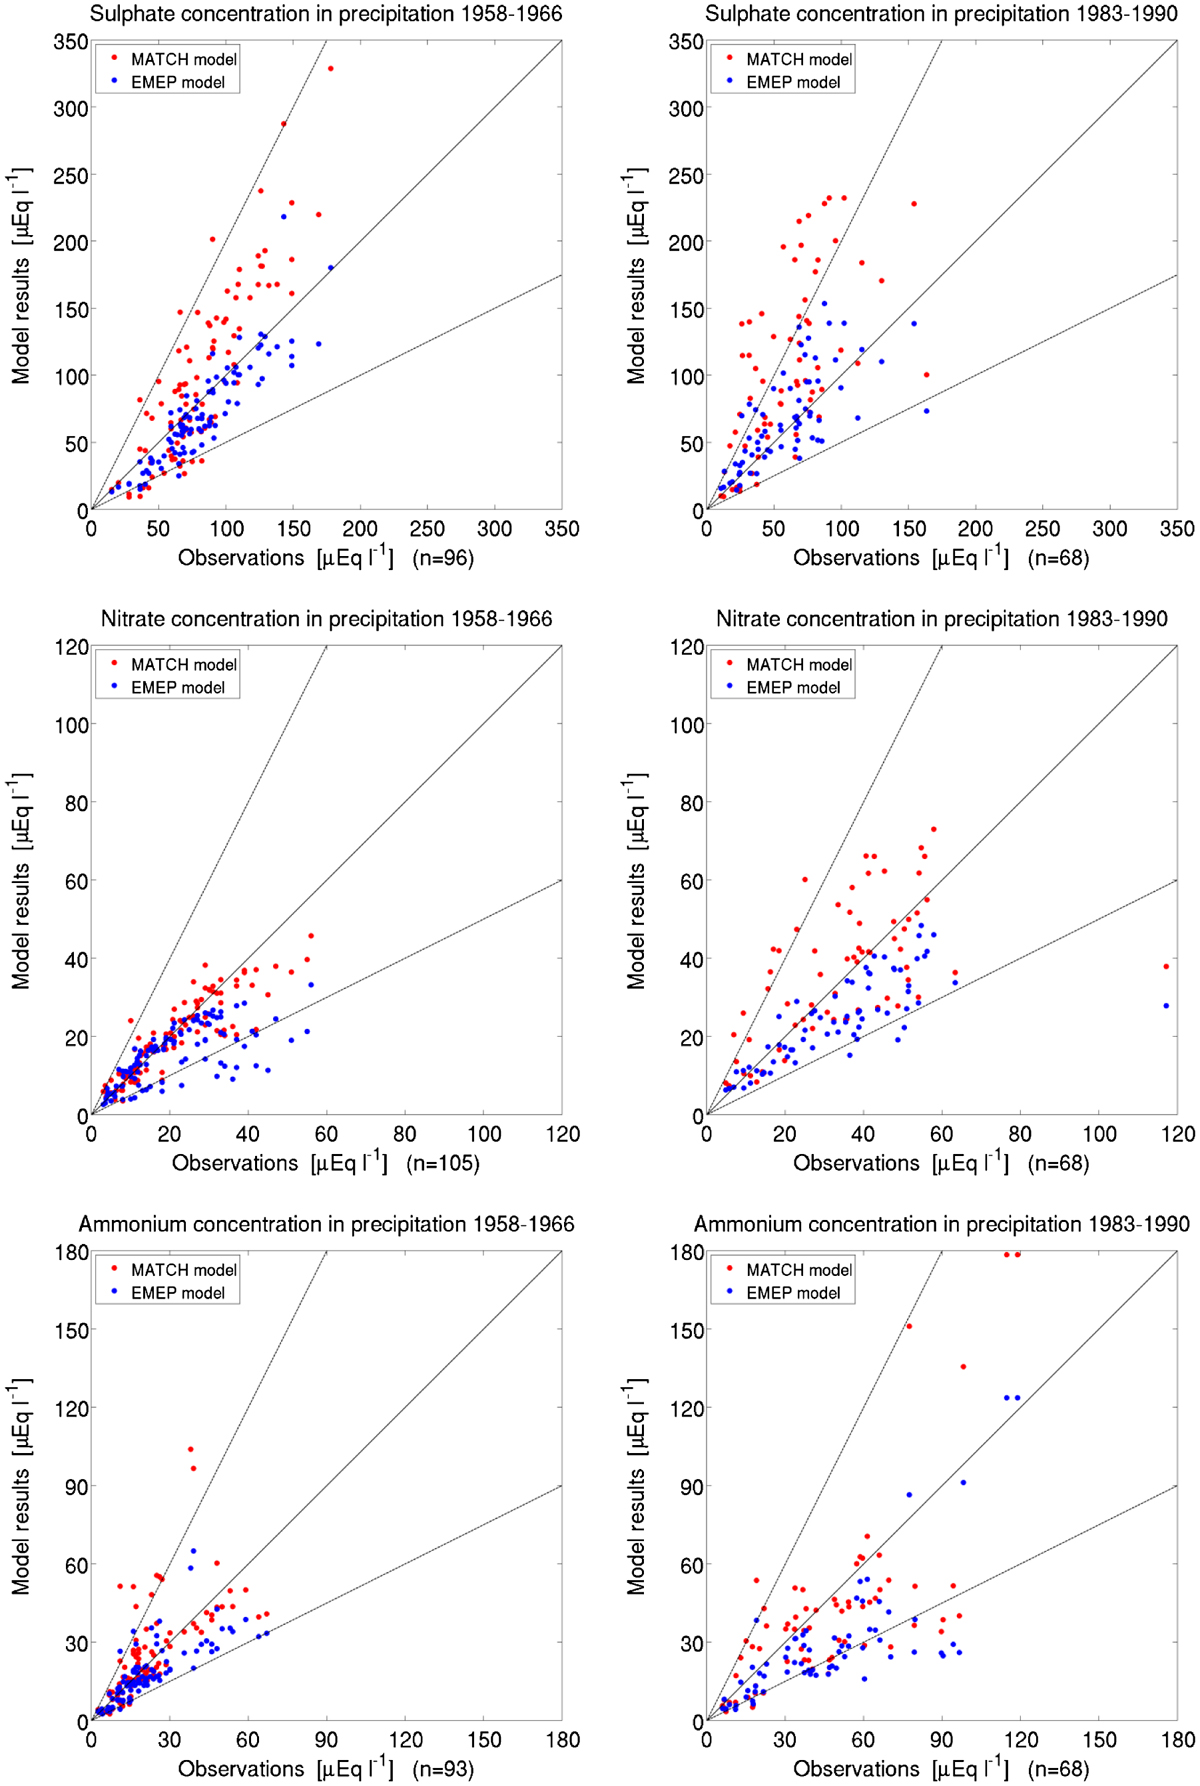
Fig. 4.
Multi-year averages of modelled (MATCH – red; EMEP – blue) versus observed concentration in European precipitation during the early 1960s (1958–1966, left) and the late 1980s (1983–1990, right). n is the number of stations with valid observations during the period in question. The solid line indicates the 1:1 relation and the dashed lines are the factor of two envelopes. Regression statistics are given in Table 1. Numerical values of the observations are provided in Tables S3 and S4 in the Supplementary Material.
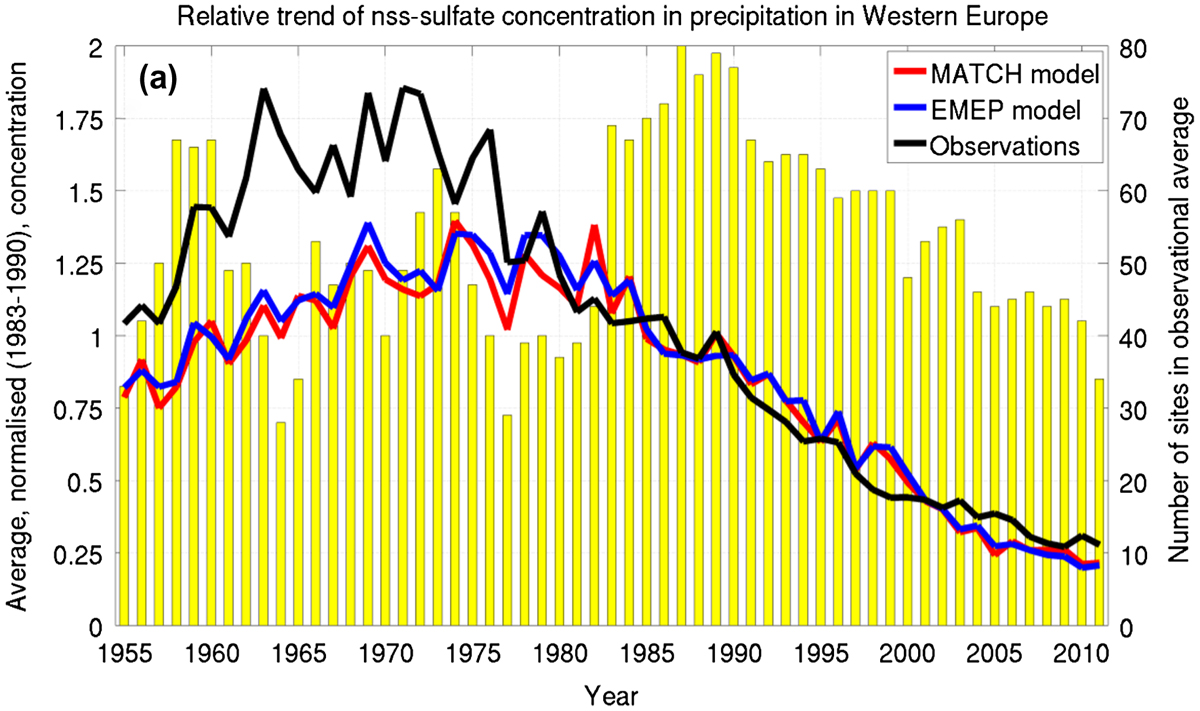
Fig. 5a.
Trend in modelled (MATCH – red; EMEP – blue) and observed normalised nss-sulphate concentration in precipitation in Western Europe during 1955–2011 (left-hand scale). Precipitation-weighted annual mean concentrations of observational data (or model results) are normalised against the respective station’s (or grid cell’s) average during 1983–1990 before forming the Western European averages for each year. Yellow bars indicate number of stations used for forming annual value of observations (right hand scale). The model results are the average over 220 grid cells.
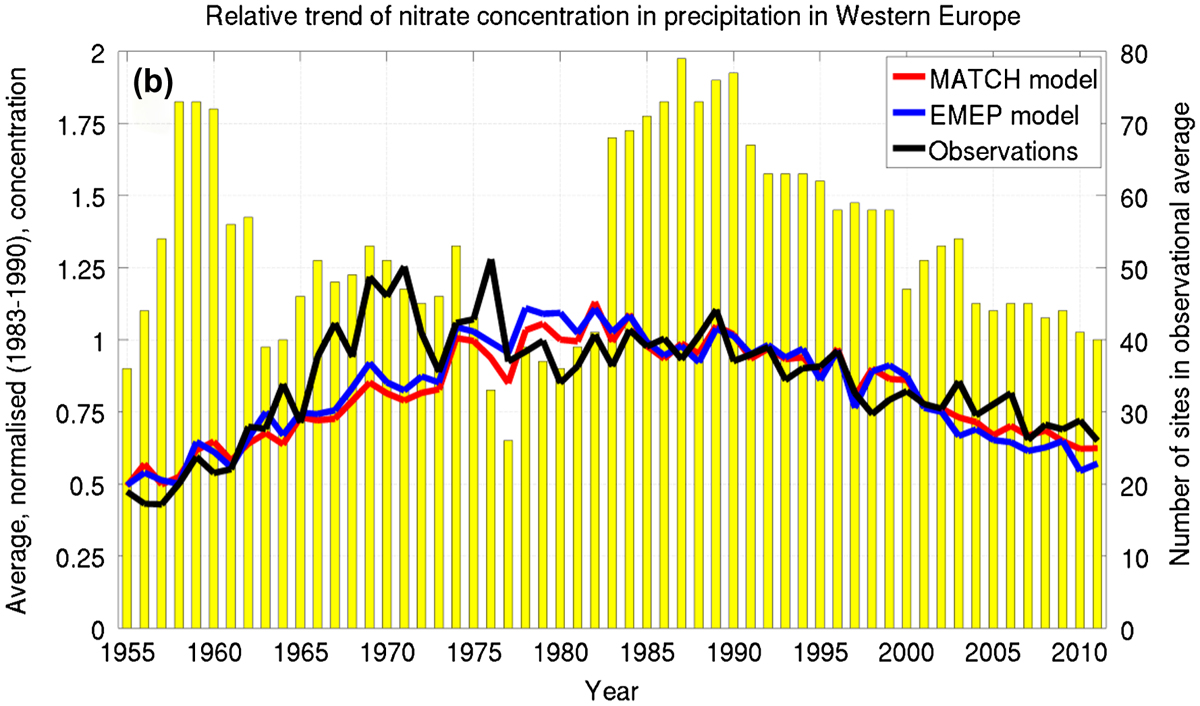
Fig. 5b.
Same as Fig. 5a, but for nitrate in precipitation and model results averaged over 214 sites.
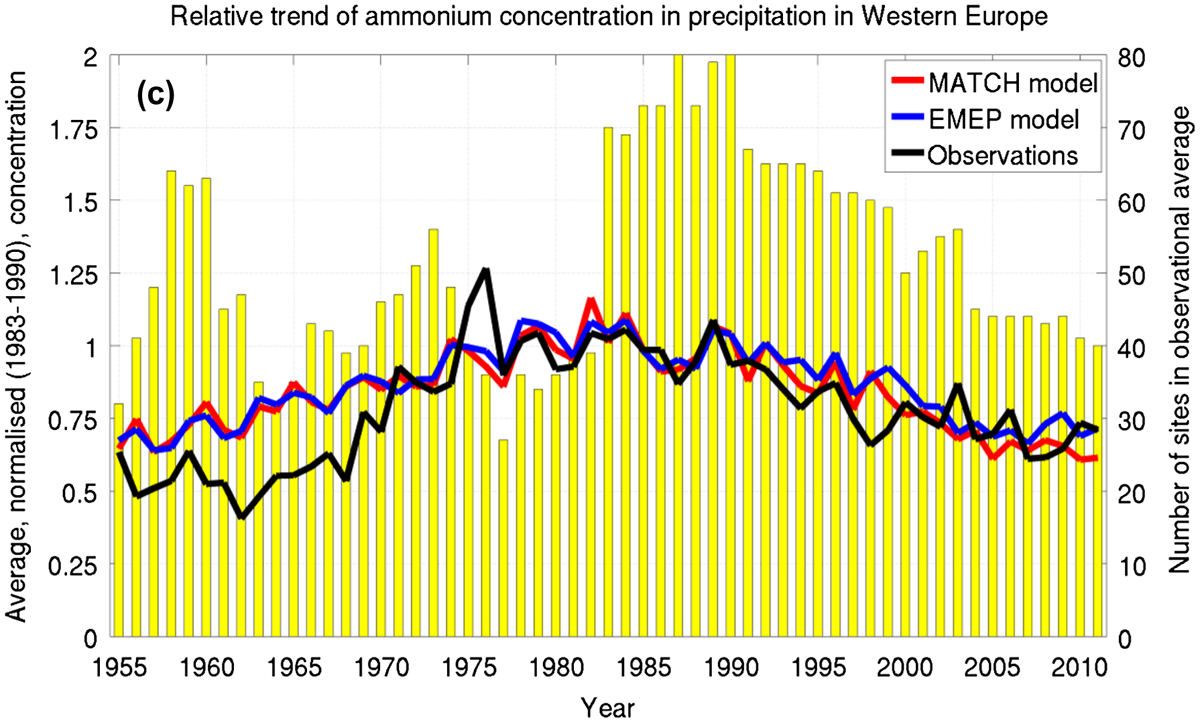
Fig. 5c.
Same as Fig. 5a, but for ammonium in precipitation and model results averaged over 207 sites.
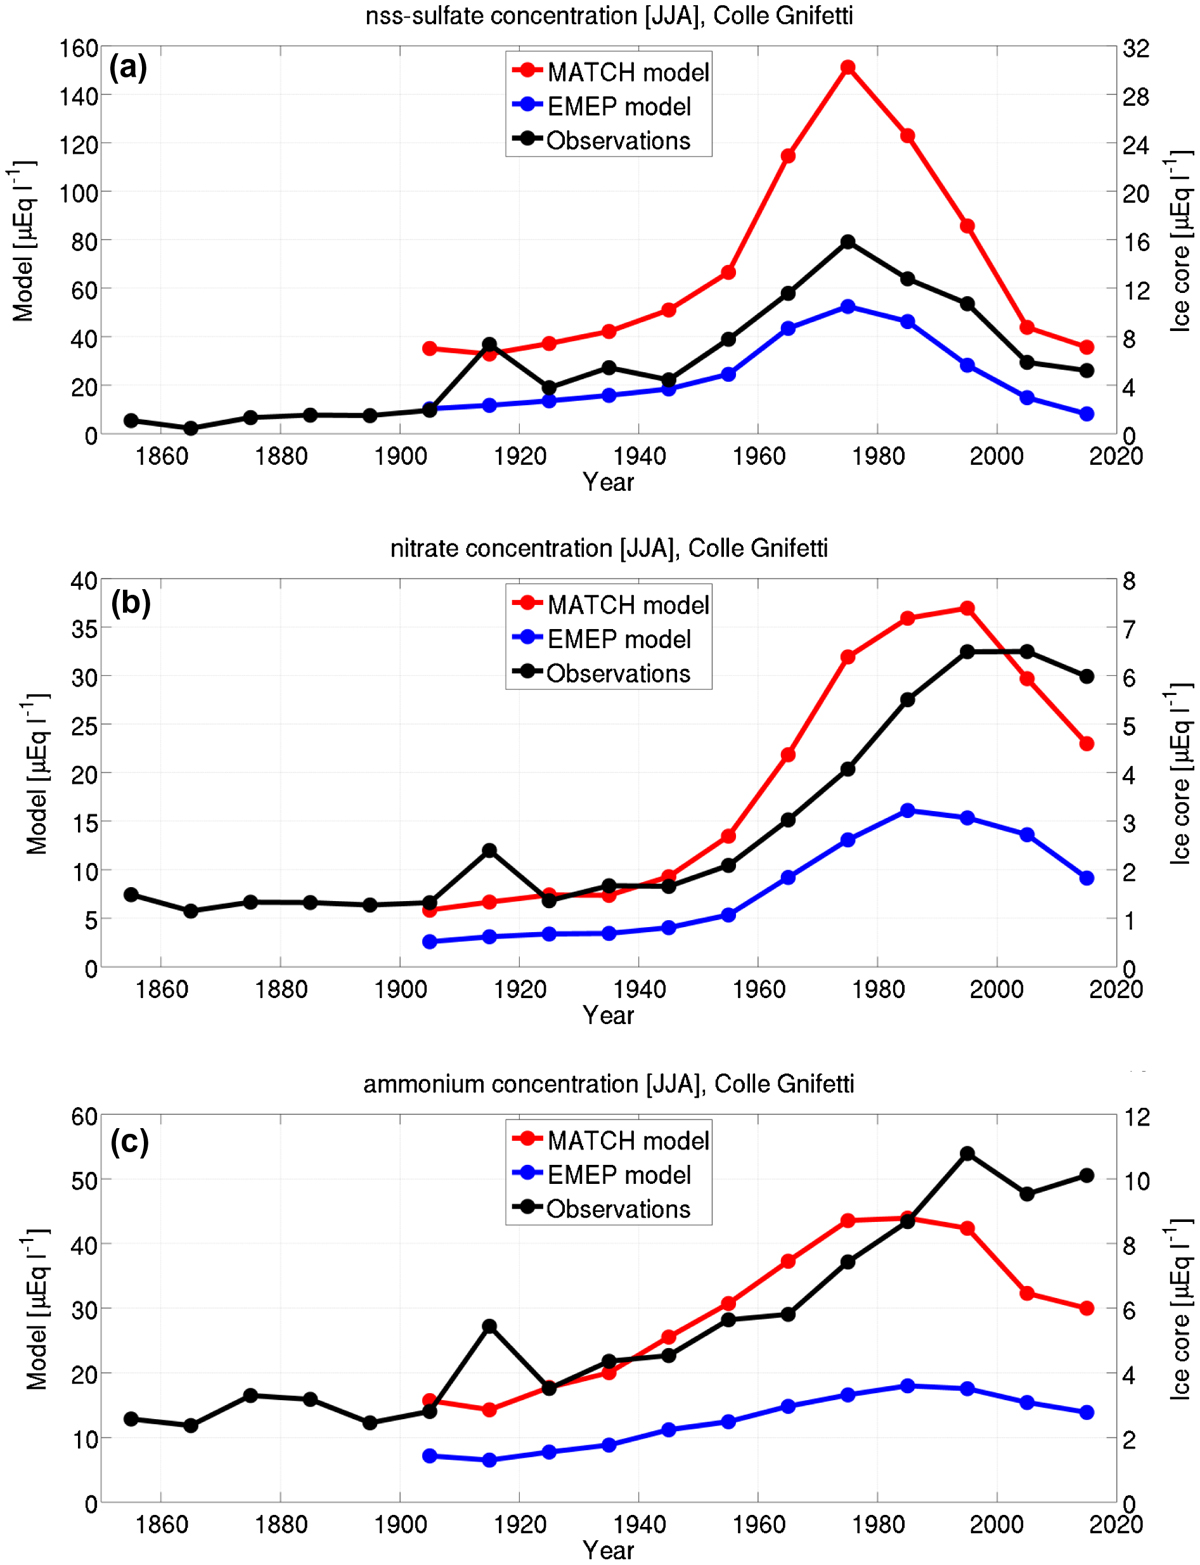
Fig. 6.
Trends of 10-year average of (a) nss–sulphate, (b) nitrate and (c) ammonium extracted from the MATCH and EMEP model (left-hand scale) and in ice cores collected at Colle Gnifetti (right-hand scale). The modelled concentrations are precipitation-weighted mean concentrations over June–August in the gridcell encompassing Colle Gnifetti. The right-hand scale is consistently a factor of five smaller than the left-hand scale.
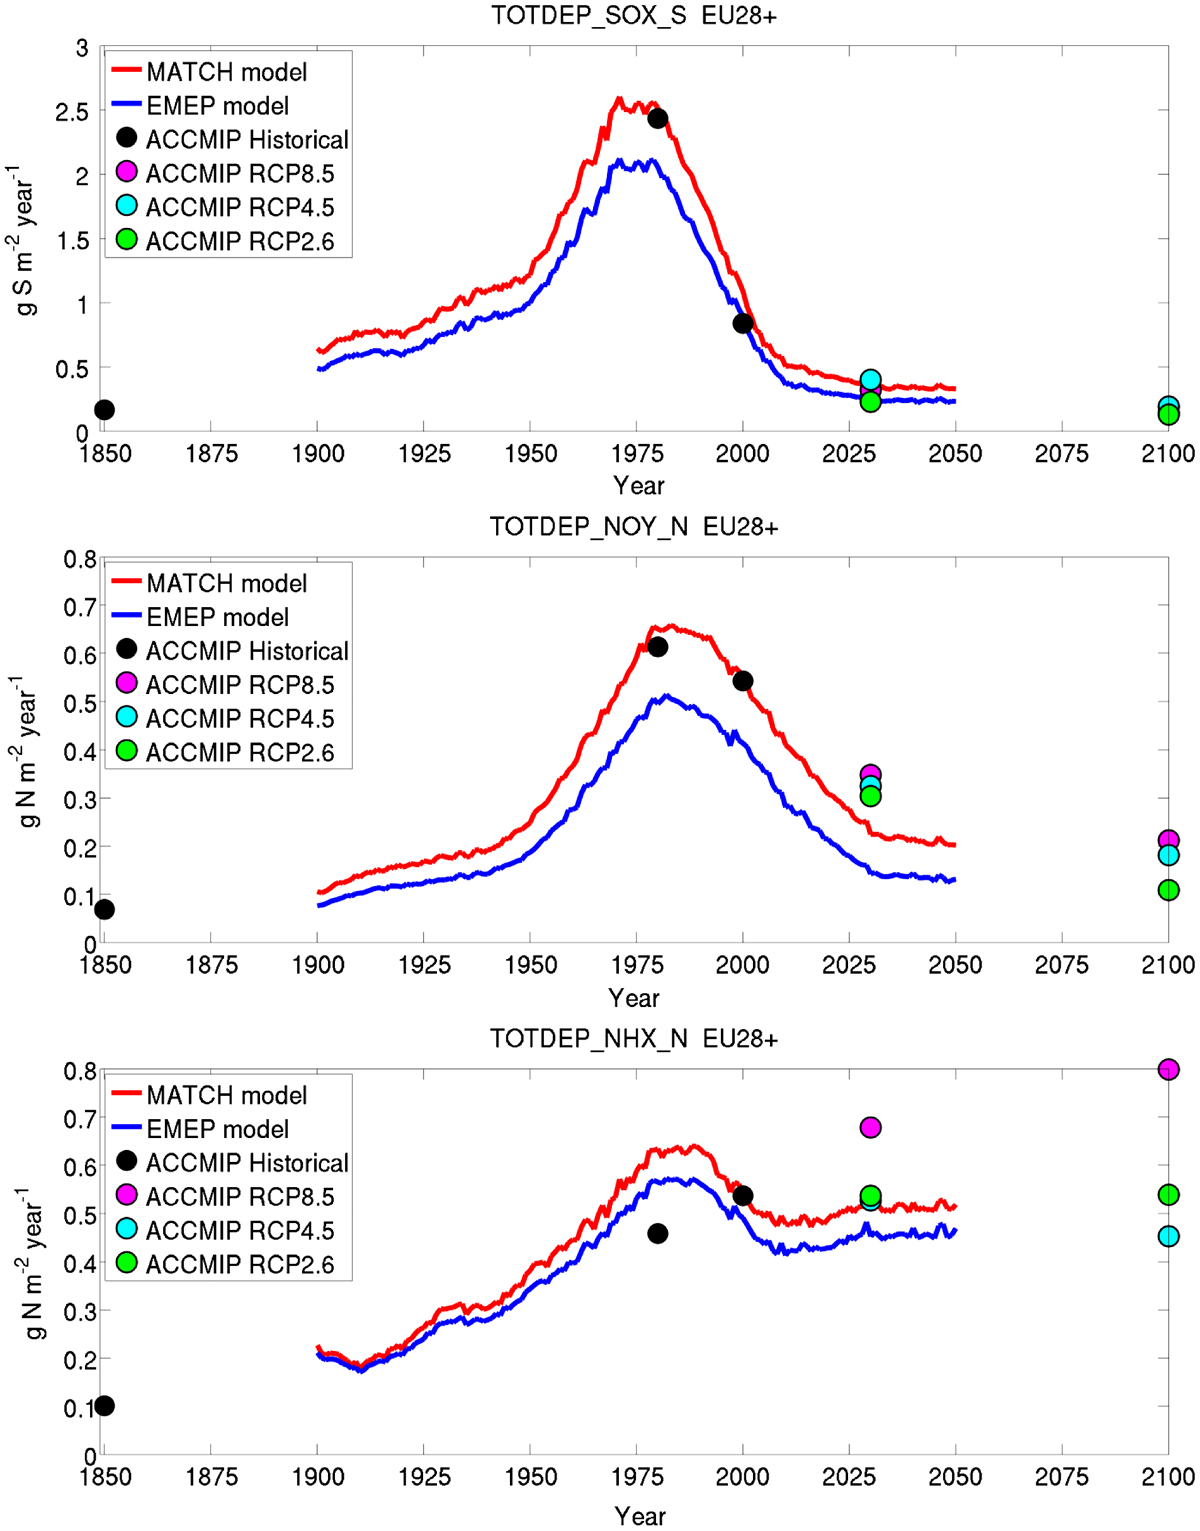
Fig. 7.
Trends of the total deposition flux of sulphur and nitrogen to EU28+ (EU28+ Norway and Switzerland; area = 5.23 × 10¹² m2). Solid lines are from the present study, filled circles are from the global model ensemble in Lamarque et al. (2013).