
Table 1.
Coating materials and conditions.



 Molecular weight/g mol−1256.42254.41284.48282.46Melting point/°C
a
61–62.5−0.169–7213–14Density/g mL−1
a
0.85 (at 25 °C)0.90 (at 20 °C)0.940.89 (at 25 °C)Appearance at 25 °C SolidLiquidSolidLiquid
Molecular weight/g mol−1256.42254.41284.48282.46Melting point/°C
a
61–62.5−0.169–7213–14Density/g mL−1
a
0.85 (at 25 °C)0.90 (at 20 °C)0.940.89 (at 25 °C)Appearance at 25 °C SolidLiquidSolidLiquid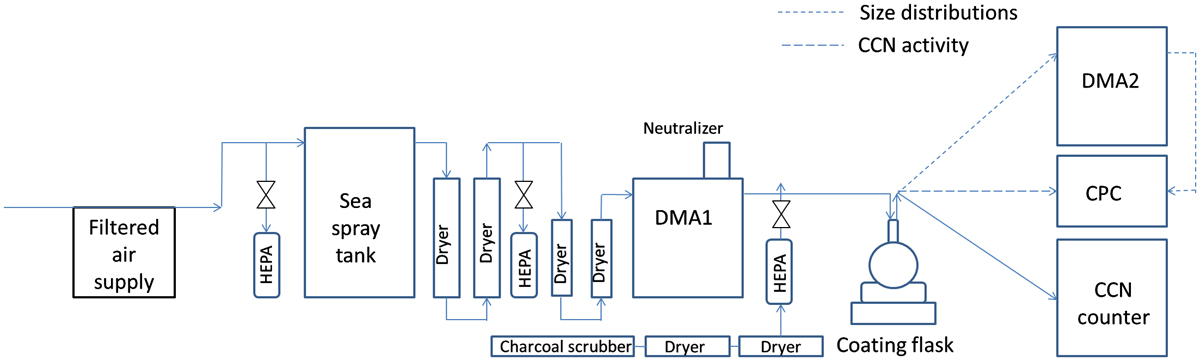
Fig. 1.
The experimental set-up employed in this study. The arrow shows the flow direction. For CCN activity measurements, the flow from the coating bottle was split between the CPC and CCN counter. For size distribution measurements, the flow was split between the CCN counter and the SMPS system (DMA2 + CPC).
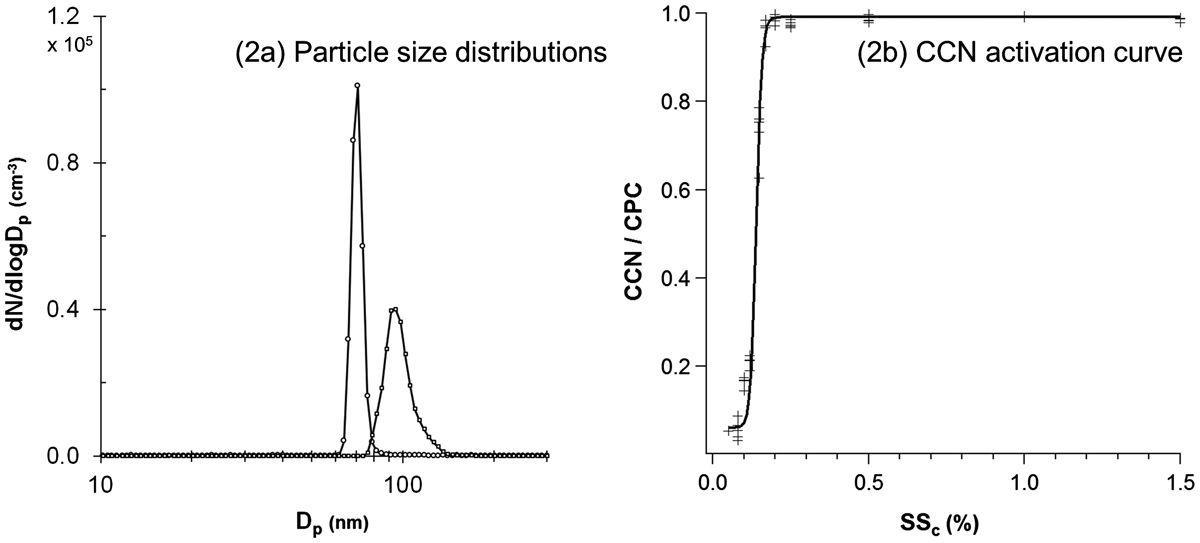
Fig. 2.
Measured size distribution (a) of Sigma sea salt (initial diameter of 70 nm) particles before and after coating with palmitoleic acid (medium coating thickness, 80 °C) and (b) the corresponding CCN activation curve.
Table 2.
Characterisation of fatty acid coating.
Table 3.
Overview of experimental data. Calculated κ was obtained for each sea salt–fatty acid mixture based on κ addition rule, using calculated κ Sigma sea salt = 0.93 and assuming κ fatty acid as zero. An uncertainty of ±0.01 was estimated for SSc based on propagation of uncertainty using the ammonium sulphate calibration curve (Harris, 2007).

Fig. 3.
TEM bright field images of (a) particle from the uncoated Sigma sea salt sample and (b) particles from coated Sigma sea salt sample (palmitic acid, 80 °C).
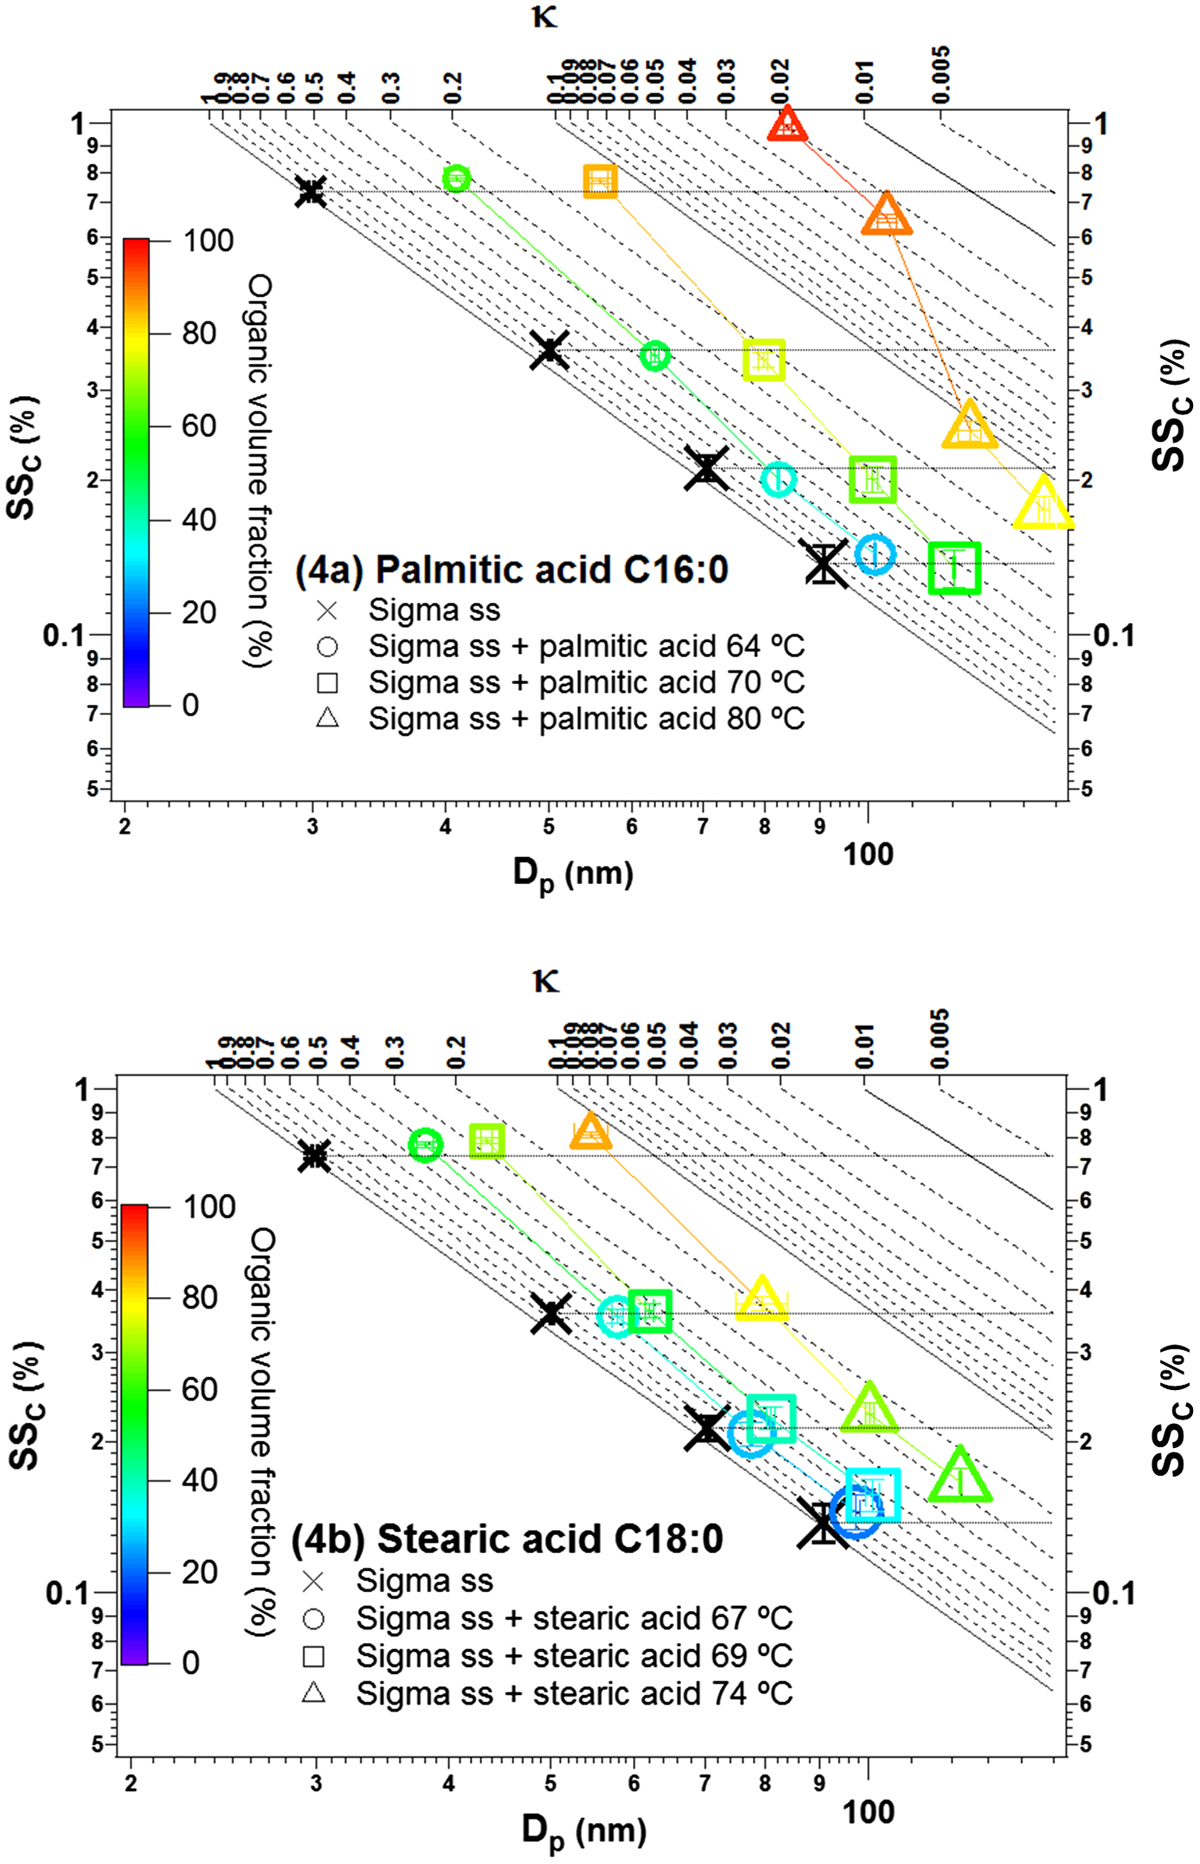
Fig. 4.
Demonstration of the coating effect on the CCN activity of the saturated fatty acids: (a) palmitic acid C16:0 and (b) stearic acid C18:0. The size of the marker represents the initial size of uncoated particles, with the smallest size (top left) representing 30 nm and the largest size (bottom) representing 90 nm. The colour bar represents the organic volume fraction. The horizontal lines from D p,initial of 30, 50, 70 and 90 nm serve to guide the eyes as SSc (%) of uncoated Sigma sea salt. The coloured lines connect particles with similar coating thickness.
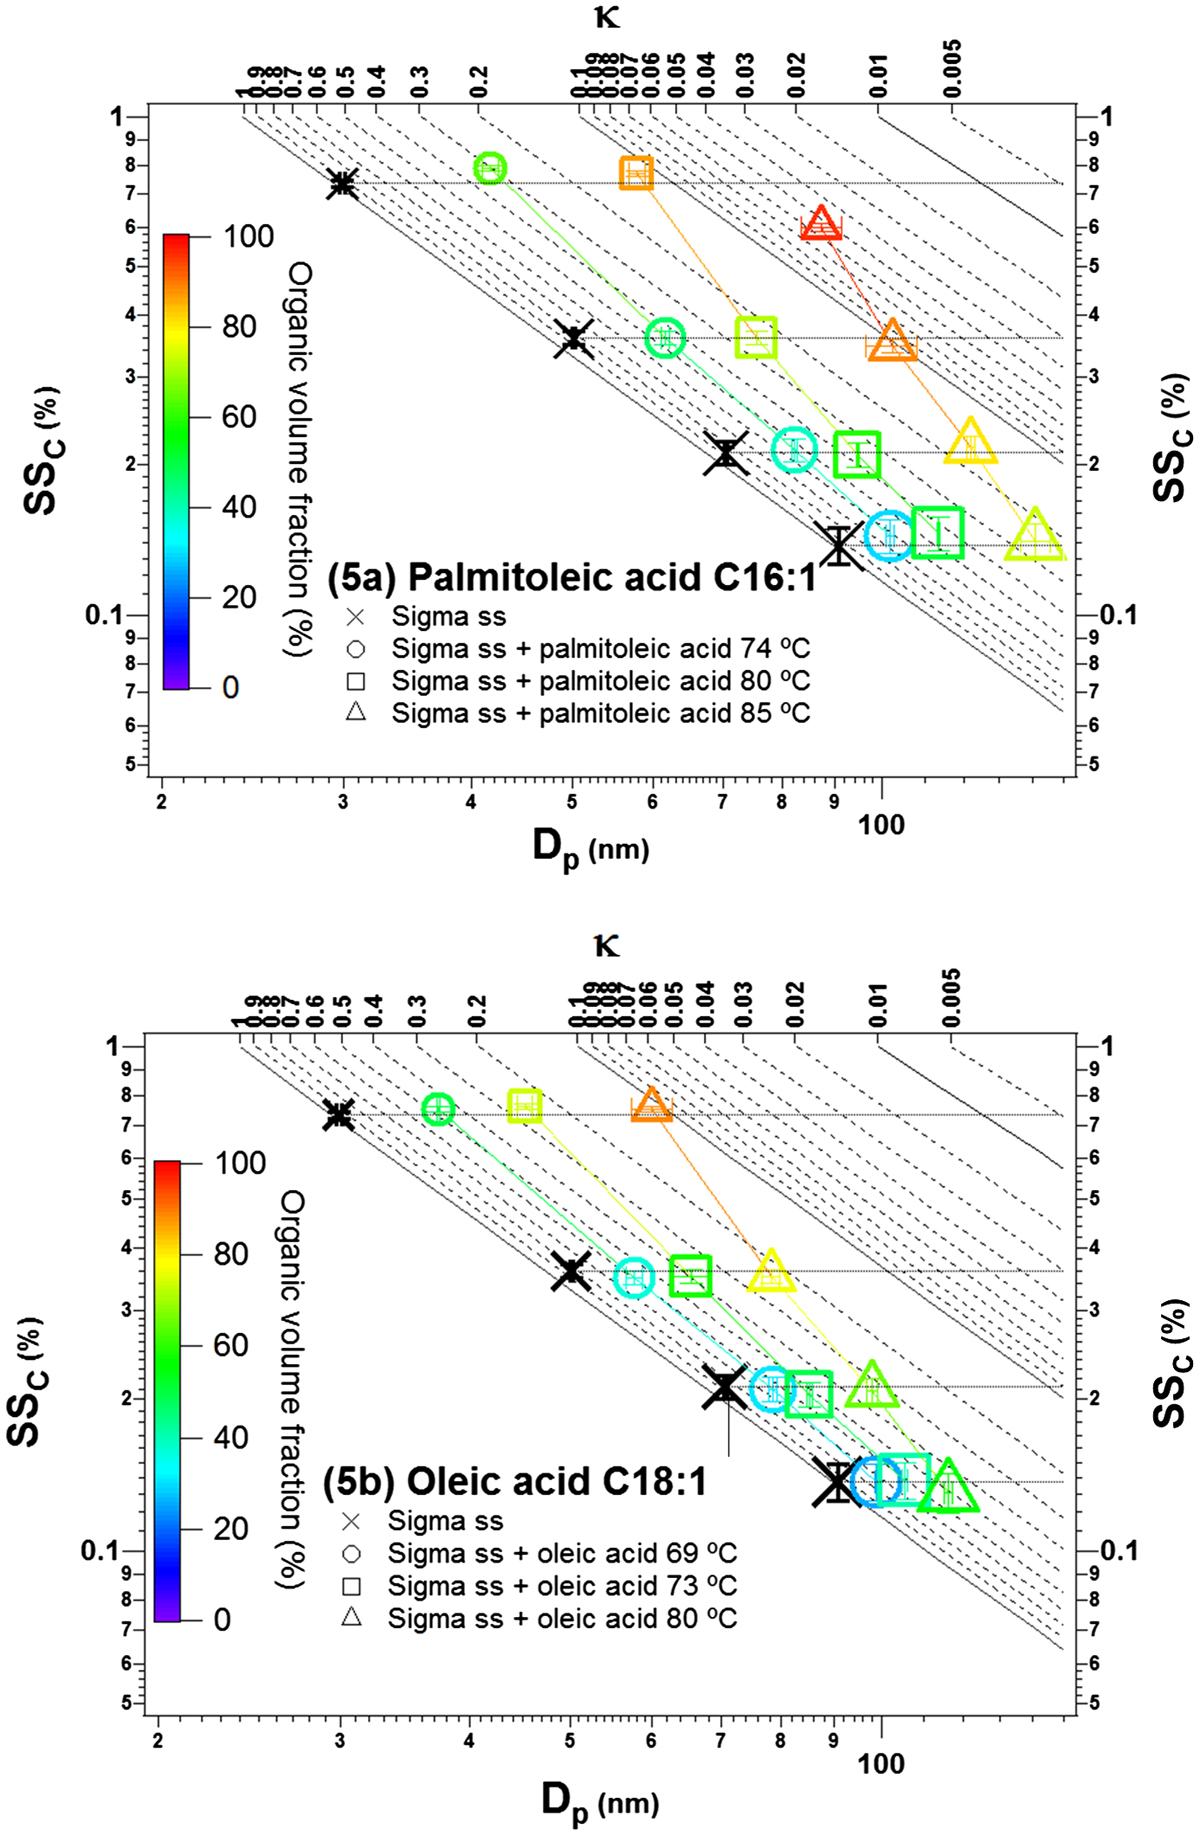
Fig. 5.
Demonstration of the coating effect on the CCN activity of the unsaturated fatty acids: (a) palmitoleic acid C16:1 and (b) oleic acid C18:1. The size of the marker represents the initial size of uncoated particles, with the smallest size (top left) representing 30 nm and the largest size (bottom) representing 90 nm. The colour bar represents the organic volume fraction. The horizontal lines from D p,initial of 30, 50, 70 and 90 nm serve to guide the eyes as SSc (%) of uncoated Sigma sea salt. The coloured lines connect particles with similar coating thickness.
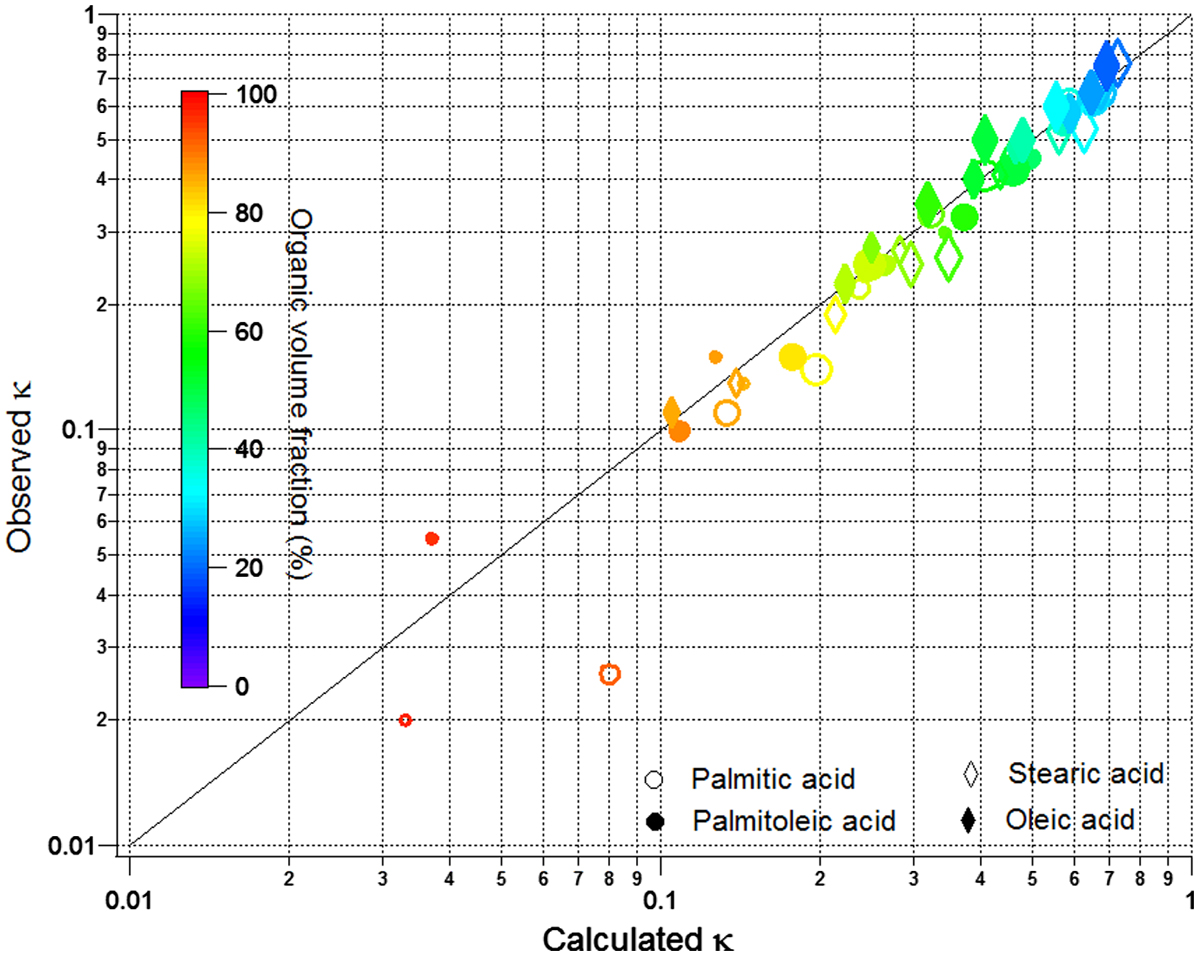
Fig. 6.
Observed versus calculated kappa (κ). For each compound at a D p,initial – coating temperature combination – calculated κ was obtained for each sea salt–fatty acid mixture based on κ addition rule, using calculated κ Sigma sea salt = 0.93 and assuming κ fatty acid as zero. The colour bar represents the organic volume fraction. The size of the marker represents D p, initial.
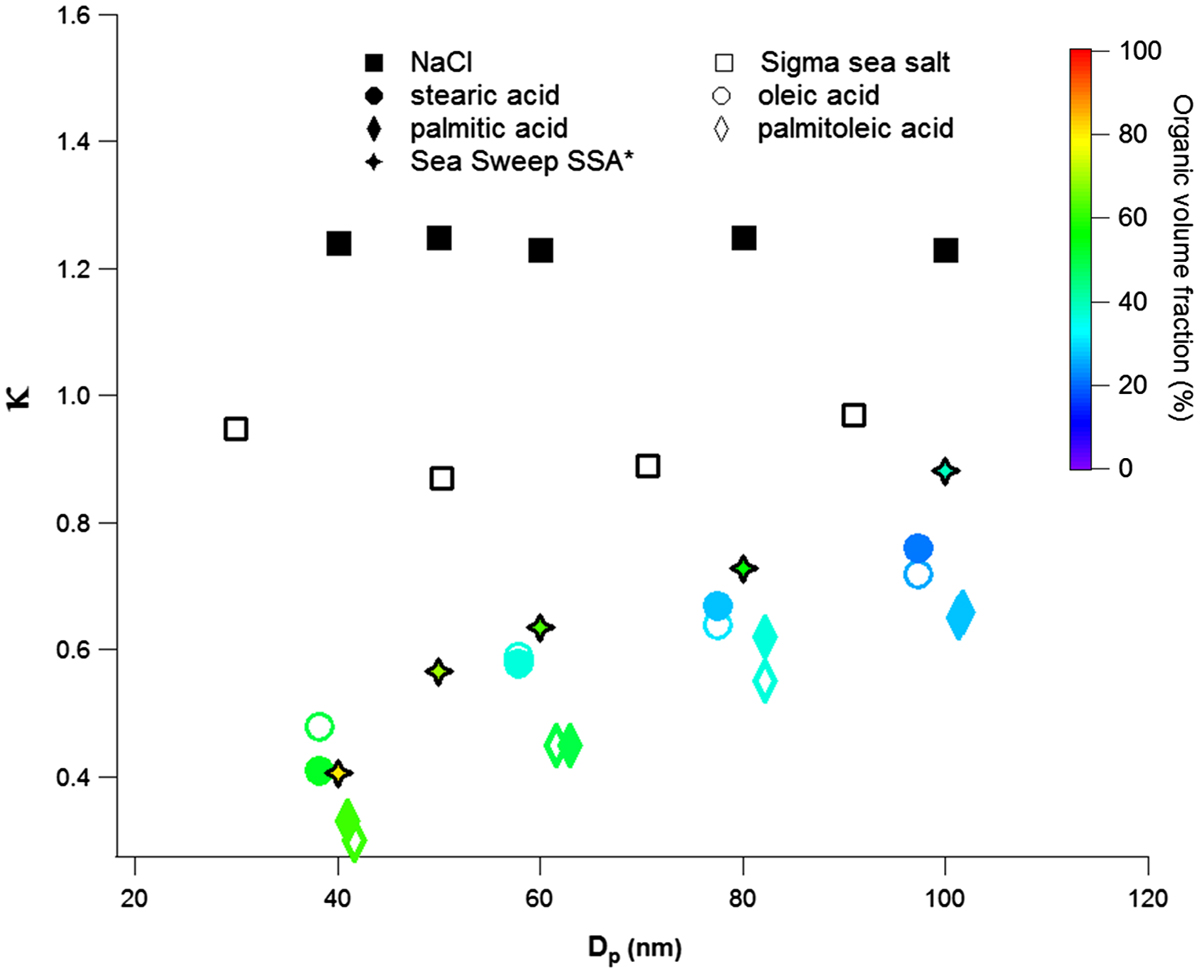
Fig. 7.
Comparison of the results from this study for thin coatings of palmitic acid (64 °C), palmitoleic acid (74 °C), stearic acid (67 °C) and oleic acid (69 °C) with Sea Sweep SSA (Quinn et al., 2014). The colour bar represents the organic volume fraction. * means that the data were from Quinn et al. (2014).