Have a personal or library account? Click to login
Source appointment of nitrogen in PM2.5 based on bulk δ15N signatures and a Bayesian isotope mixing model Cover

Source appointment of nitrogen in PM2.5 based on bulk δ15N signatures and a Bayesian isotope mixing model

Open Access
|Jan 2017

Figures & Tables

Table 1.

δ15N values (mean ± SD) reported for major NOx and NH3 emissions in the atmosphere.
SourcesN speciesδ15N/‰ReferencesCoal combustionNO2+19.8 ± 5.2Felix et al. (2012)Coal combustionNH3−8.9 ± 4.1Freyer (1991), Felix et al. (2013)Vehicle exhaustsNO2−2.5 ± 1.5Walters et al. (2015)Vehicle exhaustsNH3−3.4 ± 1.7Felix et al. (2013)Biomass burningNO2+12.5 ± 3.1Hastings et al. (2009), Felix et al. (2012)Biomass burningNH3+12.0Kawashima and Kurahashi (2011)Microbial N cycleNO2−30.3 ± 9.4Li and Wang (2008), Felix et al. (2013), Felix and Elliott (2014)Animal wastesNH3−19.0 ± 14.1Freyer (1978), Heaton (1987), Felix et al. (2013, 2014)Fertilizer applicationNH3−26.8 ± 15.4Felix et al. (2013, 2014)
Fig. 1.

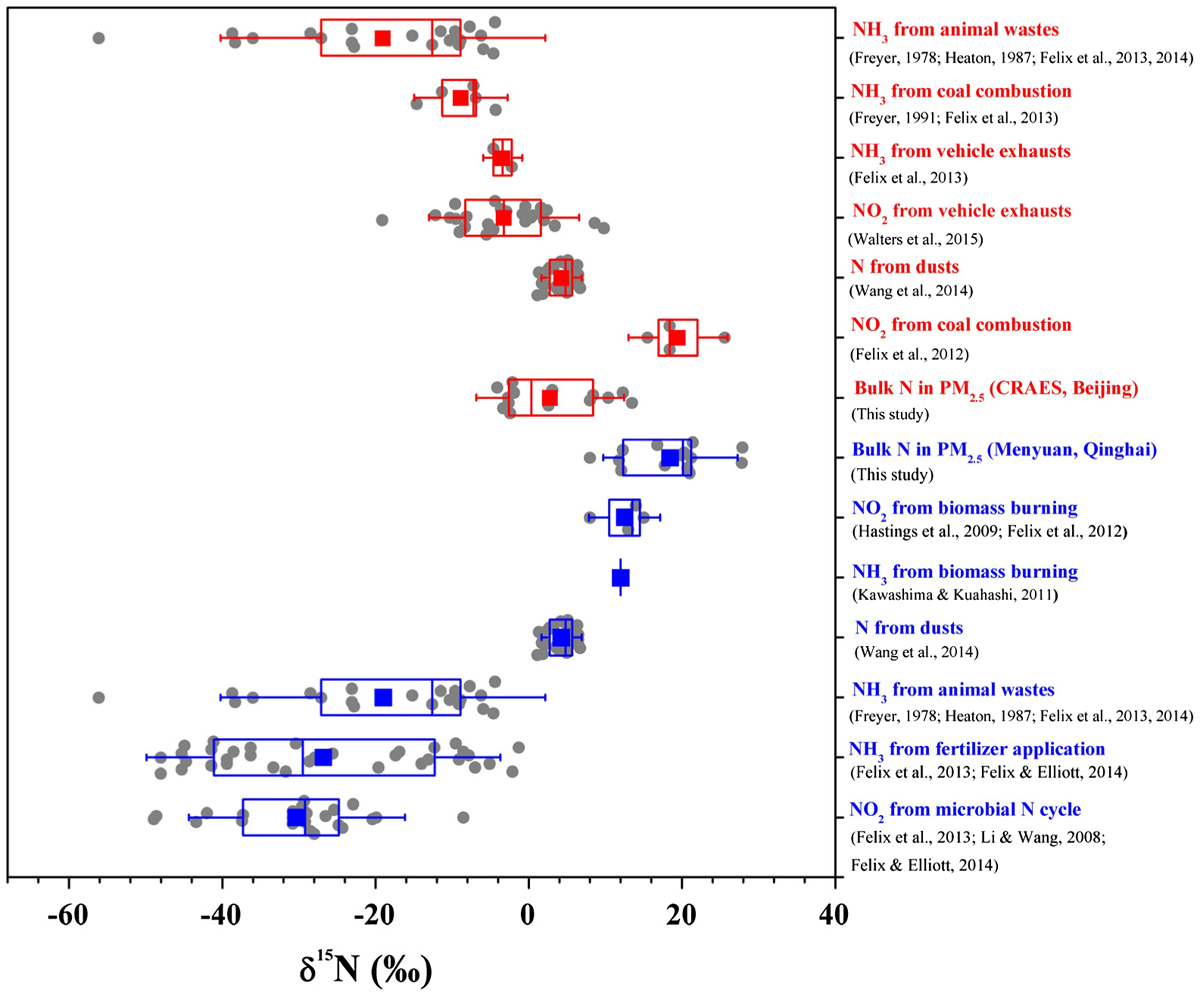
δ15N values of bulk N in PM2.5 and dominant N sources assigned for PM2.5 at the Beijing CRAES site (in red) and the Menyuan site (in blue). The box encompasses the 25th–75th percentiles, whiskers are SD values. The line and square in each box mark the median and arithmetic mean values, respectively. The number of jittered replicate δ15N data (dots around the boxes) is 1–34. Mean and SD values of source δ15N data were used in the SIAR model. δ15N values of N from dust were assumed as those of surface soils (Wang et al., 2014) according to the air mass backward trajectories (Fig. 2).

Table 2.

Mass concentrations of inorganic N (NH4+–N plus NO3-–N), SO42-–S, bulk N, molecular ratios of NH4+ to NO3-, NH4+ to SO42-, NH4+ to (NO3-+SO42-) in PM2.5 at Beijing (CRAES site) and a background site (Menyuan, Qinghai province) of China. Data of ambient NH3 and SO2 at Beijing site were cited from Carmichael et al. (2003), He et al. (2014), Wei et al. (2015). Data of NH3 and SO2 were cited from the background site of Waliguan in Qinghai Province (Carmichael et al., 2003).
Beijing (CRAES site)Menyuan, QinghaiPM2.5 (μg/m3)264.3 ± 118.0 (43.0–433.6)13.0 ± 3.2 (7.0–17.8)NH4+-N (%)7.4 ± 3.4 (3.5–12.9)5.9 ± 1.8 (3.1–9.4)NO3--N (%)5.0 ± 3.0 (0.7–9.4)1.9 ± 0.4 (1.2–2.6)SO42--S (%)5.5 ± 2.4 (2.4–8.3)0.2 ± 0.0 (0.2–0.3)Inorganic N (%)12.4 ± 4.6 (5.1–22.2)7.8 ± 1.7 (5.7–11.3)Bulk N (%)16.7 ± 4.6 (8.2 –29.3)8.6 ± 5.6 (1.4–18.7)n-NH4+/n-NO3-2.5 ± 2.5 (0.5–9.0)3.3 ± 1.2 (1.2–4.9)n-NH4+/n-SO42-3.5 ± 1.6 (1.2–6.3)56.3 ± 14.3 (42.1–89.5)n-NH4+/(n-NO3- + n-SO42-)1.1 ± 0.6 (0.4–2.9)3.1 ± 1.1 (1.2–4.7)n-NH4+/(n-NO3- + 2*n-SO42-)0.8 ± 0.4 (0.3–1.7)2.9 ± 1.0 (1.1–4.5)NH3 (μg/m3)14.14.8NO2 (μg/m3)89.2 ± 21.2 (57.0–122.0)4.3 ± 1.3 (2.6–6.7)SO2 (μg/m3)22.90.3n-NH3/n-NO20.43.0n-NH3/n-SO22.360.2n-NH3/(n-NO2 + n-SO2)0.42.9n-NH3/(n-NO2 + 2*n-SO2)0.32.7
Fig. 2.

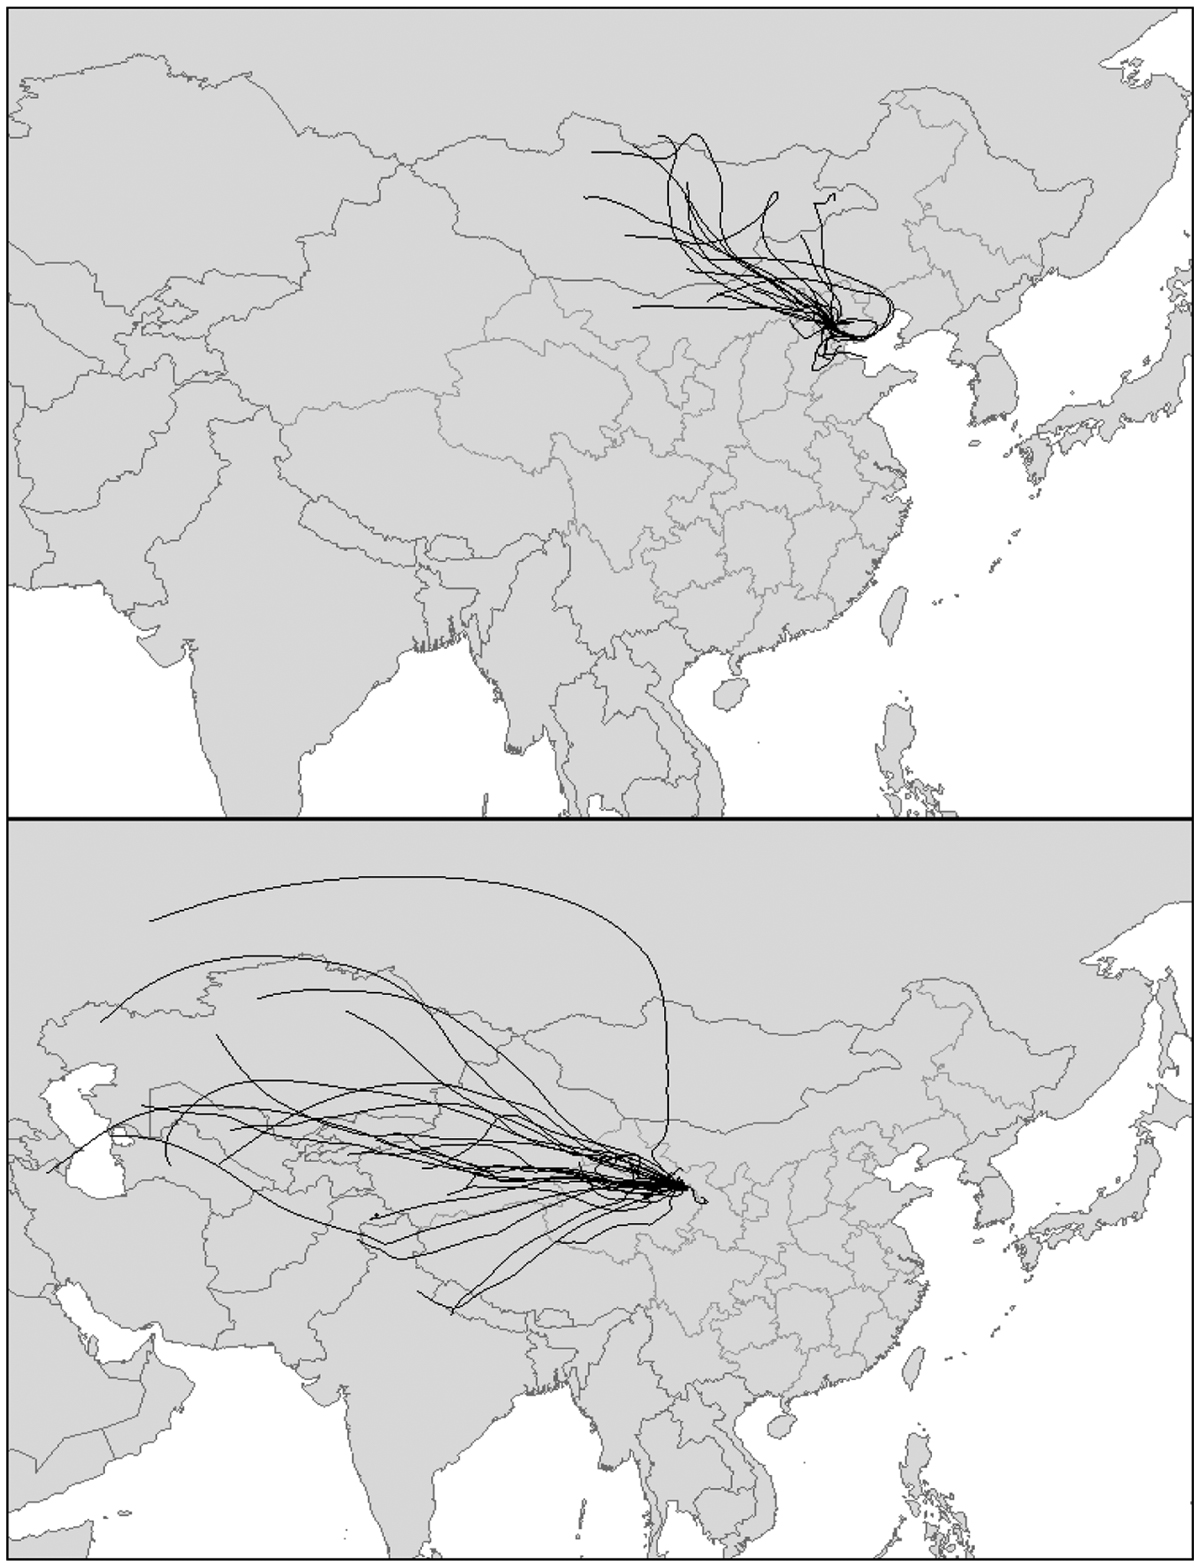
Seventy-two-h air mass backward trajectories for all sampling dates at the Beijing CRAES site and the Menyuan site, based on NOAA HYSPLIT model back trajectories.
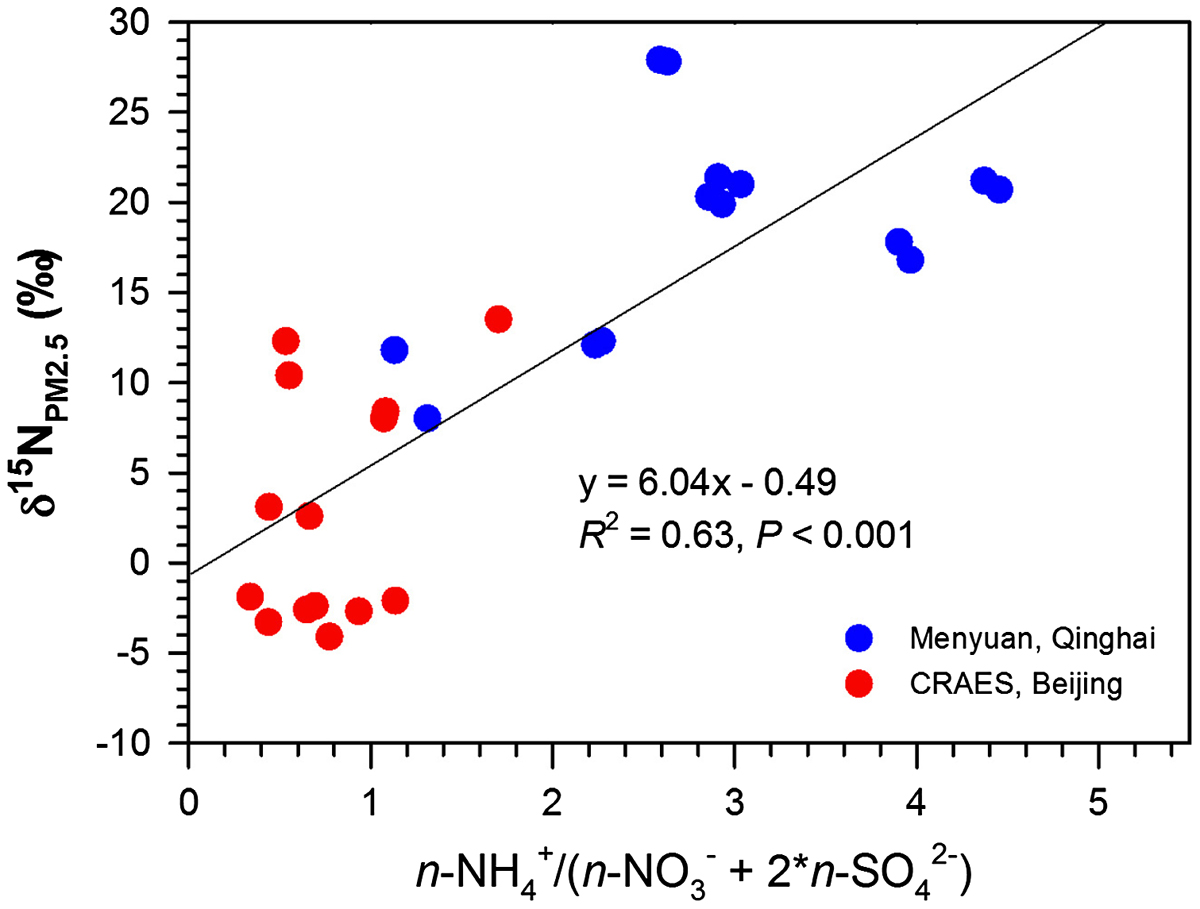
Fig. 3.

Correlations between δ15N values of PM2.5 and molecular ratios of NH4+ to (NO3-+2SO42-) (expressed as n-NH4+/n-(NO3-+2NO3-+2SO42-)) in PM2.5 at Beijing CRAES site and Menyuan site. The regression line was drawn on data of both sites.

Table 3.

Fractional contributions (F, %) of dominant N precursors and sources to bulk N in PM2.5 at Beijing (CRAES site) and a background site (Menyuan, Qinghai province) of China. Values (mean ± SD; n = 104) were calculated based on the output of the SIAR model.
Beijing (CRAES site)Menyuan, QinghaiFNH340 ± 1064 ± 11FNO241 ± 1122 ± 10FNH3/FNO21.1 ± 6.34.4 ± 5.6Ffossil71 ± 12 Fnon-fossil29 ± 12Fcoal combustion39 ± 10 Fvehicle exhausts32 ± 12FNH3volatilization34 ± 12Fbiomass burning46 ± 10
Fig. 4.

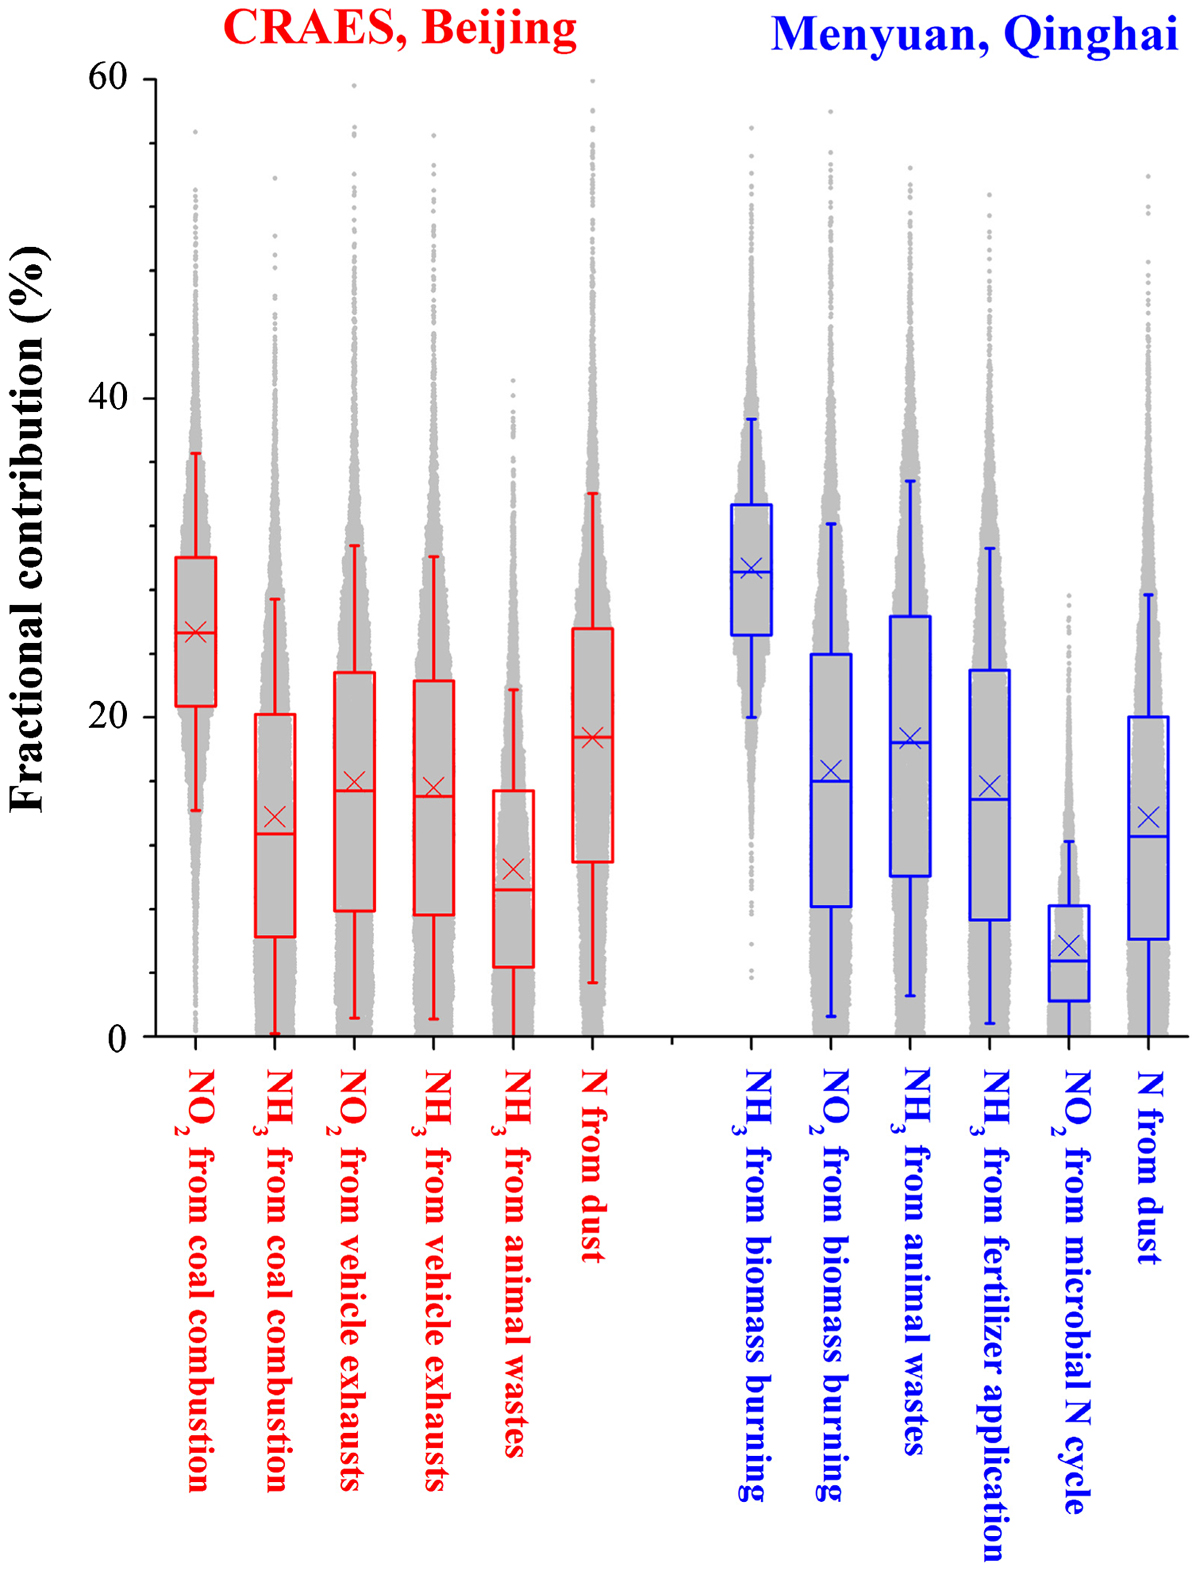
Fractional contributions of dominant N sources to bulk N in PM2.5 at the Beijing CRAES site and the Menyuan site. Dots around the boxes (n = 104) show the percentages estimated by the SIAR model. The box encompasses the 25th–75th percentiles, whiskers are the 5th and 95th percentiles. The line and cross in each box mark the median and arithmetic mean values, respectively.

Language: English
Page range: 1299672 - 1299672
Submitted on: Jan 20, 2017
Accepted on: Feb 20, 2017
Published on: Jan 1, 2017
Published by: Stockholm University Press
In partnership with: Paradigm Publishing Services

© 2017 Yan-Li Wang, Xue-Yan Liu, Wei Song, Wen Yang, Bin Han, Xiao-Yan Dou, Xu-Dong Zhao, Zhao-Liang Song, Cong-Qiang Liu, Zhi-Peng Bai, published by Stockholm University Press
This work is licensed under the Creative Commons Attribution 4.0 License.