
Fig. 1.
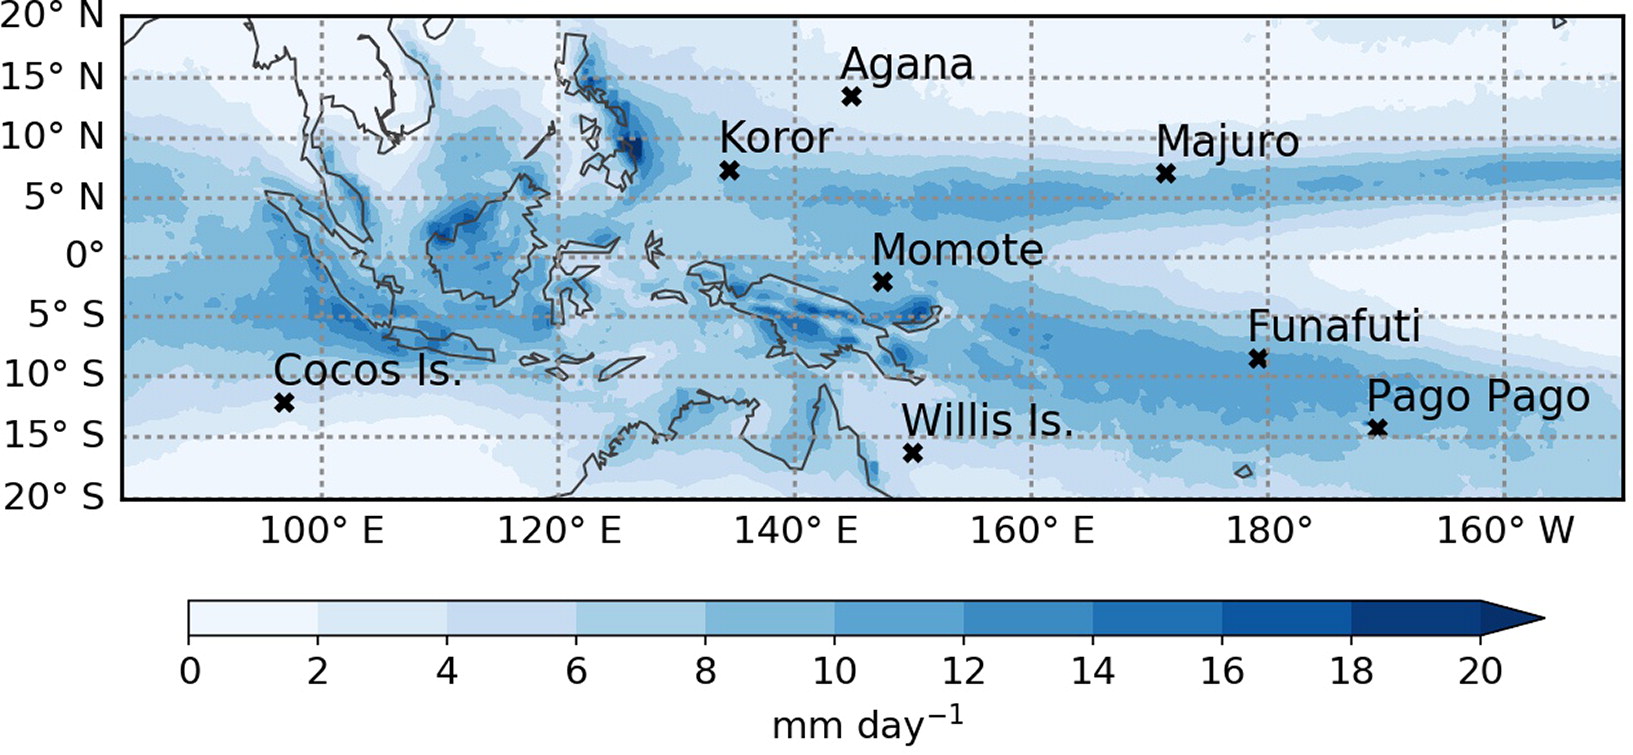
Locations of the IGRA sounding stations. The coloured contours show the mean precipitation (in mm day–1) during November-February 1998-2014, calculated using the Tropical Rainfall Measuring Mission (TRMM) 3B42 data.
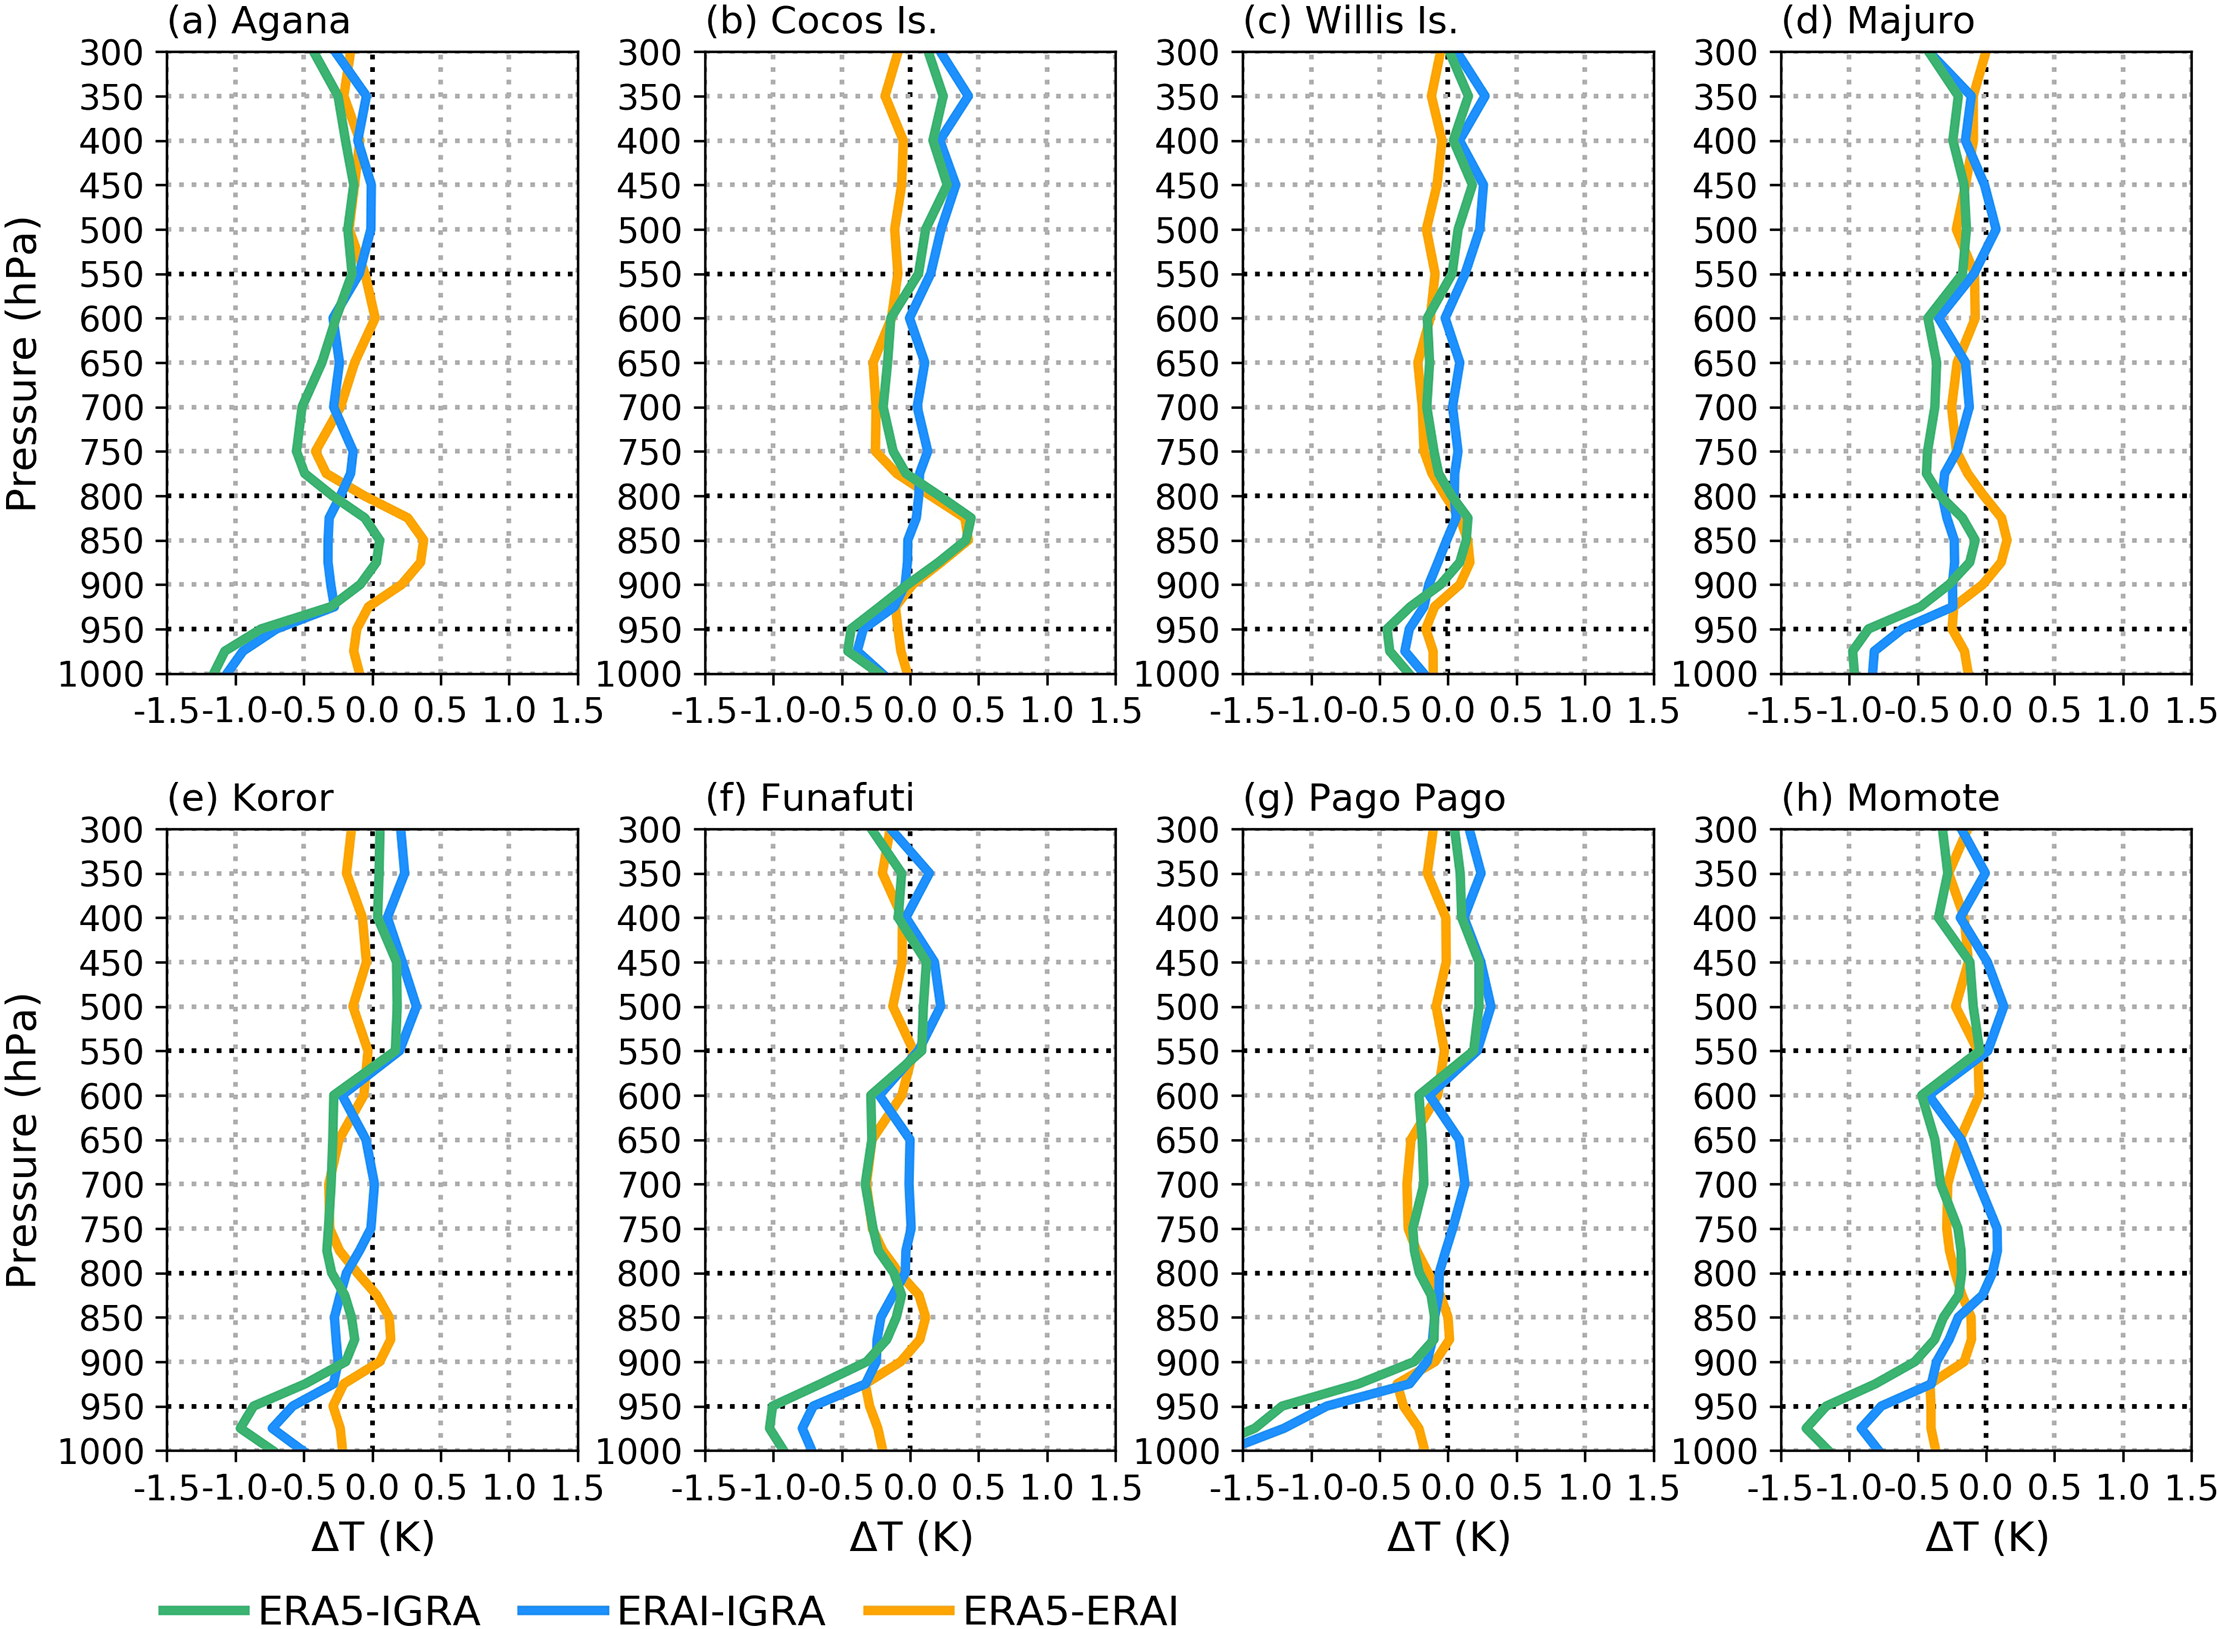
Fig. 2.
Vertical profiles of the mean temperature difference (in units of Kelvin) between ERA5 and IGRA (green), ERAI and IGRA (blue) and ERA5 and ERAI (orange) in (a) Agana, (b) Cocos Island, (c) Willis Island, (d) Majuro, (e) Koror, (f) Funafuti, (g) Pago Pago and (h) Momote. The grid lines corresponding to some of the layers discussed in the text are highlighted in black. The stations are in order based on the climatological mean 500-700 hPa RH, from the driest (Agana) to the moistest (Momote) station, as in Virman et al. (2018).
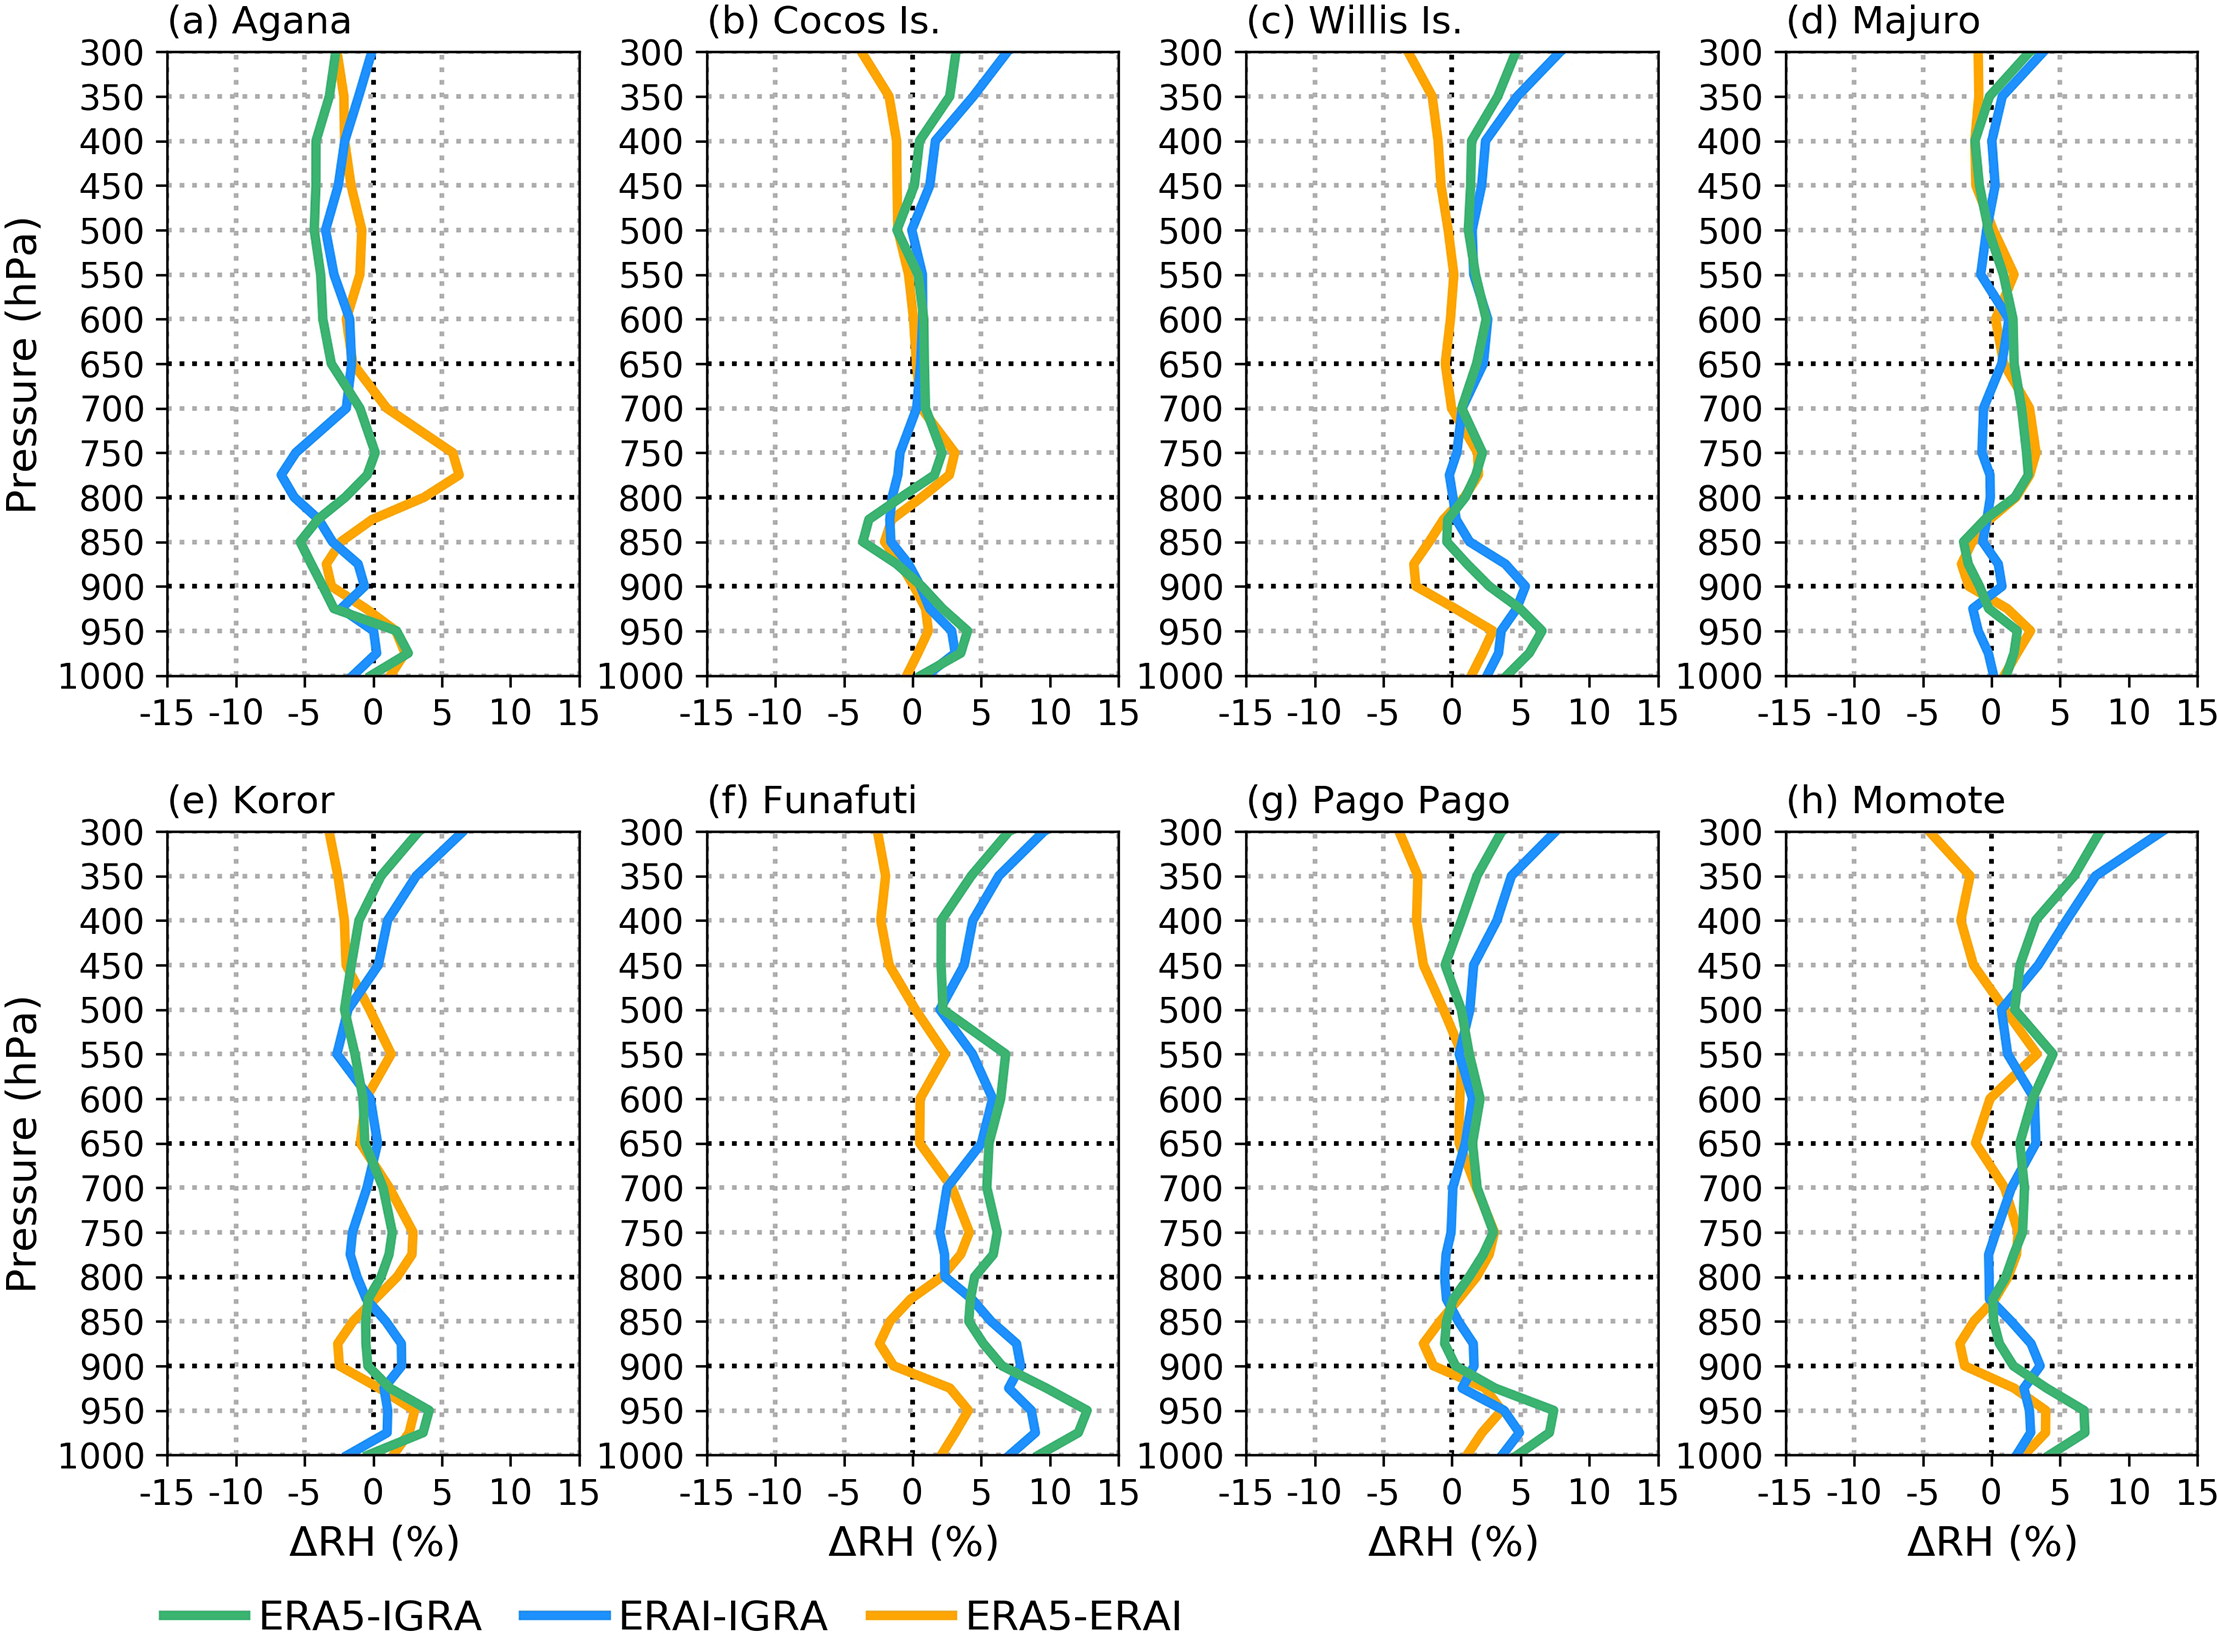
Fig. 3.
As in Fig. 2, but for the mean relative humidity (RH) difference (in units of %). Please note that the grid lines differ from those in Fig. 2.
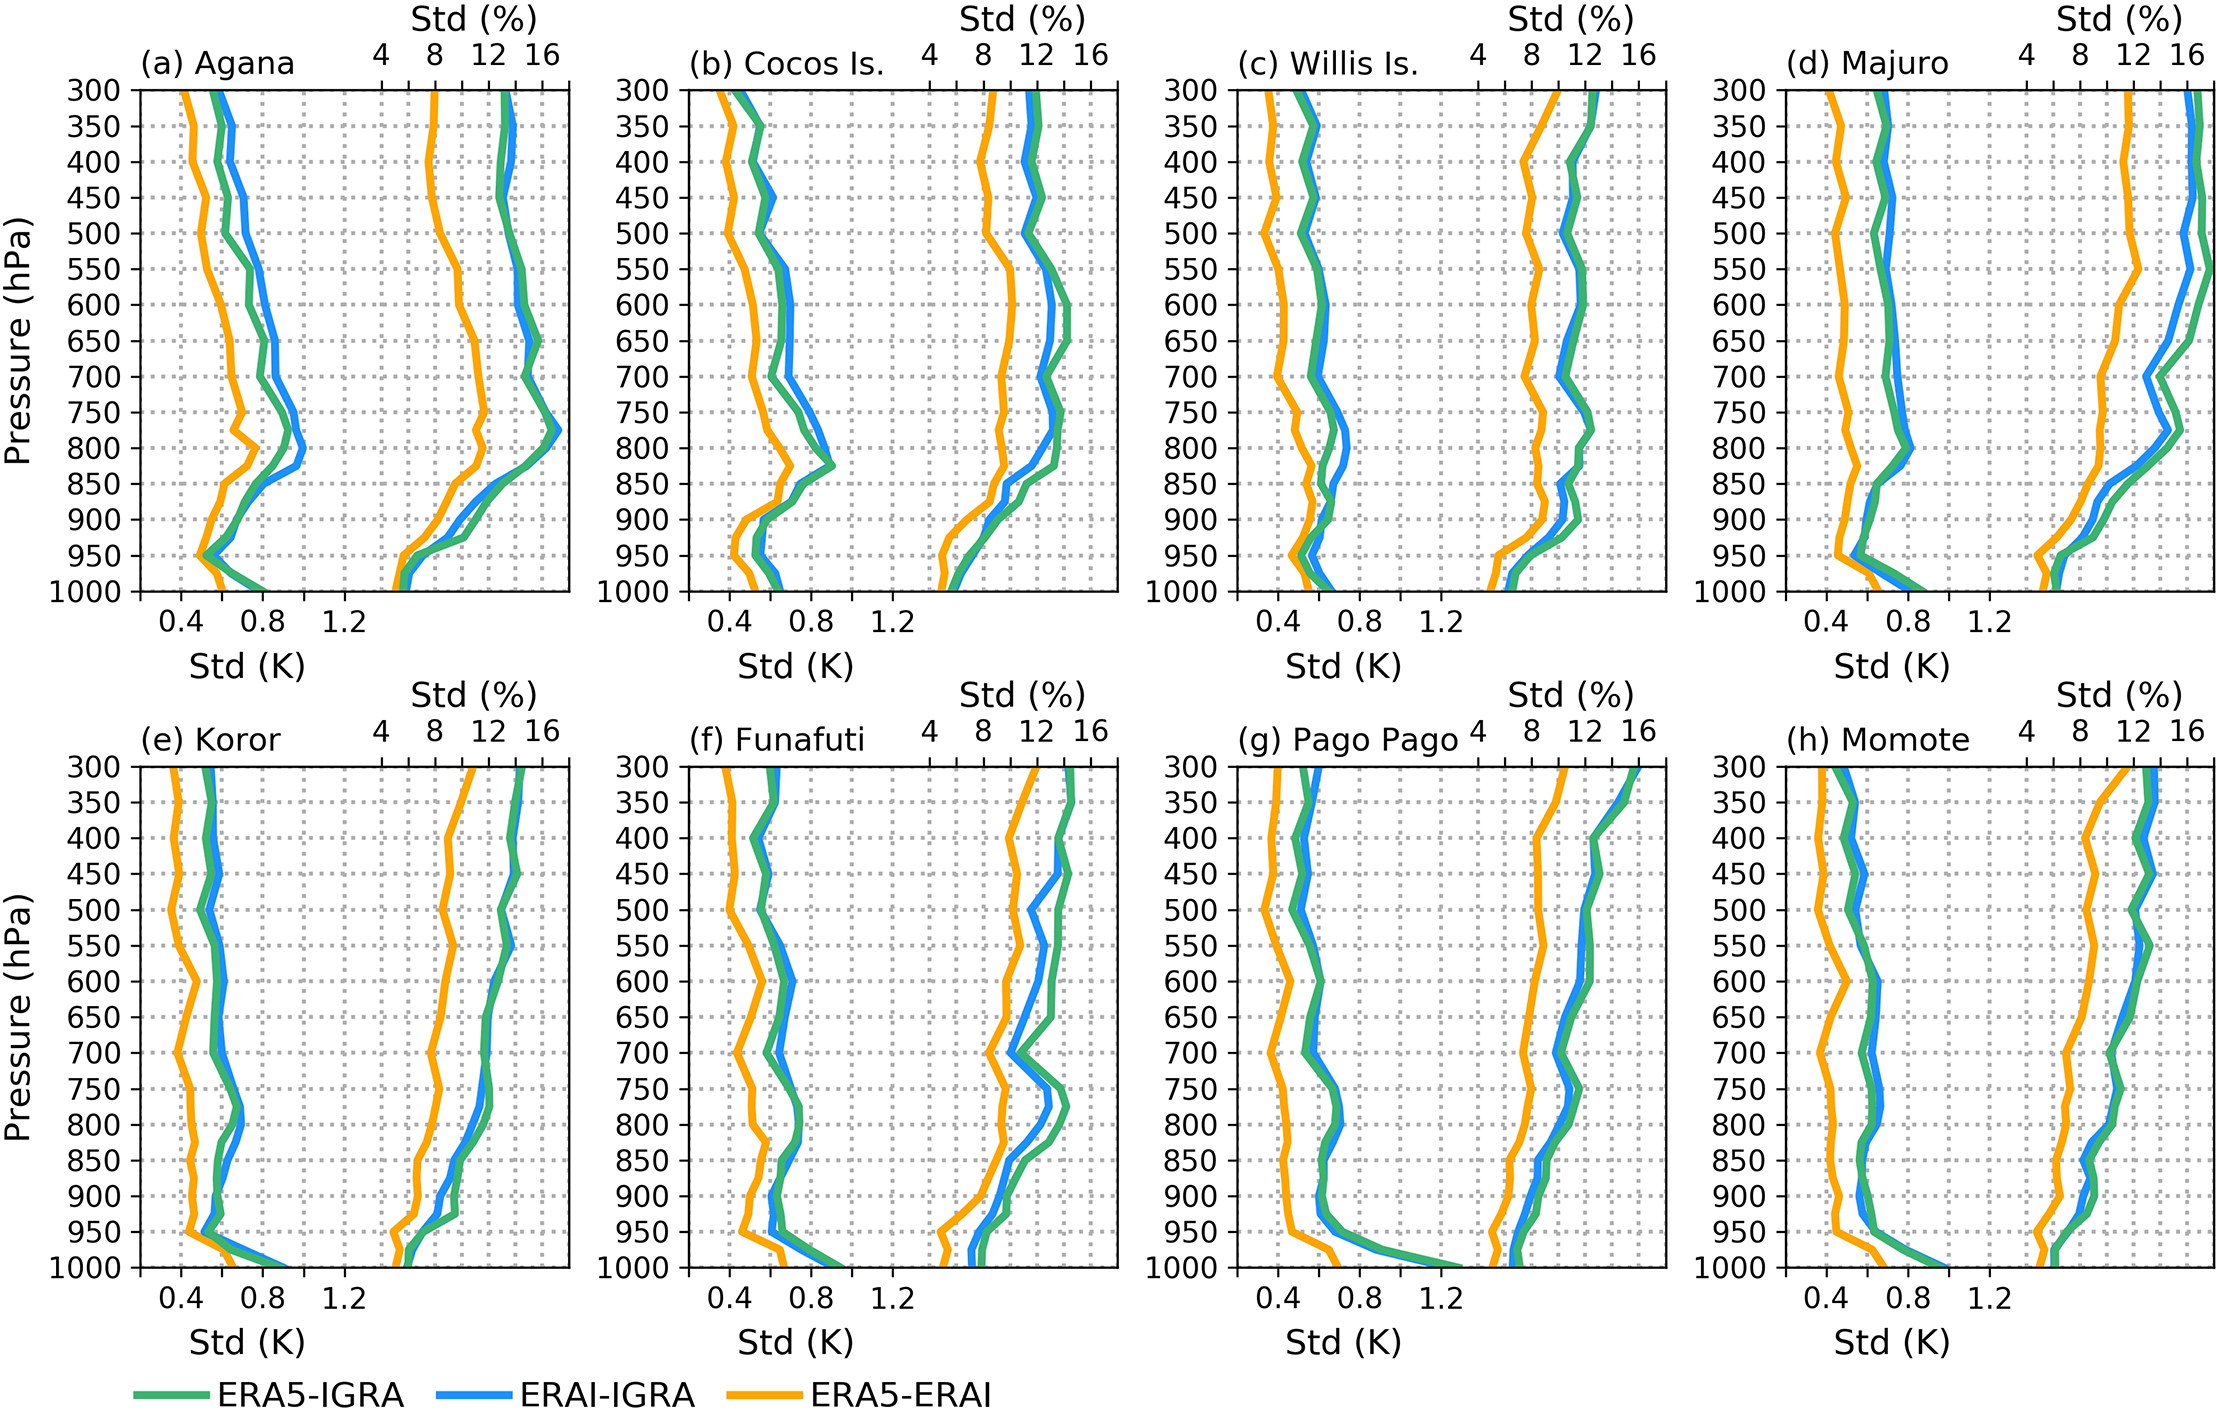
Fig. 4.
Vertical profiles of standard deviation of the temperature (left-hand side curves) and RH (right-hand side curves) difference (in units of Kelvin and %) between ERA5 and IGRA (green), ERAI and IGRA (blue) and ERA5 and ERAI (orange) in (a) Agana, (b) Cocos Island, (c) Willis Island, (d) Majuro, (e) Koror, (f) Funafuti, (g) Pago Pago and (h) Momote. The standard deviation was calculated so that, first, the differences at each level were calculated for each day and, second, a standard deviation was calculated from the individual differences.