
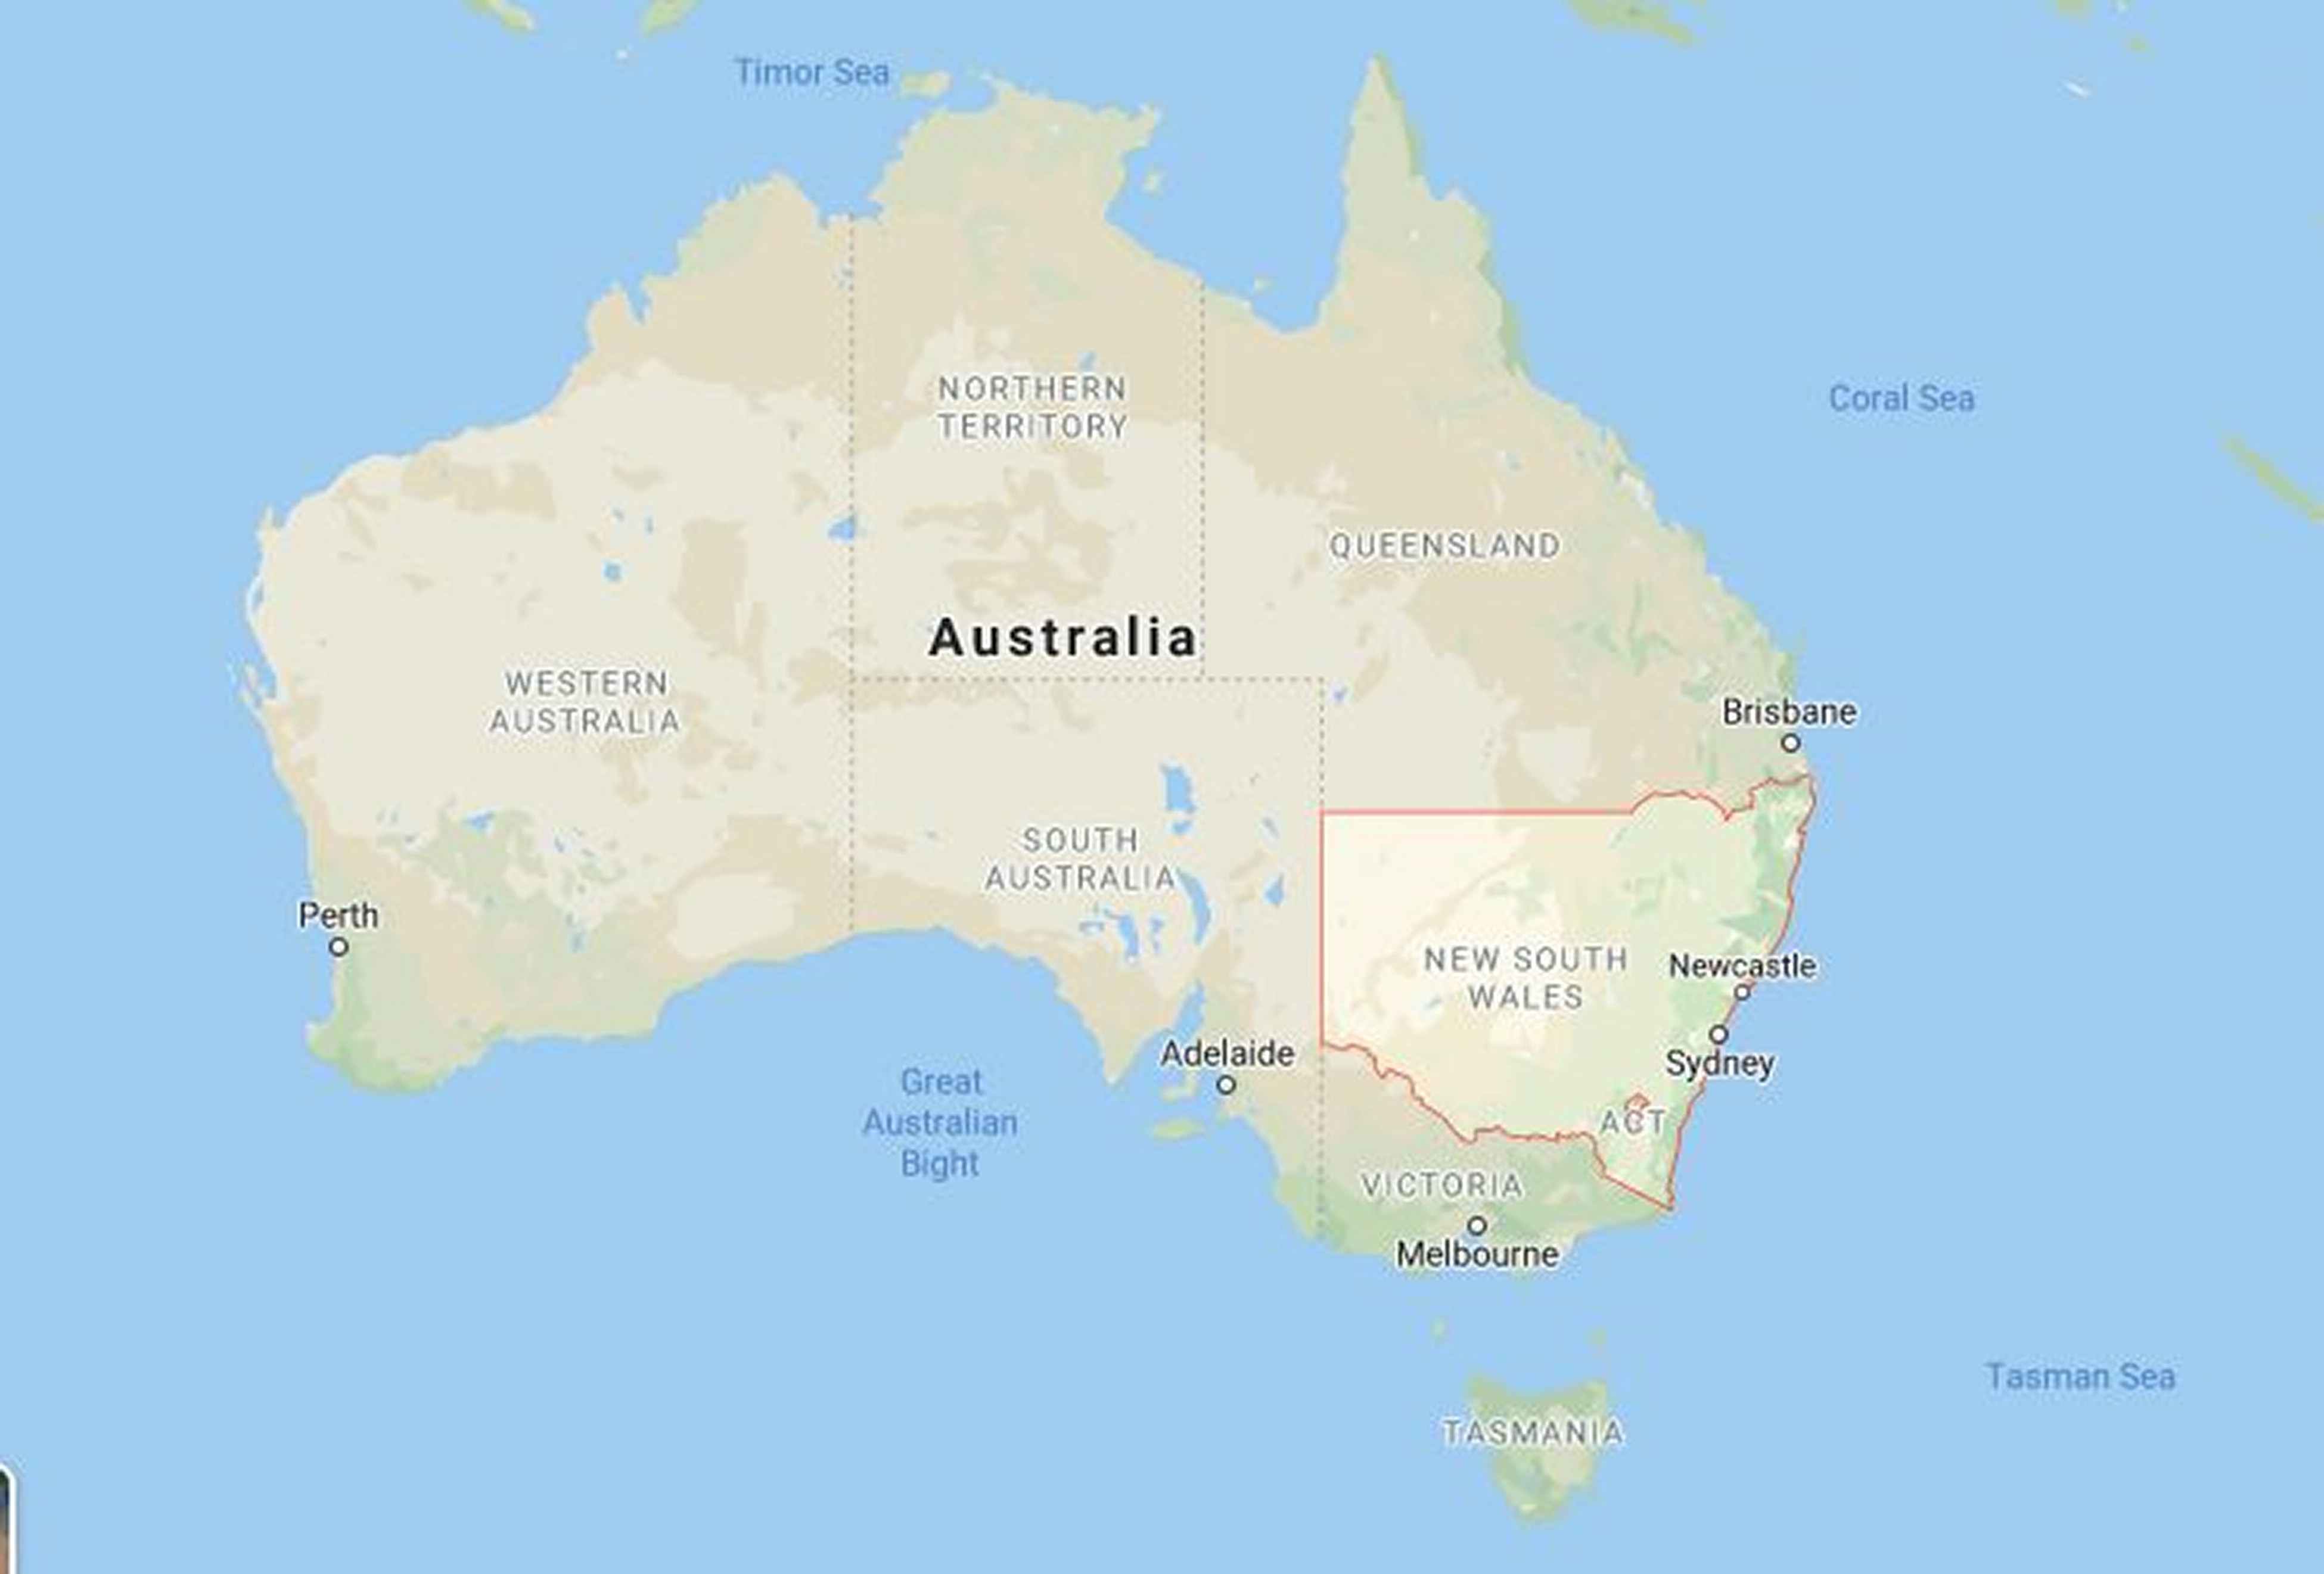
Fig. 1.
Map of New South Wales (NSW), Australia, surrounded by Queensland, Victoria, South Australia, Coral, and Tasman seas.
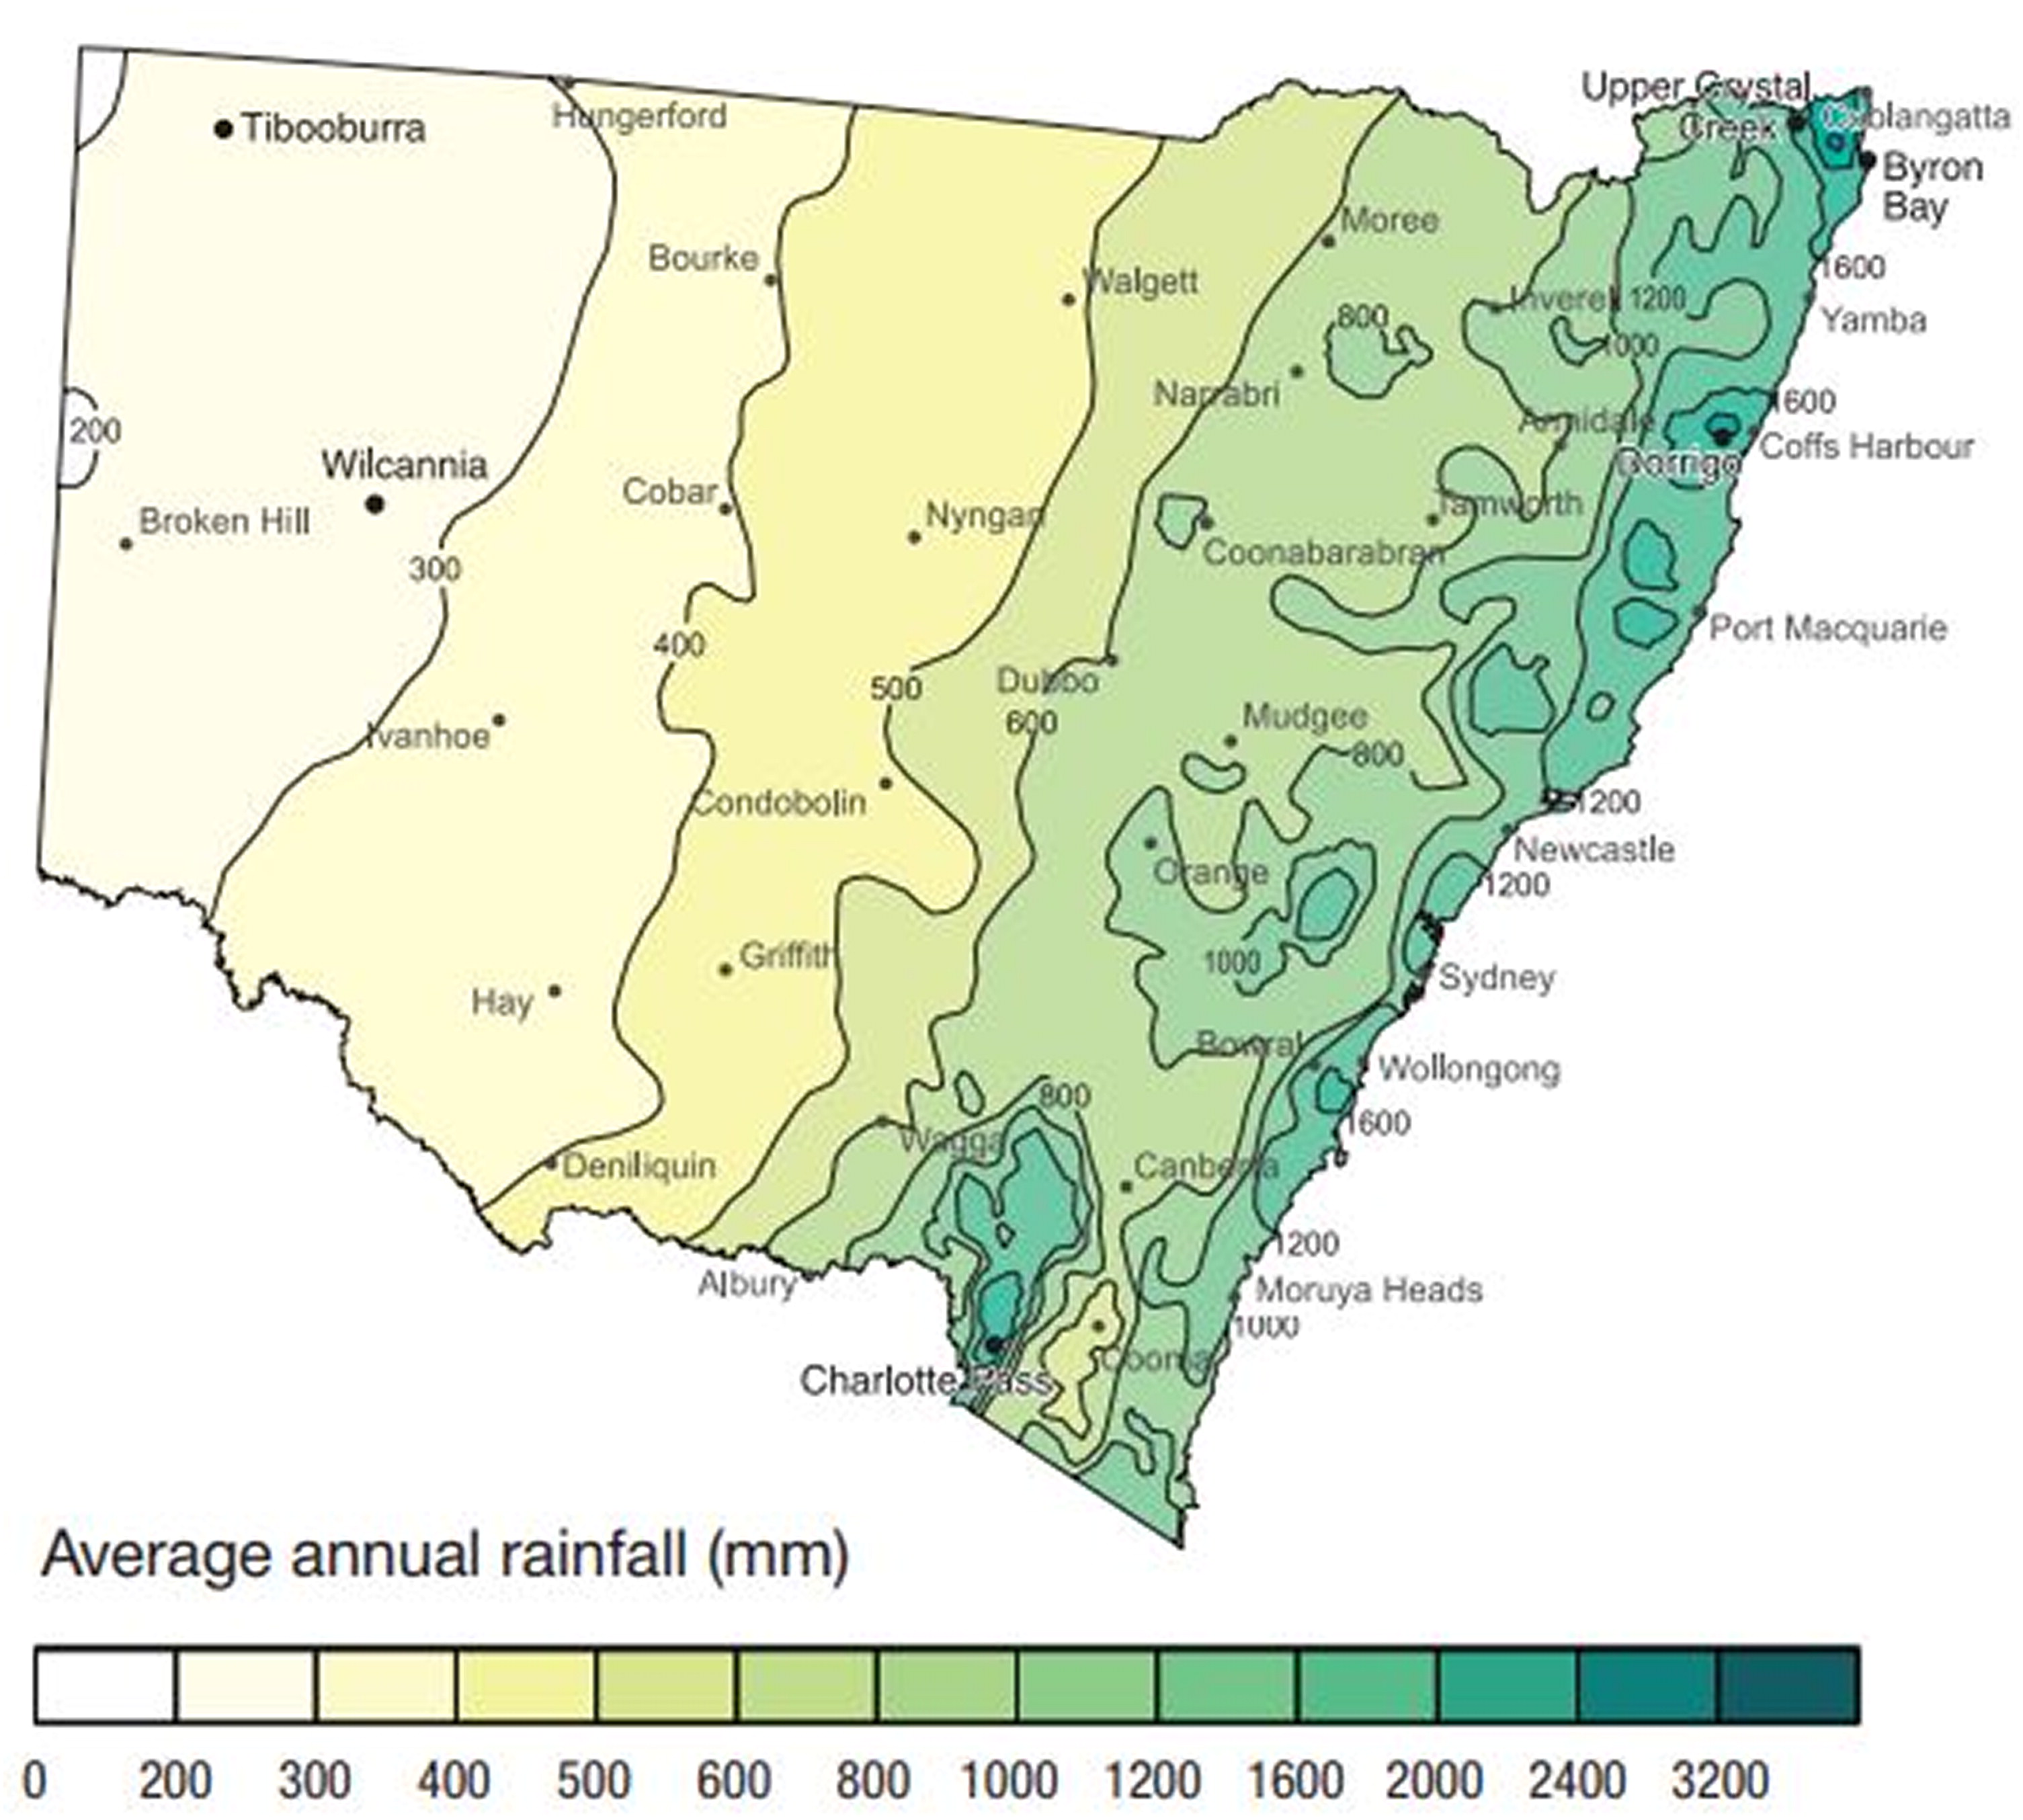
Fig. 2.
Four distinct climate zones: the coastal belt, the ranges and tablelands of the Great Dividing Range, the Western slopes and plains, and the arid plains of New South Wales, Australia.
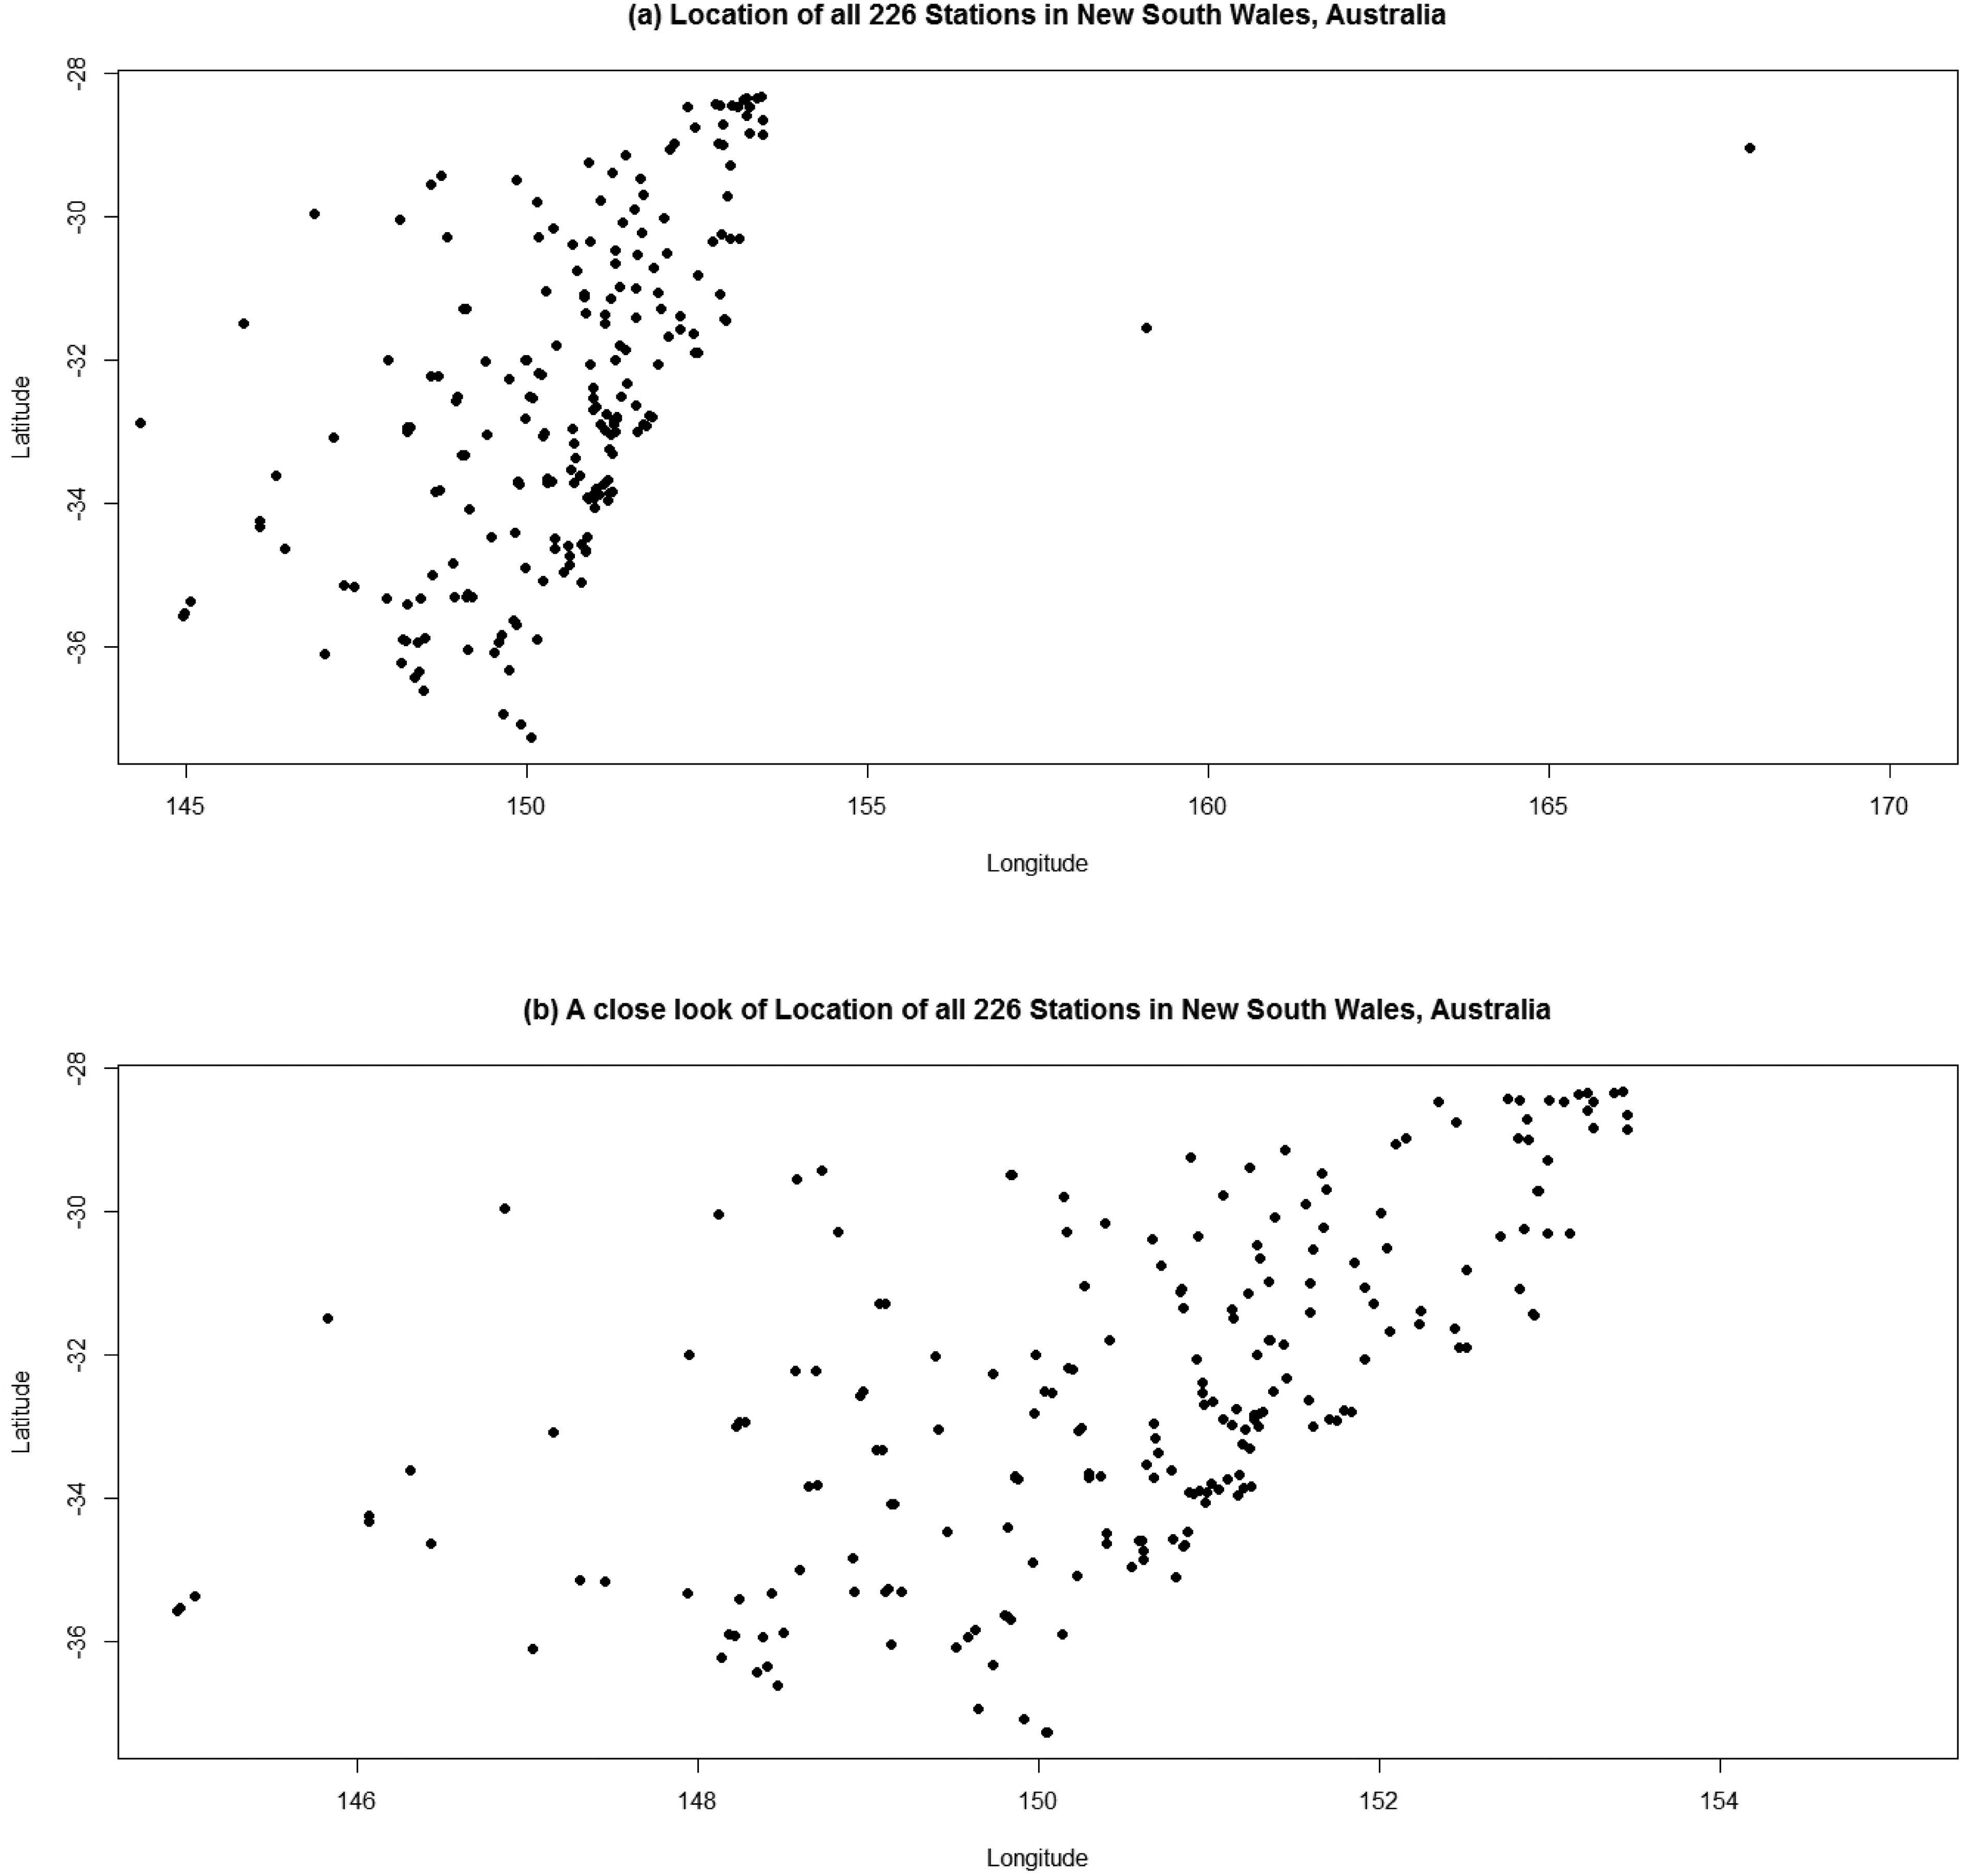
Fig. 3.
(a) Location of 226 rainfall stations in New South Wales, Australia. (b) A close look at the location of 223 stations, excluding two stations from Lord Howe Island and one from Norfolk Island, Australia.
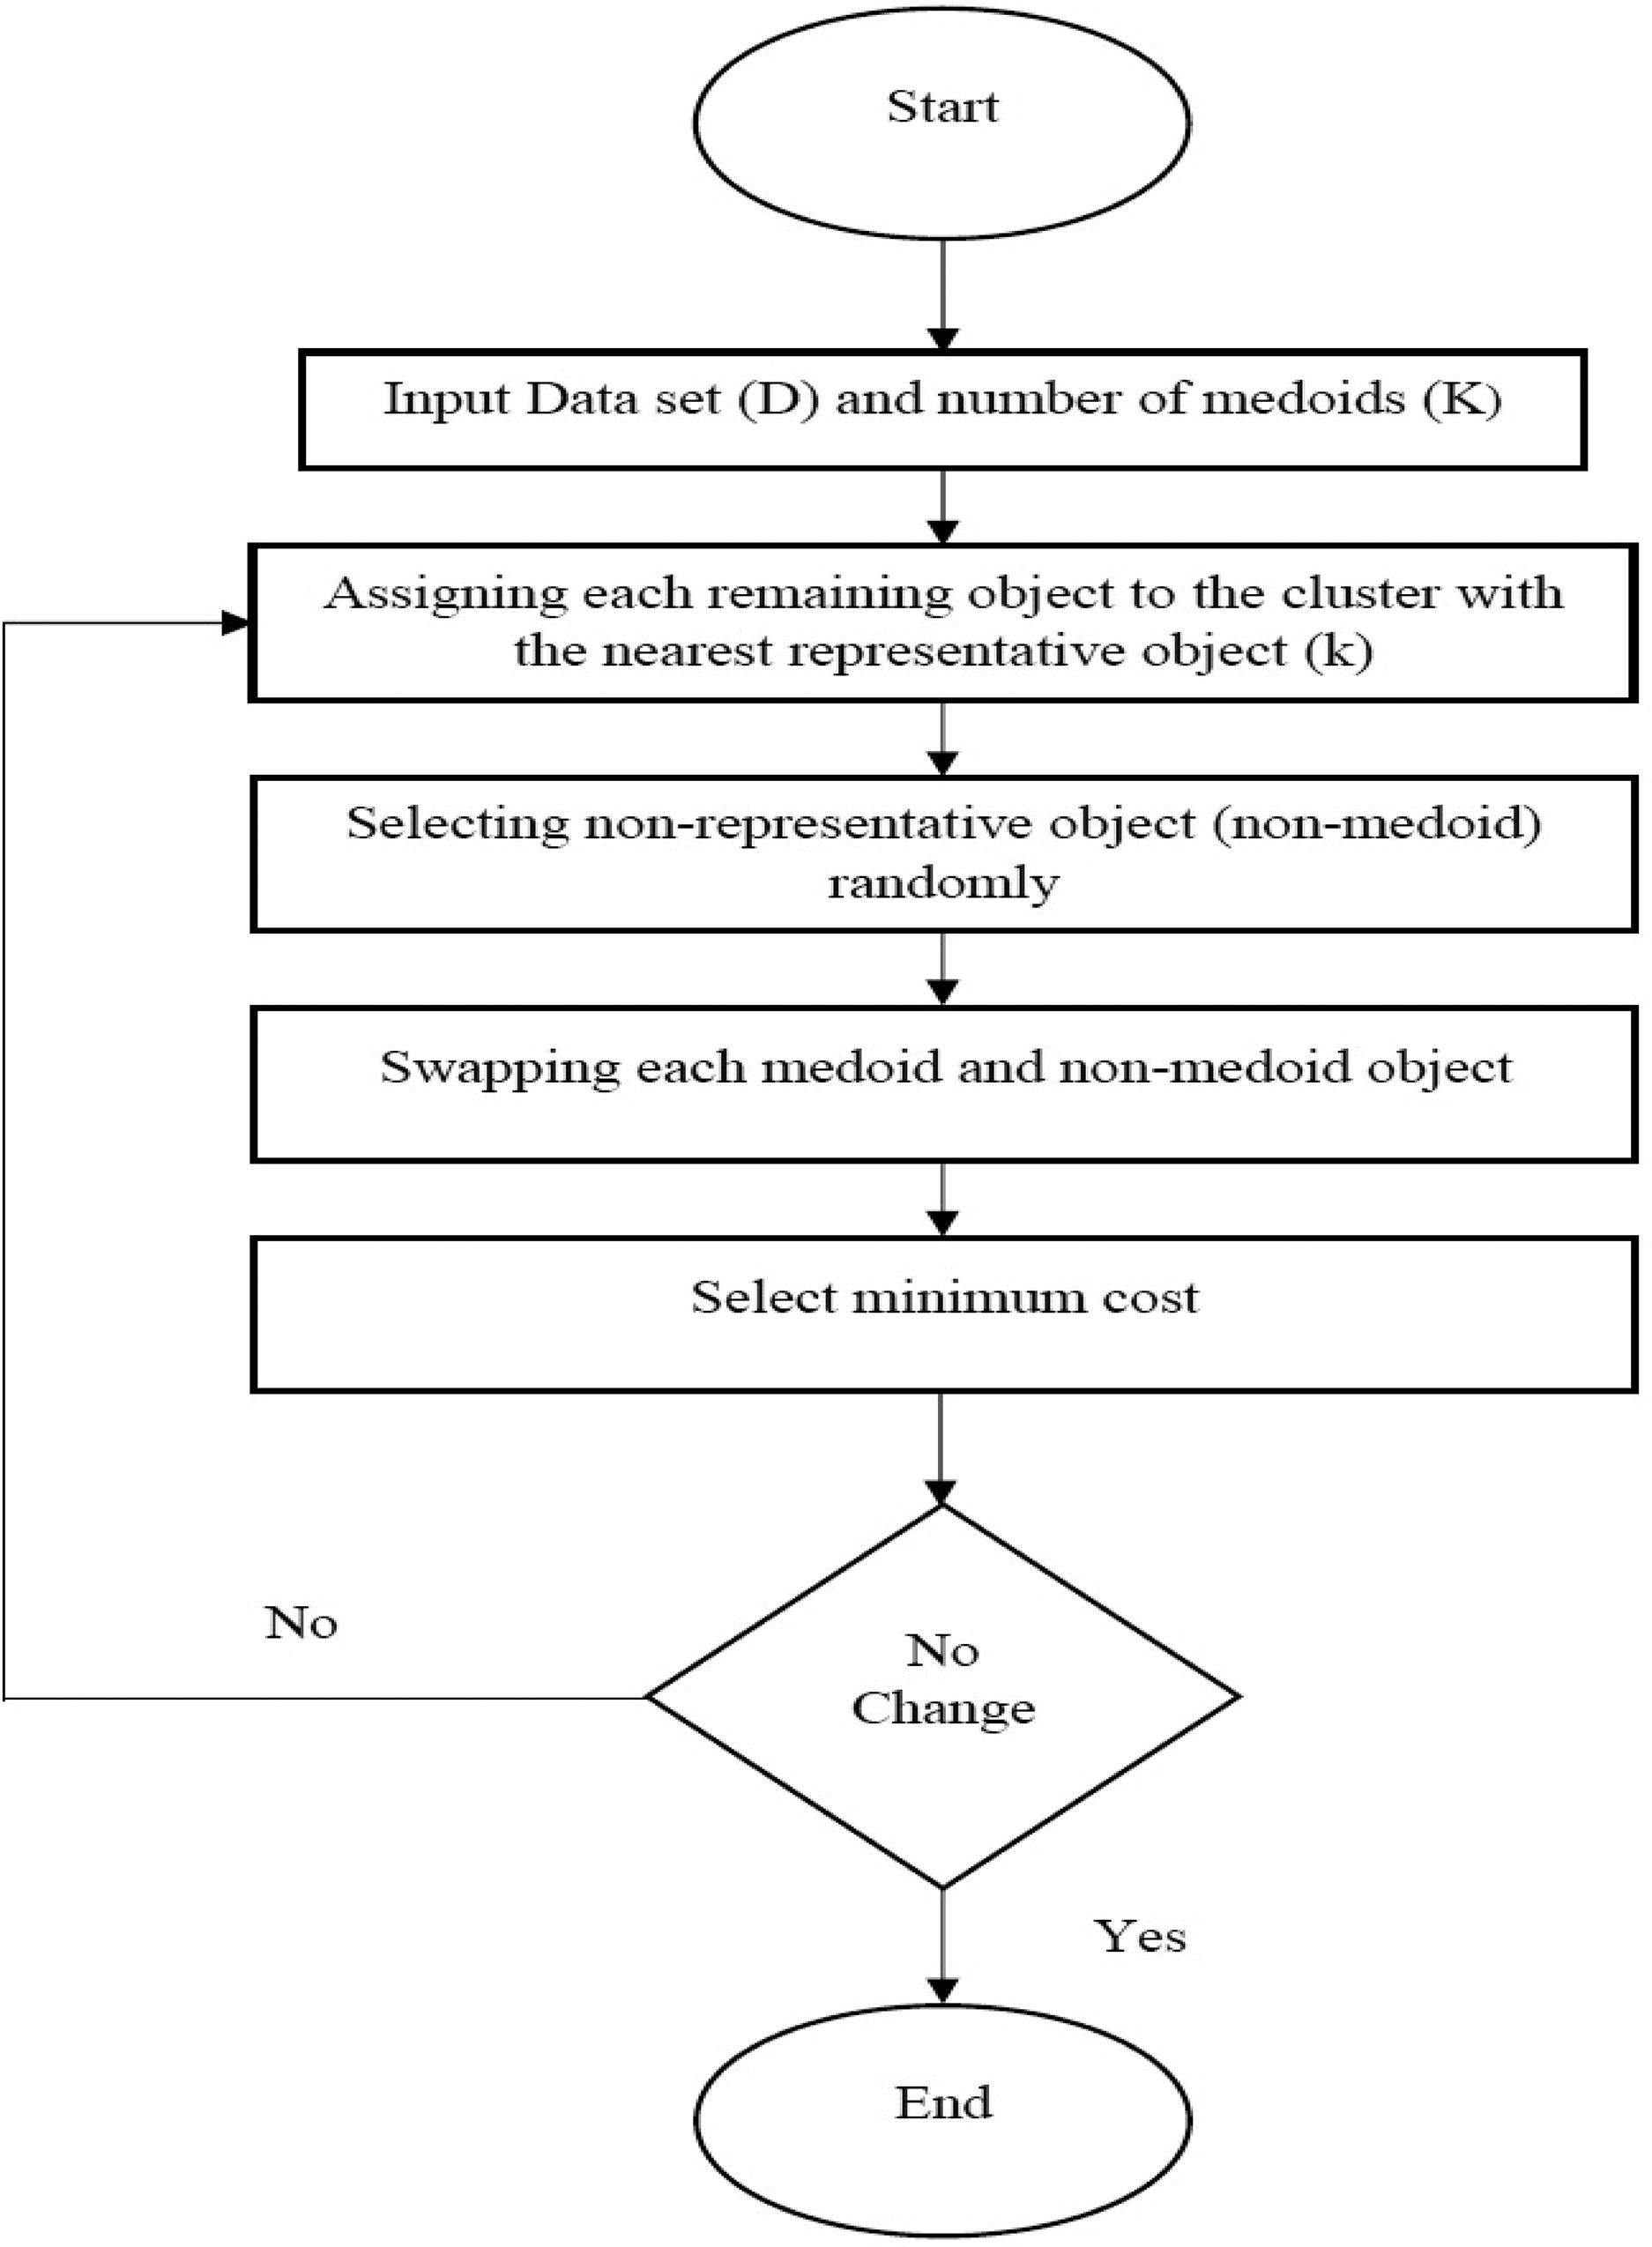
Fig. 4.
A flow chart of iterative steps of the Partition Around Medoid (PAM) algorithm.
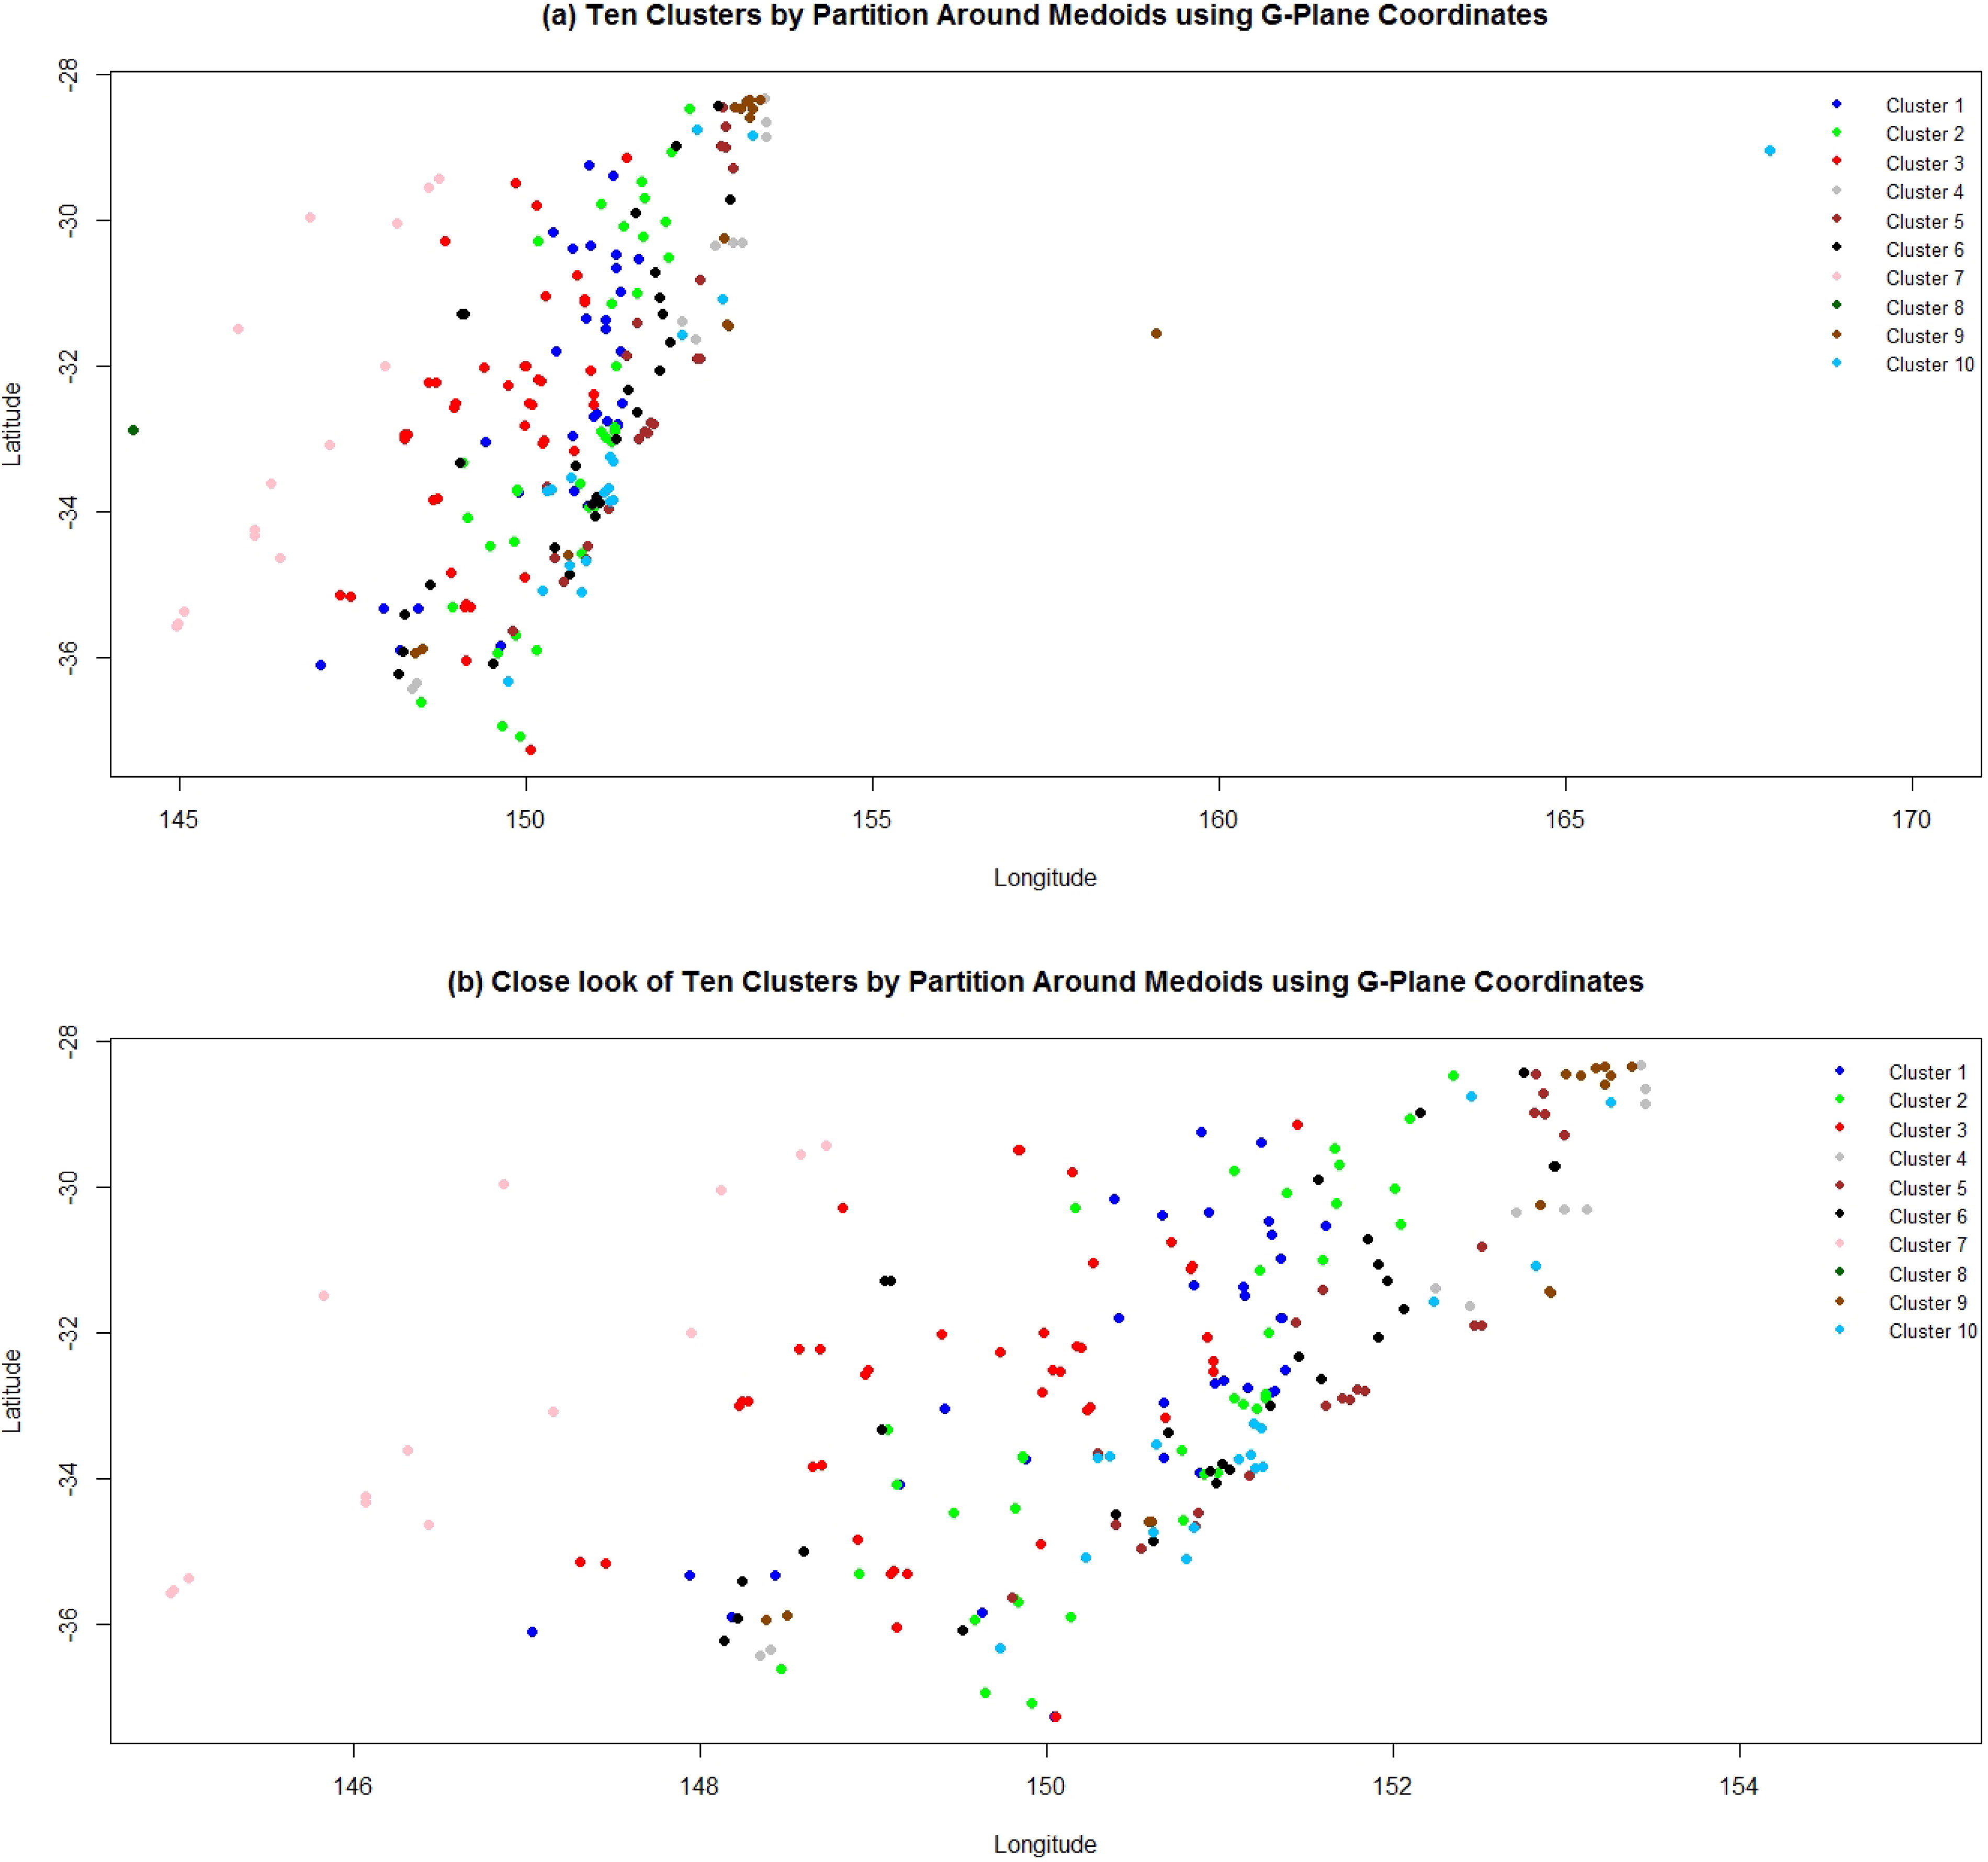
Fig. 5.
(a) Map of allocations of 226 rainfall stations to 10 clusters by Partition Around Medoid (PAM) using G-plane coordinates, the different colors represent the memberships of stations to a specific cluster. (b) A close look into the allocations of 223 rainfall stations to 10 clusters by Partition Around Medoid (PAM) using G-plane coordinates.
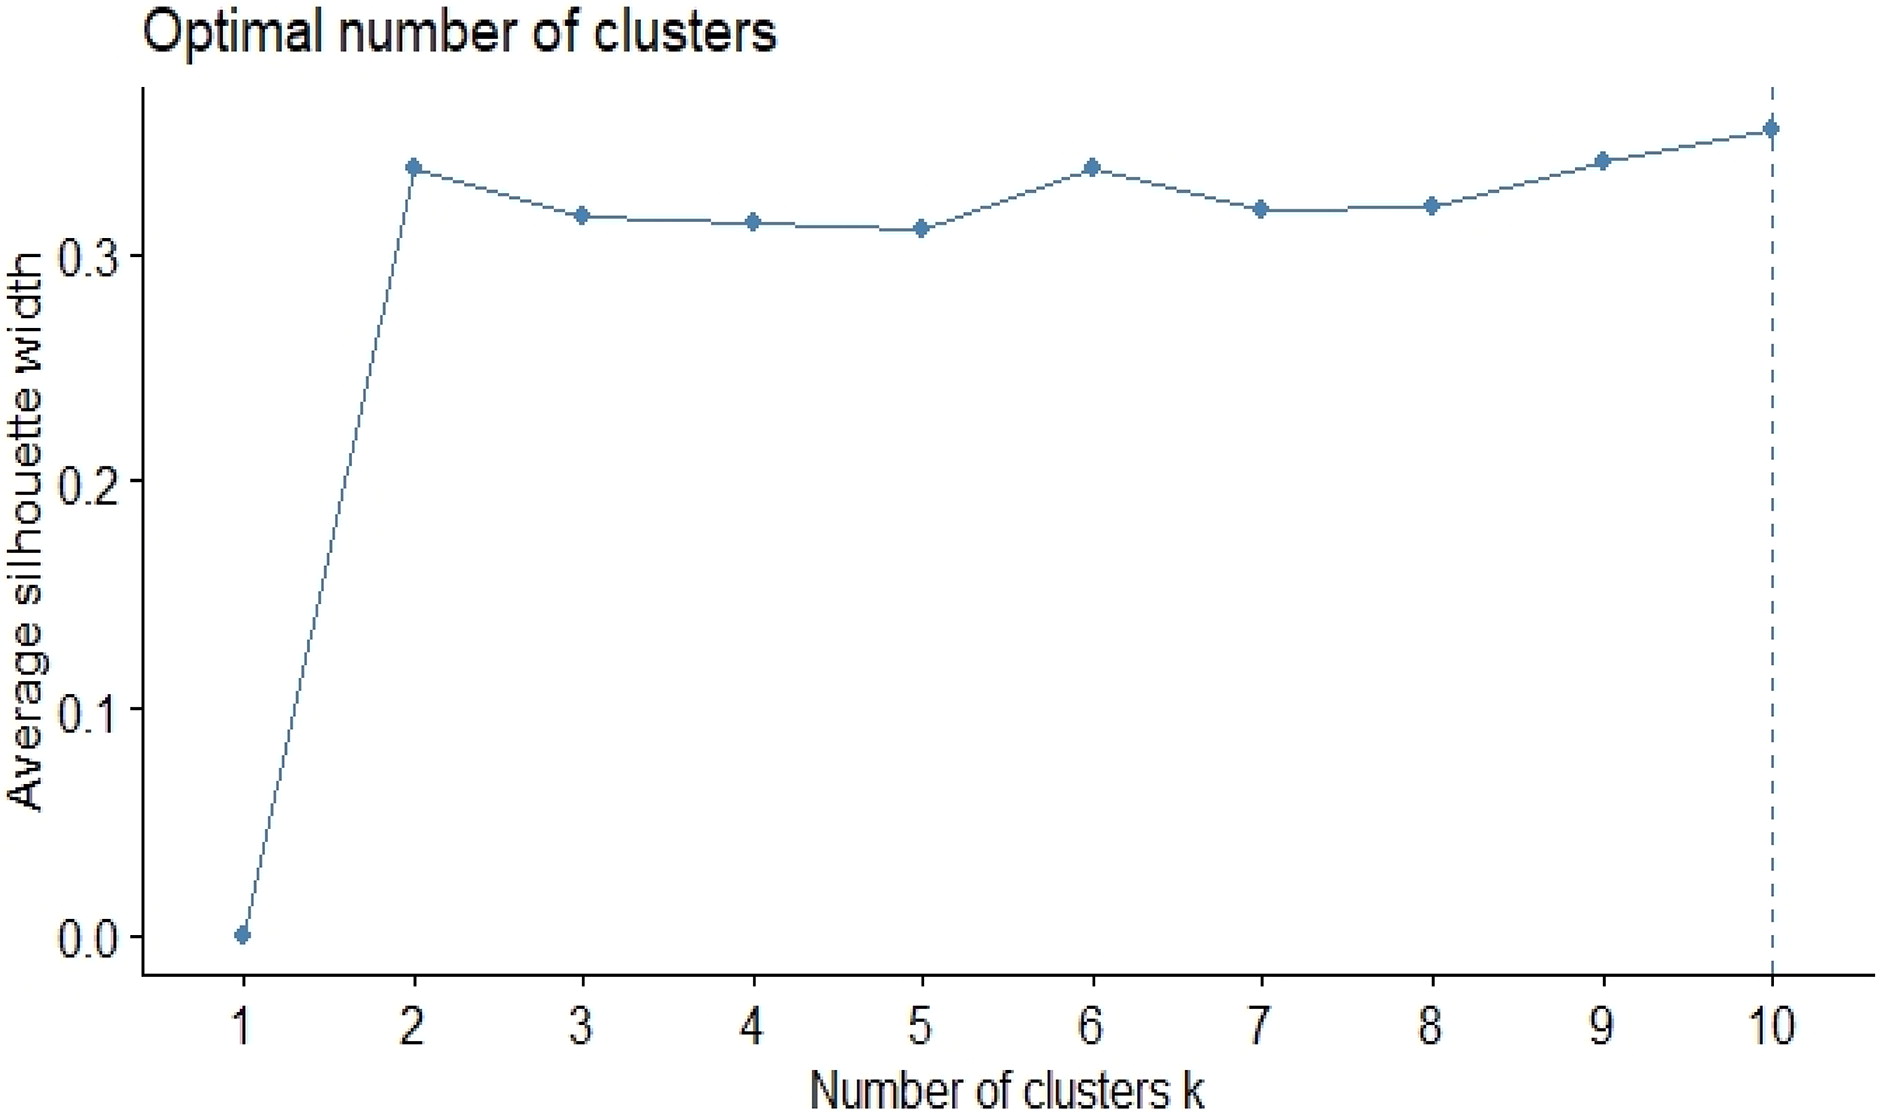
Fig. 6.
Average silhouette width comparison for selecting the optimal number of clusters.
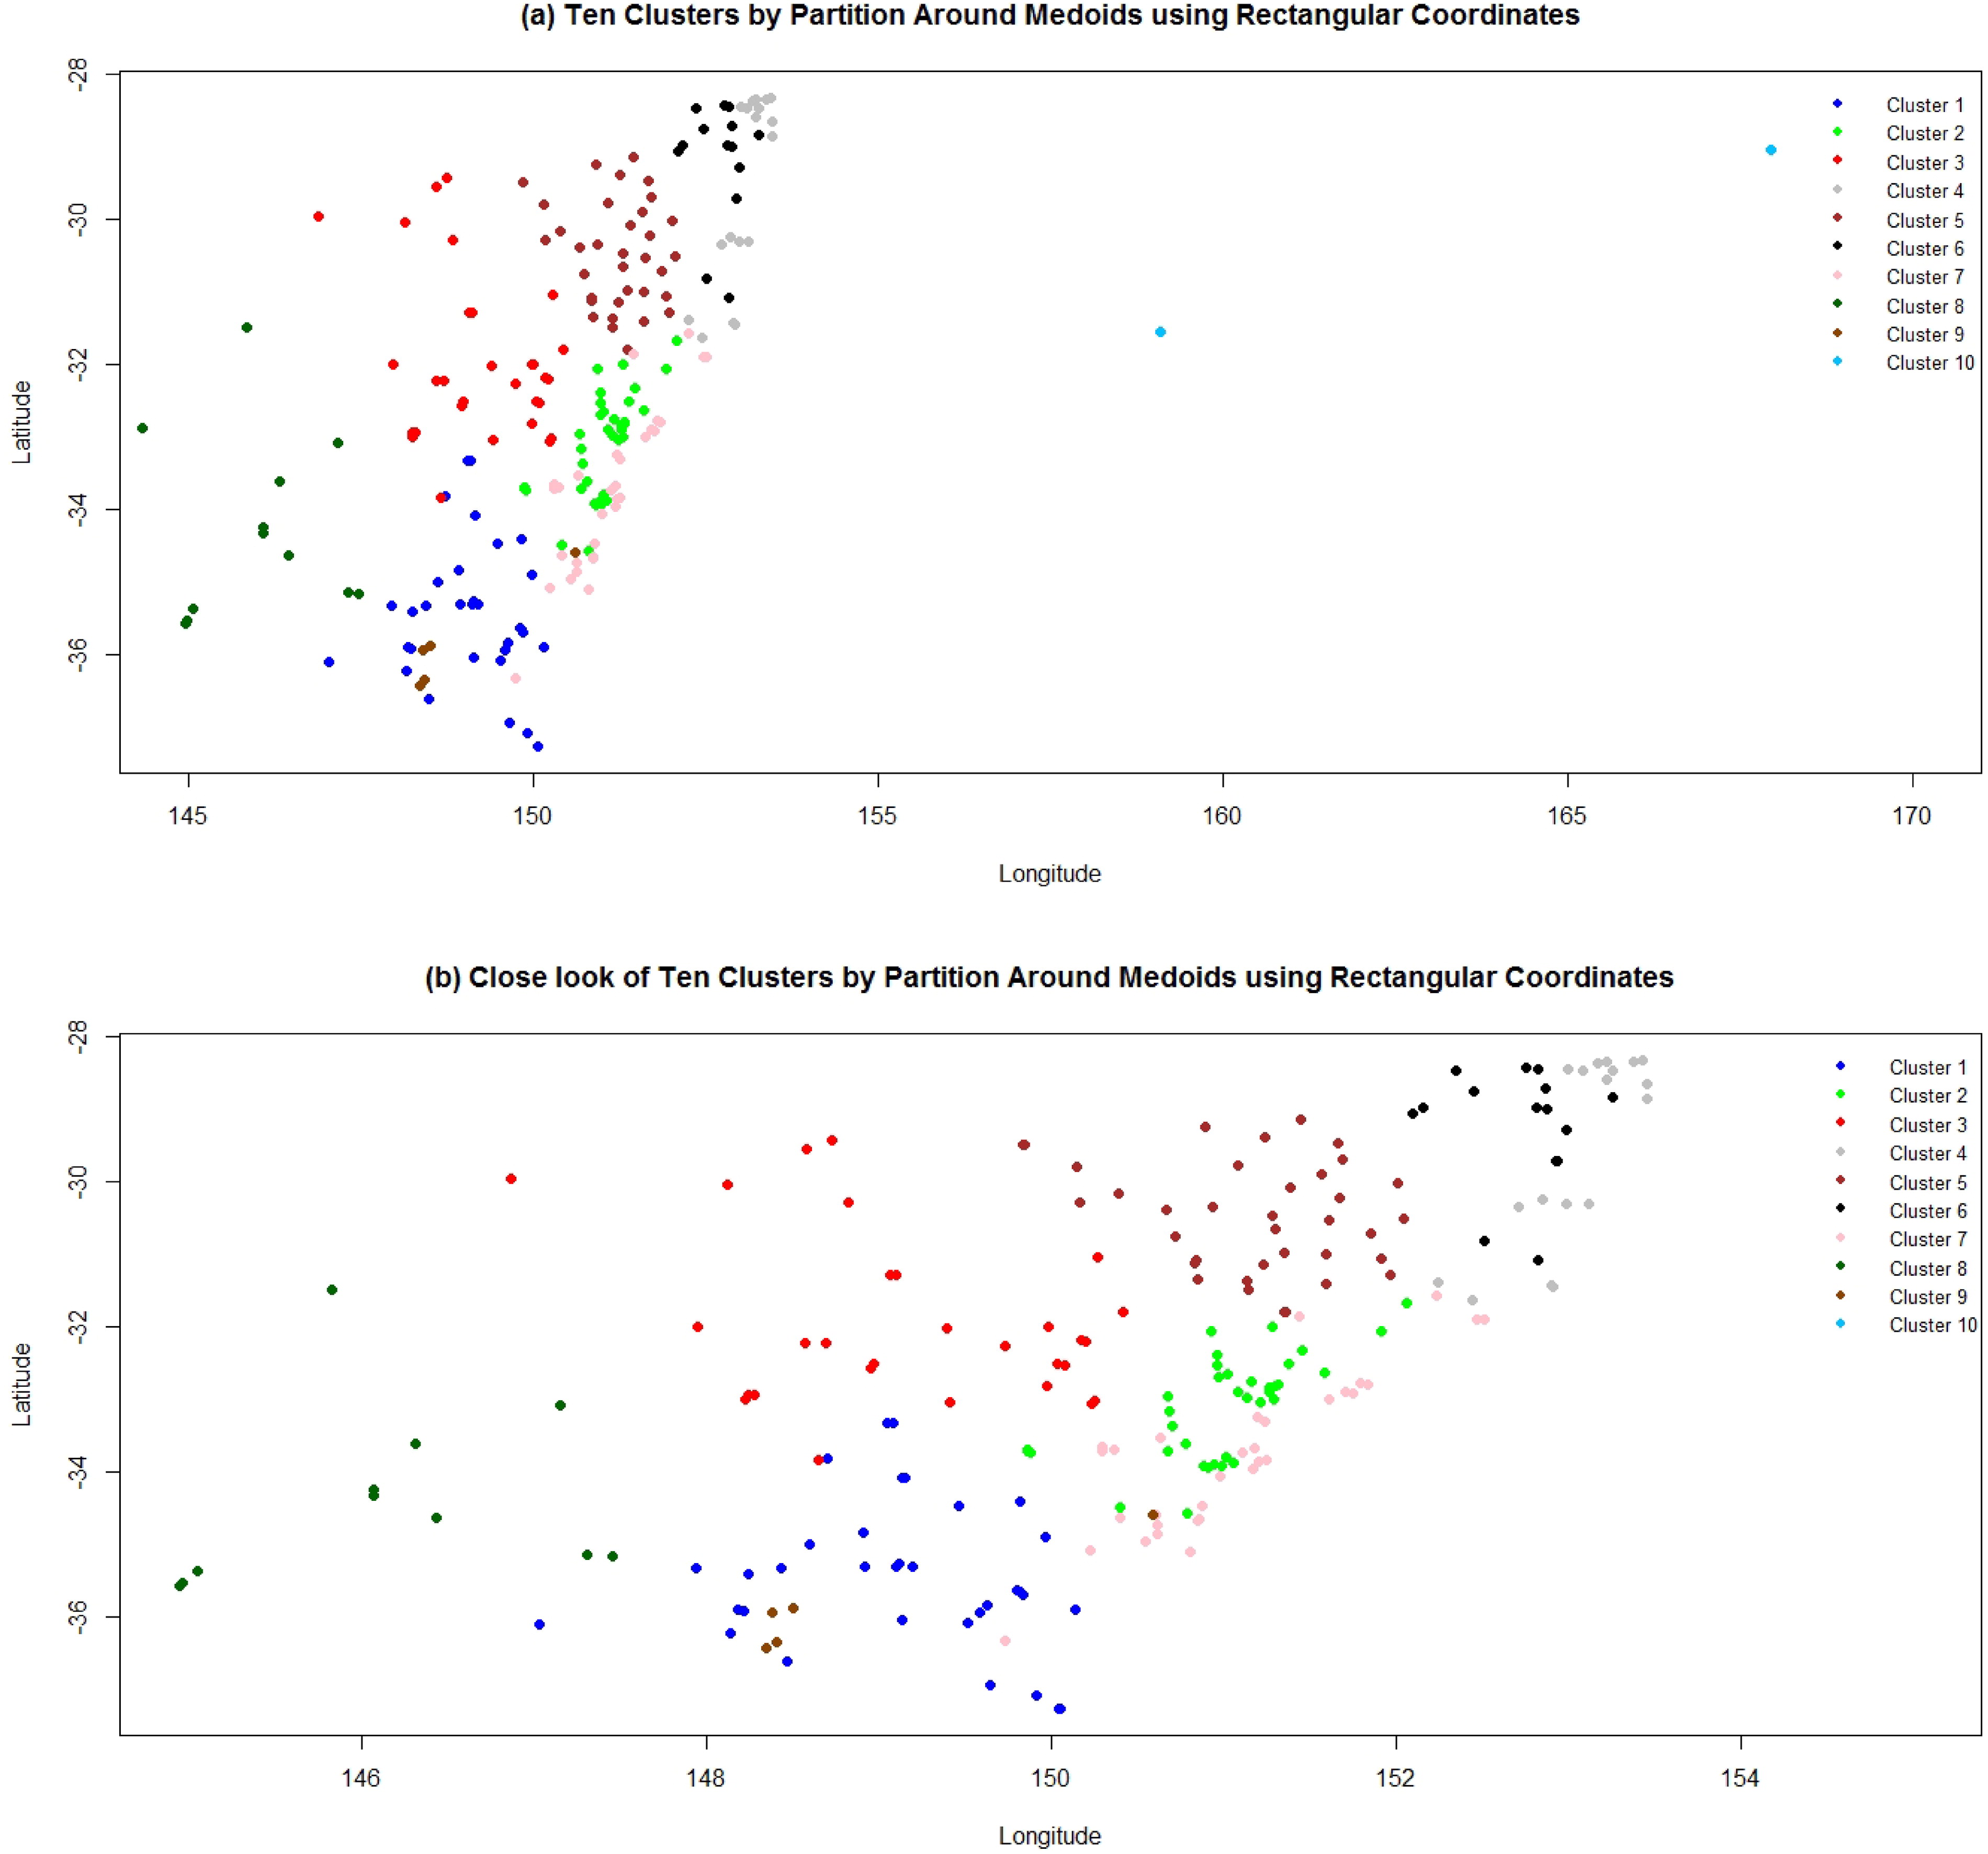
Fig. 7.
(a) Map of allocations of 226 rainfall stations to 10 clusters by Partition Around Medoid (PAM) using rectangular coordinates; the different colors represent the memberships of sites to a specific cluster. (b) A close look into allocations of 223 rainfall stations to 10 clusters by Partition Around Medoid (PAM) using rectangular coordinates.
Table 1.
Summary information of all ten cluster’s medoids using Partition Around Medoid.
Table 2.
Summary statistics of all ten clusters by Partition Around Medoid using rectangular coordinates.
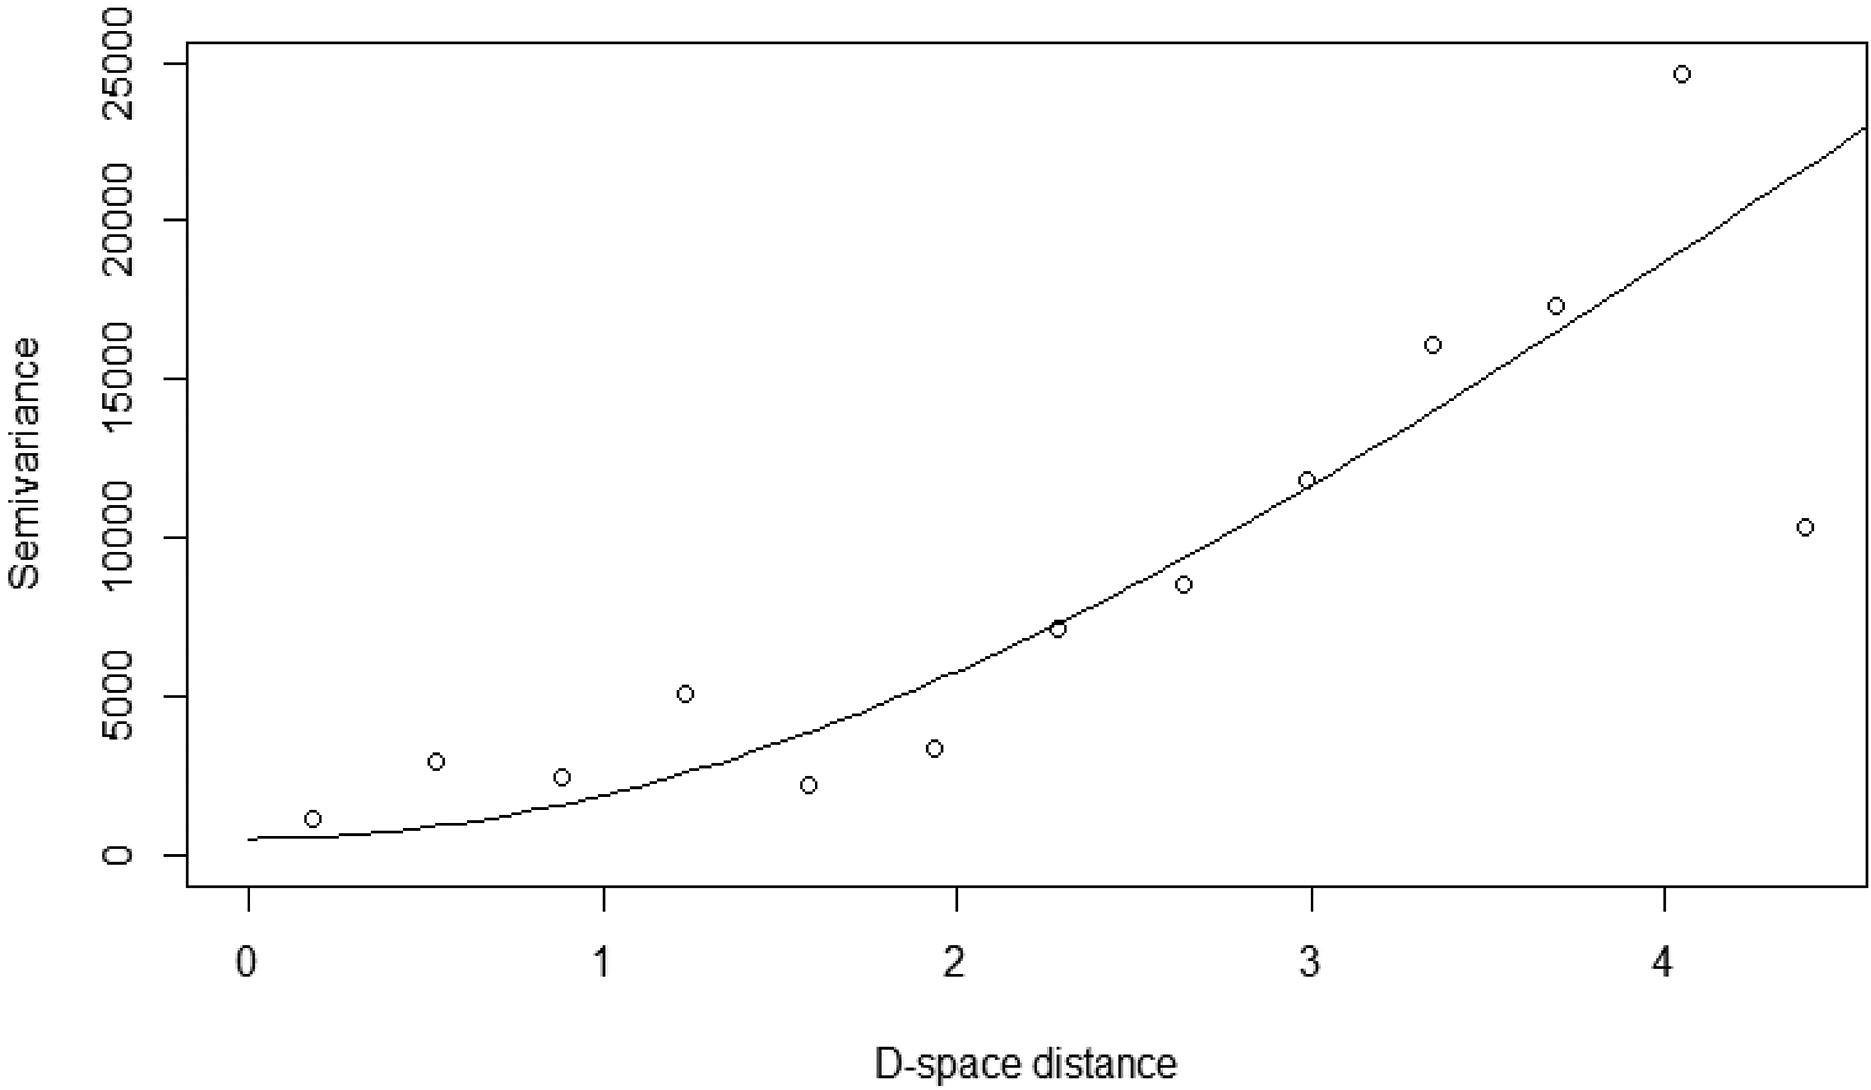
Fig. 8.
Fitted Gaussian variogram for Cluster 3 using rectangular coordinates.
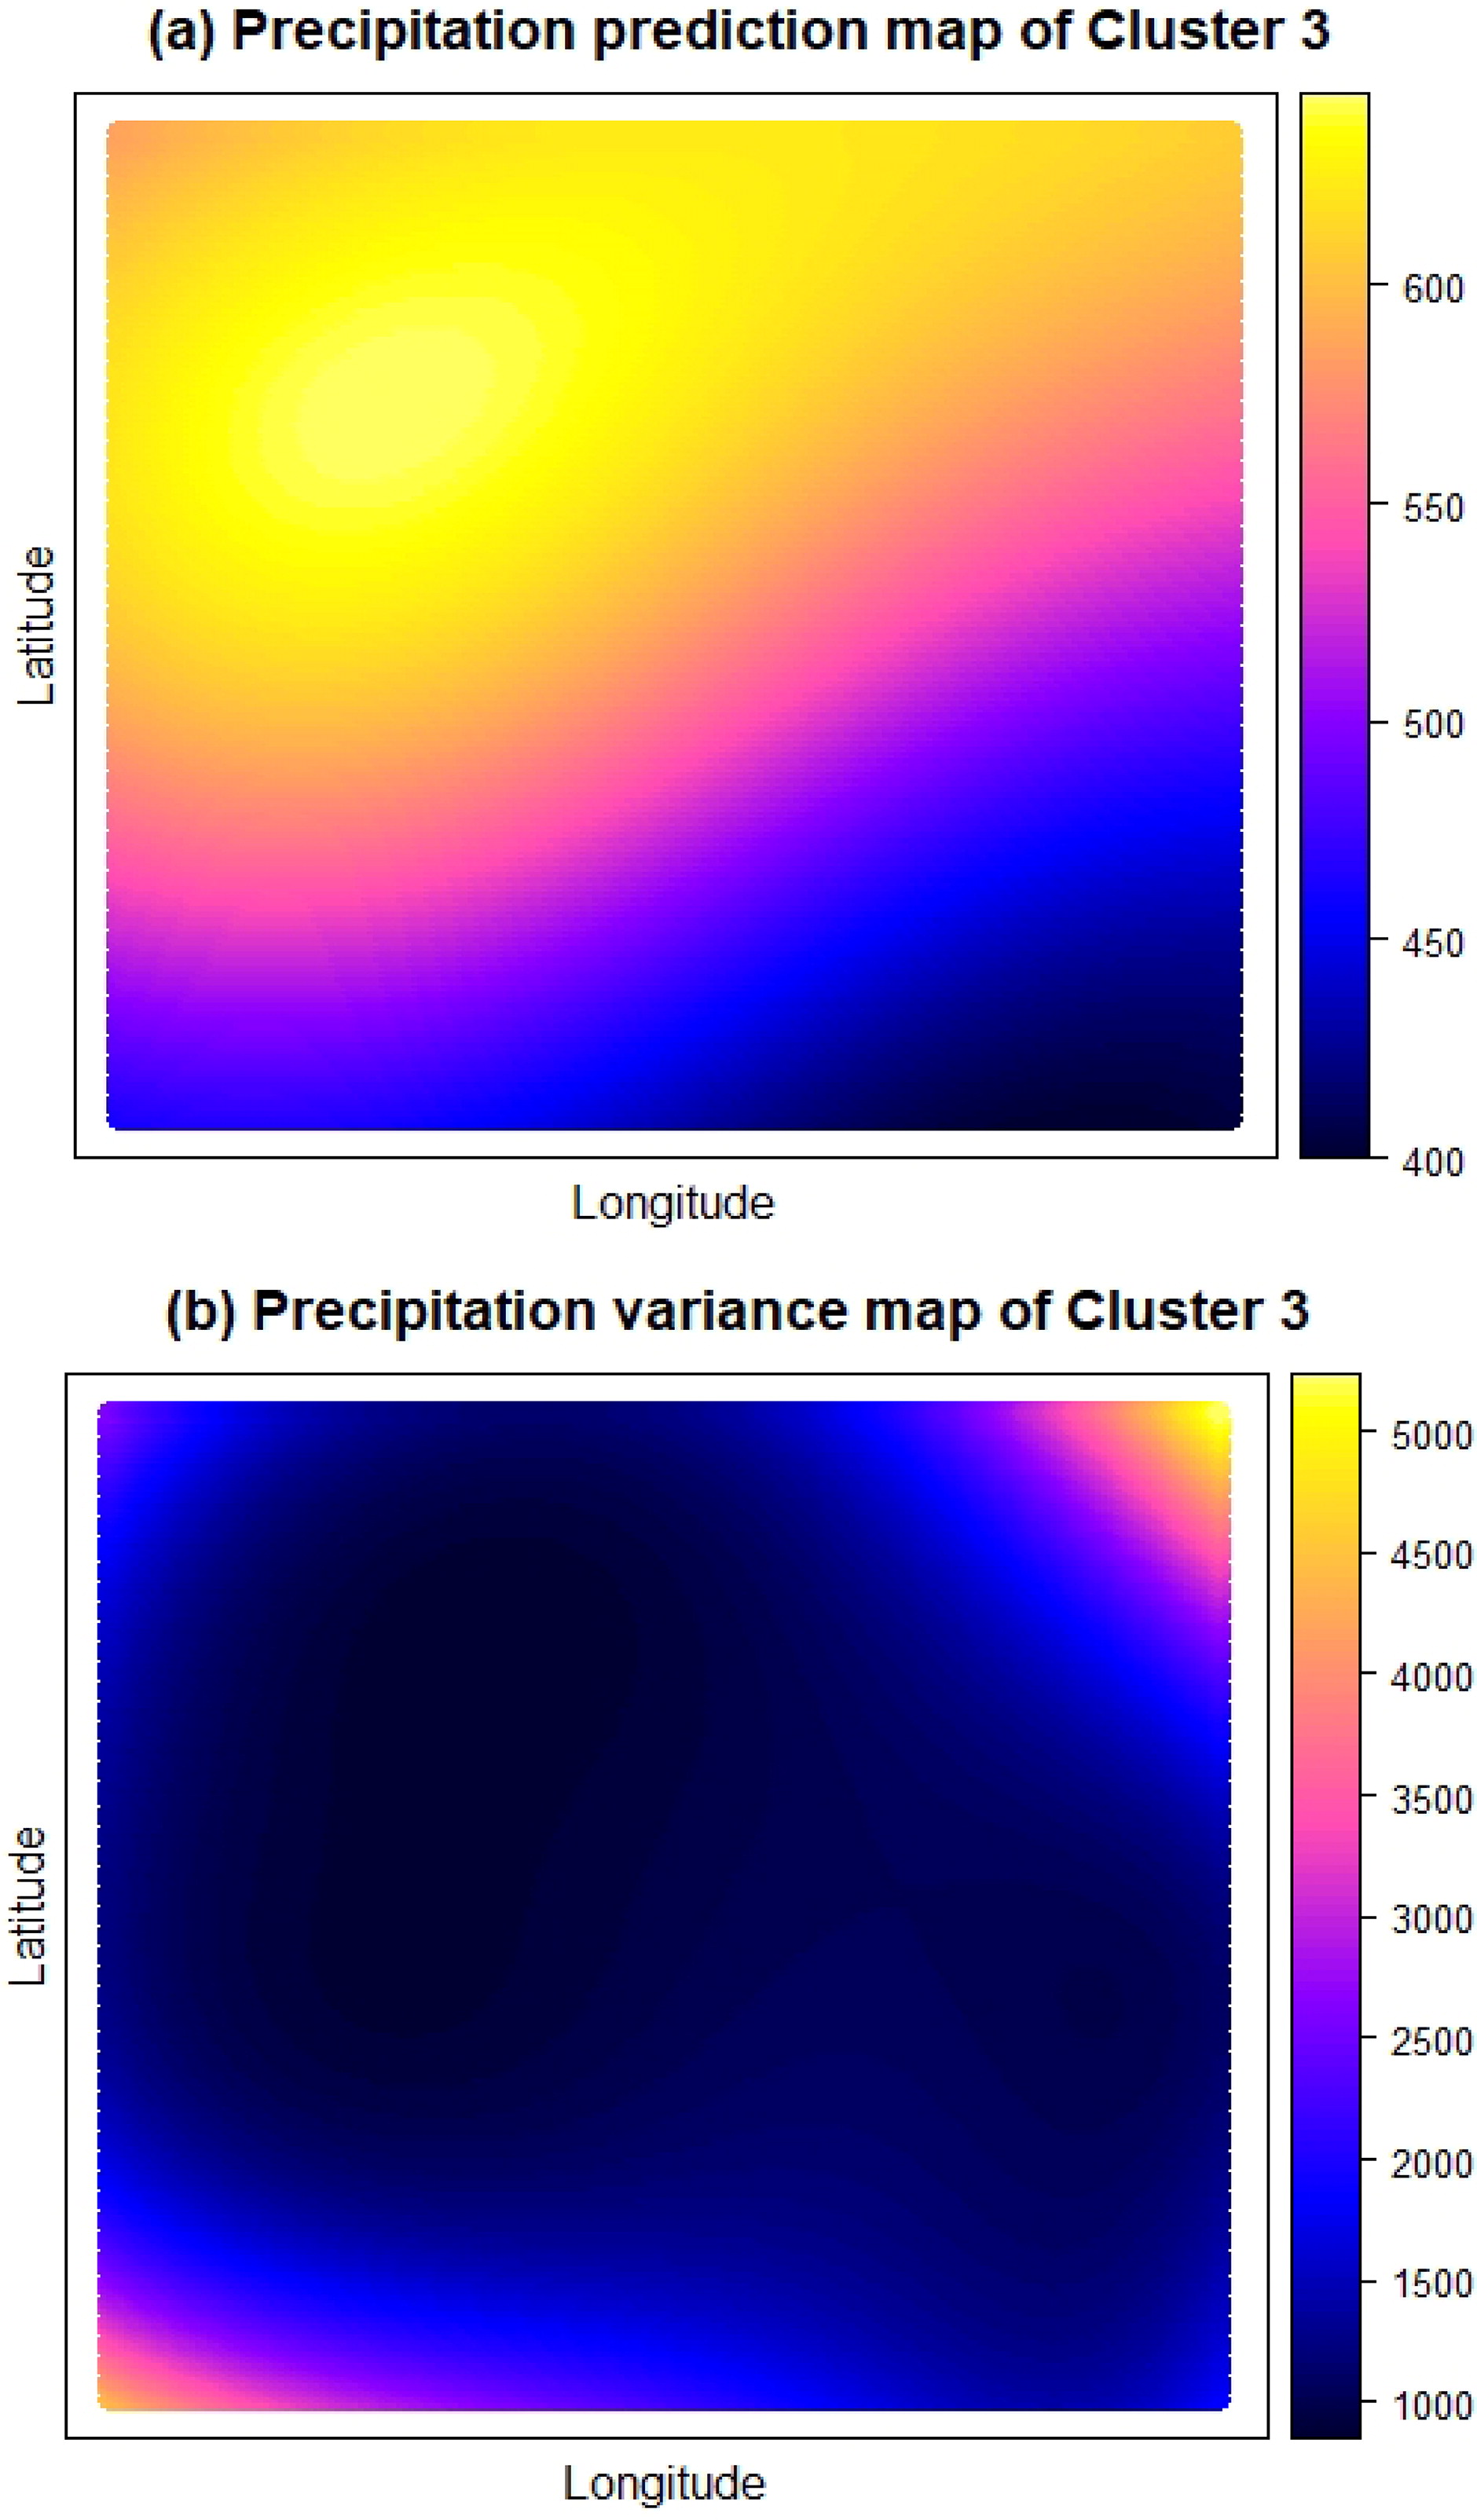
Fig. 9.
(a) Prediction (b) Variance map of precipitation for Cluster 3 using ordinary kriging.