
Table 1.
The correlation coefficients of 2-m air temperature anomalies (), anomalies of air temperature at 850 hPa (), geopotential anomalies of the isobaric surface 200 hPa (), geopotential anomalies of the isobaric surface 500 hPa (), anomalies of precipitation rate (), sea-level pressure anomalies () for four regions: globally, in the tropics (20°S–20°N), Northern extratropics (20°N–90°N), Southern extratropics (90°S N–20°S).
(20°S–20°N)0,35 /0,390,26 /0,170,5 /0,530,18 /0,190,16 /0,330,44 /0,46Northern extratropics (20°N–90°N)0,26 /0,200,22 /0,230,25 /0,220,23 /0,230,17 /0,170,23 /0,28Southern extratropics (90°S–20°S)0,19 /0,270,13 /0,170,27 /0,280,19 /0,210,13 /0,200,23 /0,25
Table 2.
Anomaly correlation for 2-m air temperature anomalies () in the tropics (20°S–20°N) for each winter season beginning in December 1980–2014, and the average value for all winter seasons.
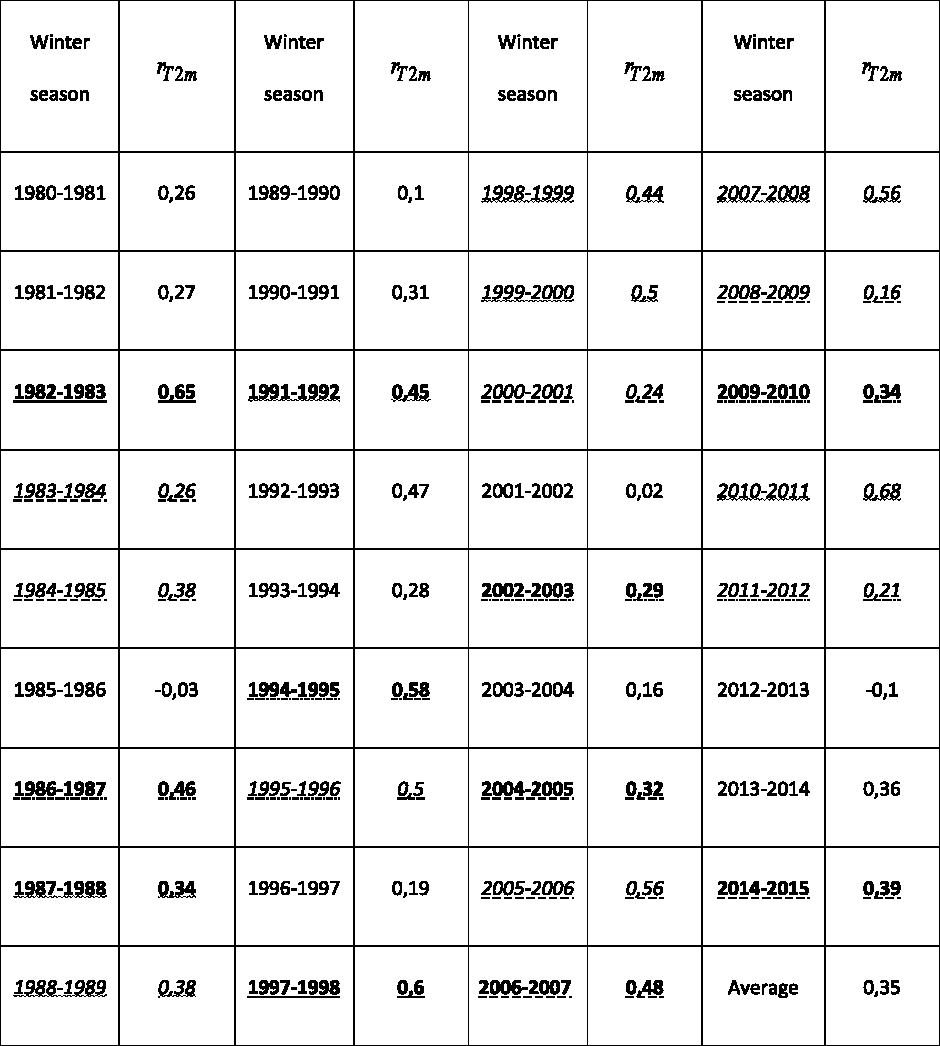
[i] The years of weak (0.5°–0.9° absolute value of SST anomaly) are marked with a dash, the moderate (1.0°–1.4°) by a dash-dot line, the strong (1.5°–1.9°) by a wavy line, and the very strong (≥ 2.0°) by an underline El Niño (bold) and La Niña (italics) phenomena, according to the NOAA classification.
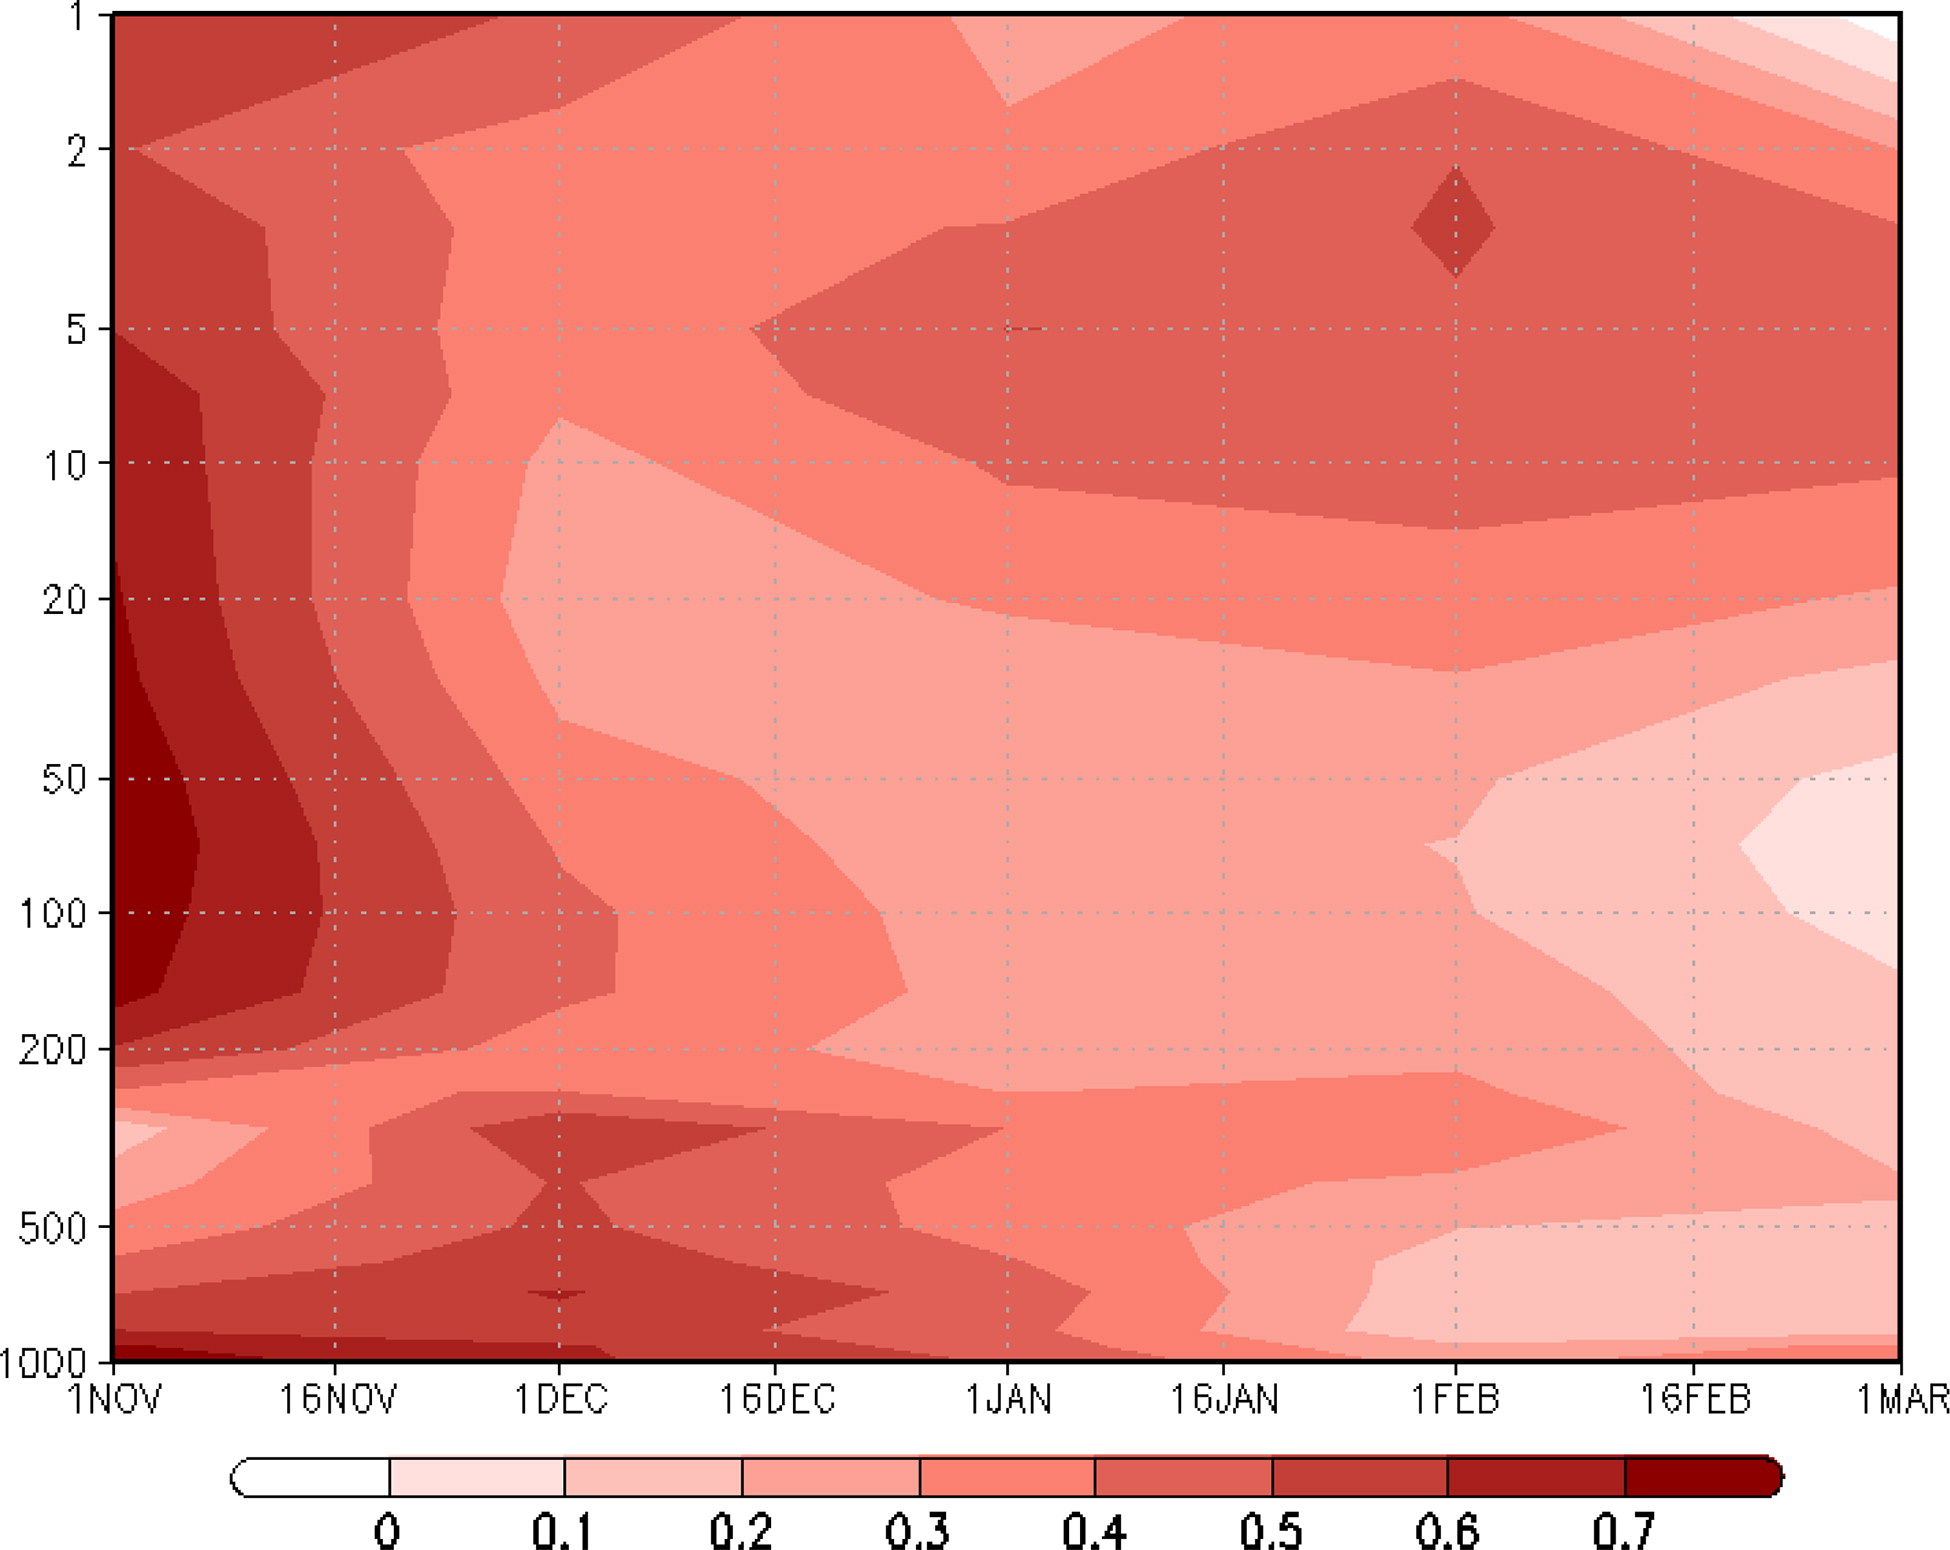
Fig. 1.
Correlation coefficients of INM-CM5-0 and ERA-Interim reanalysis monthly mean air temperature averaged along the circle of latitudes and from 60°N to 88°N at different heights.
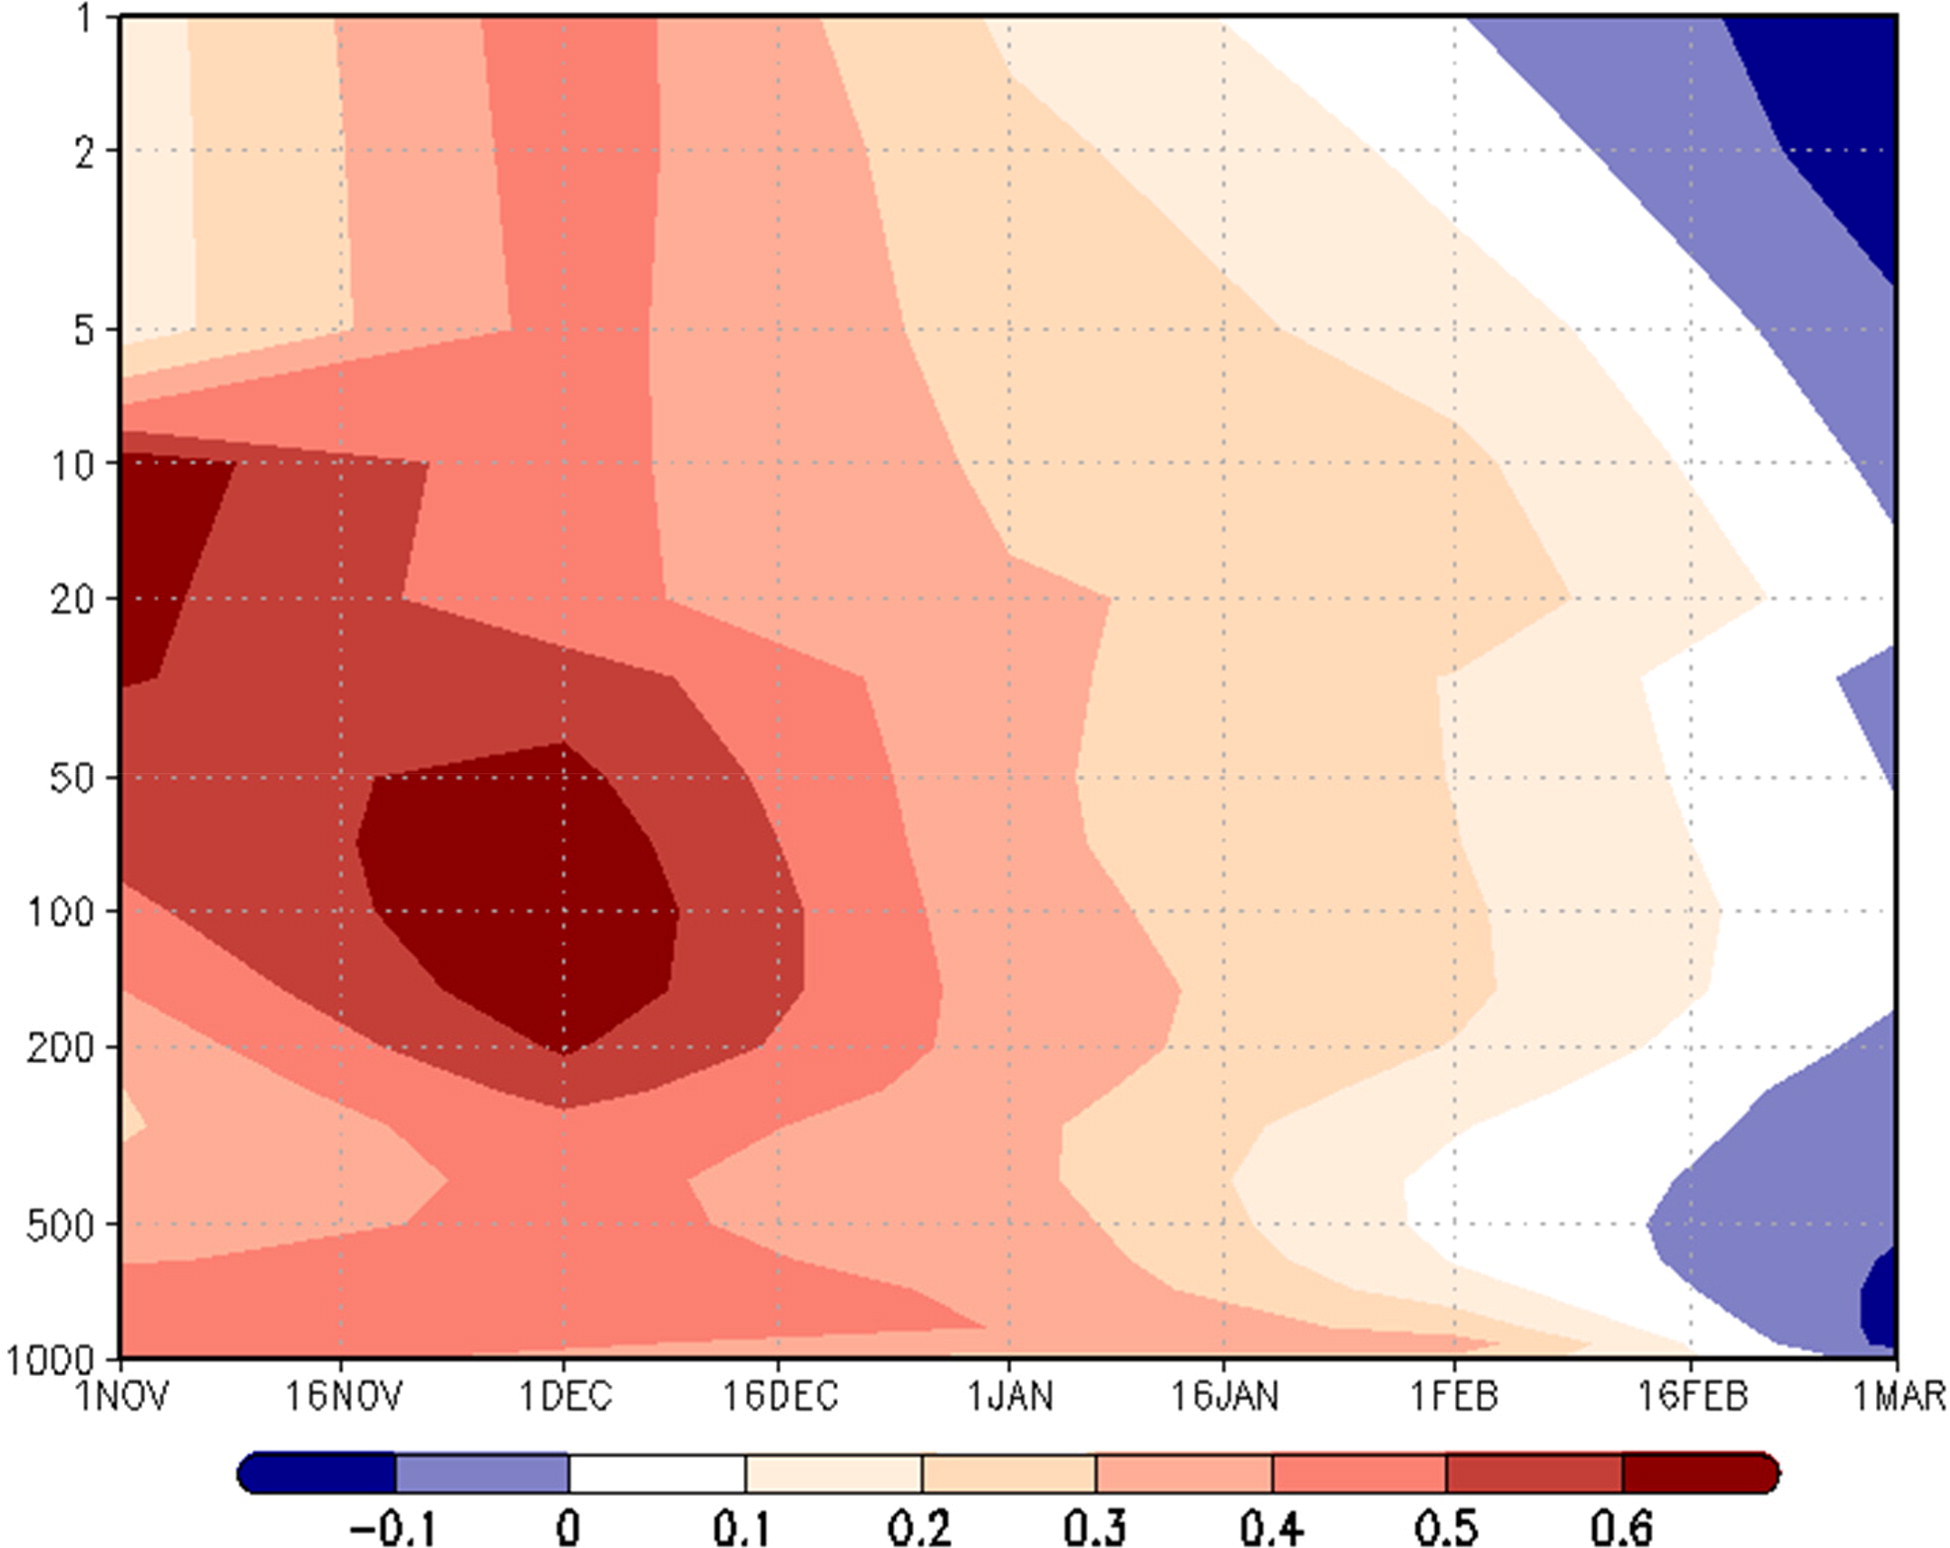
Fig. 2.
Correlation coefficients of INM-CM5-0 and ERA-Interim reanalysis monthly mean U-component of the wind speed averaged along the circle of latitudes and from 60°N to 70°N at different heights.
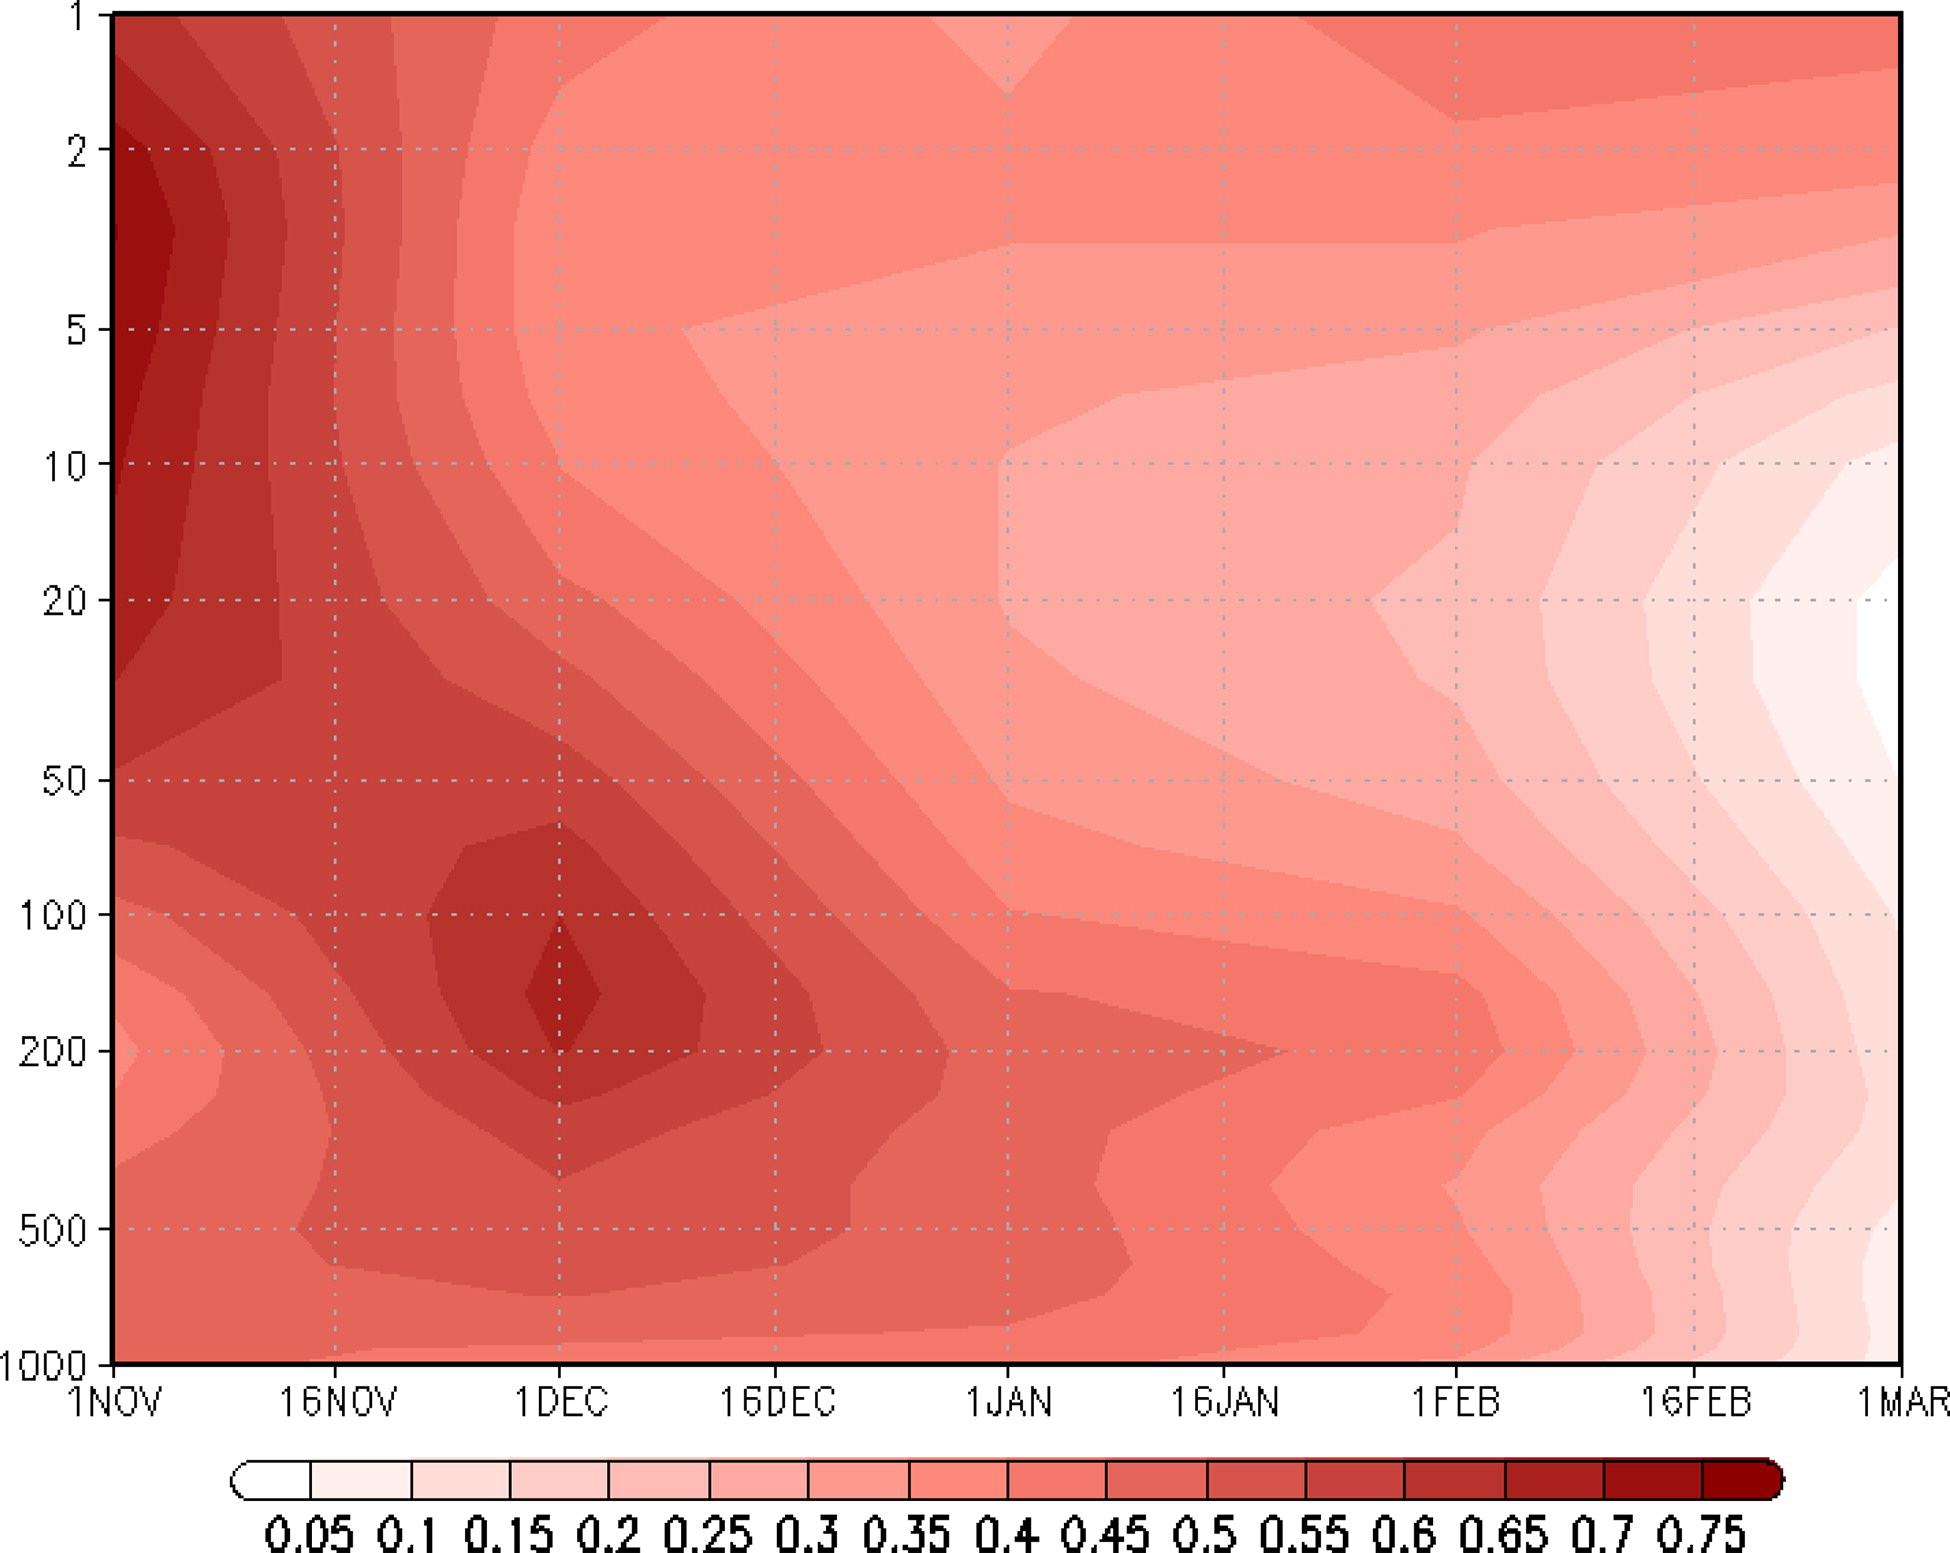
Fig. 3.
Correlation coefficients of INM-CM5-0 and ERA-Interim reanalysis monthly mean geopotential field averaged along the circle of latitudes and from 60°N to 88°N at different heights.
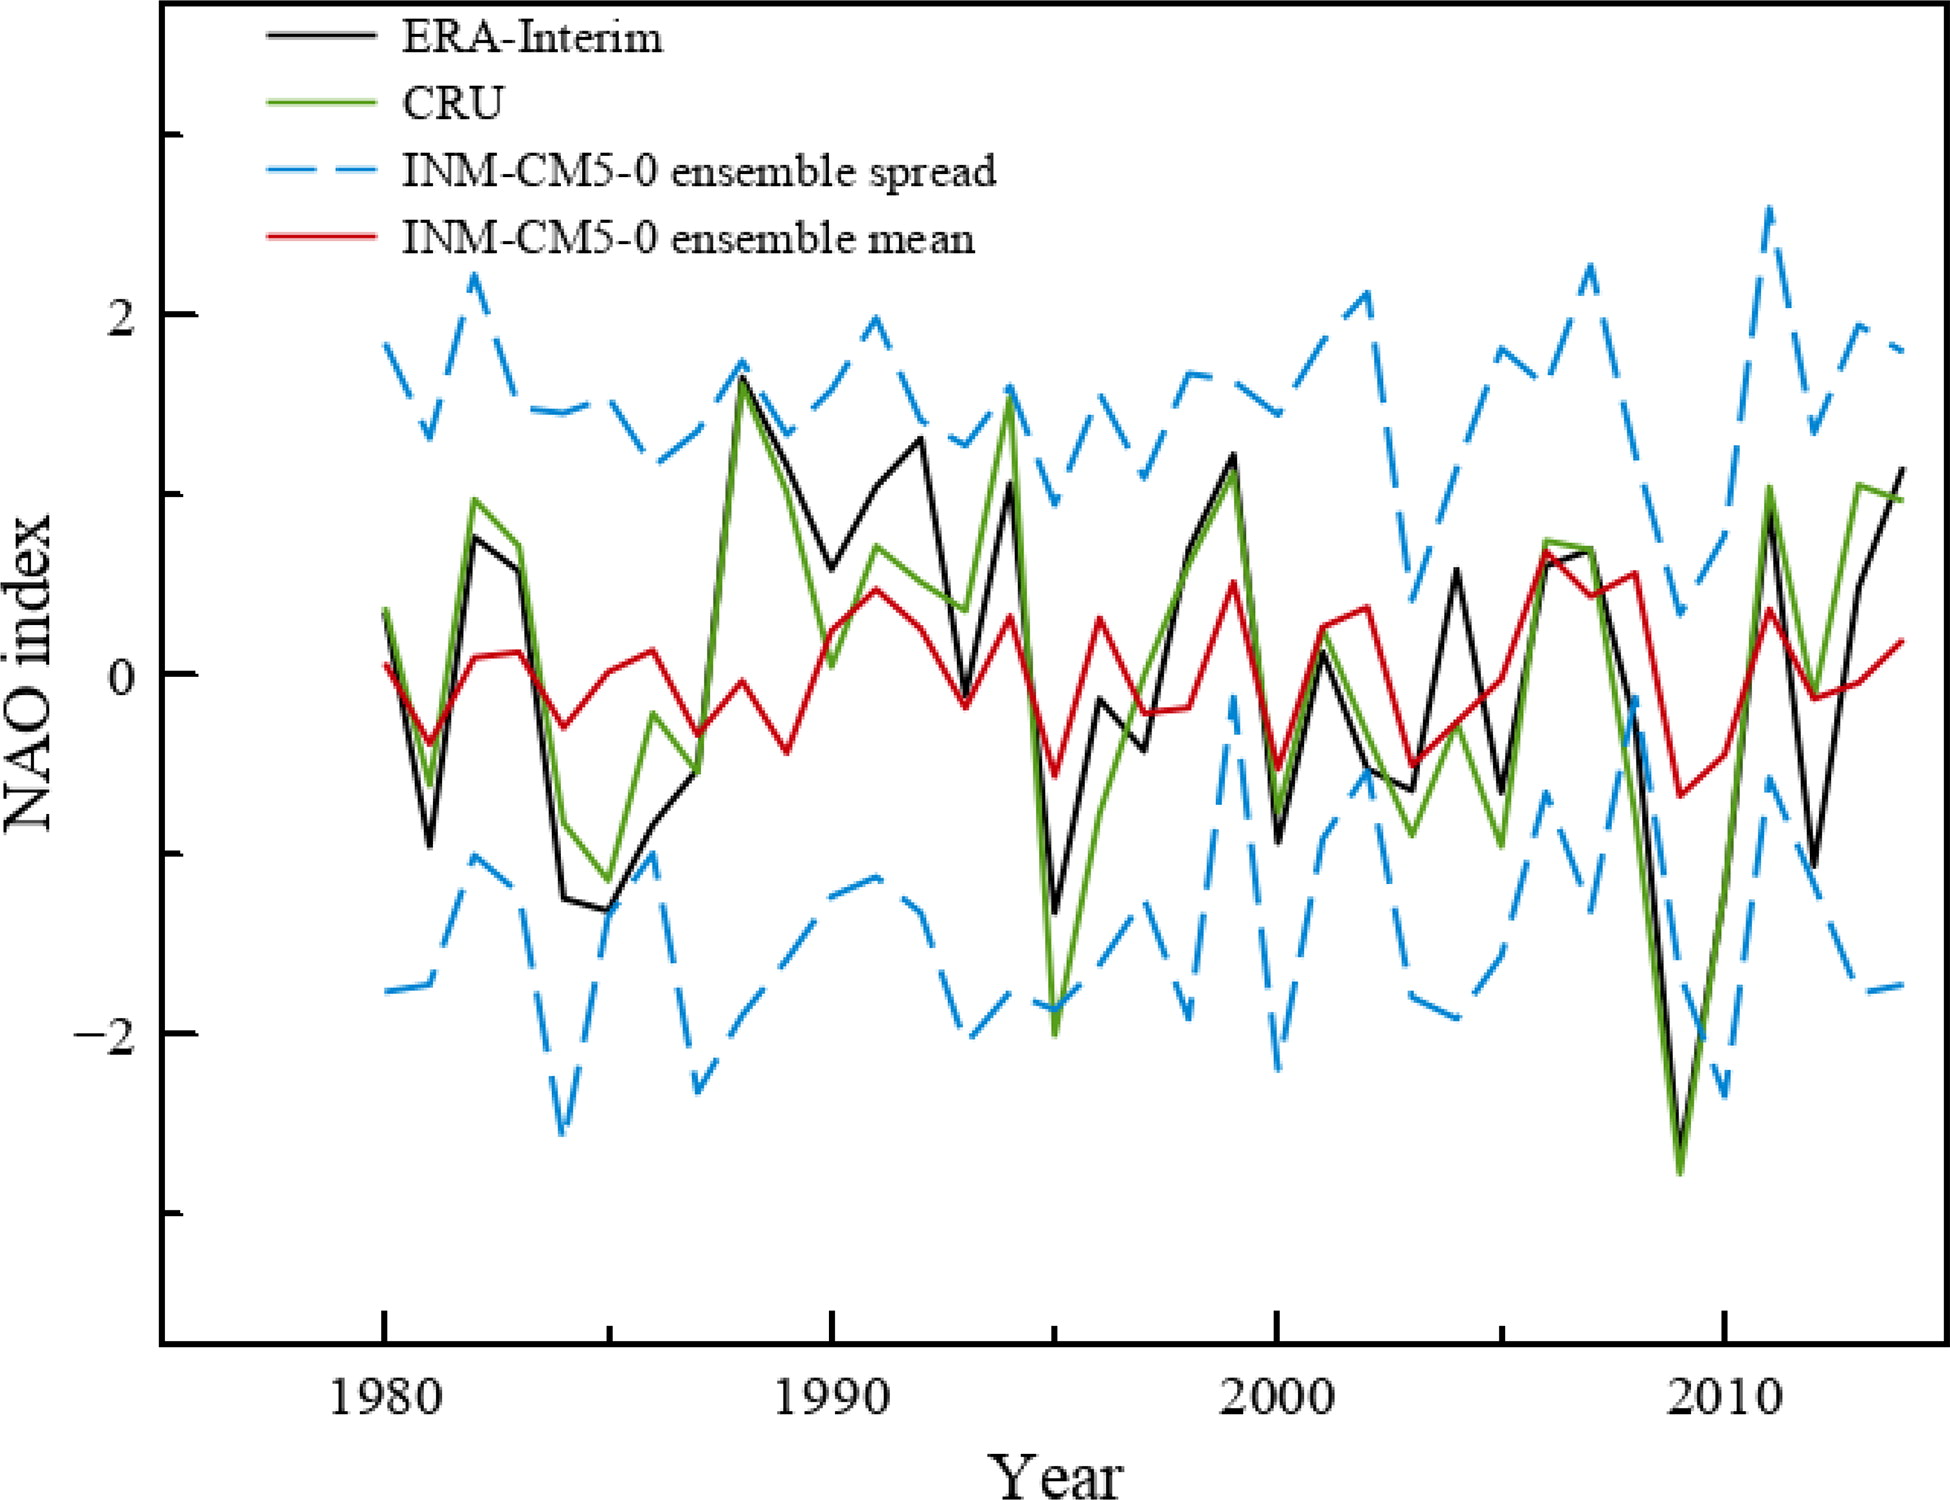
Fig. 4.
Time series of DJF NAO index. Maximum and minimum of the INM-CM5-0 10-member ensemble are shown as a blue dashed lines. INM-CM5-0 ensemble averaged NAO index is plotted in red. The ERA-Interim and instrumental CRU NAO indices are shown in black and green, respectively.
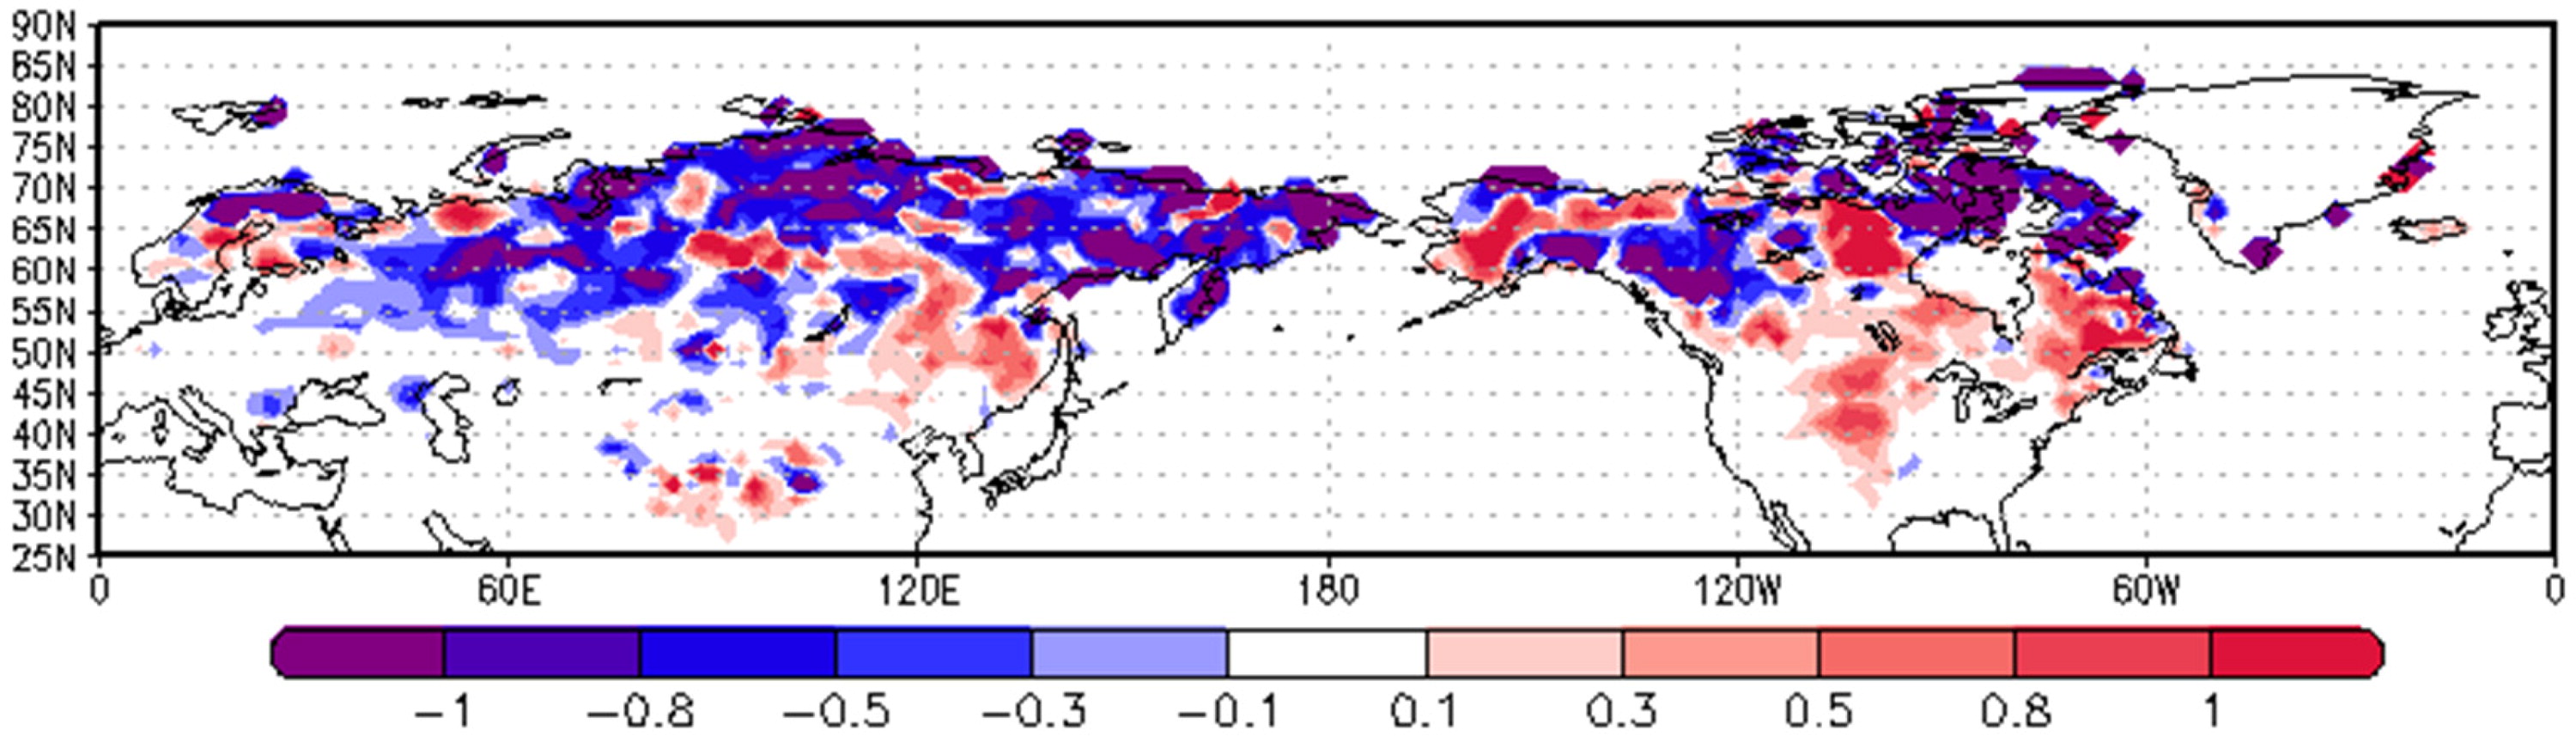
Fig. 5.
Regression of initial snow water equivalent thickness (cm) prescribed for Nov. 1 on DJF NAO index.
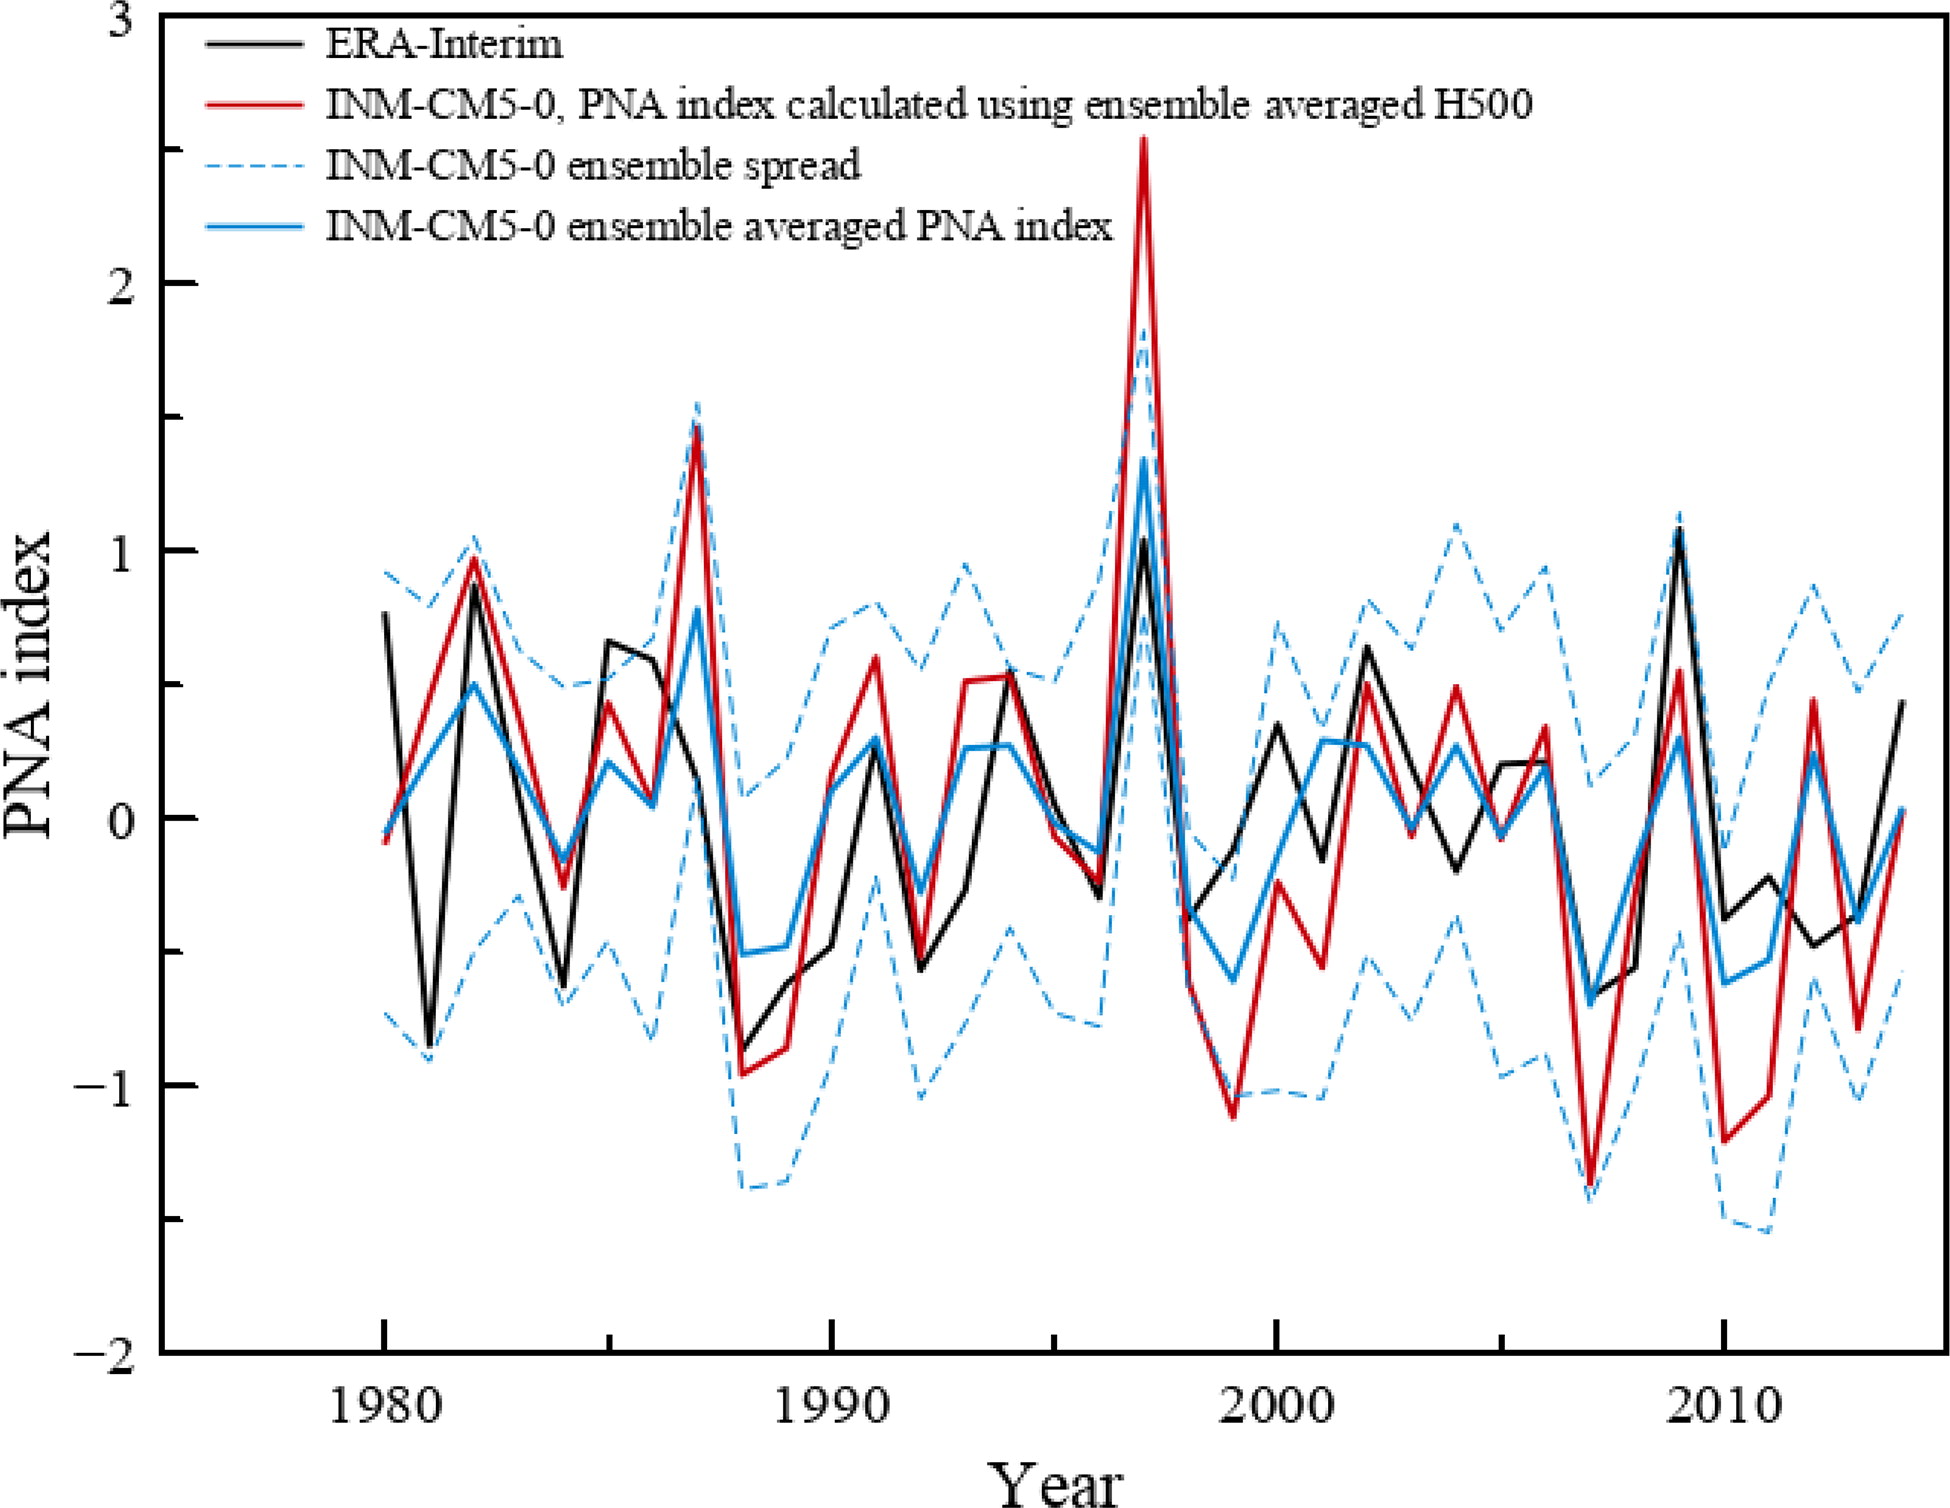
Fig. 6.
Time series of DJF PNA index. Maximum and minimum of the INMCM 10-member ensemble are shown as a blue dashed lines, ensemble mean is presented as a blue solid line. PNA index calculated using ensemble averaged 500 mb geopotential height anomaly is plotted in red. The ERA-Interim PNA index is shown in black.
Table 3.
Table summarizing the correlation coefficients of the model and ERA-Interim reanalysis PNA indices for DJF-month averages and for each month from November to February of the period 1980–2015.
Table 4.
Model and reanalysis PNA indices for winter months of the years with the strongest El Niño and La Niña events during the period of 1980–2014.
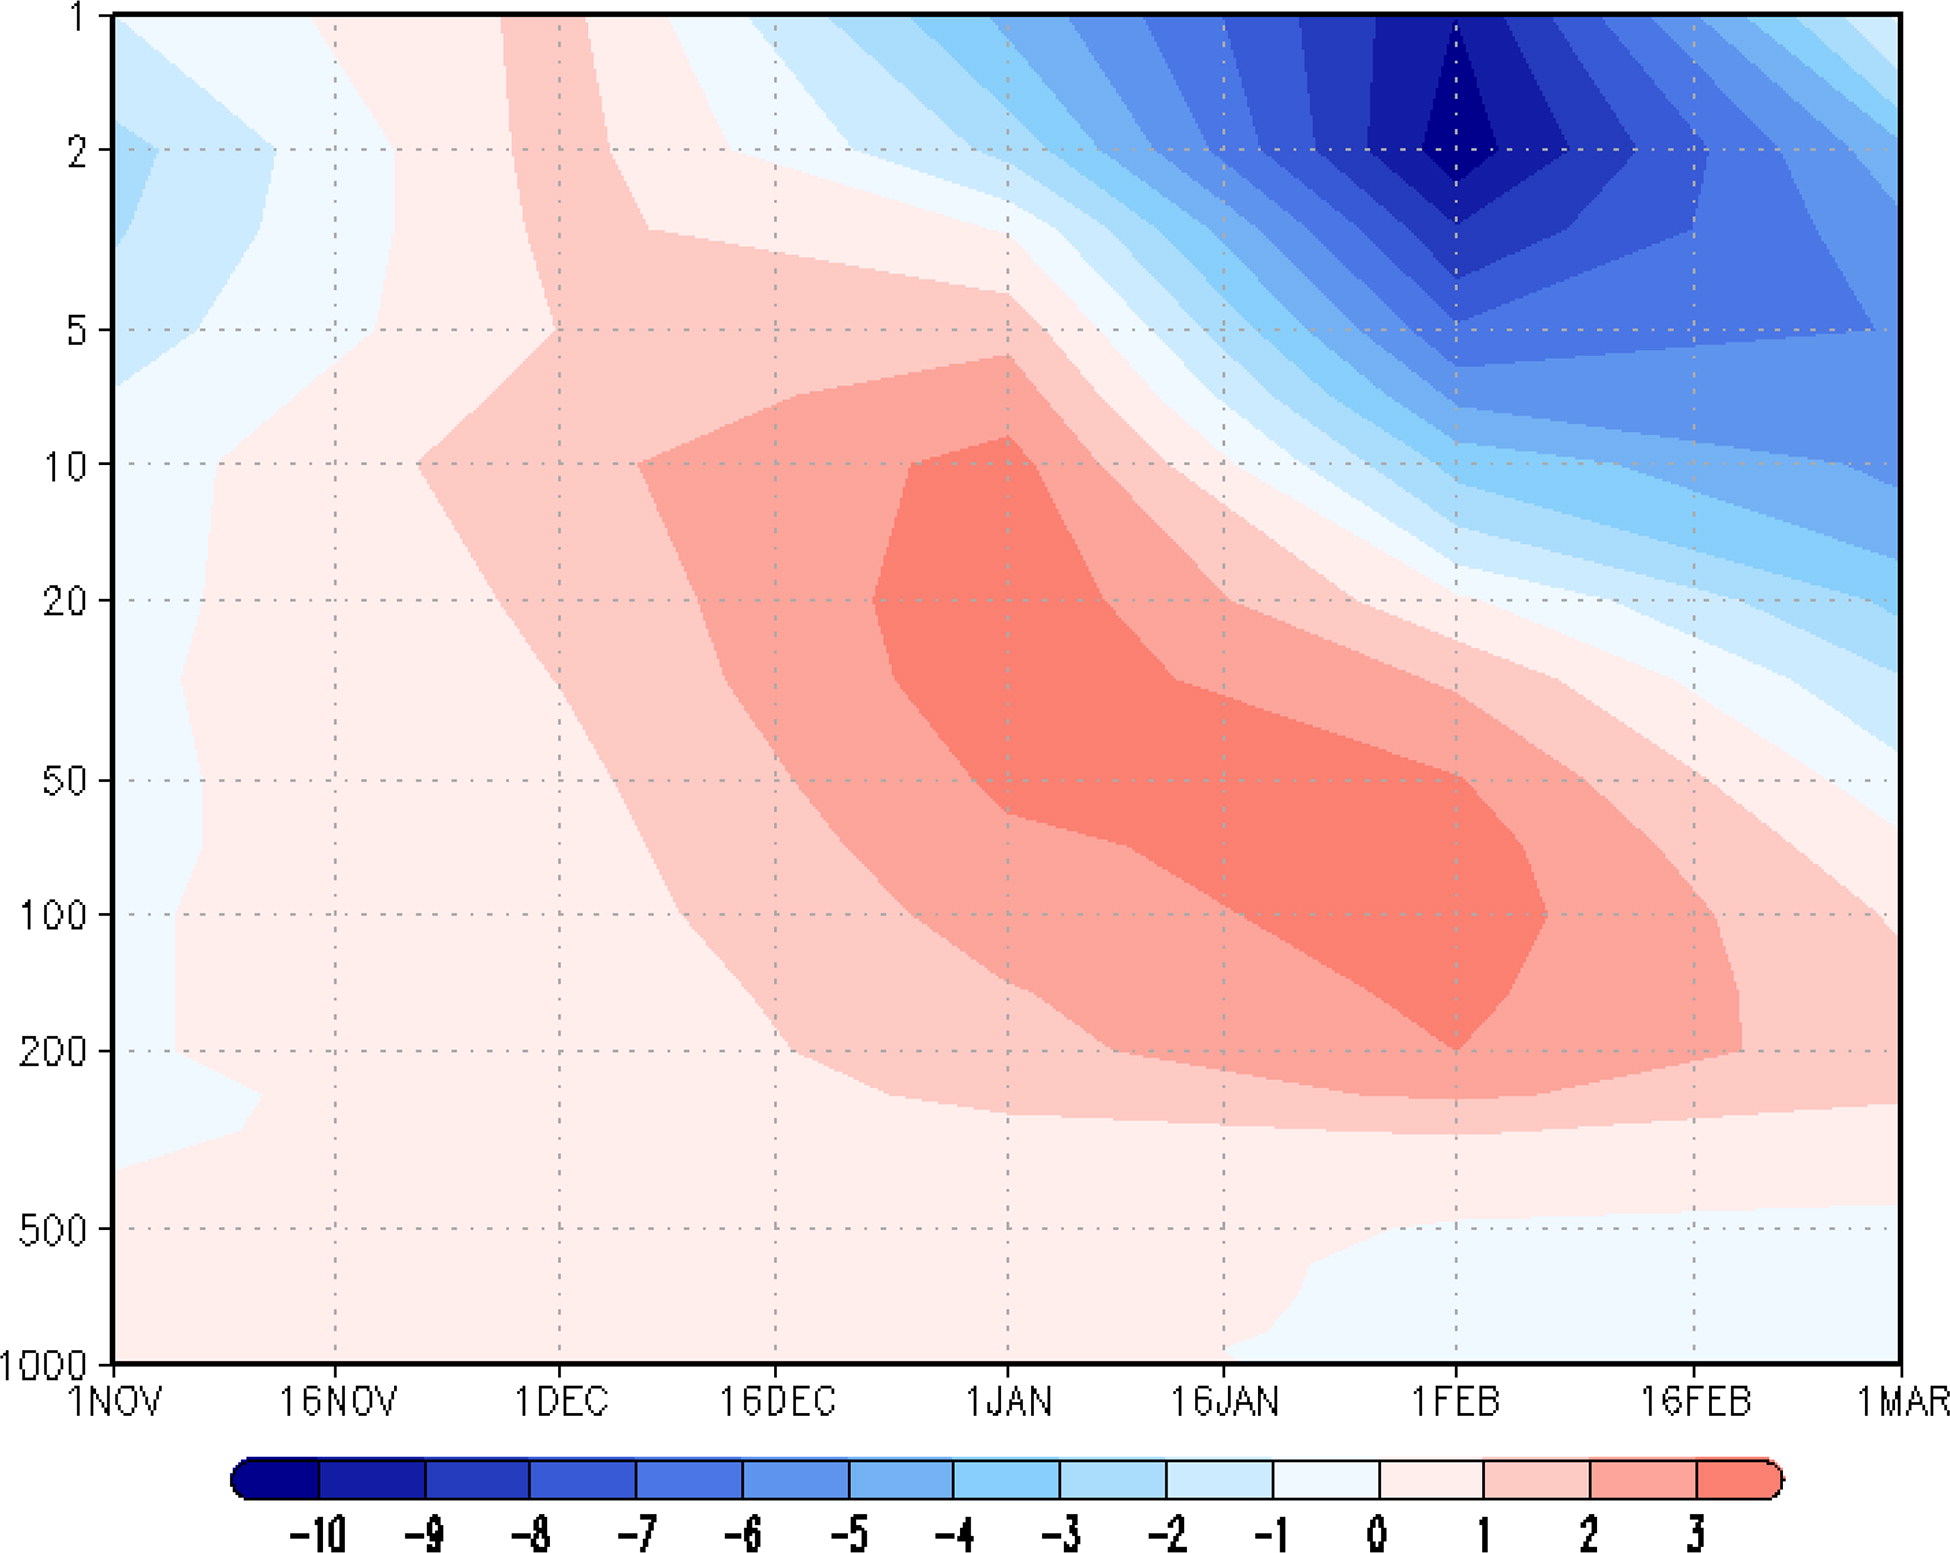
Fig. 7.
The first EOF of monthly mean air temperature calculated from ERA-Interim reanalysis data (1980–2015) in the Northern Hemisphere at the pressure levels from 1000 to 1 hPa averaged for the latitudinal zone from 60° to 88° N.
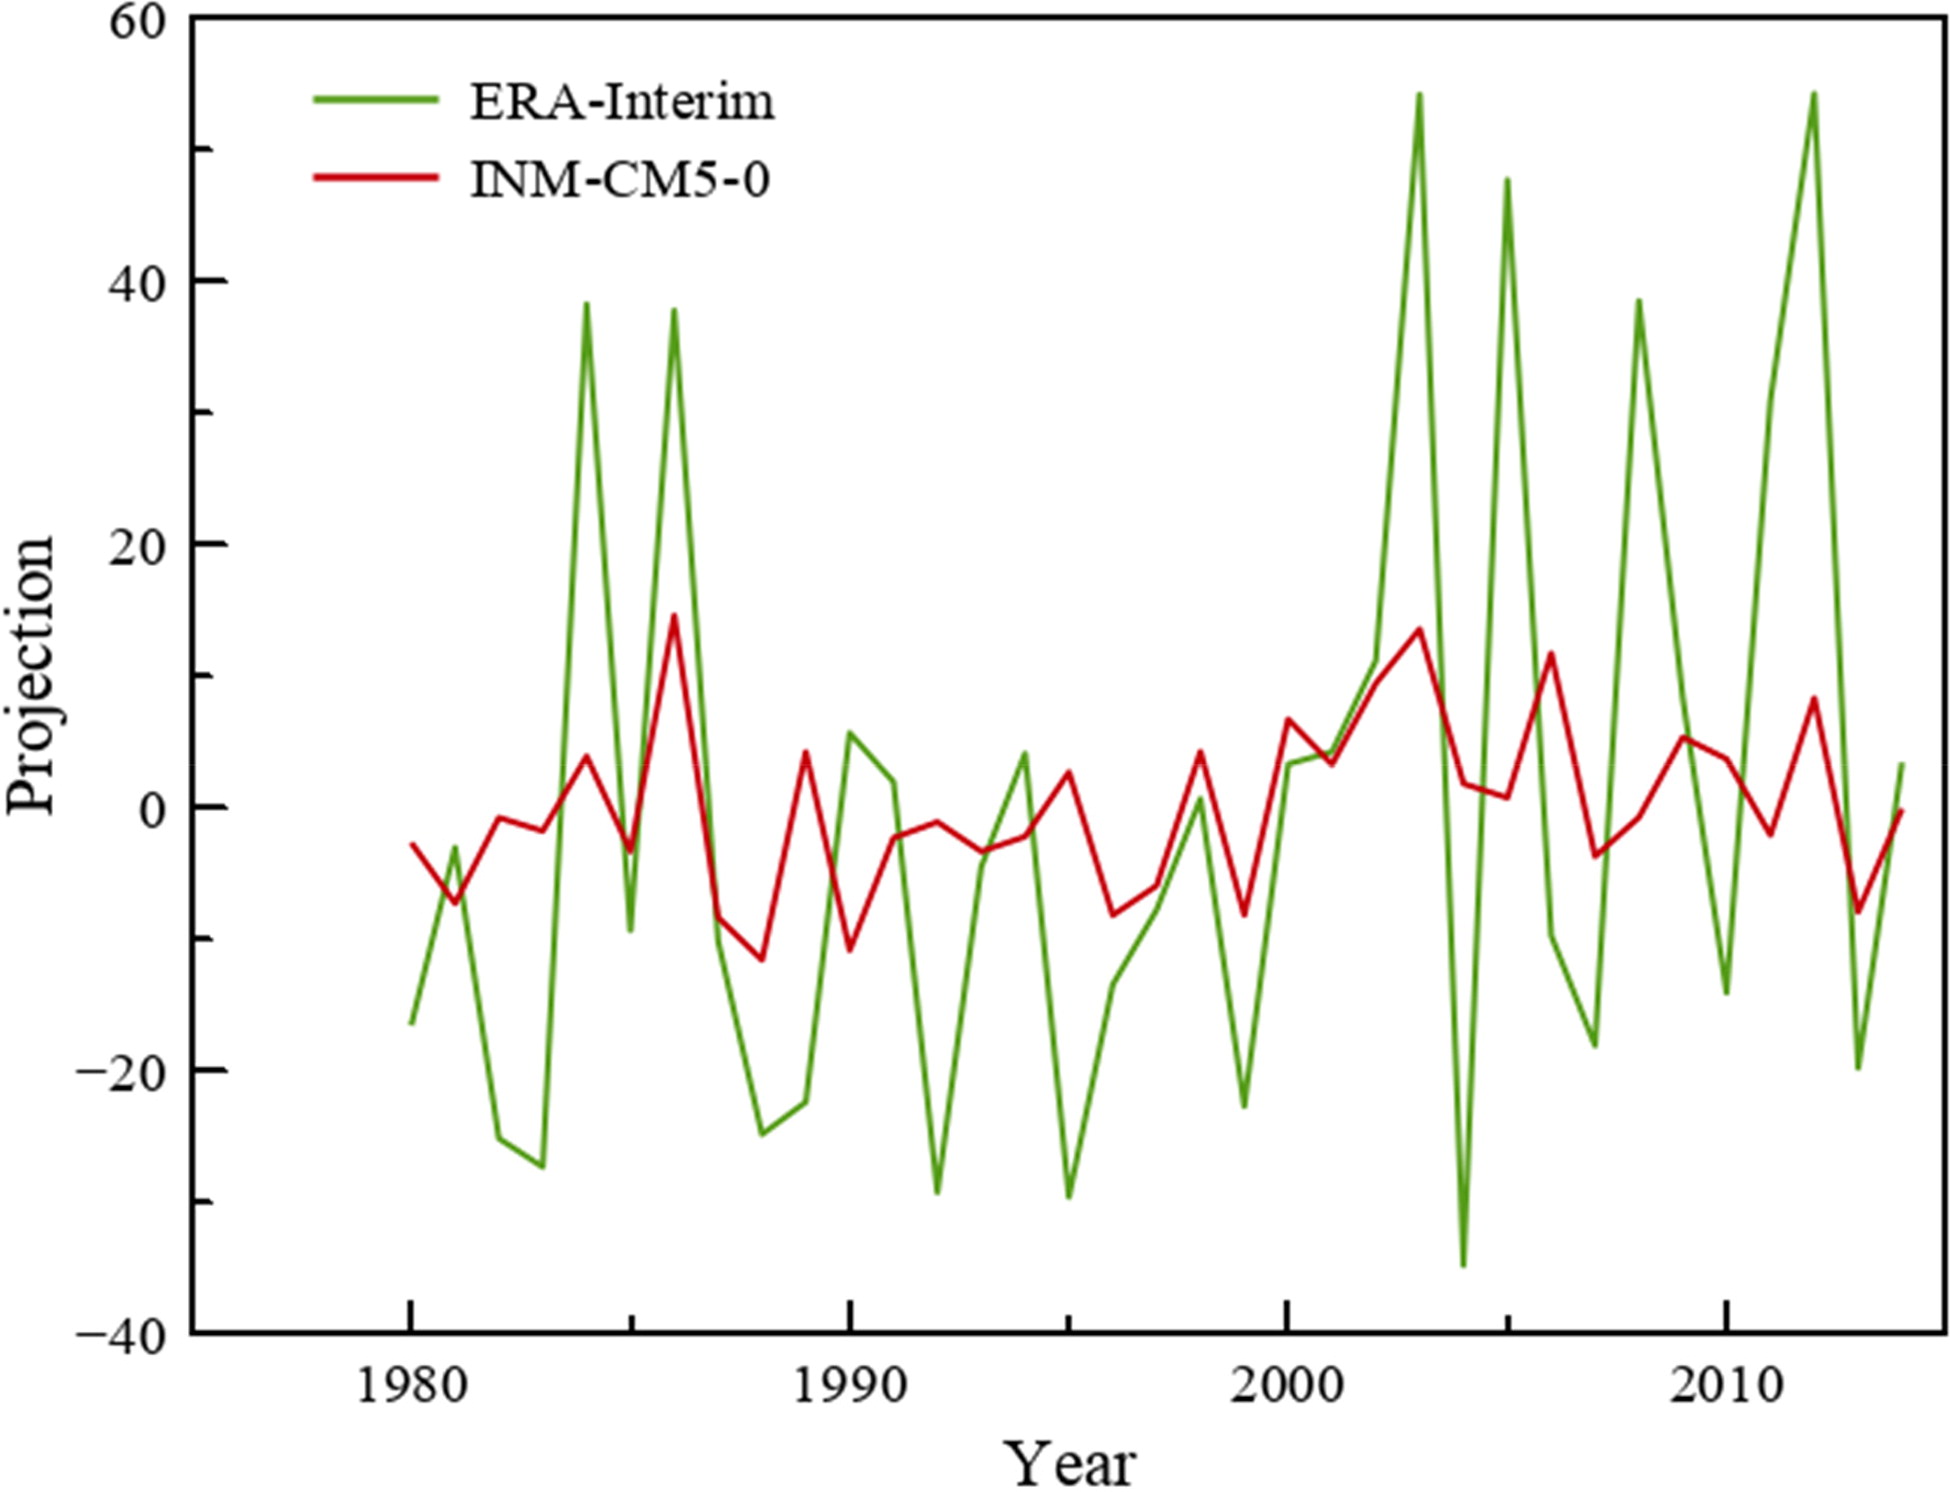
Fig. 8.
The projection coefficient of the ensemble averaged monthly mean air temperature anomaly to the first EOF of reanalysis data for each winter season during the period of 1980–2014 for the INM-CM5-0 (shown in red) and a similar projection for reanalysis (plotted in green). Monthly mean air temperature was averaged along the circle of latitudes and for the zone from 60° to 88° N.
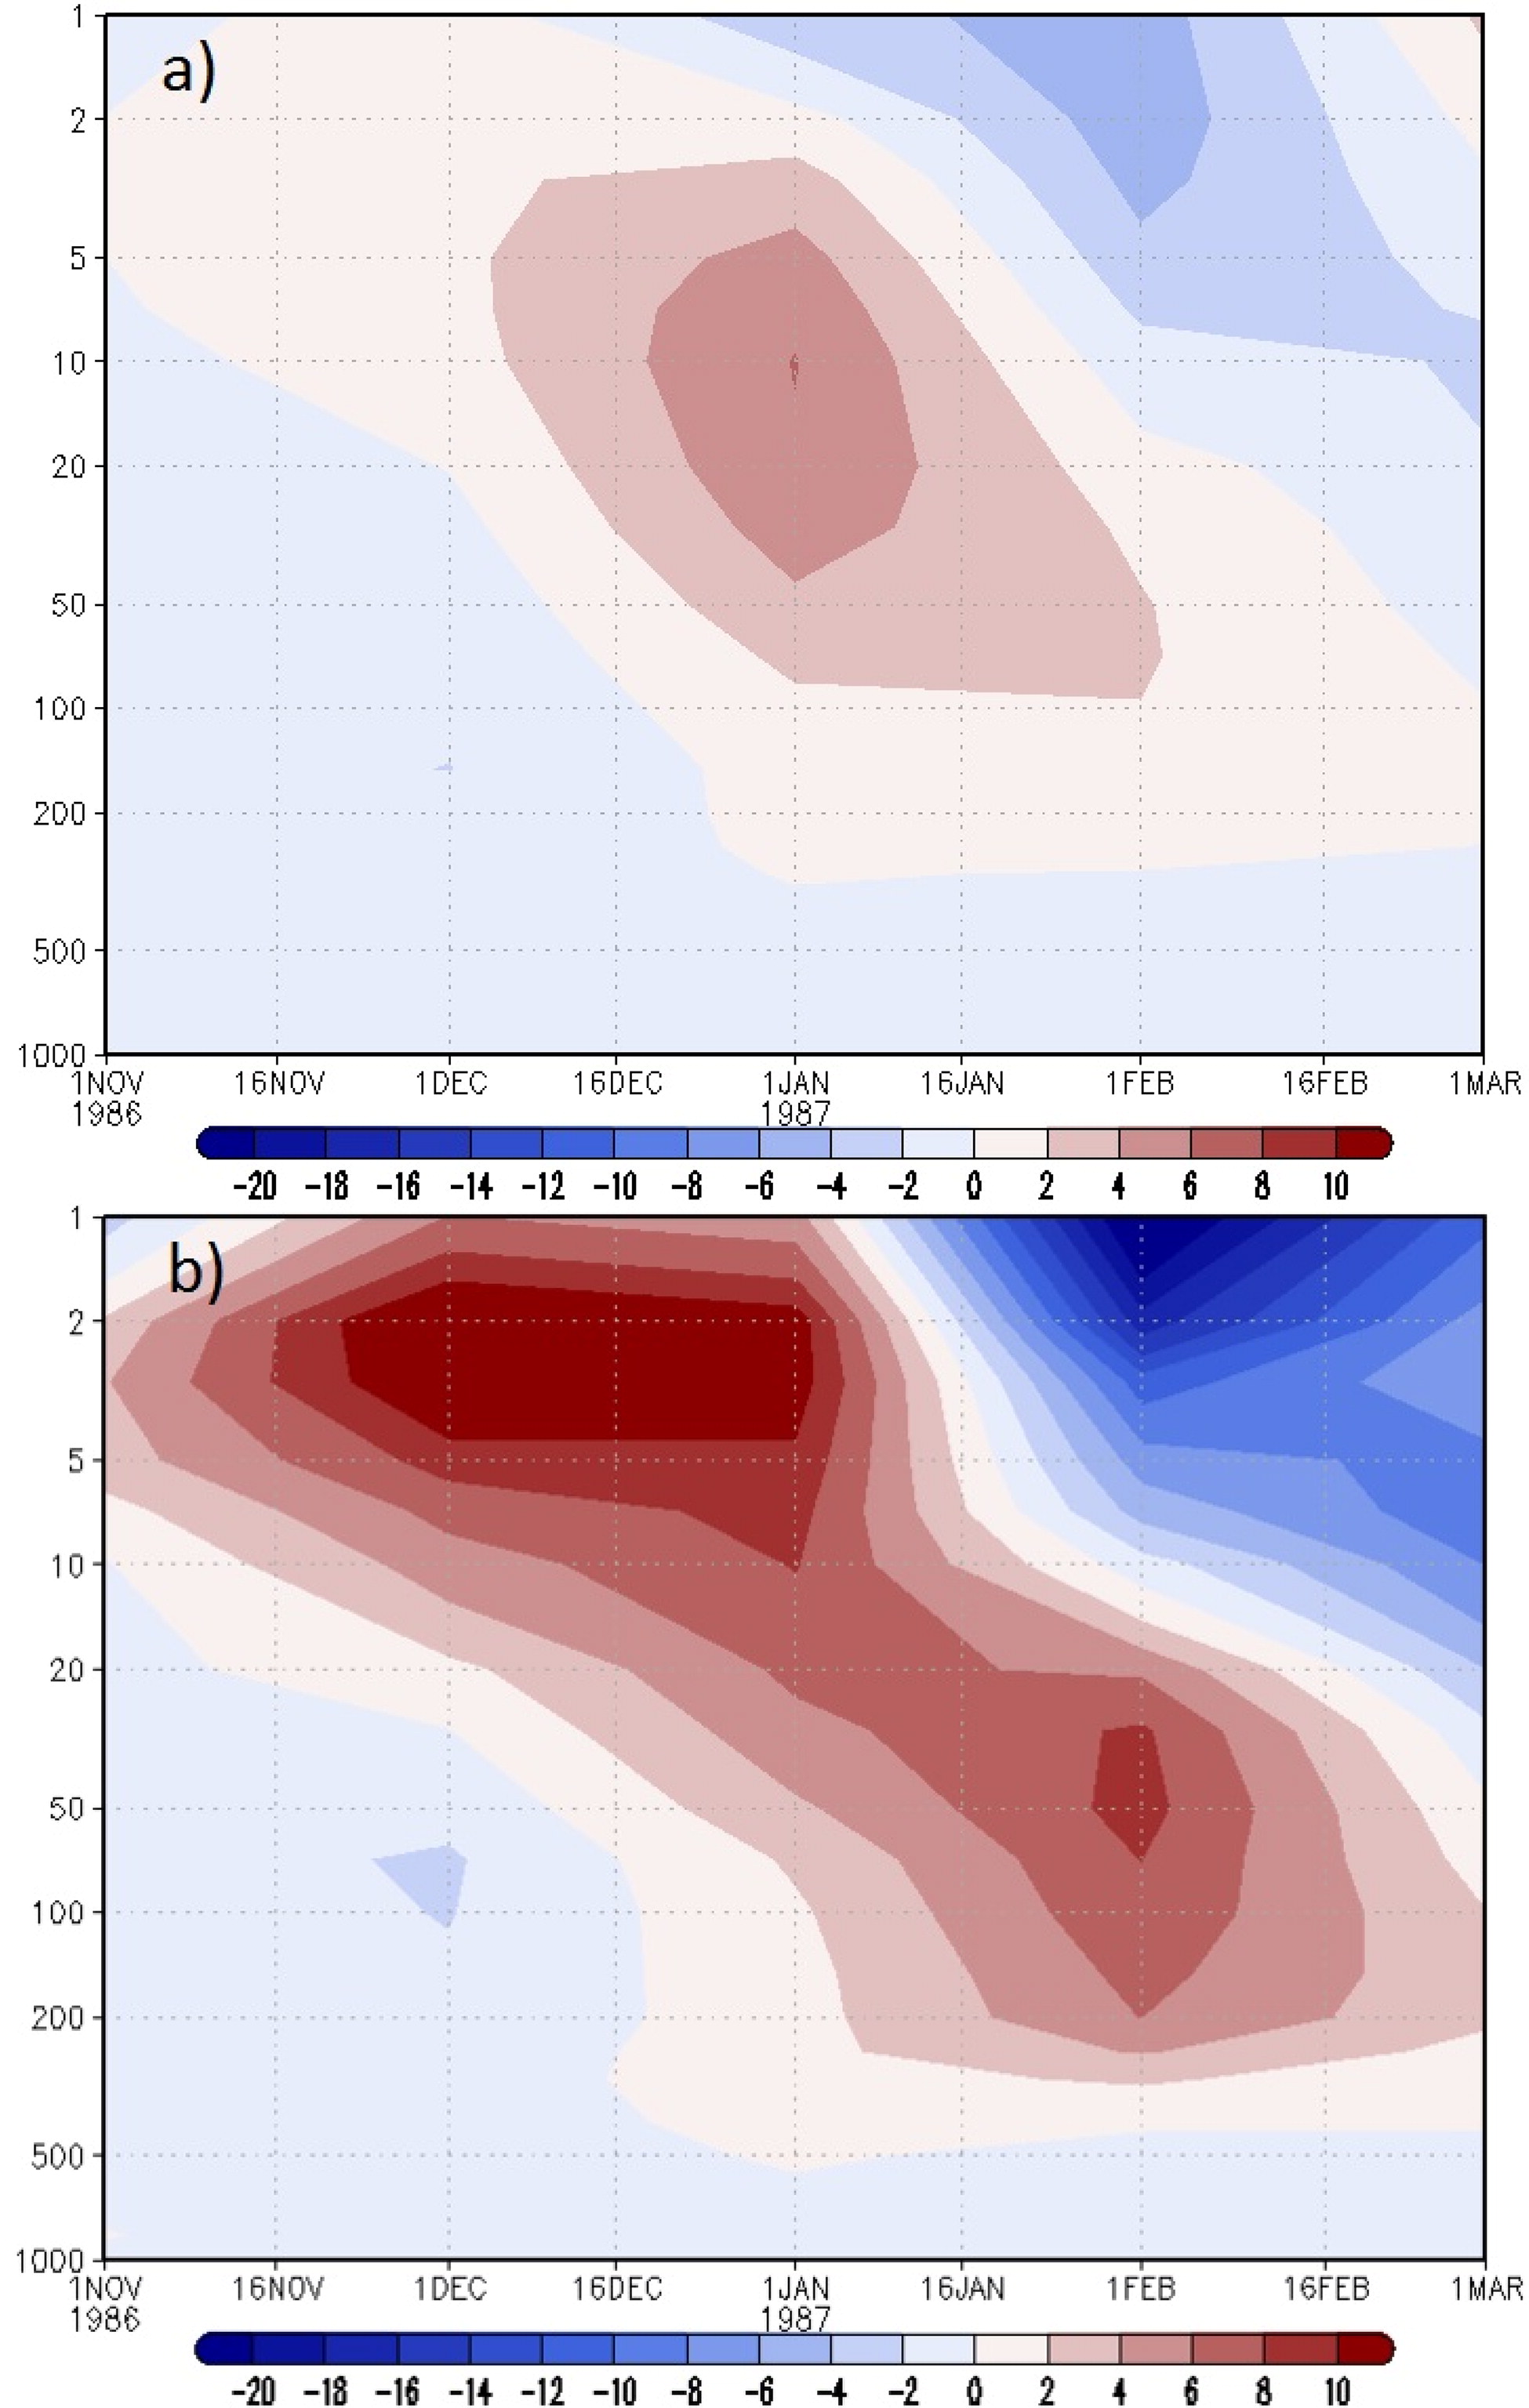
Fig. 9.
The vertical distribution of air temperature anomaly for: a) INM-CM5-0 ensemble averaged data; b) ERA-Interim reanalysis during the period of November 1986–March 1987. Anomalies are averaged along the circle of latitudes and for the zone from 60° to 88° N.
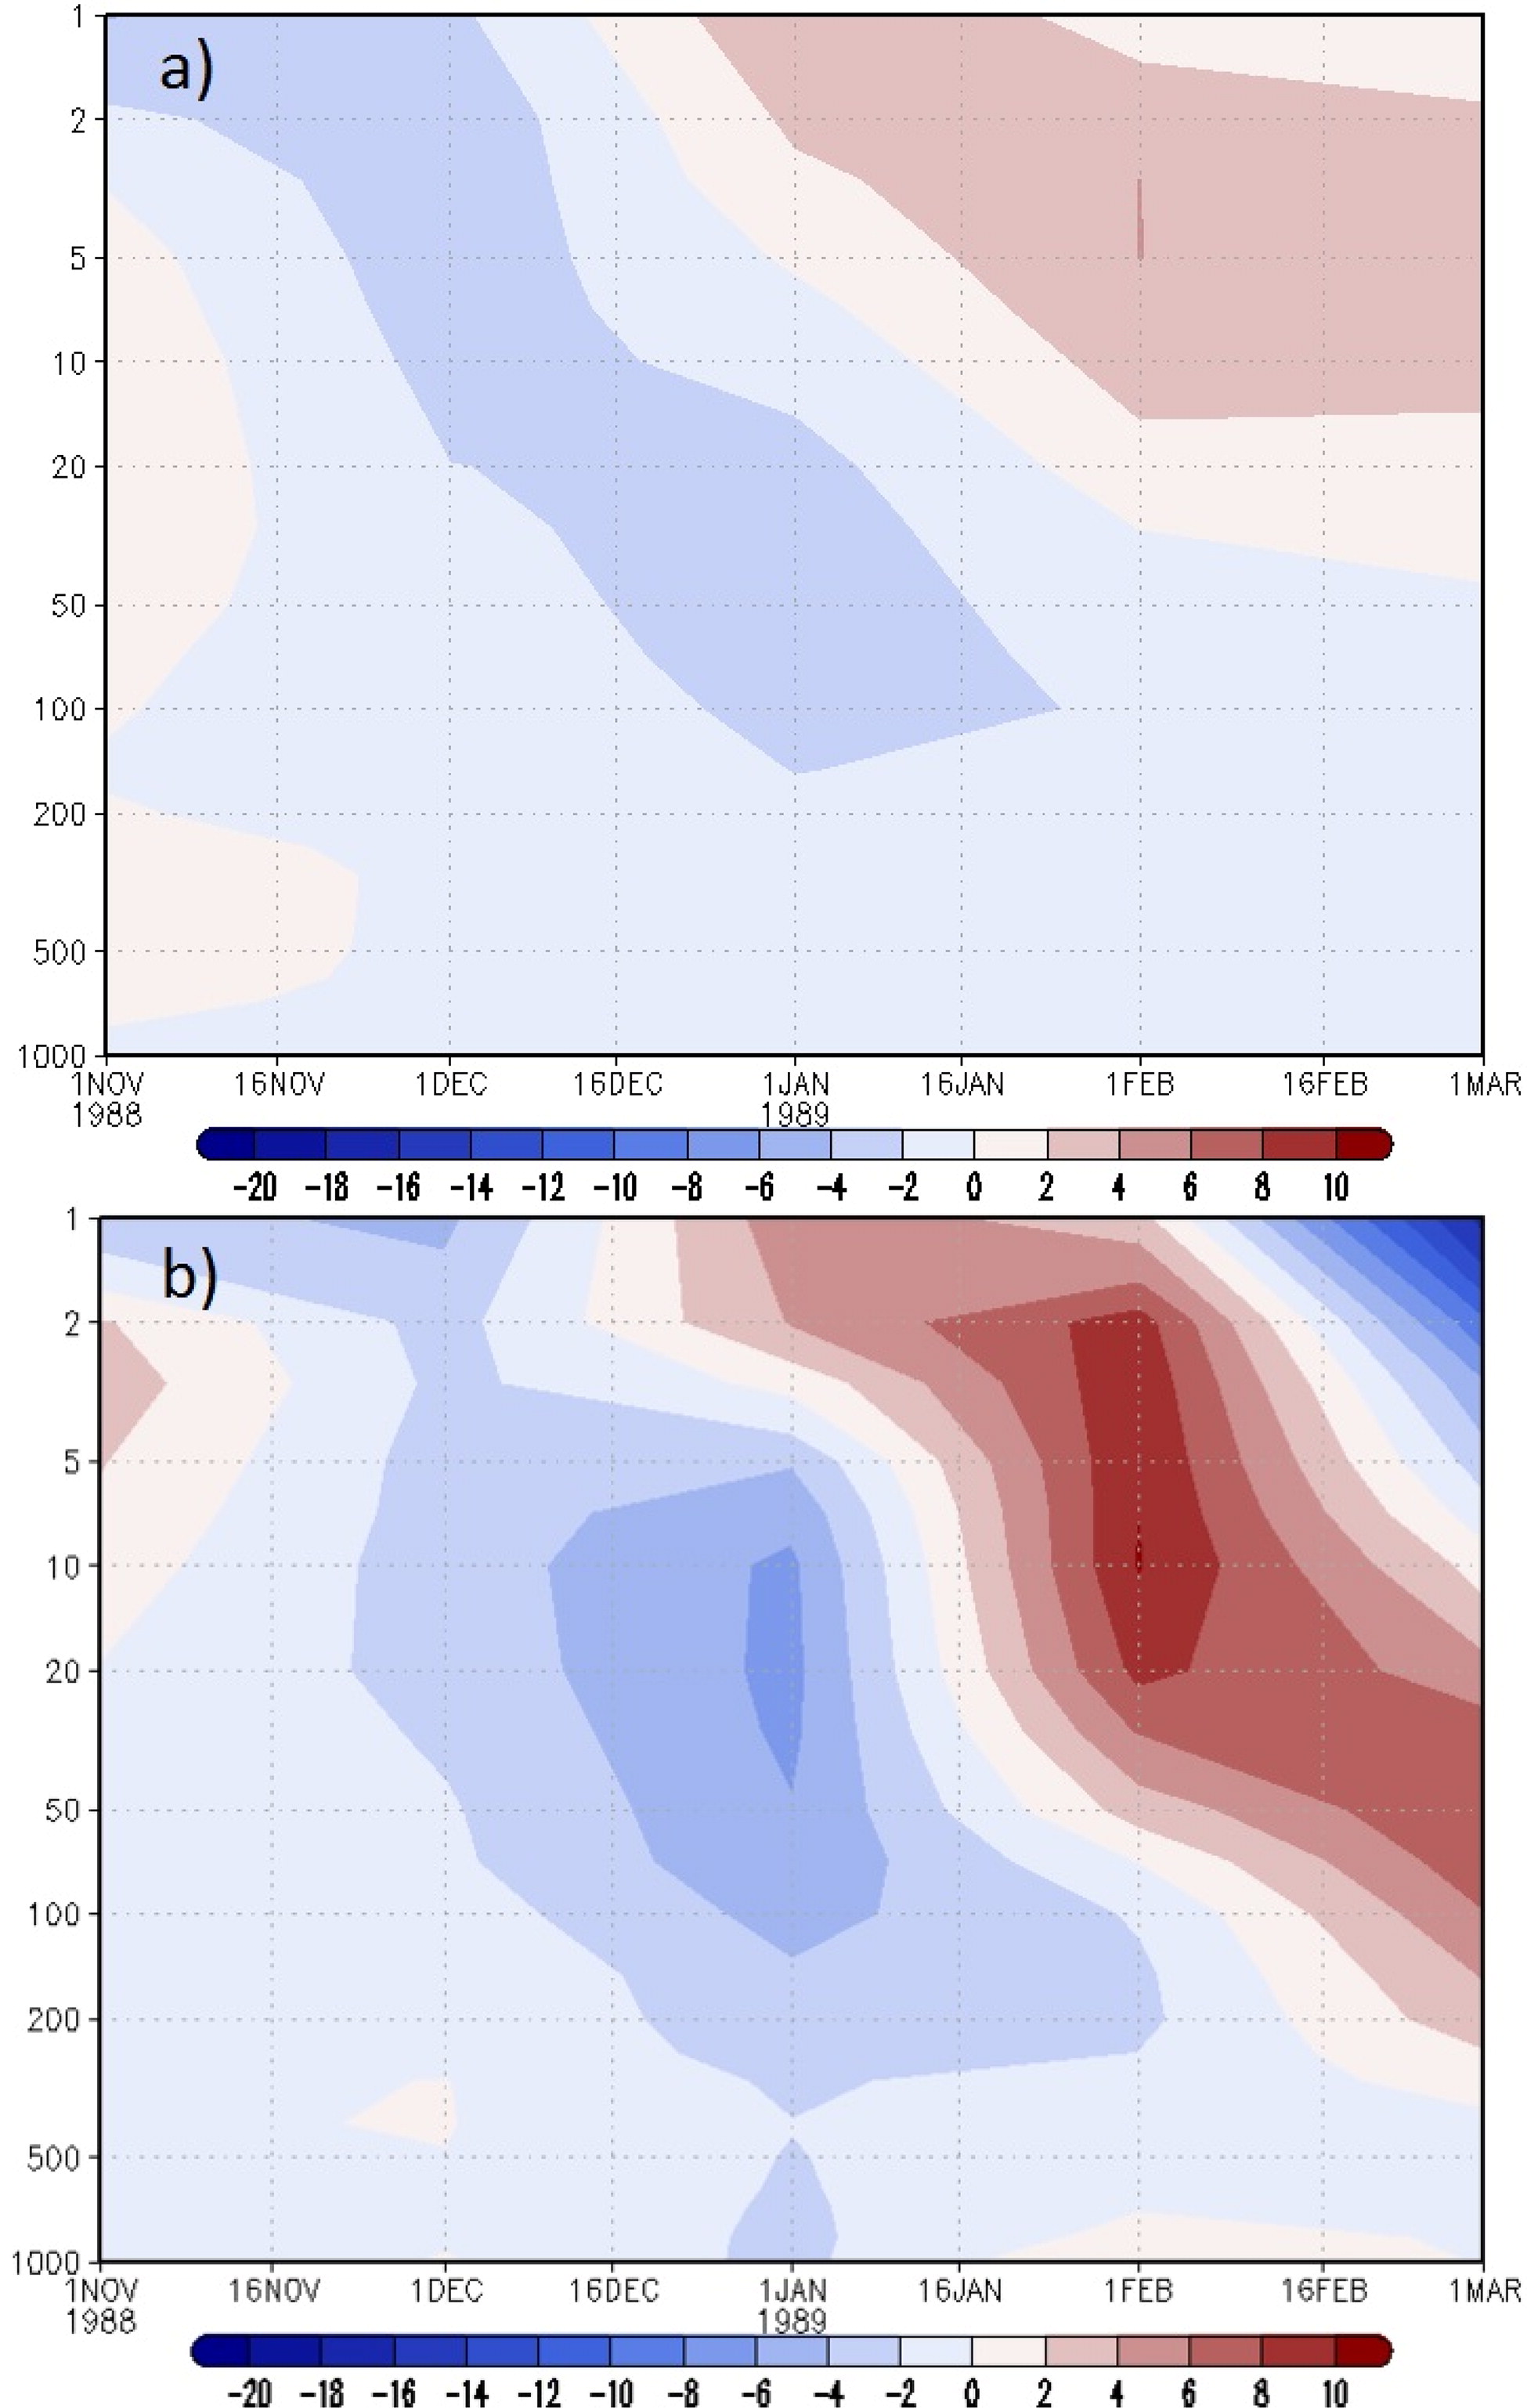
Fig. 10.
The vertical distribution of air temperature anomaly for: a) INM-CM5-0 ensemble averaged data; b) ERA-Interim reanalysis during the period of November 1988–March 1989. Anomalies are averaged along the circle of latitudes and for the zone from 60° to 88° N.