
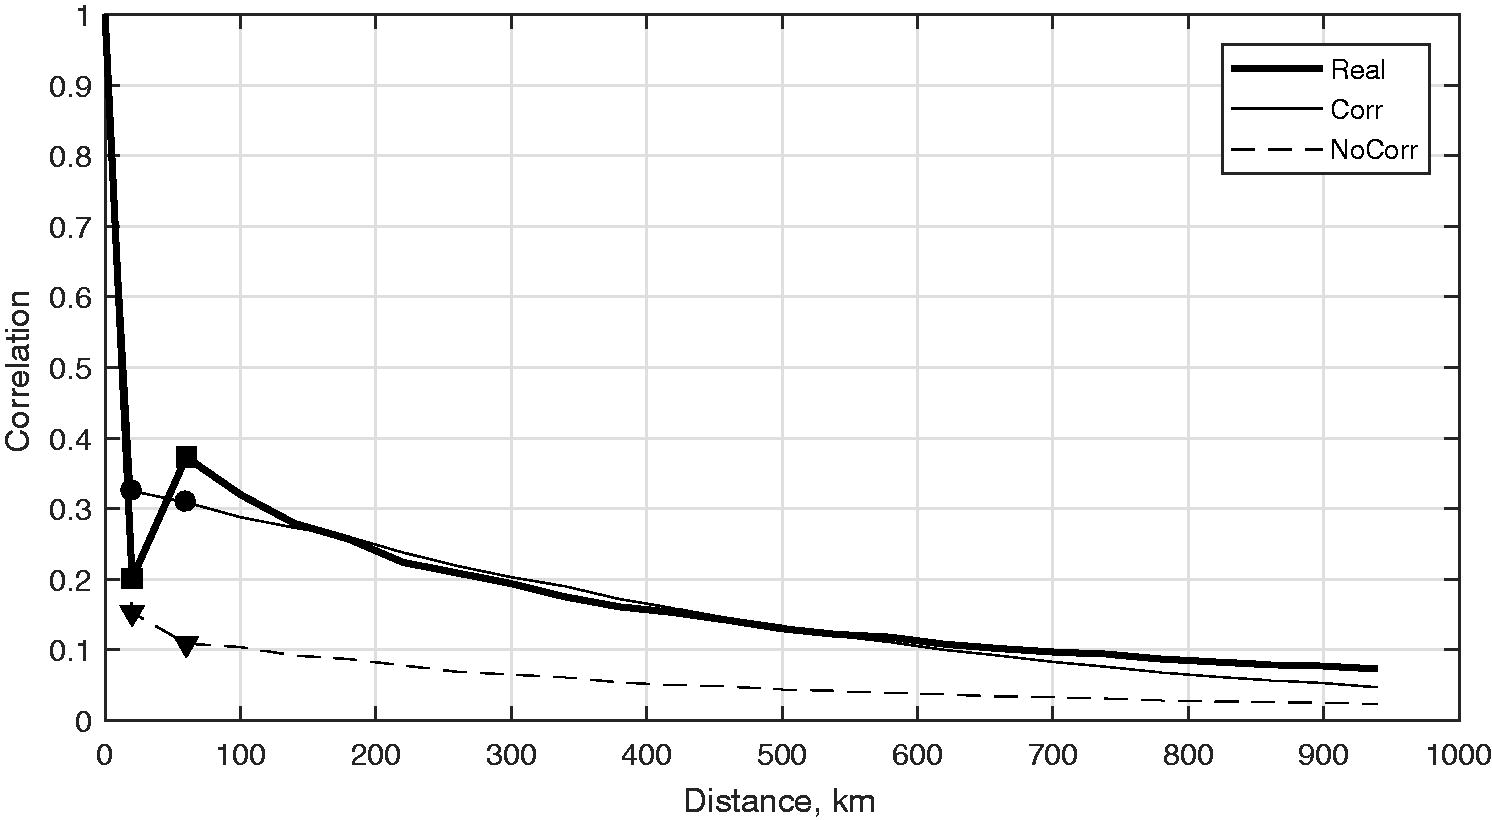
Fig. 1.
Horizontal correlation of AMSU-A NOAA-18 channel 5 observation innovations as a function of distance (km) calculated for the month of July. Heavy line, Real case; thin line, Corr case; dashed line, NoCorr case. Markers indicate sample size less than 100 observations per month.
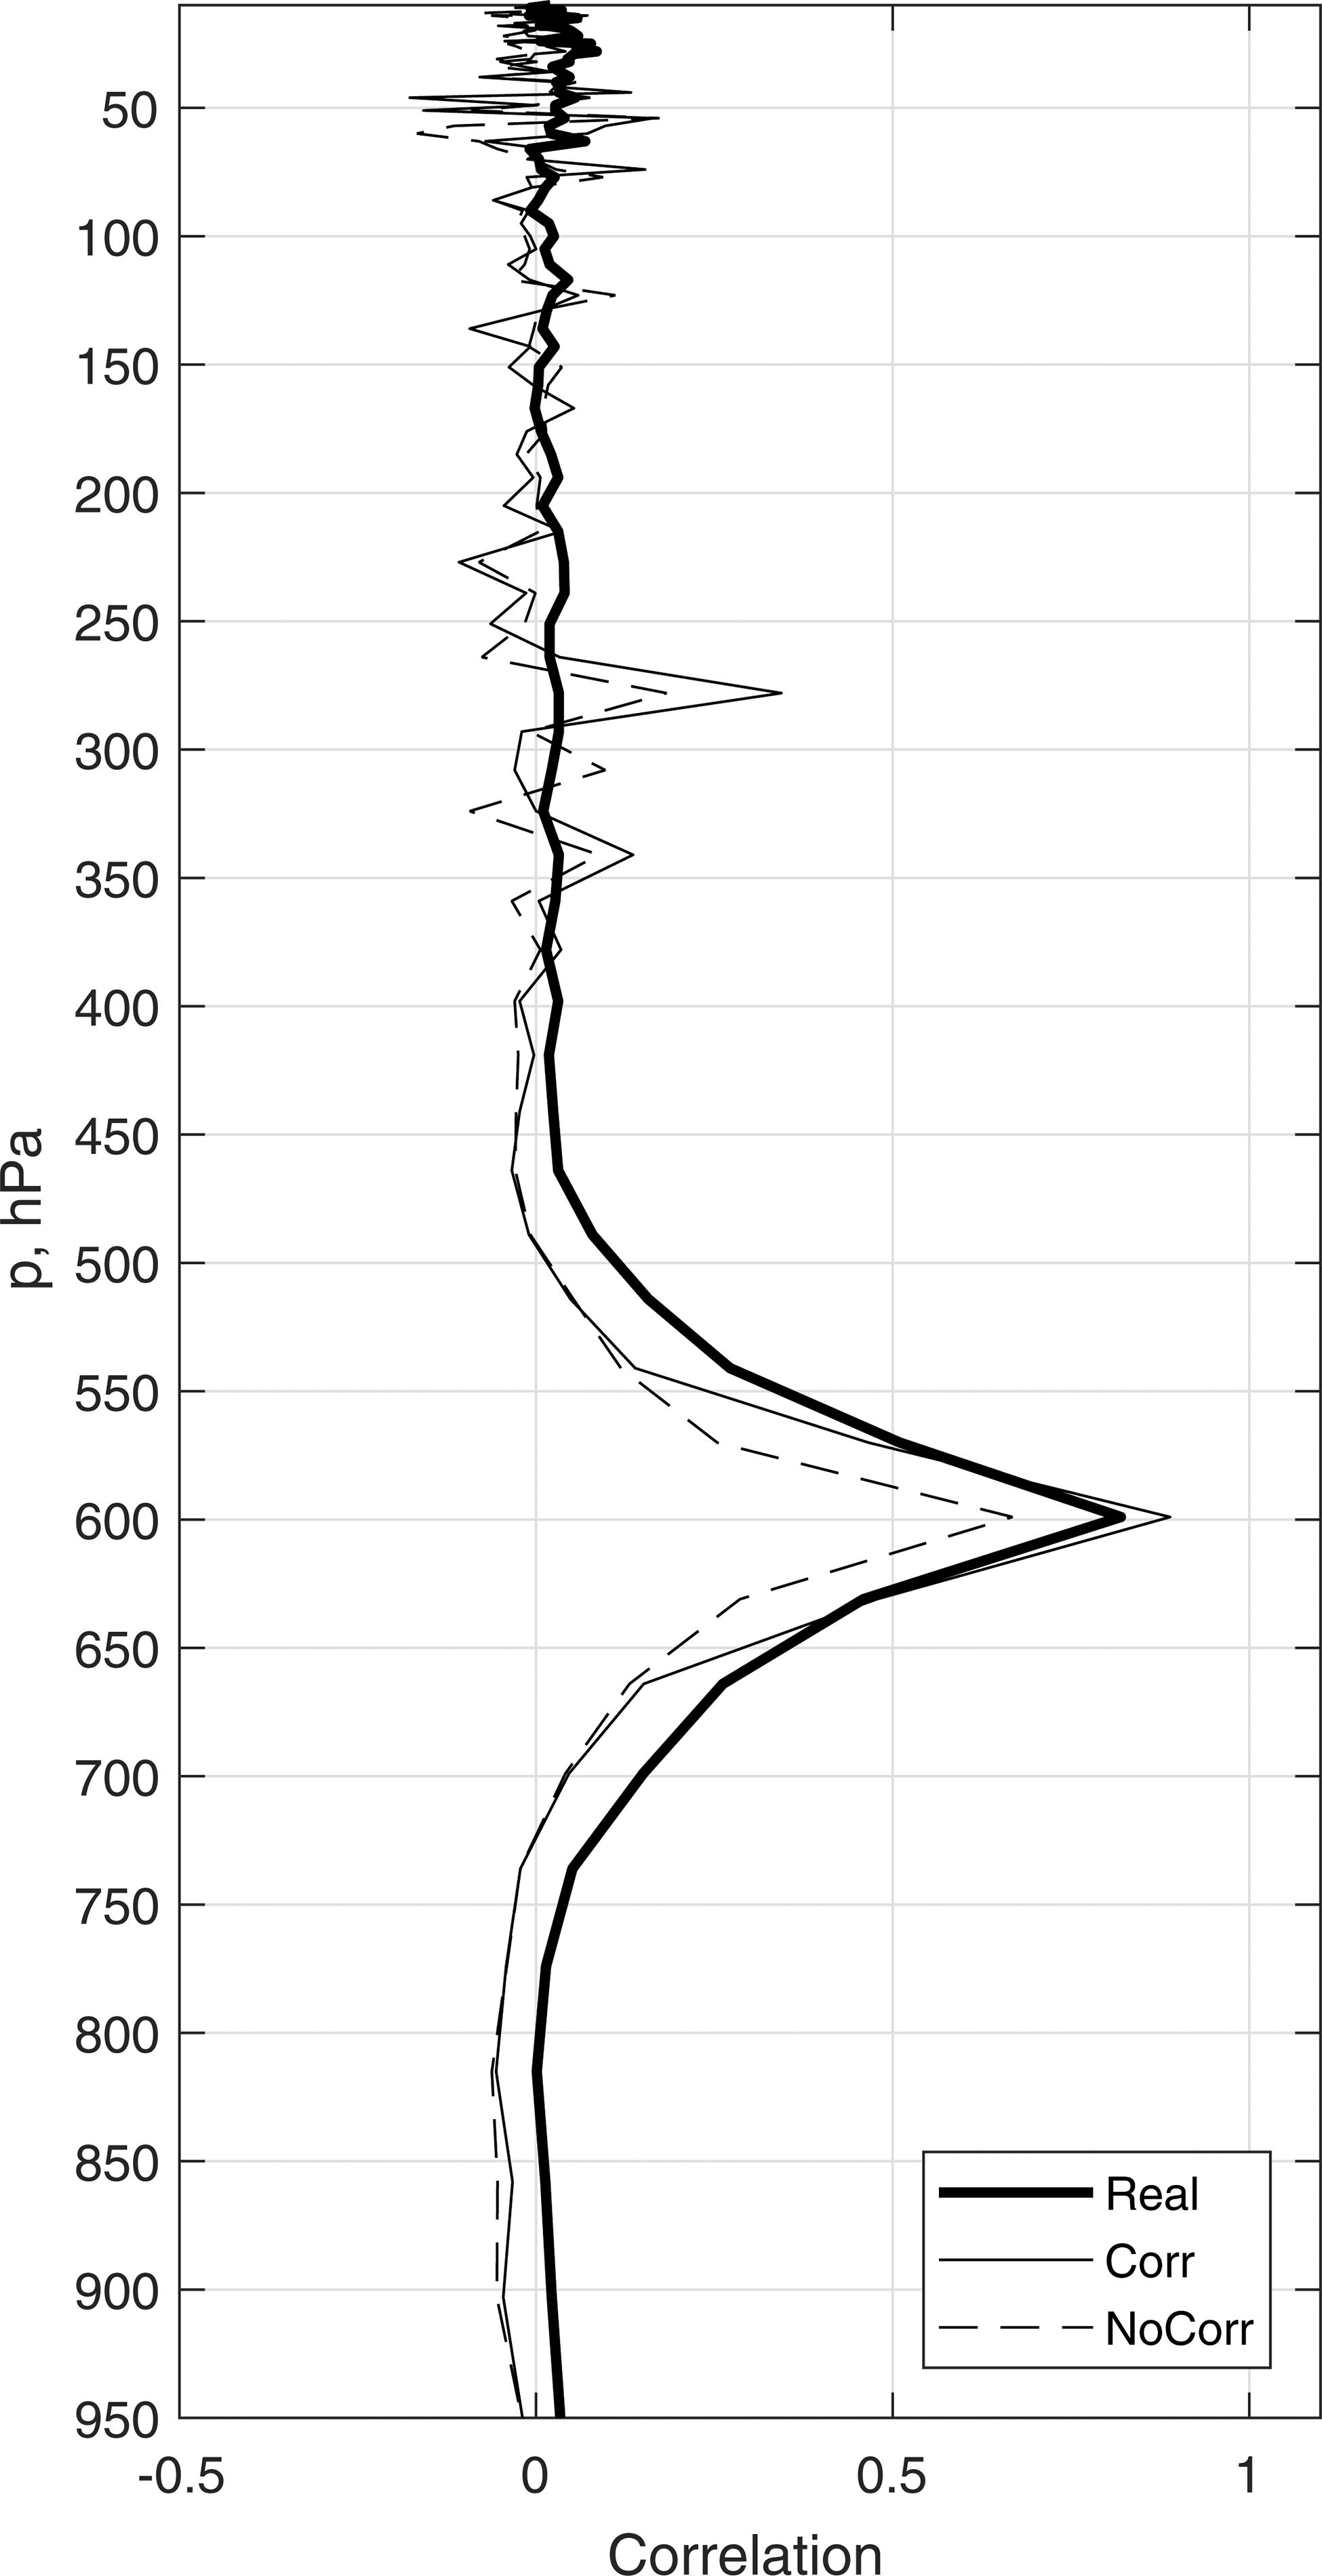
Fig. 2.
Vertical correlation of rawinsonde temperature observation innovations as a function of pressure (hPa) for correlations against innovations at 600 hPa. Twice daily data for the month of July. Heavy line, Real case; thin line, Corr case; dashed line, NoCorr case.
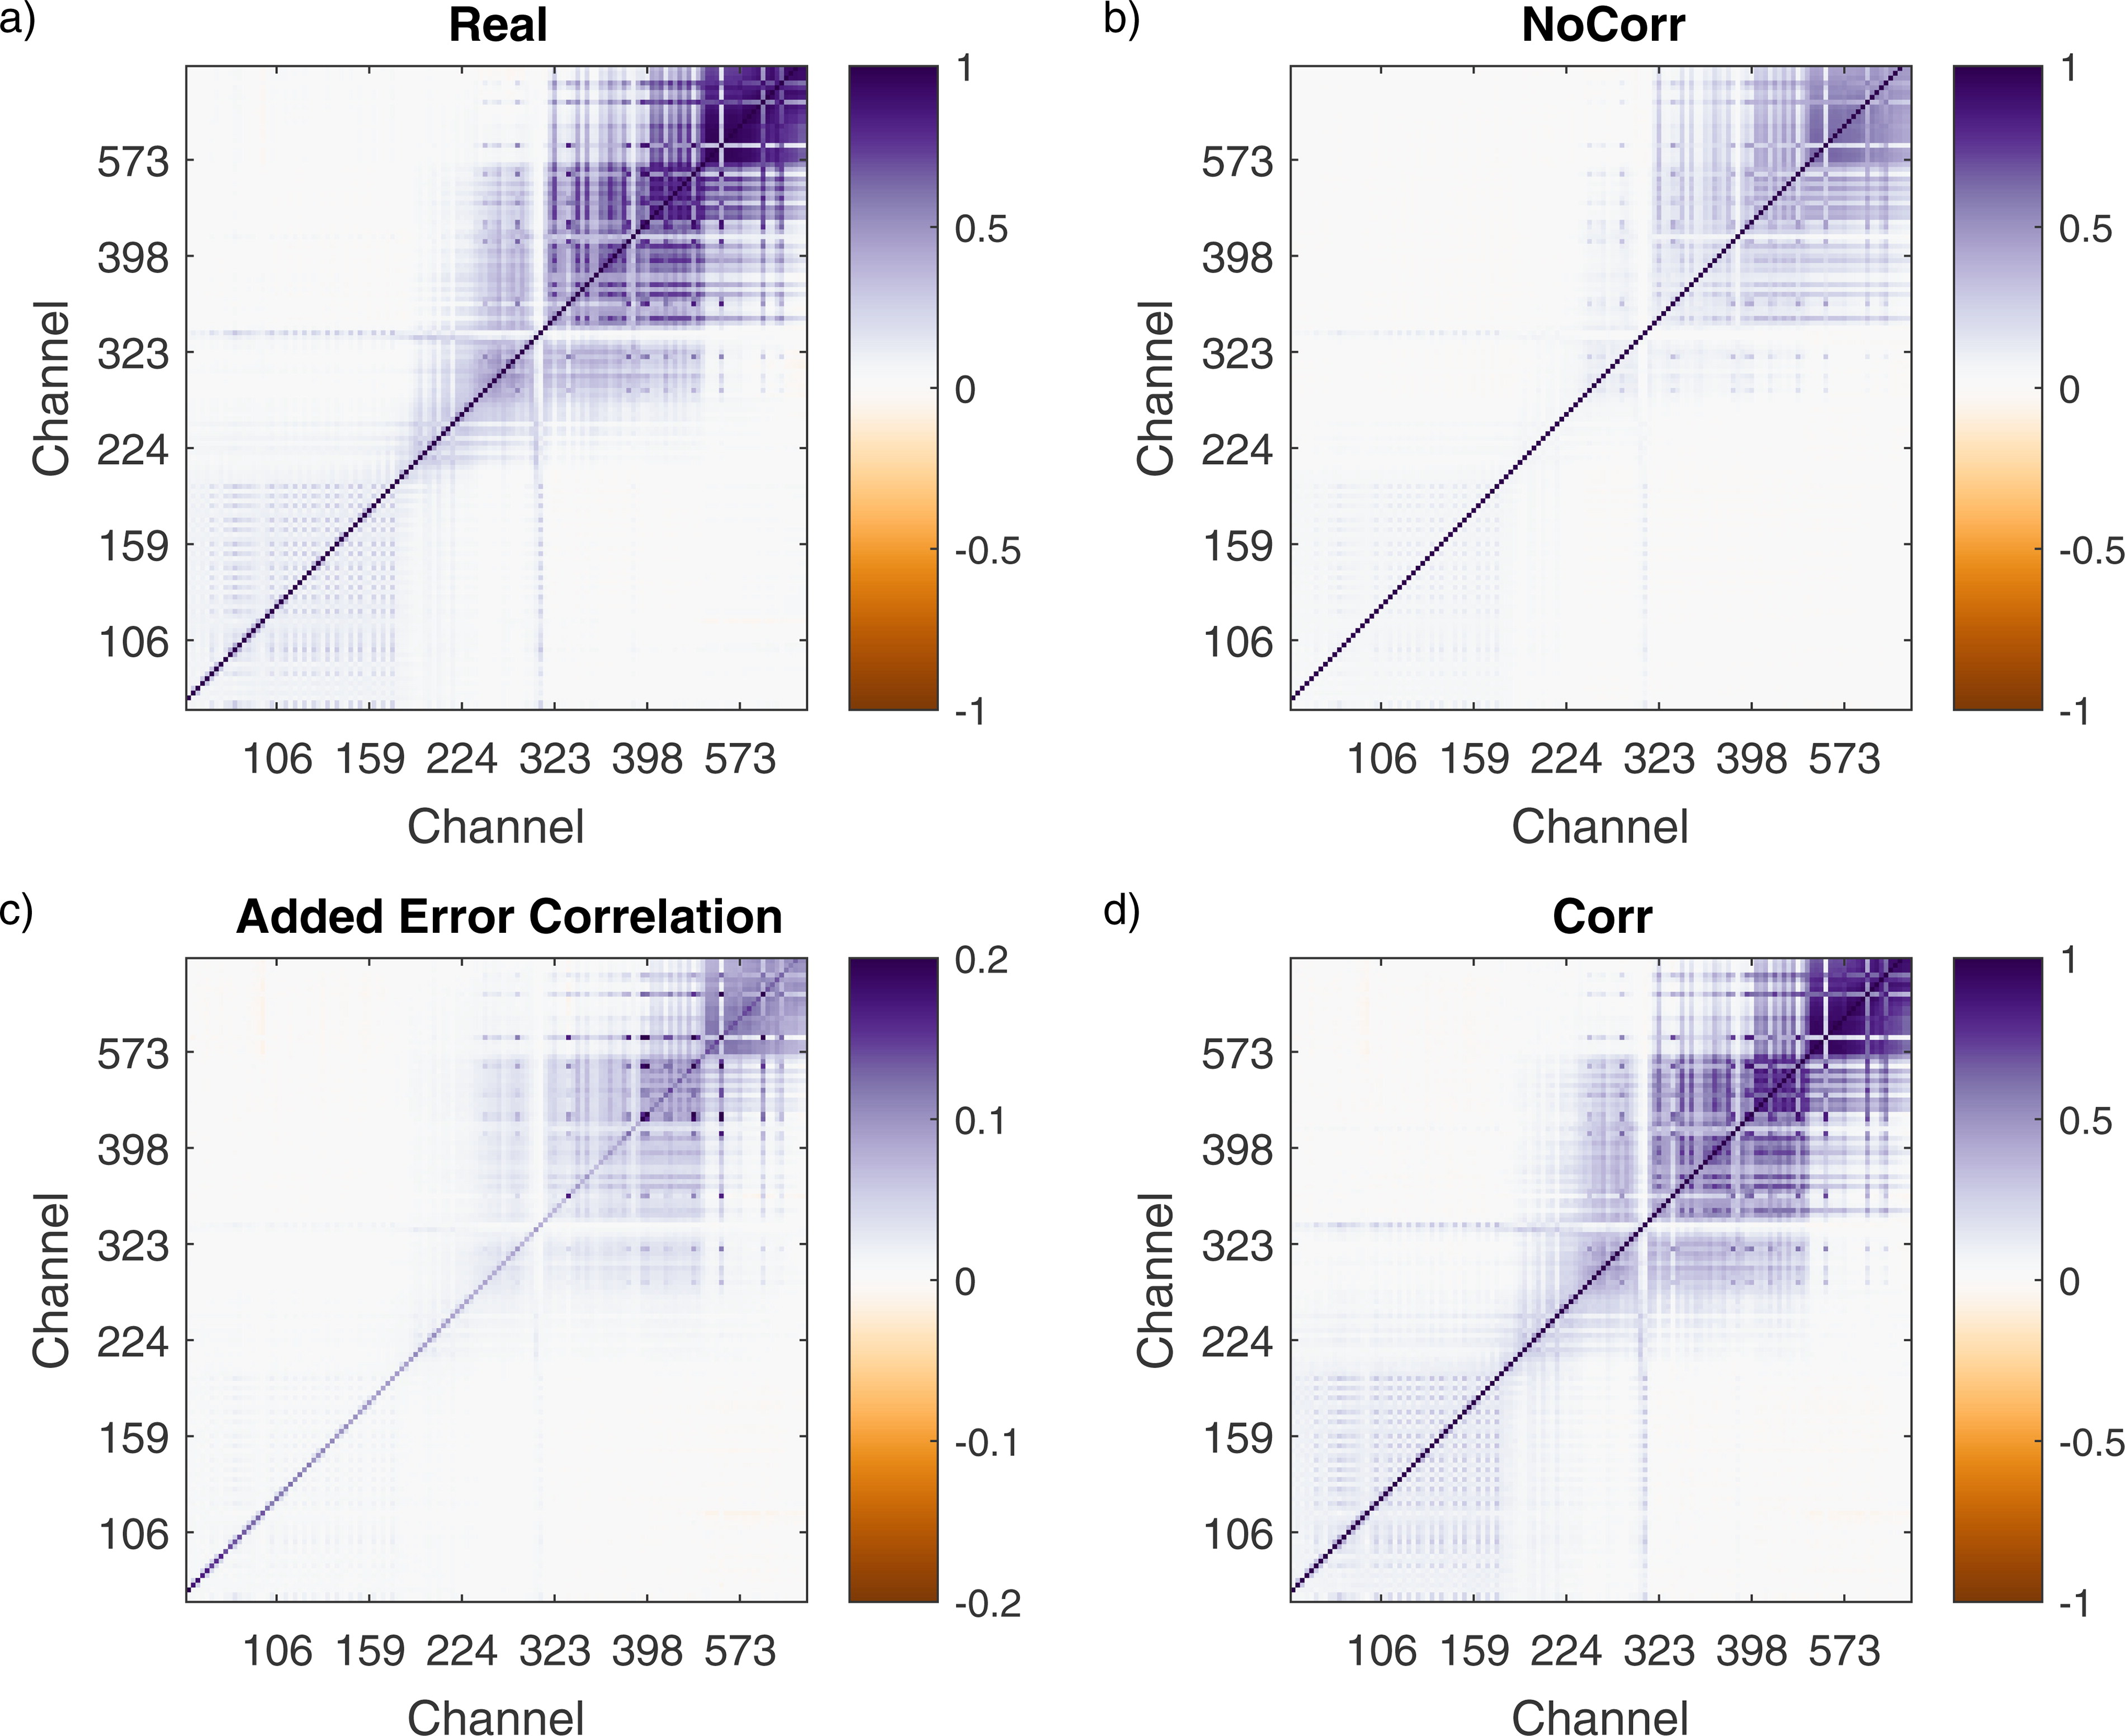
Fig. 3.
Channel correlations for IASI metop-a observation innovations. Twice daily data for the month of July. (a) Real case (O-F); (b) NoCorr case (O-F); (c) simulated error correlations added for Corr case; (d) Corr case (O-F).
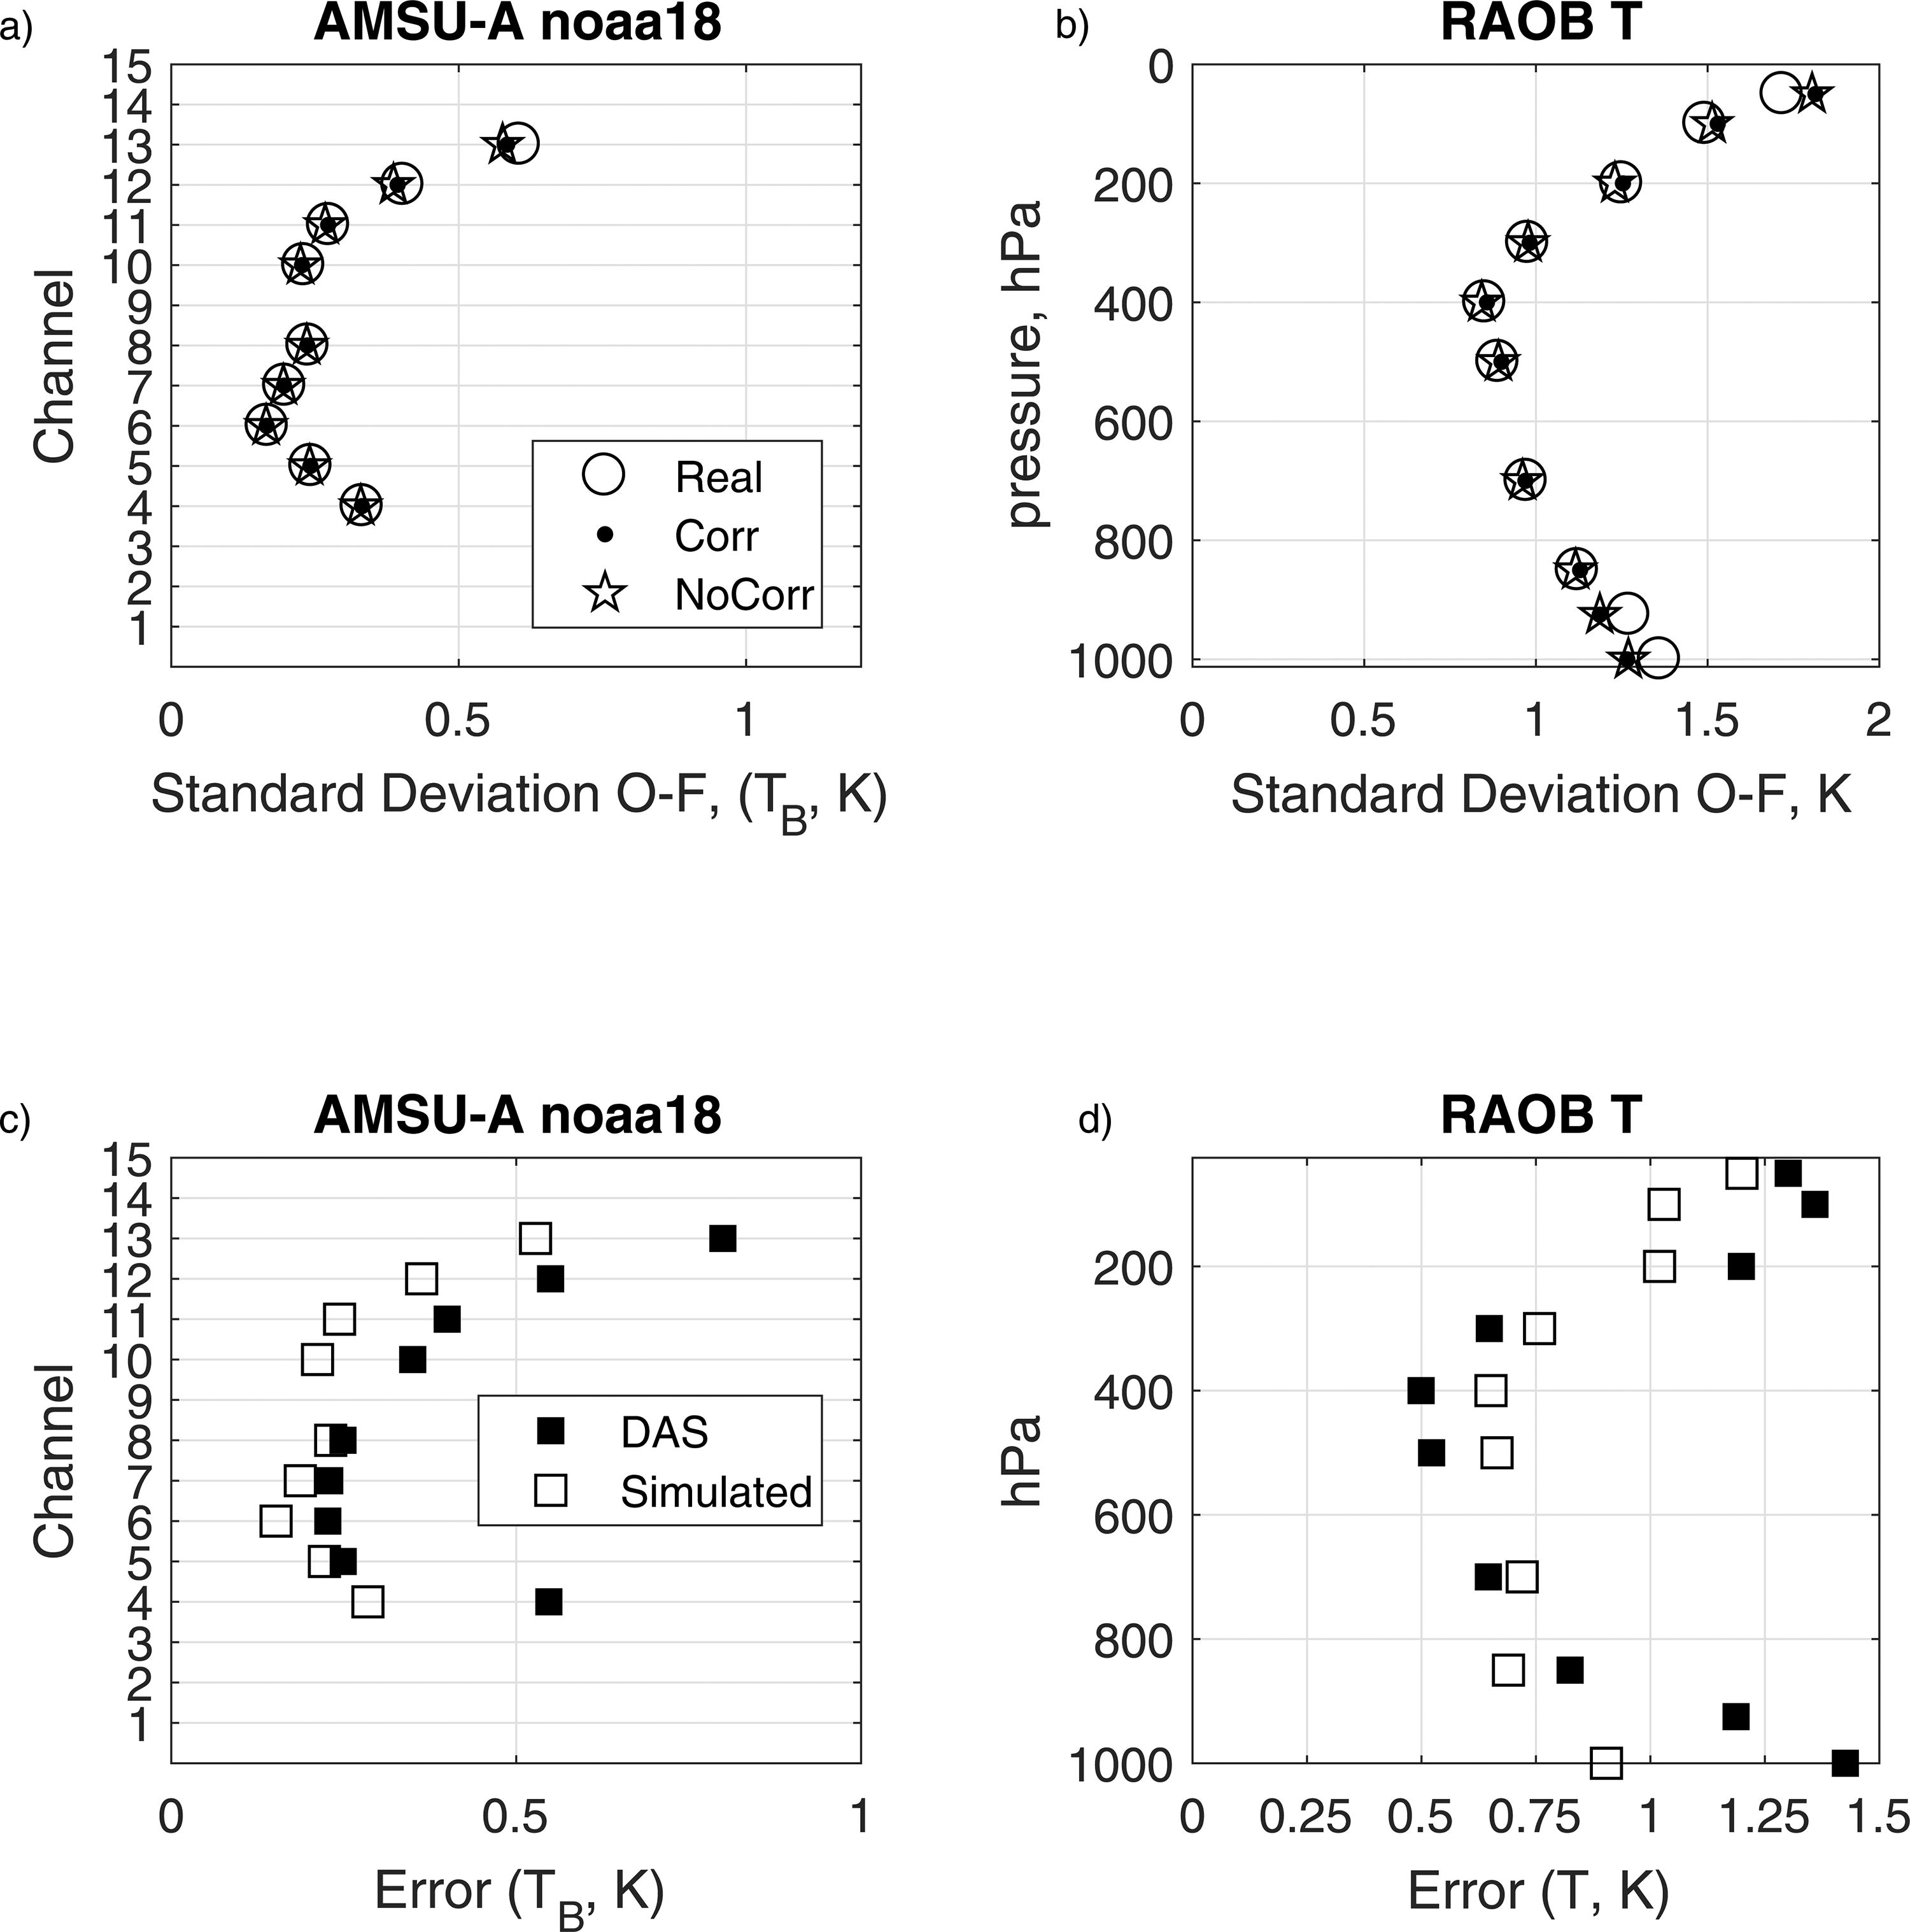
Fig. 4.
Top, Standard deviations of observation innovations (O-F). Twice daily data for the month of July. Real case, open circles; Corr case, solid dots; NoCorr case, open stars. Bottom, comparison of the magnitude of simulated added errors (open squares) and the R observation error weighting used by the DAS (dark squares). (a, c) AMSU-A noaa-18 as a function of channel; (b, d) rawinsonde temperature as a function of height.
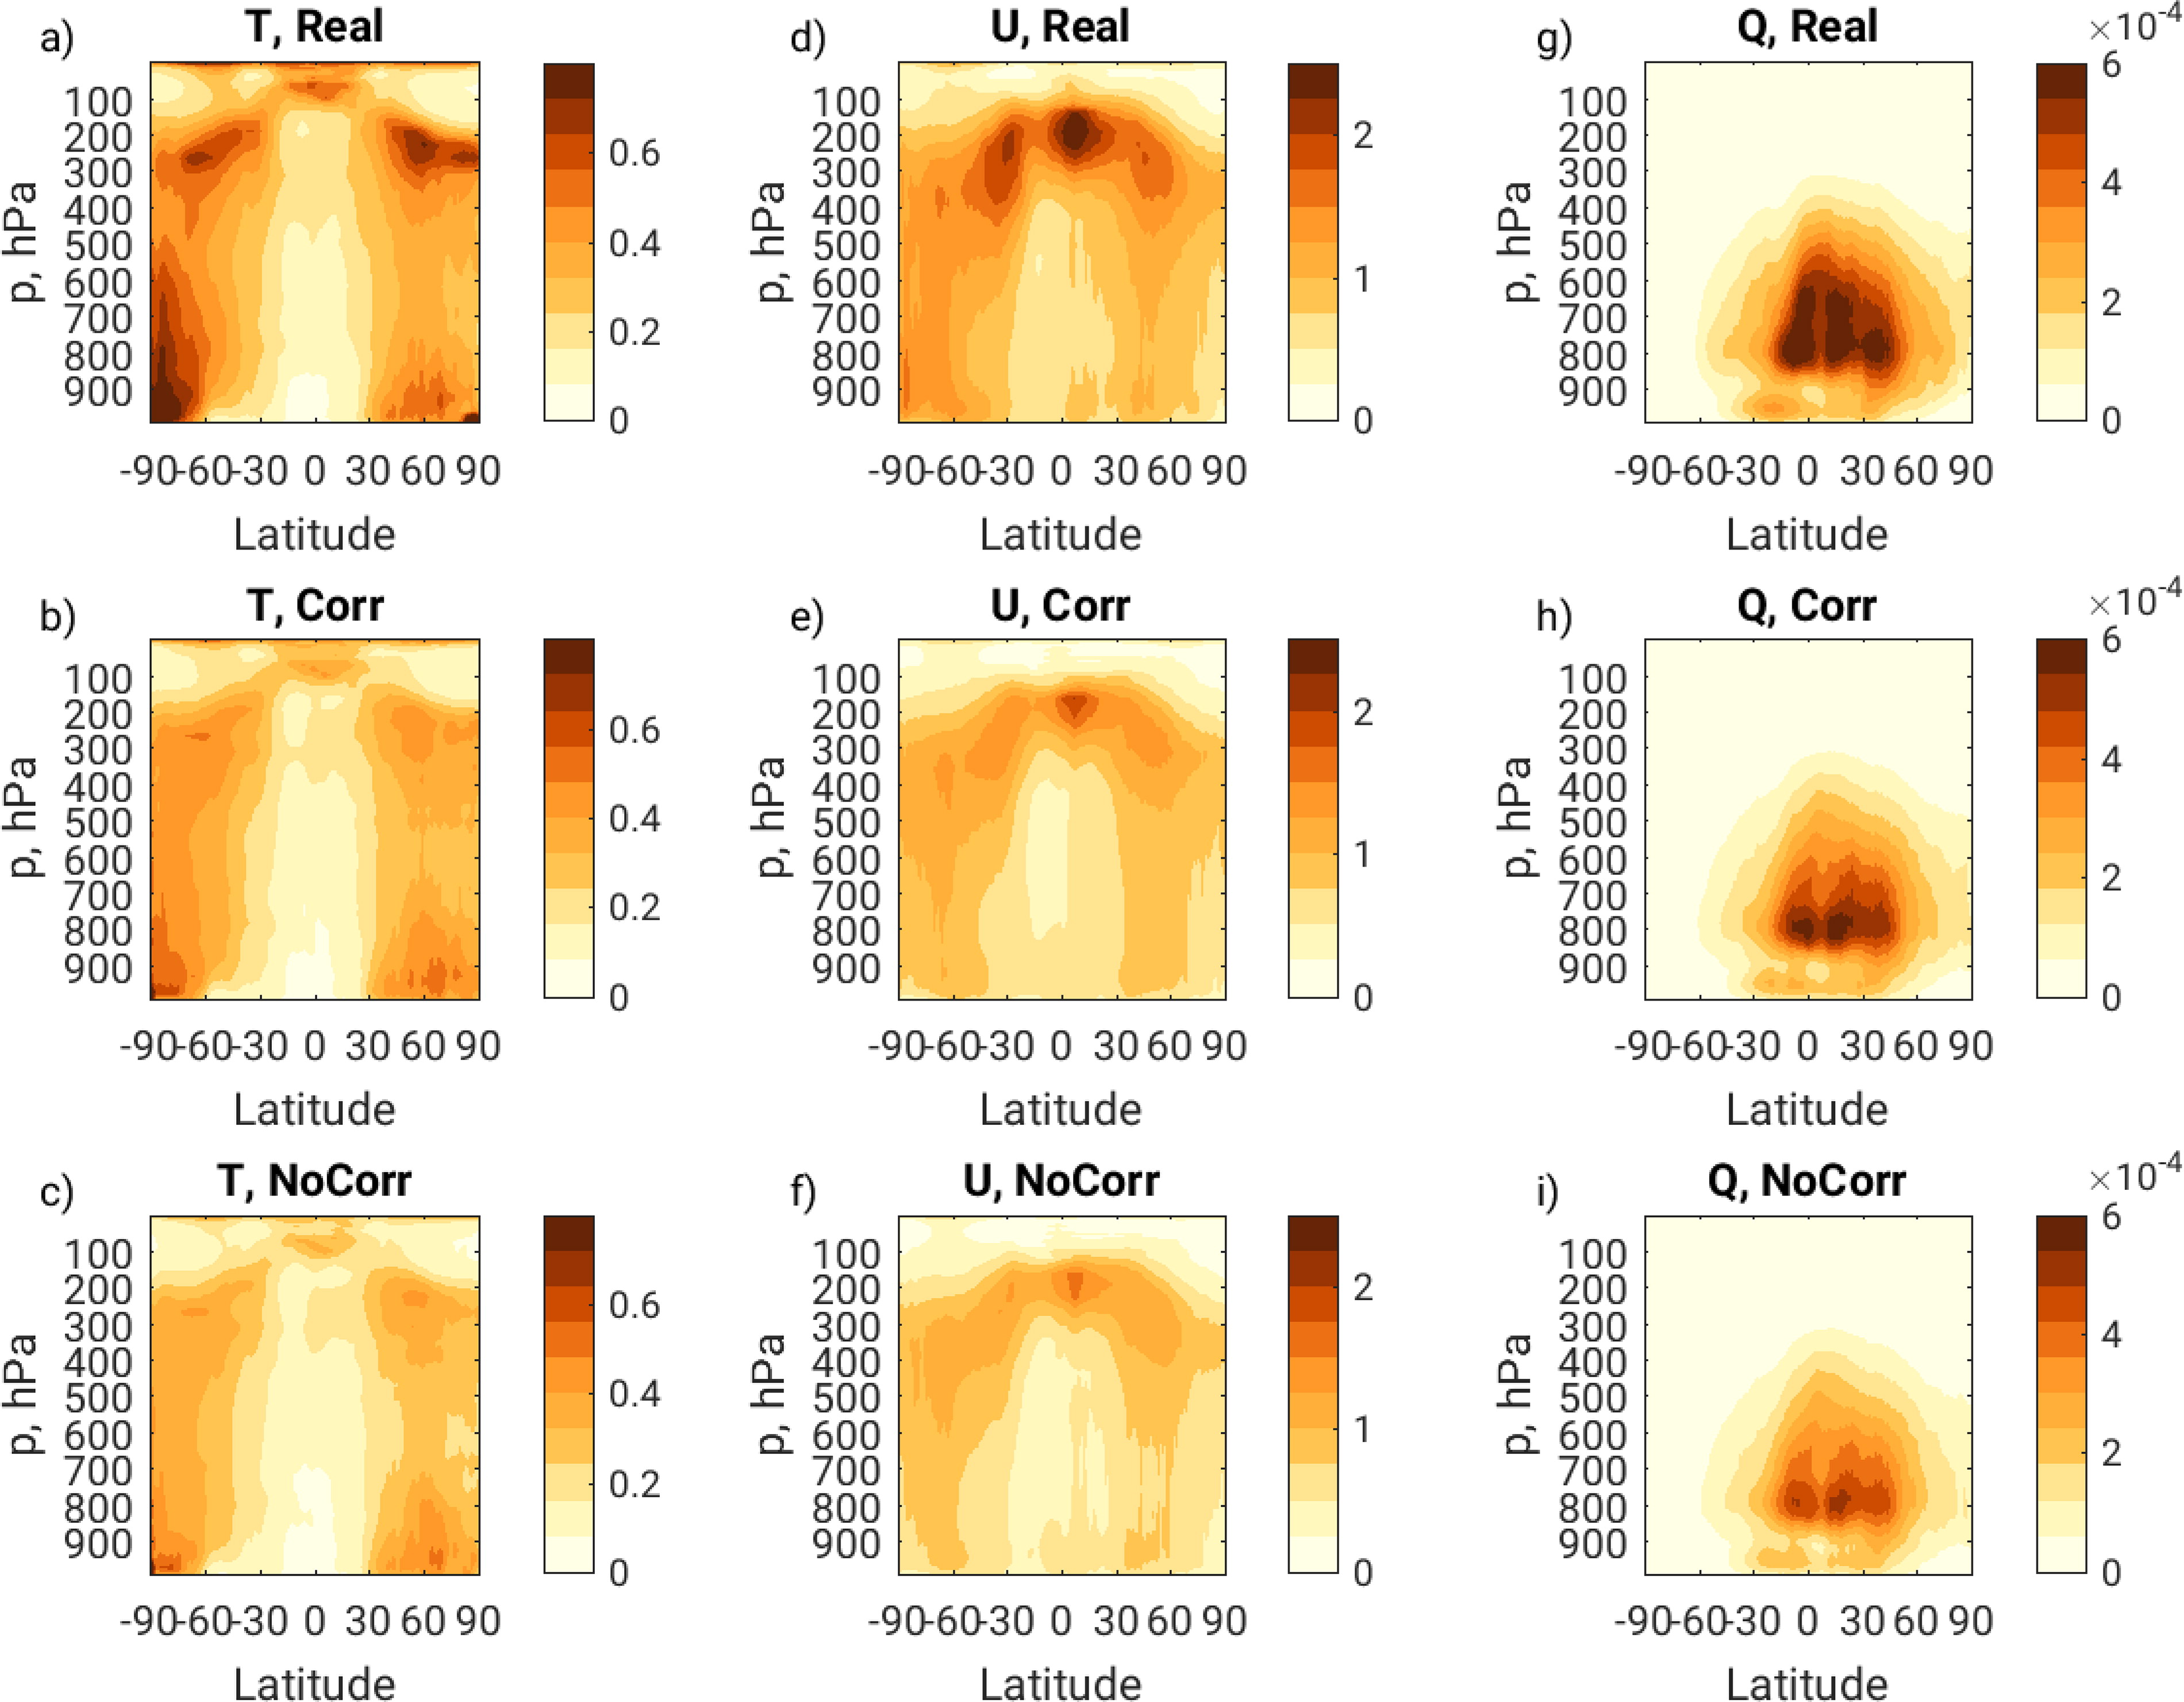
Fig. 5.
Zonal means of temporal root mean square analysis increments (A, B). Twice daily data for the month of July. (a, d, g) Real case; (b, e, h) Corr case; (c, f, i) NoCorr case. (a, b, c) T (K); (d, e, f) zonal wind (m s–1); (g, h, i) specific humidity (kg kg–1).
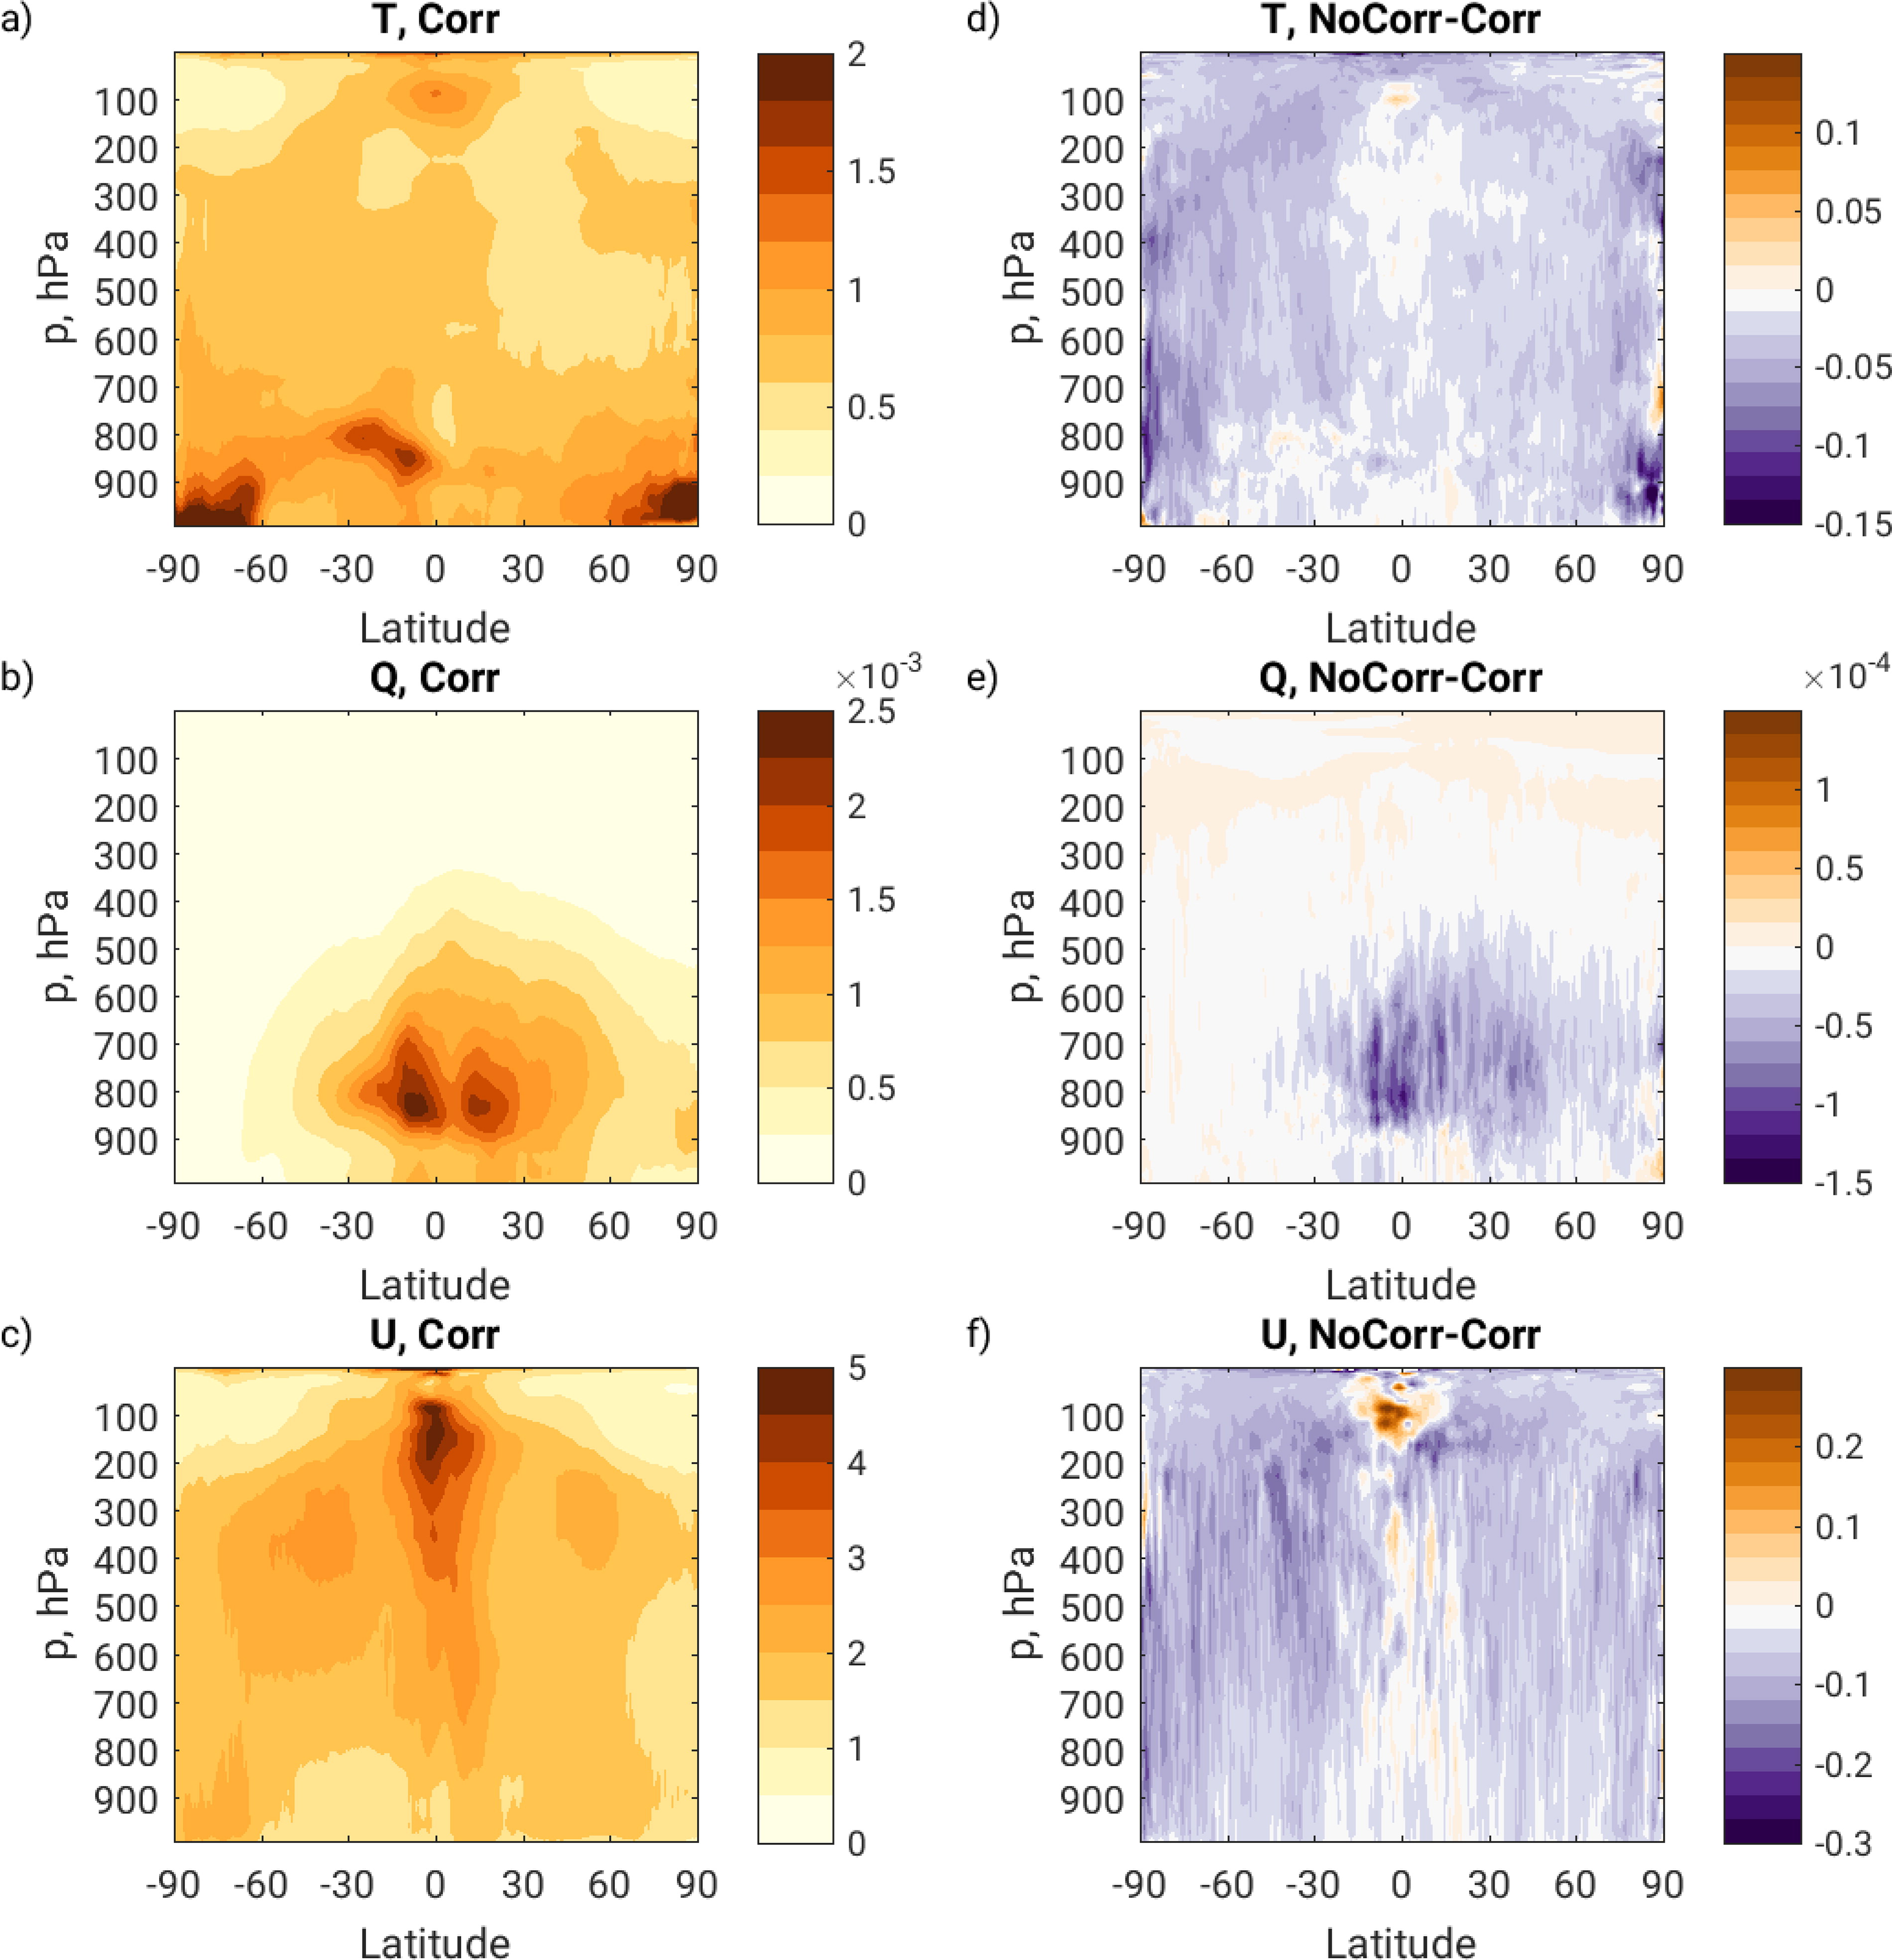
Fig. 6.
Zonal means of root temporal mean square background errors. (a, d) Temperature (K); (b, e) specific humidity (kg kg–1); (c, f) zonal wind (m s–1). (a, b, c) Left panels, Corr case; (d, e, f) difference between NoCorr and Corr cases.
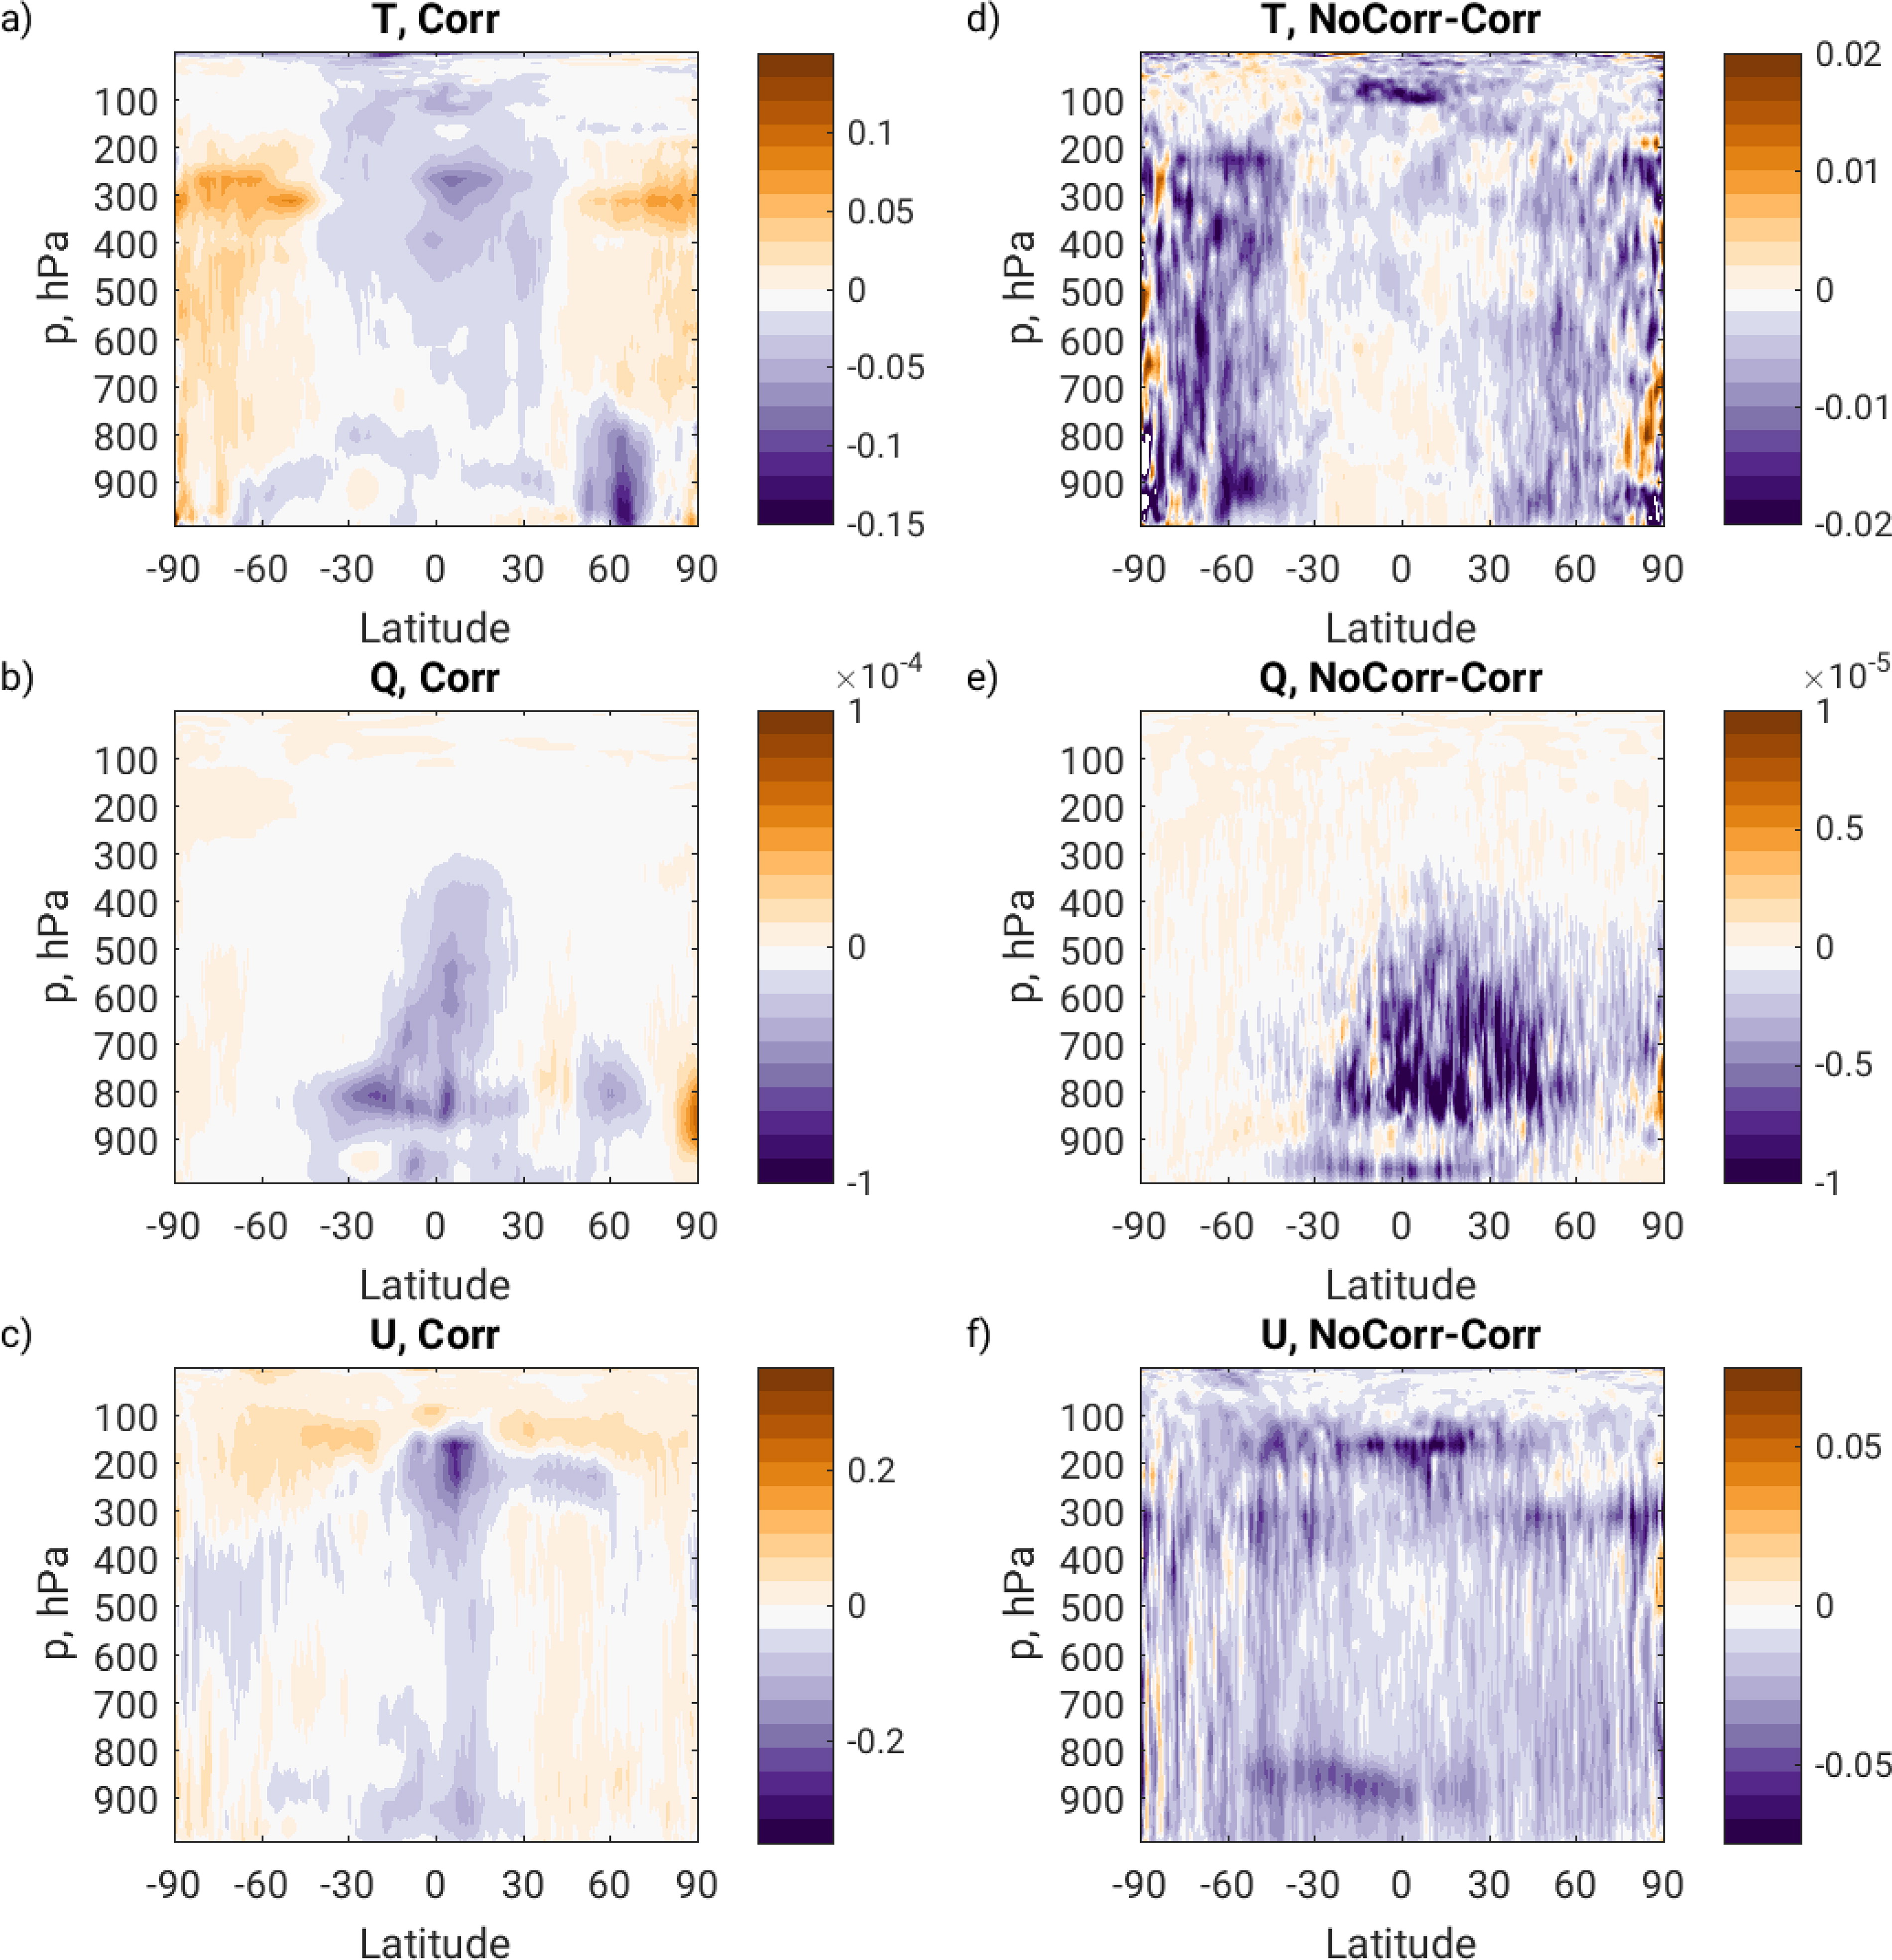
Fig. 7.
Zonal means of temporal mean differences in absolute analysis and background errors, (a, d) Temperature (K); (b, e) specific humidity (kg kg–1); (c, f) zonal wind (m s–1). (a, b, c) Corr case; (d, e, f) difference between NoCorr and Corr cases.
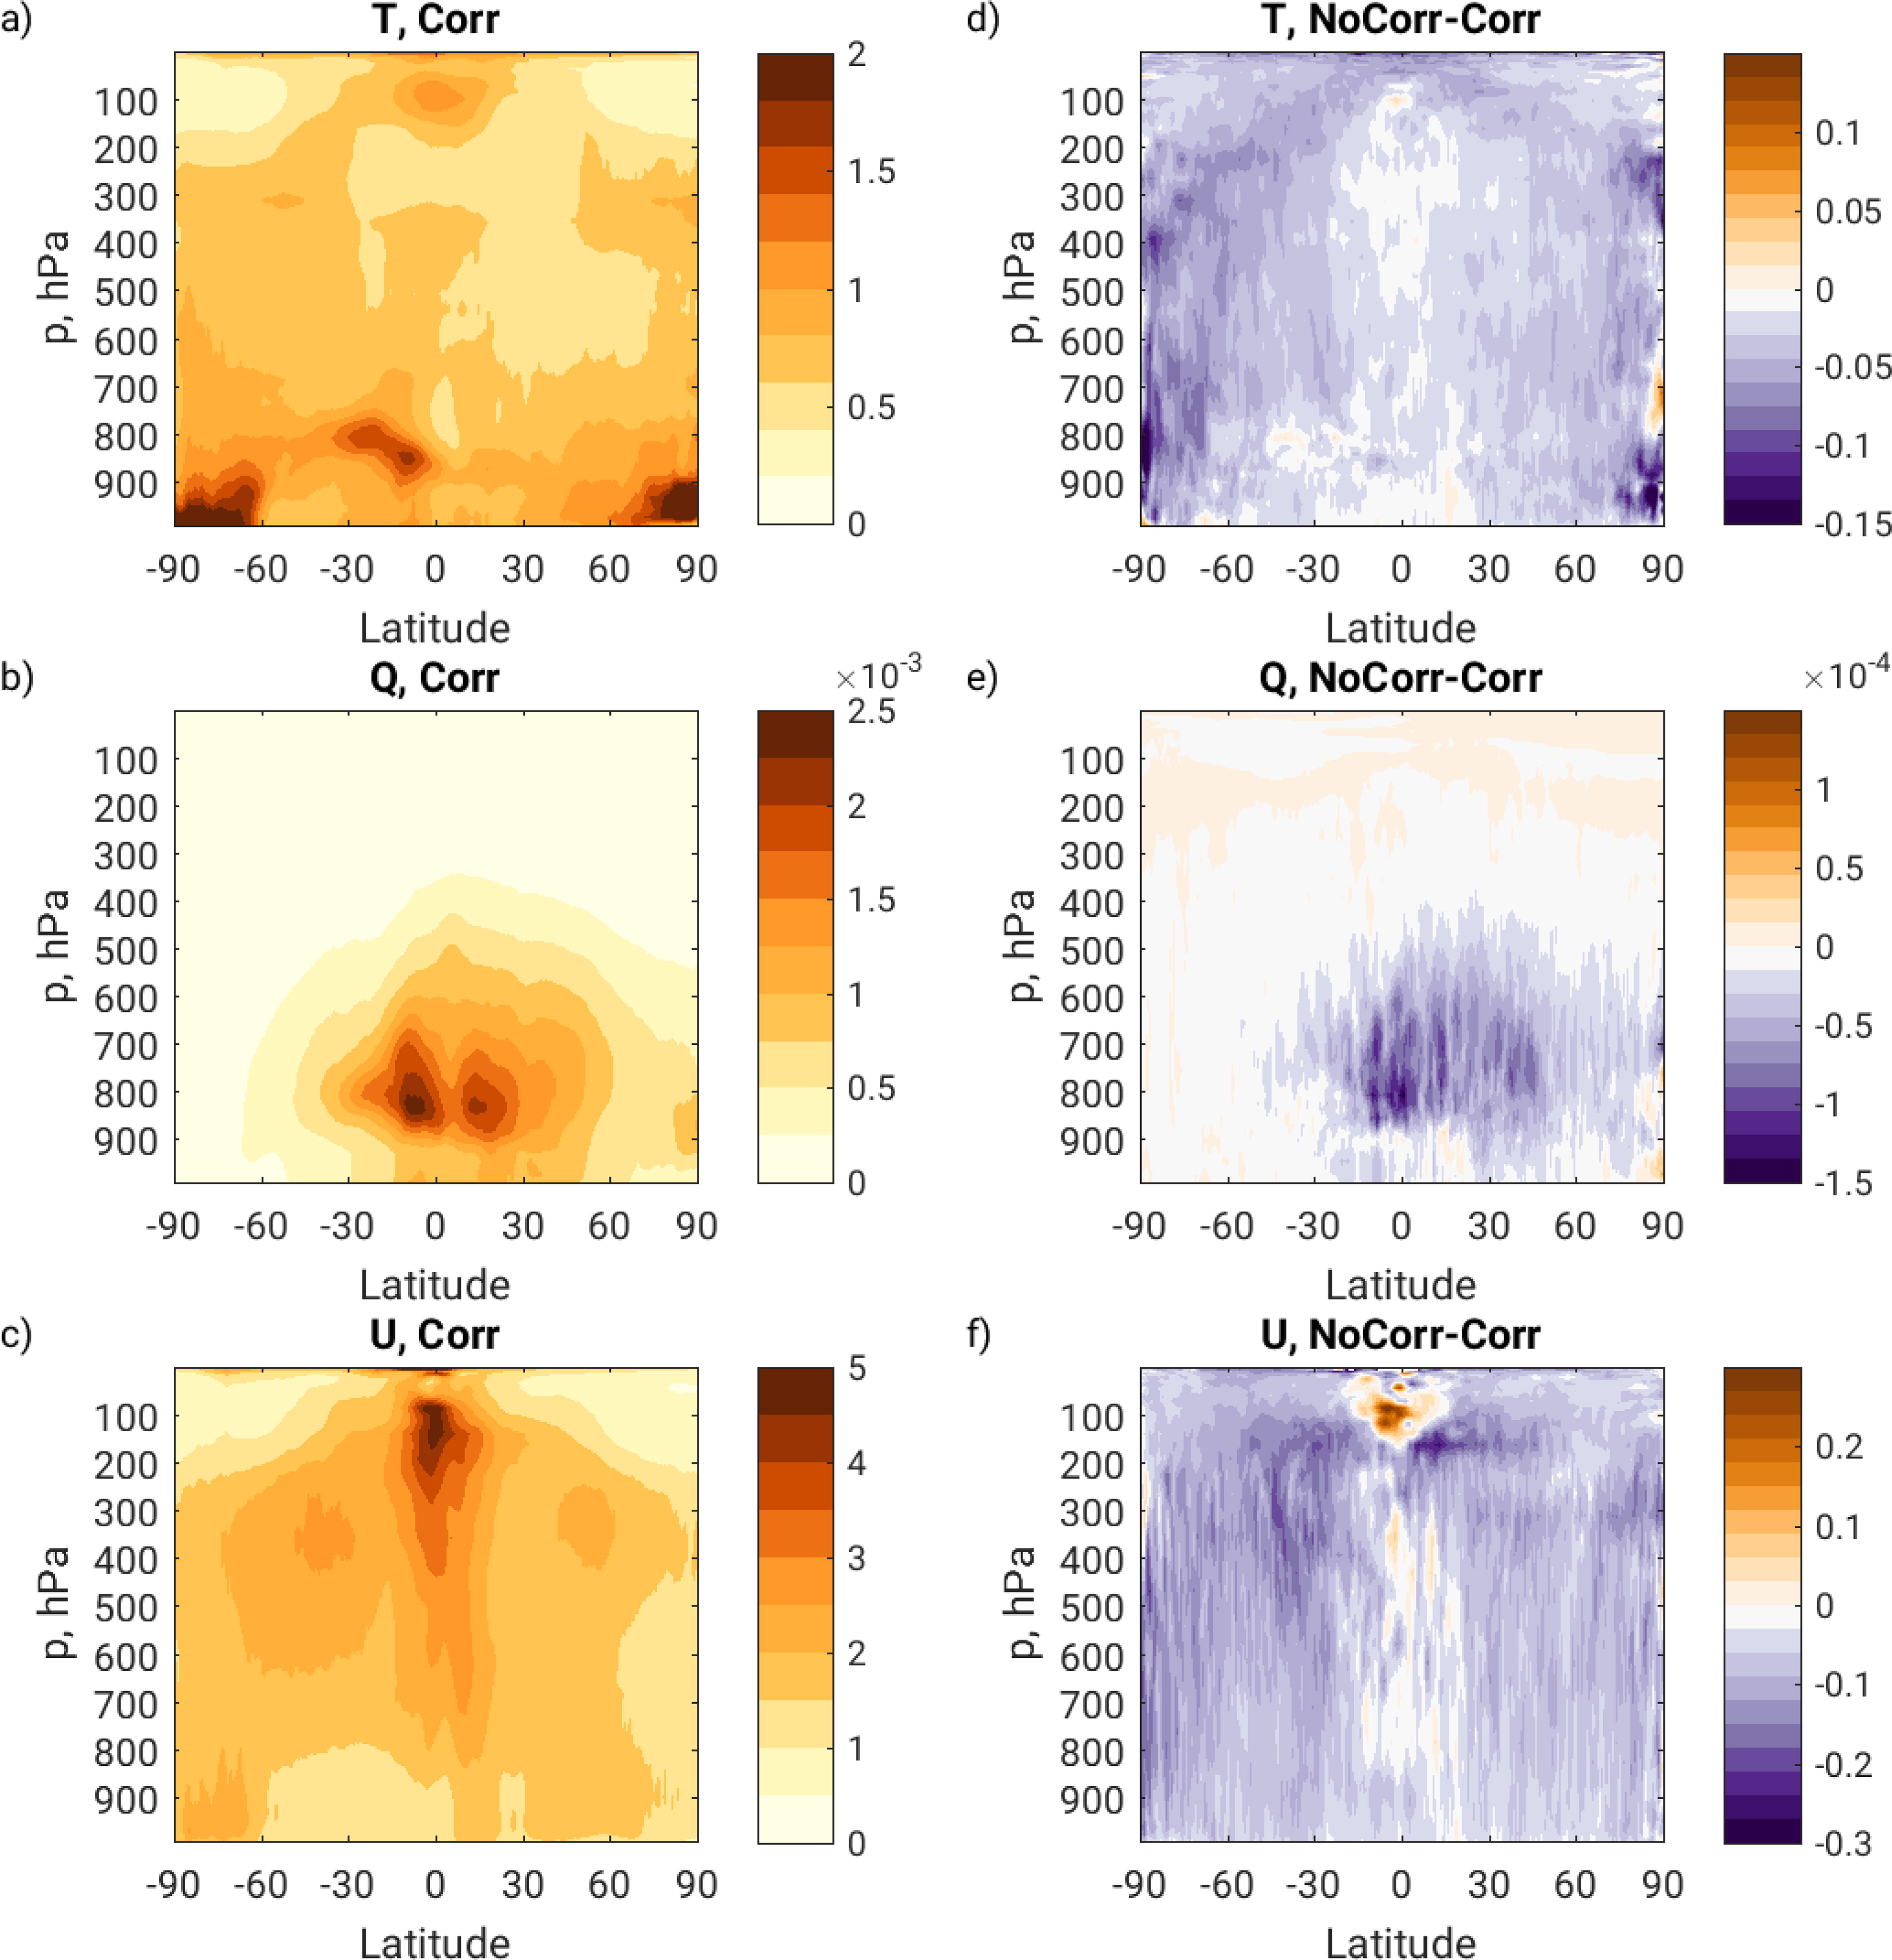
Fig. 8.
Zonal means of root temporal mean square analysis errors. (a, d) Temperature (K); (b, e) specific humidity (kg kg–1); (c, f) zonal wind (m s–1). (a, b, c) Corr case; (d, e, f) difference between NoCorr and Corr cases.
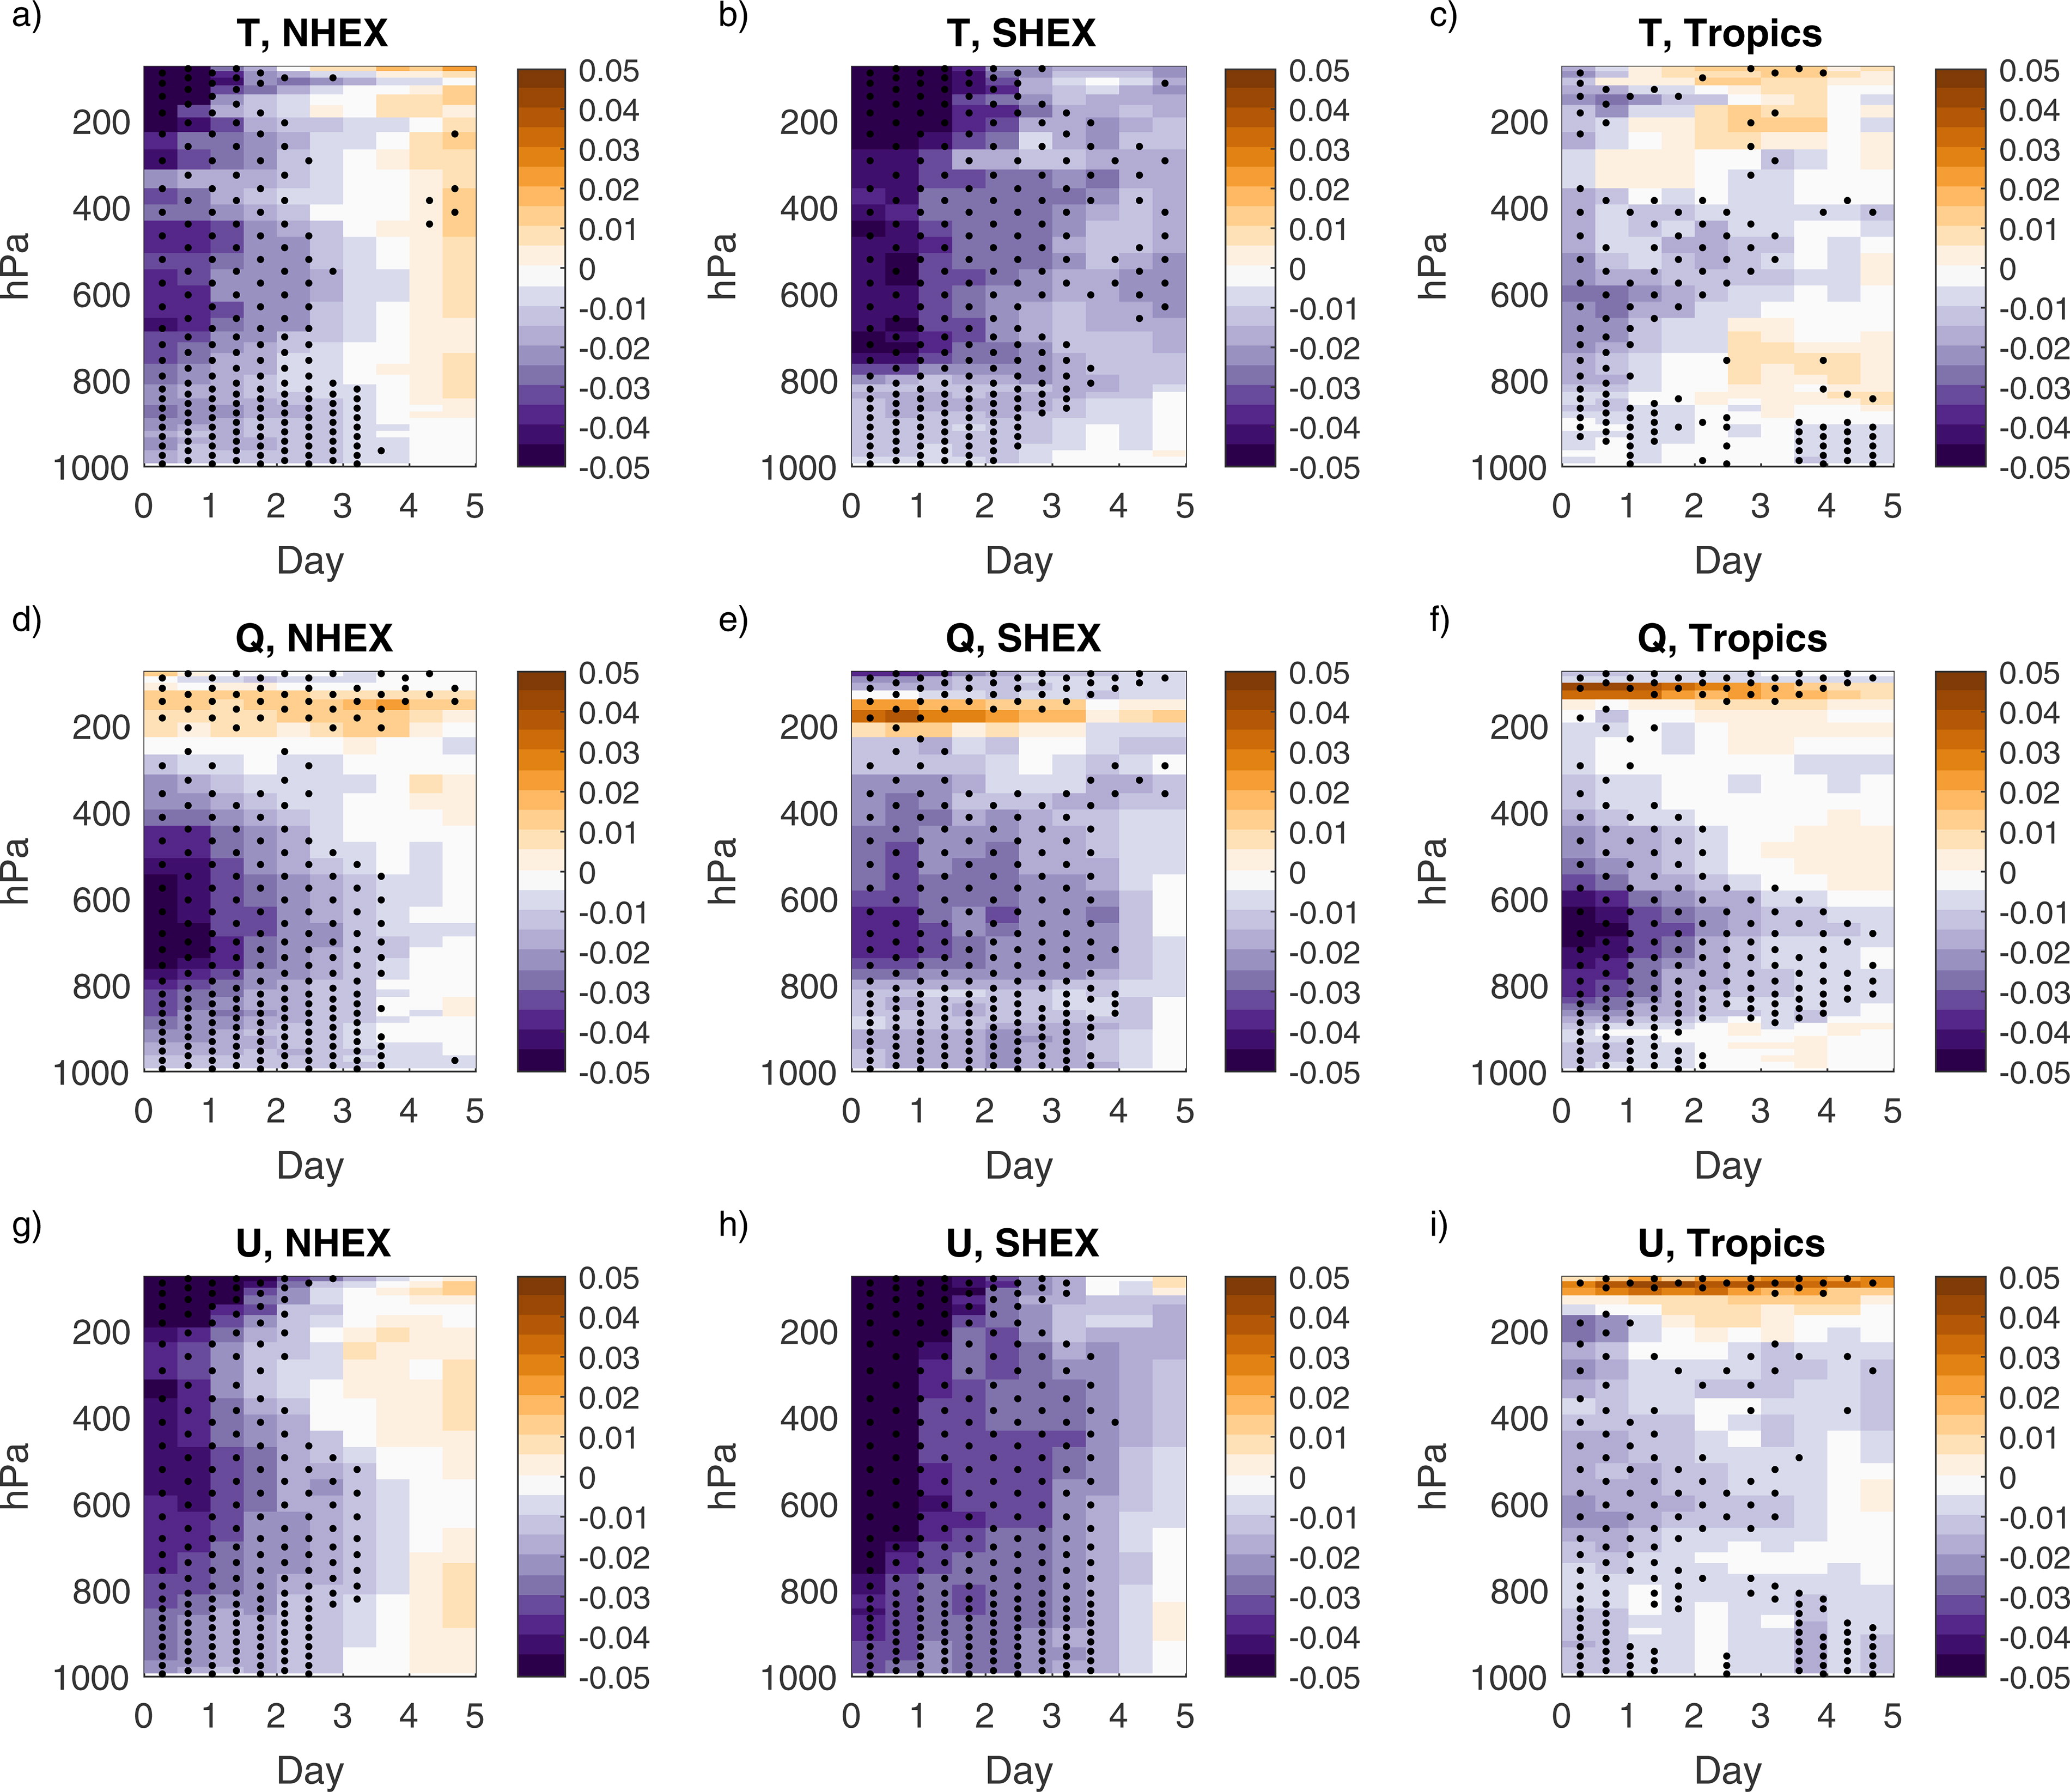
Fig. 9.
Fractional difference in areal mean temporal-RMS forecast error, (NoCorr-Corr)/Corr, month of July. Stippling indicates significant difference at the 90th percentile confidence level. (a, b, c), temperature error; (d, e, f) specific humidity error; (g, h, i) zonal wind error. (a, d, g) NHEX (20N-90N); (b, e, h) SHEX (90S-20S); (c, f, i) Tropics (20N-20S).
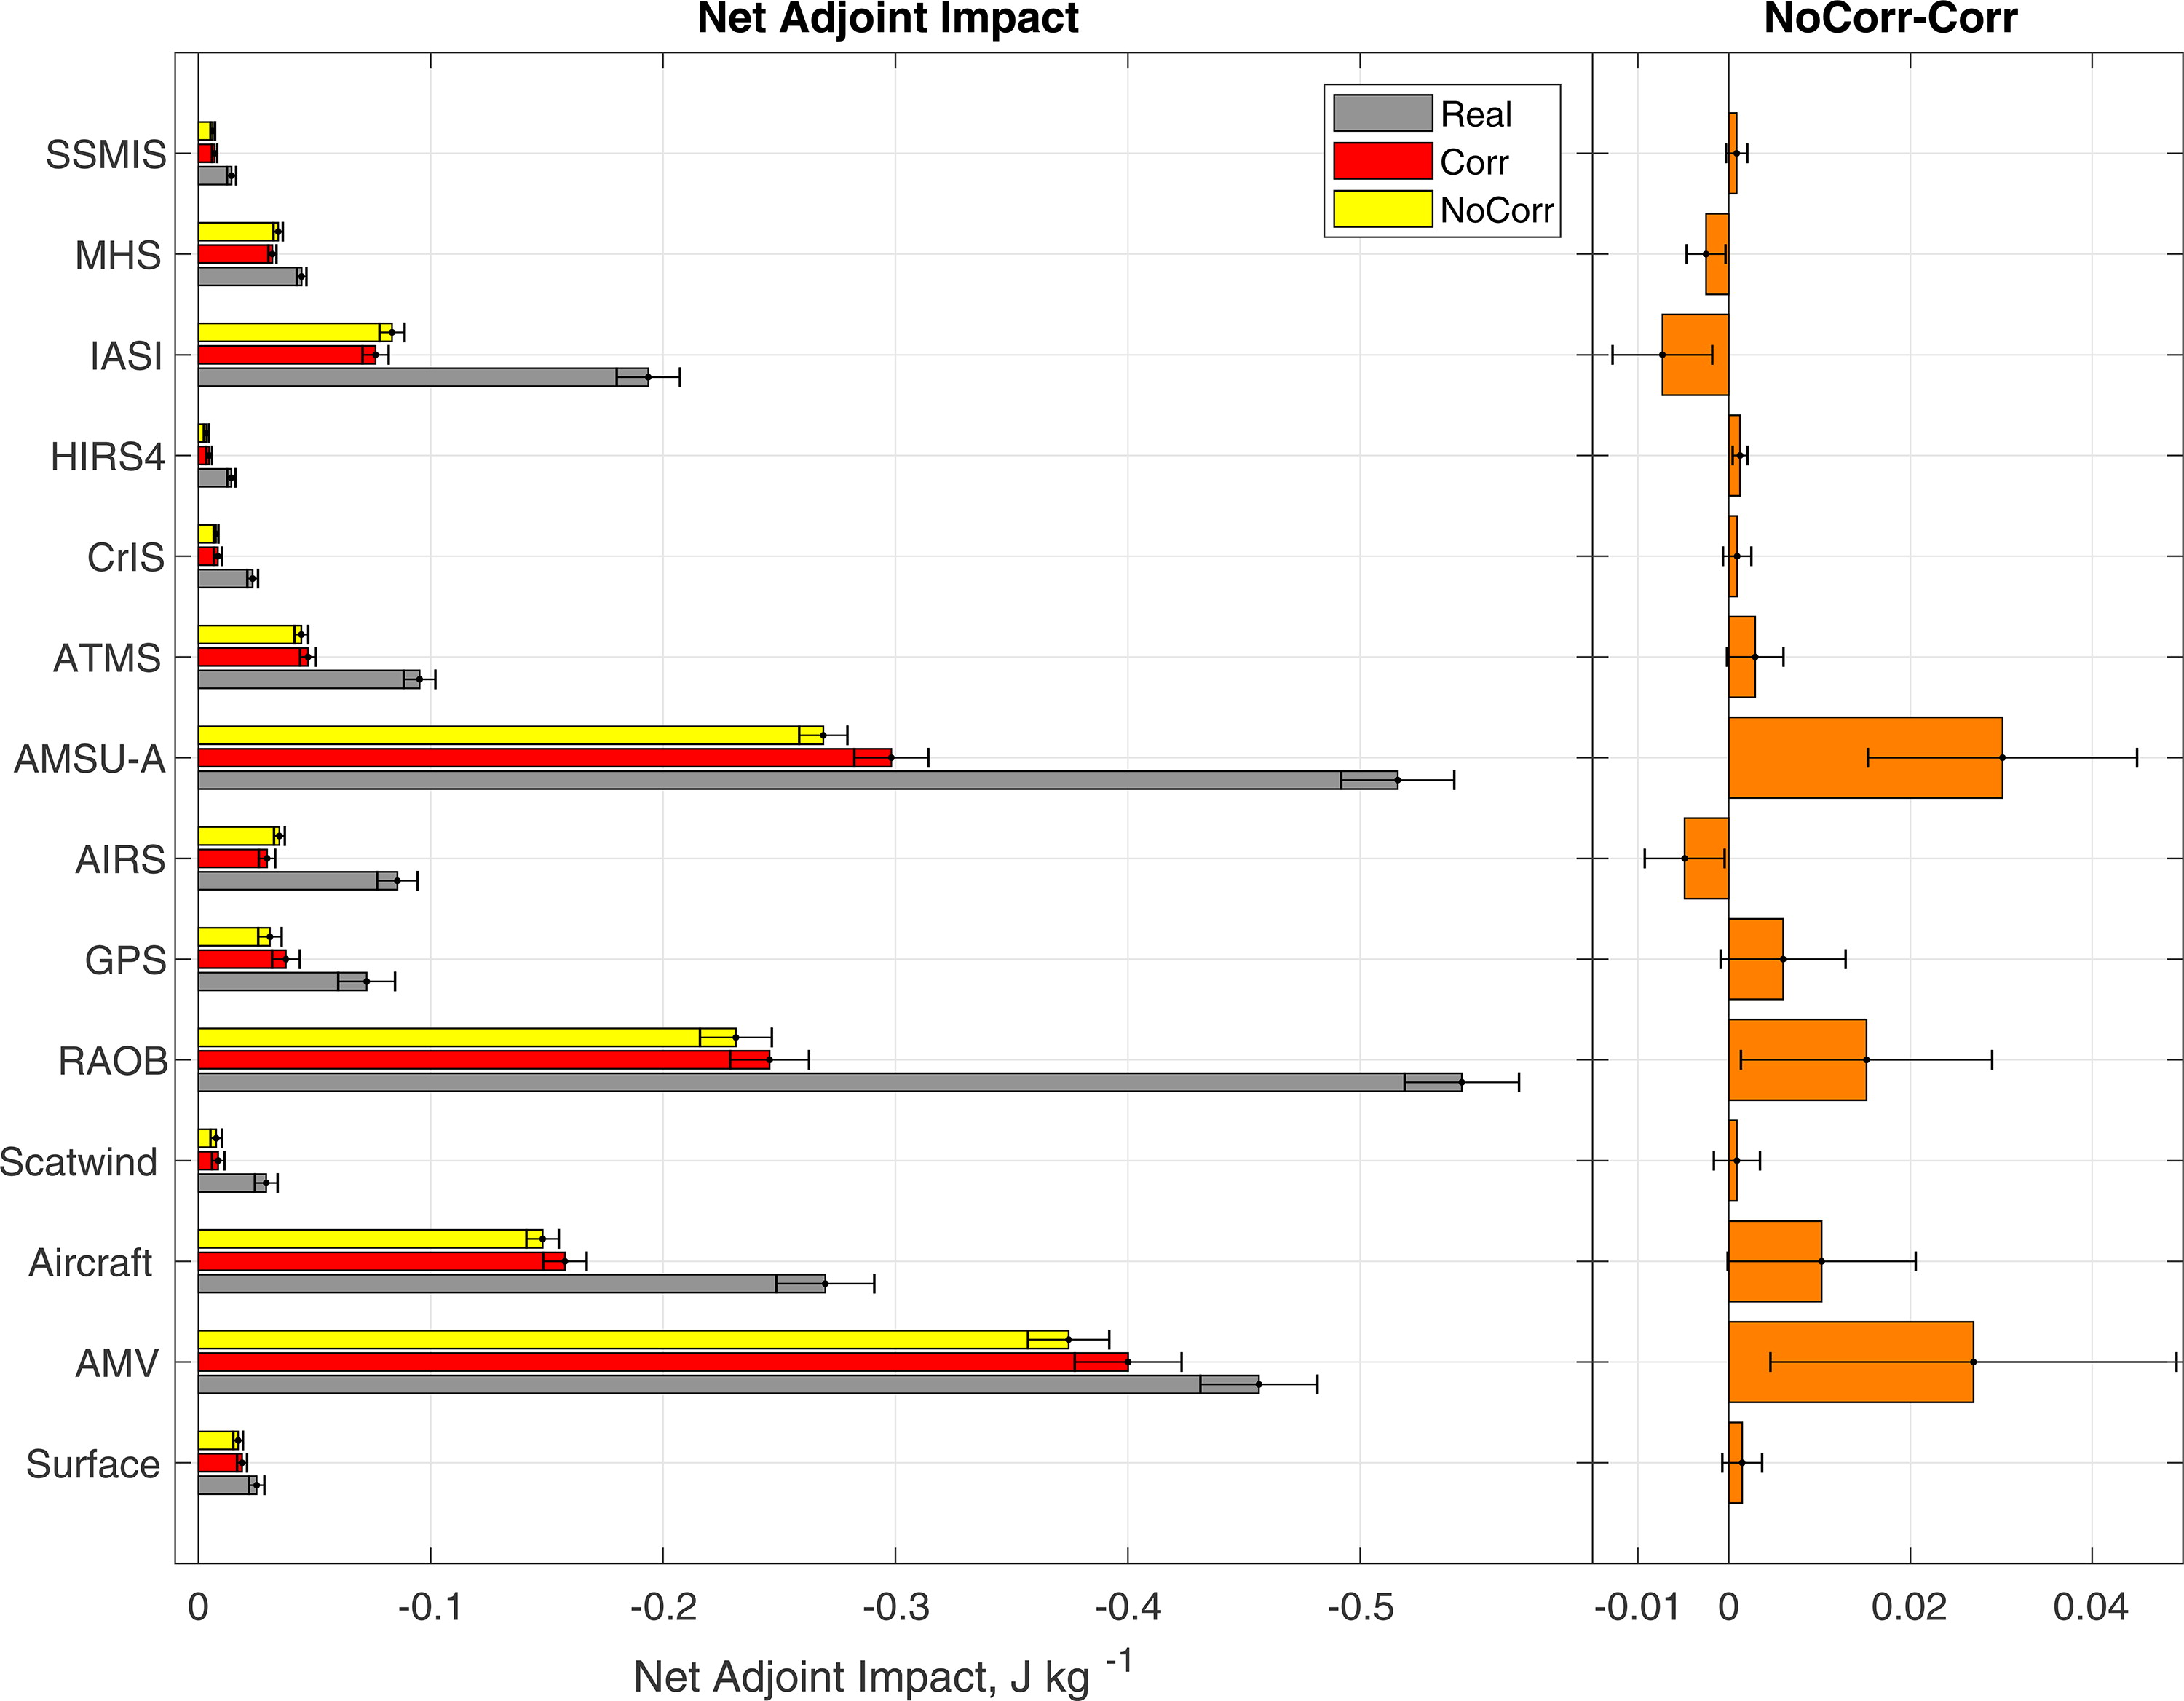
Fig. 10.
Daily mean FSO estimates of observation impacts on 24 hour forecast skill for a total wet energy norm, self-analysis verification. Left panel, comparison of net daily impact with whiskers indicating confidence interval at the 95th percentile; right panel, difference in impacts between NoCorr and Corr cases, with whiskers indicating the confidence interval of paired differences at the 95th percentile.