
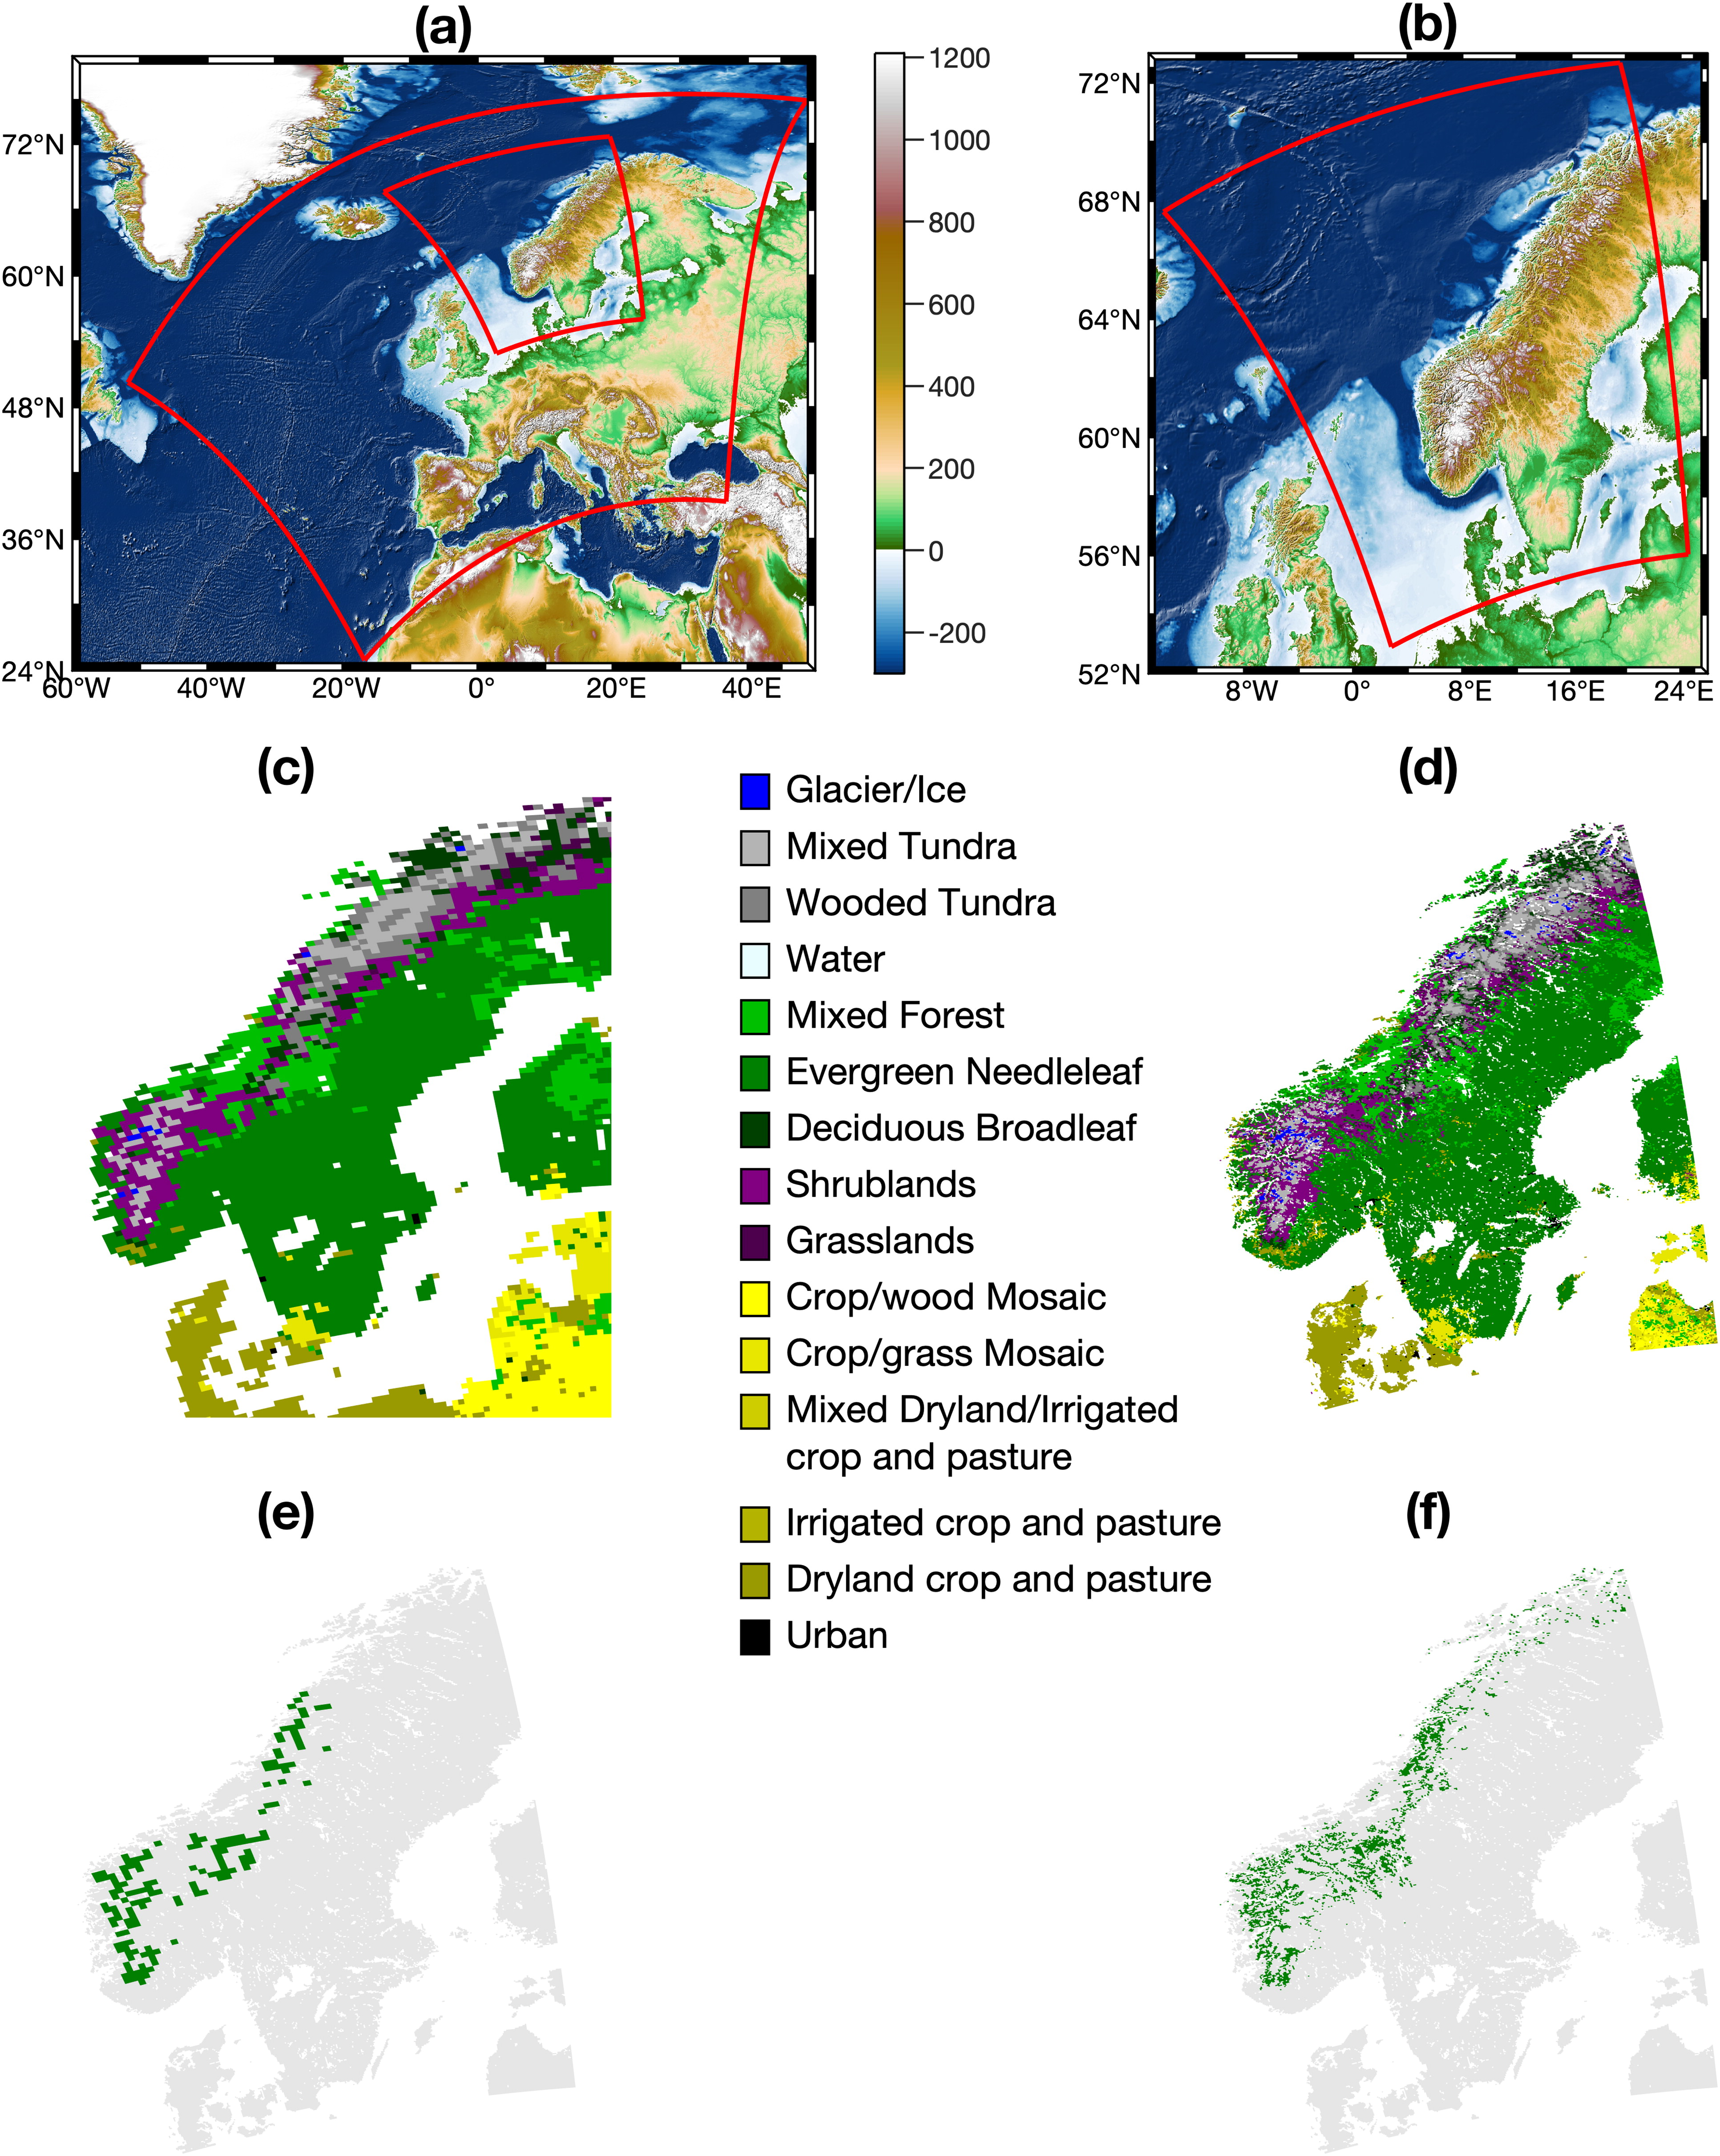
Fig. 1.
(a) Domains used in the WRF simulations. The outer domain is simulated at a grid spacing of 15 km while the inner domain is simulated at 3 km. (b) Enlarged image of the 3-km domain shown in (a) and marked here in red. (c) the USGS land cover for the 15-km domain over the area of interest - Scandinavian Peninsula. (d) Same as (c) except for the 3 km domain. (e) Grid boxes with land cover changed to either evergreen needleleaf (Afforestation simulation) or mixed forest (Natural Succession). (f) Same as (e) except for the 3 km domain.
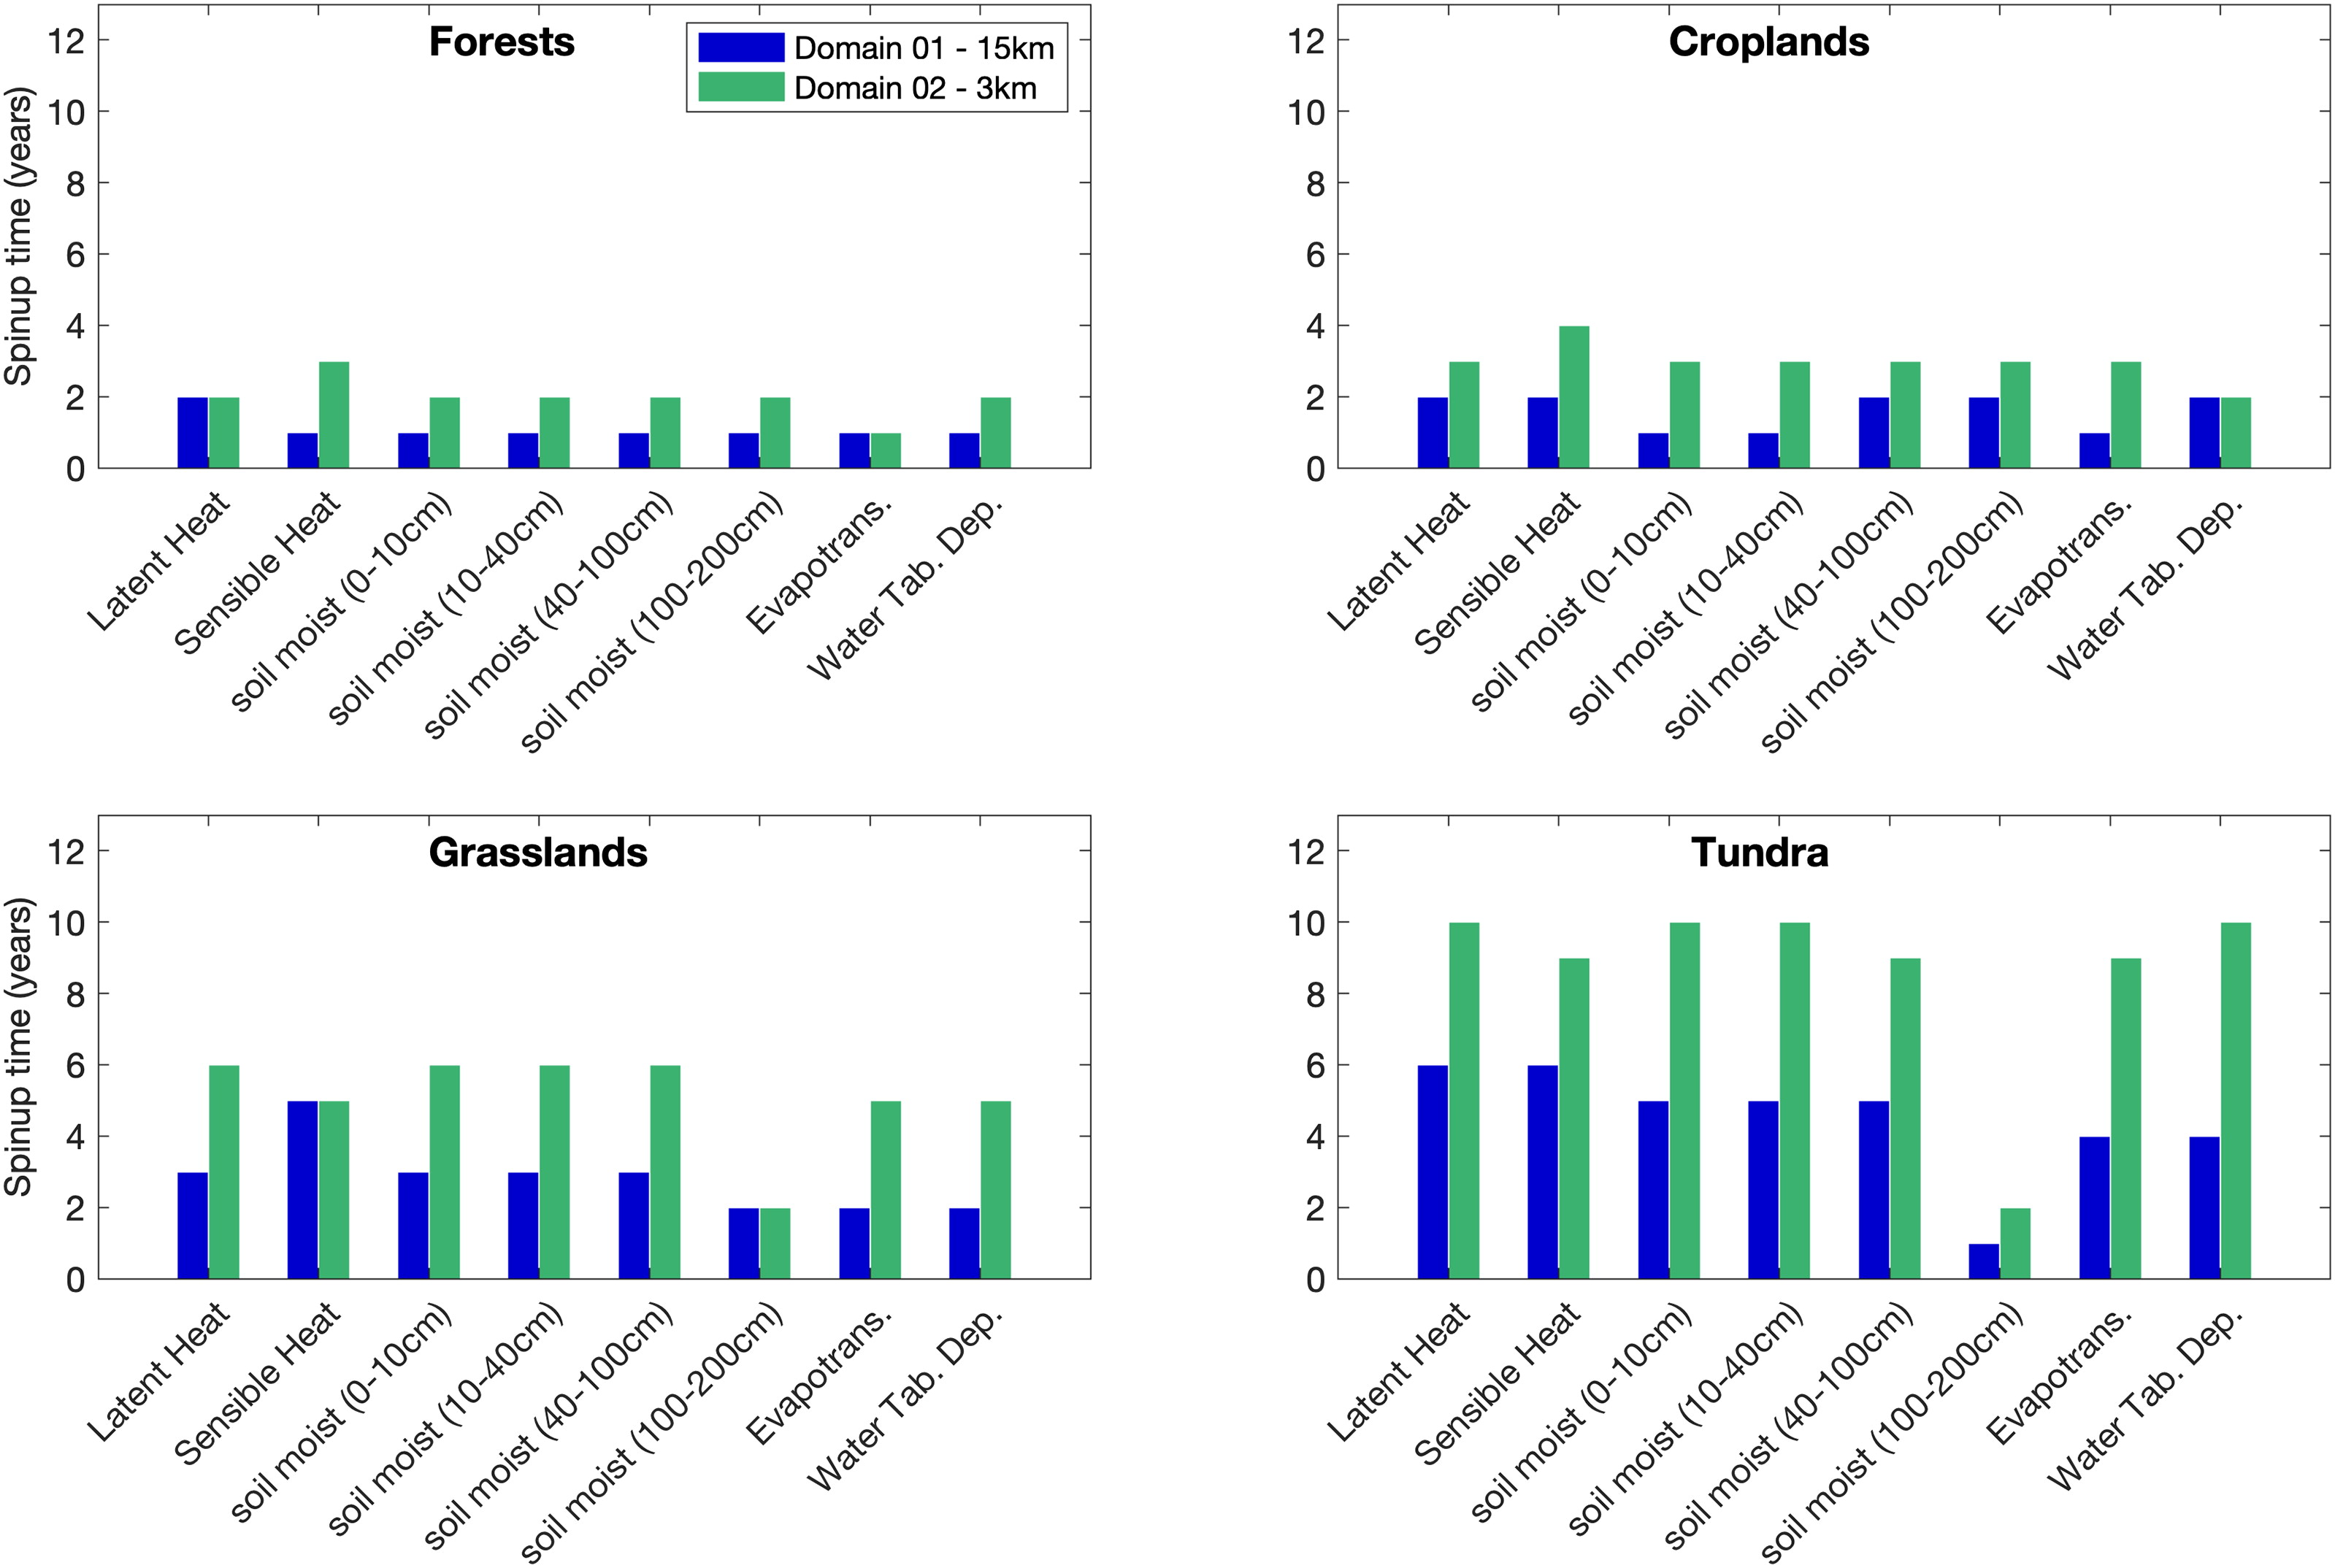
Fig. 2.
Number of years required for surface spinup over (a) forested areas, (b) croplands, (c) grasslands, and (d) tundra regions.
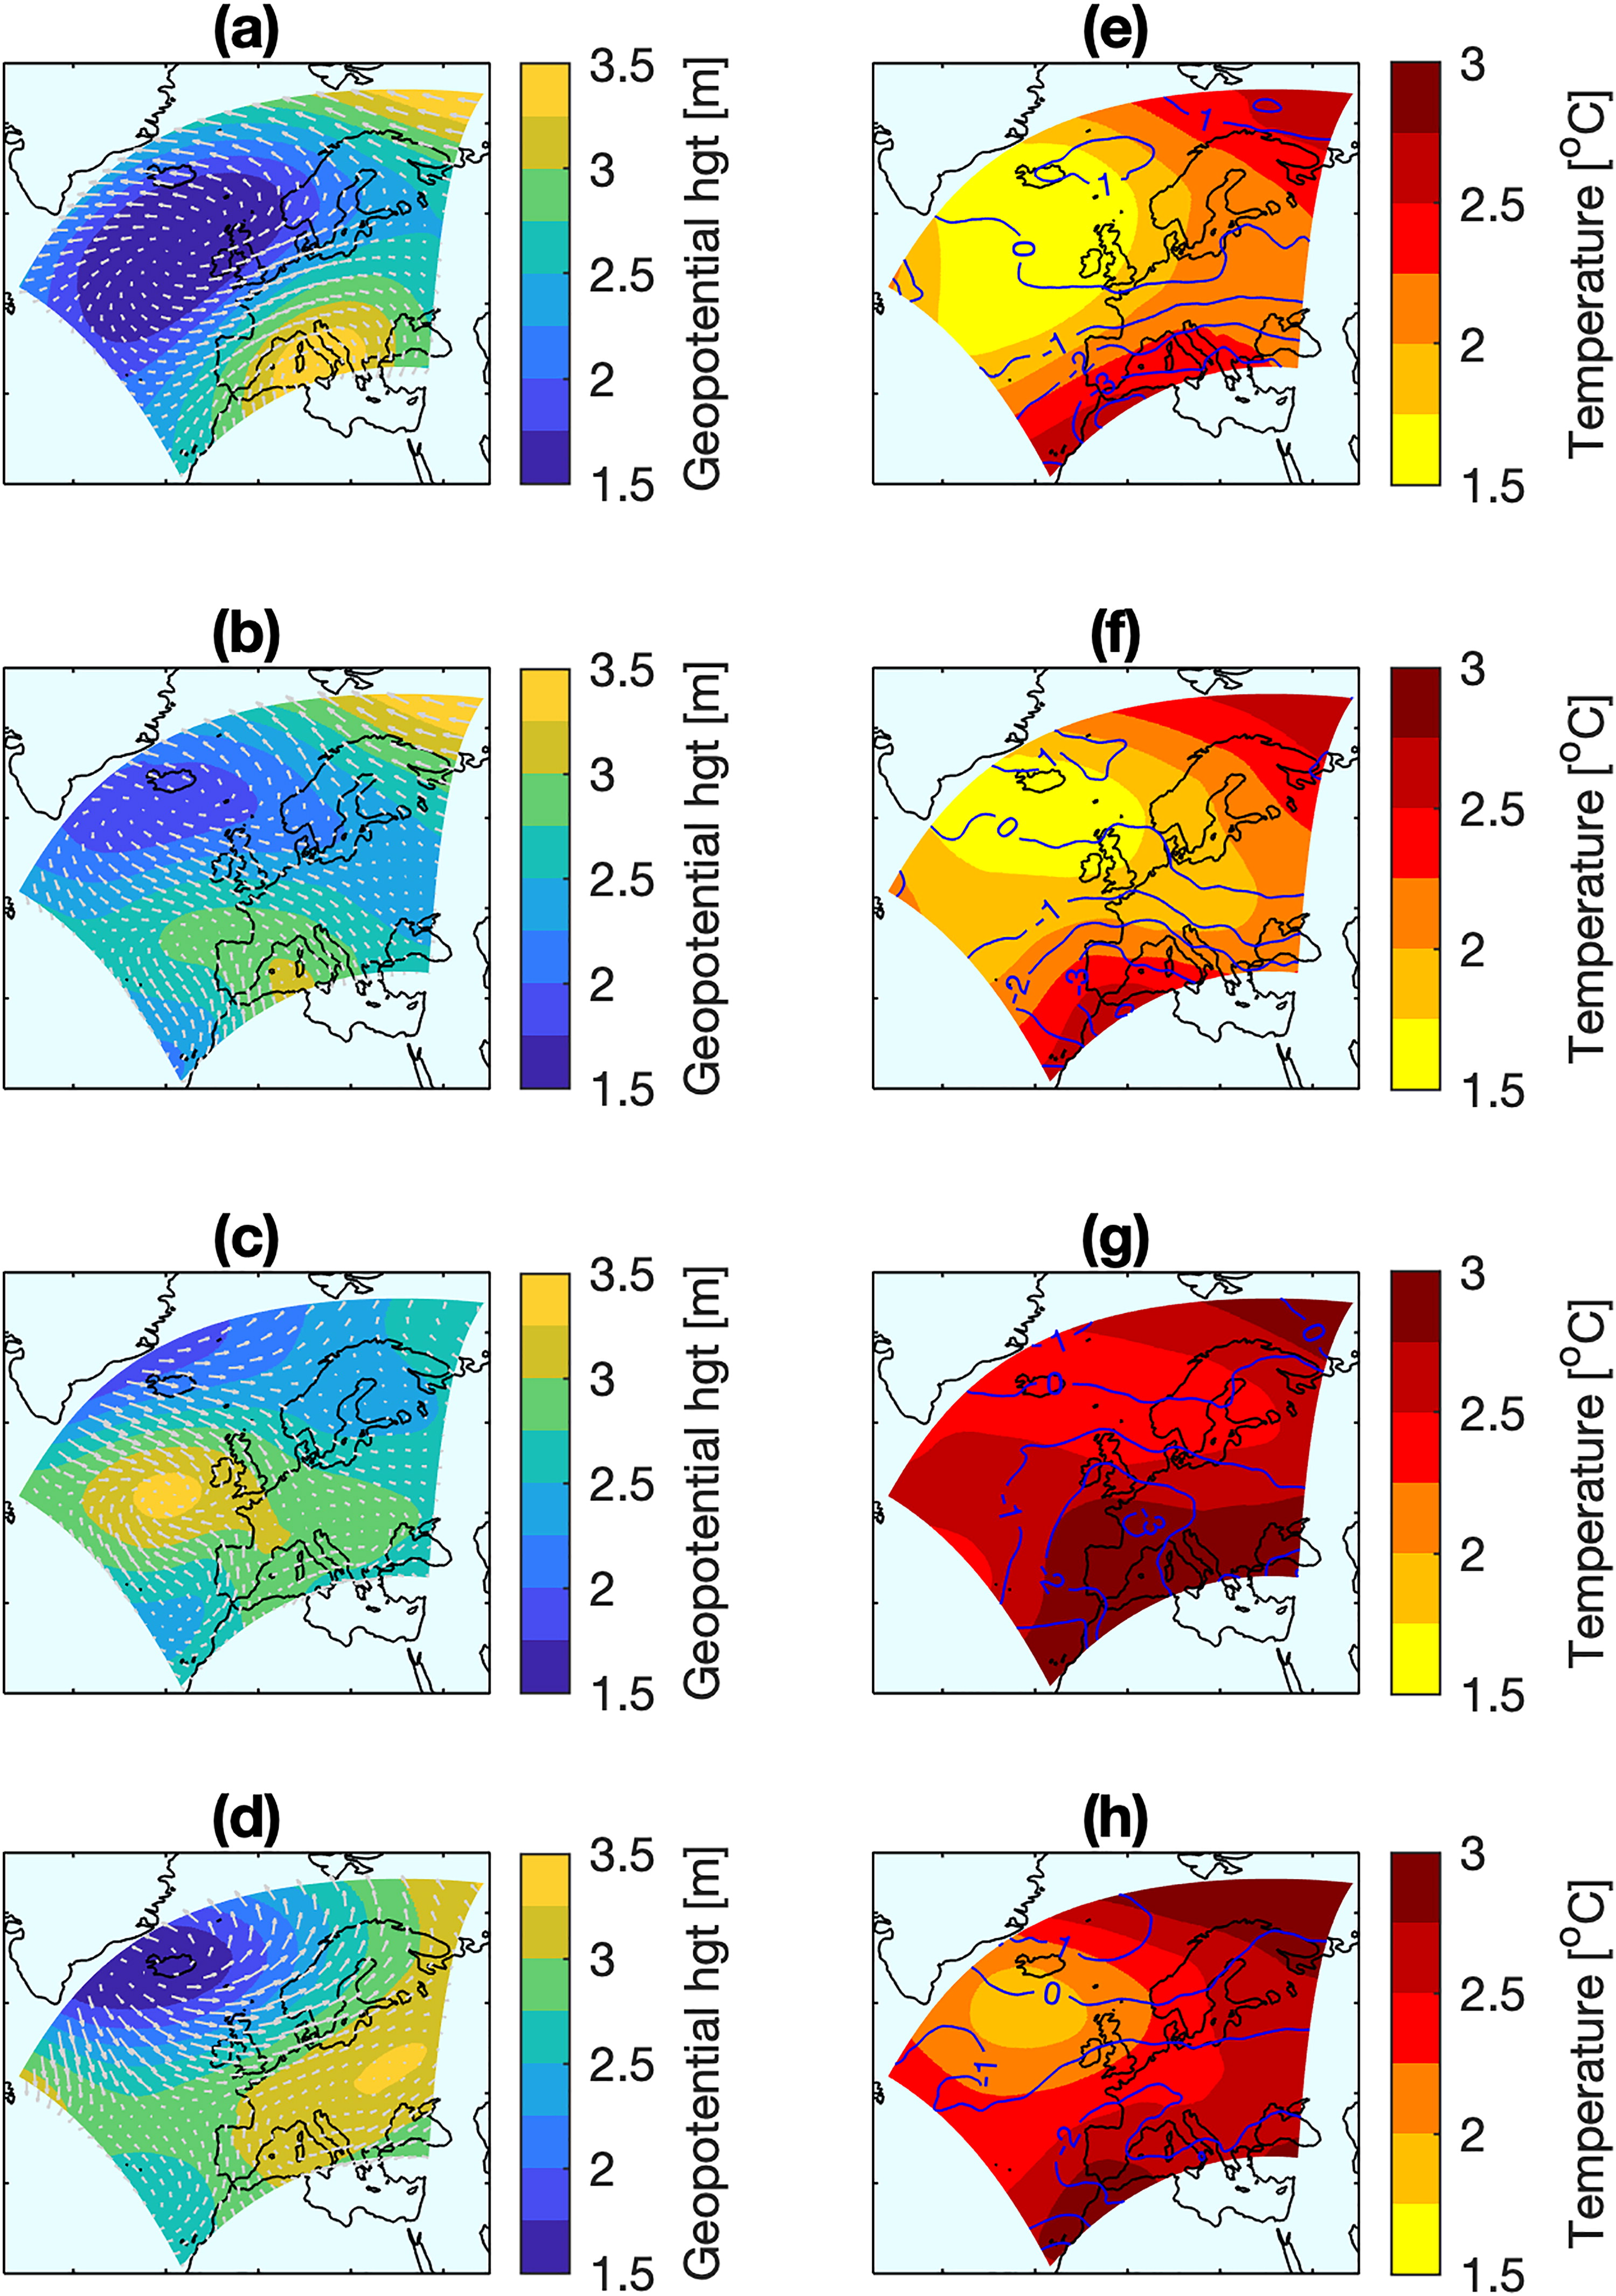
Fig. 3.
Pseudo-Global Warming delta for the 700 hPa geopotential height (colours) and the 700 hPa winds (arrows) in Winter (a), Spring (b), Summer (c) and Autumn (d). Pseudo Global Warming delta for temperature (colours) and relative humidity (contours) at 700 hPa for Winter (e) and Spring (f), Summer (g) and Autumn (h).
Table 1.
CMIP5 GCMs used for deriving the climate perturbations for the PGW simulations.
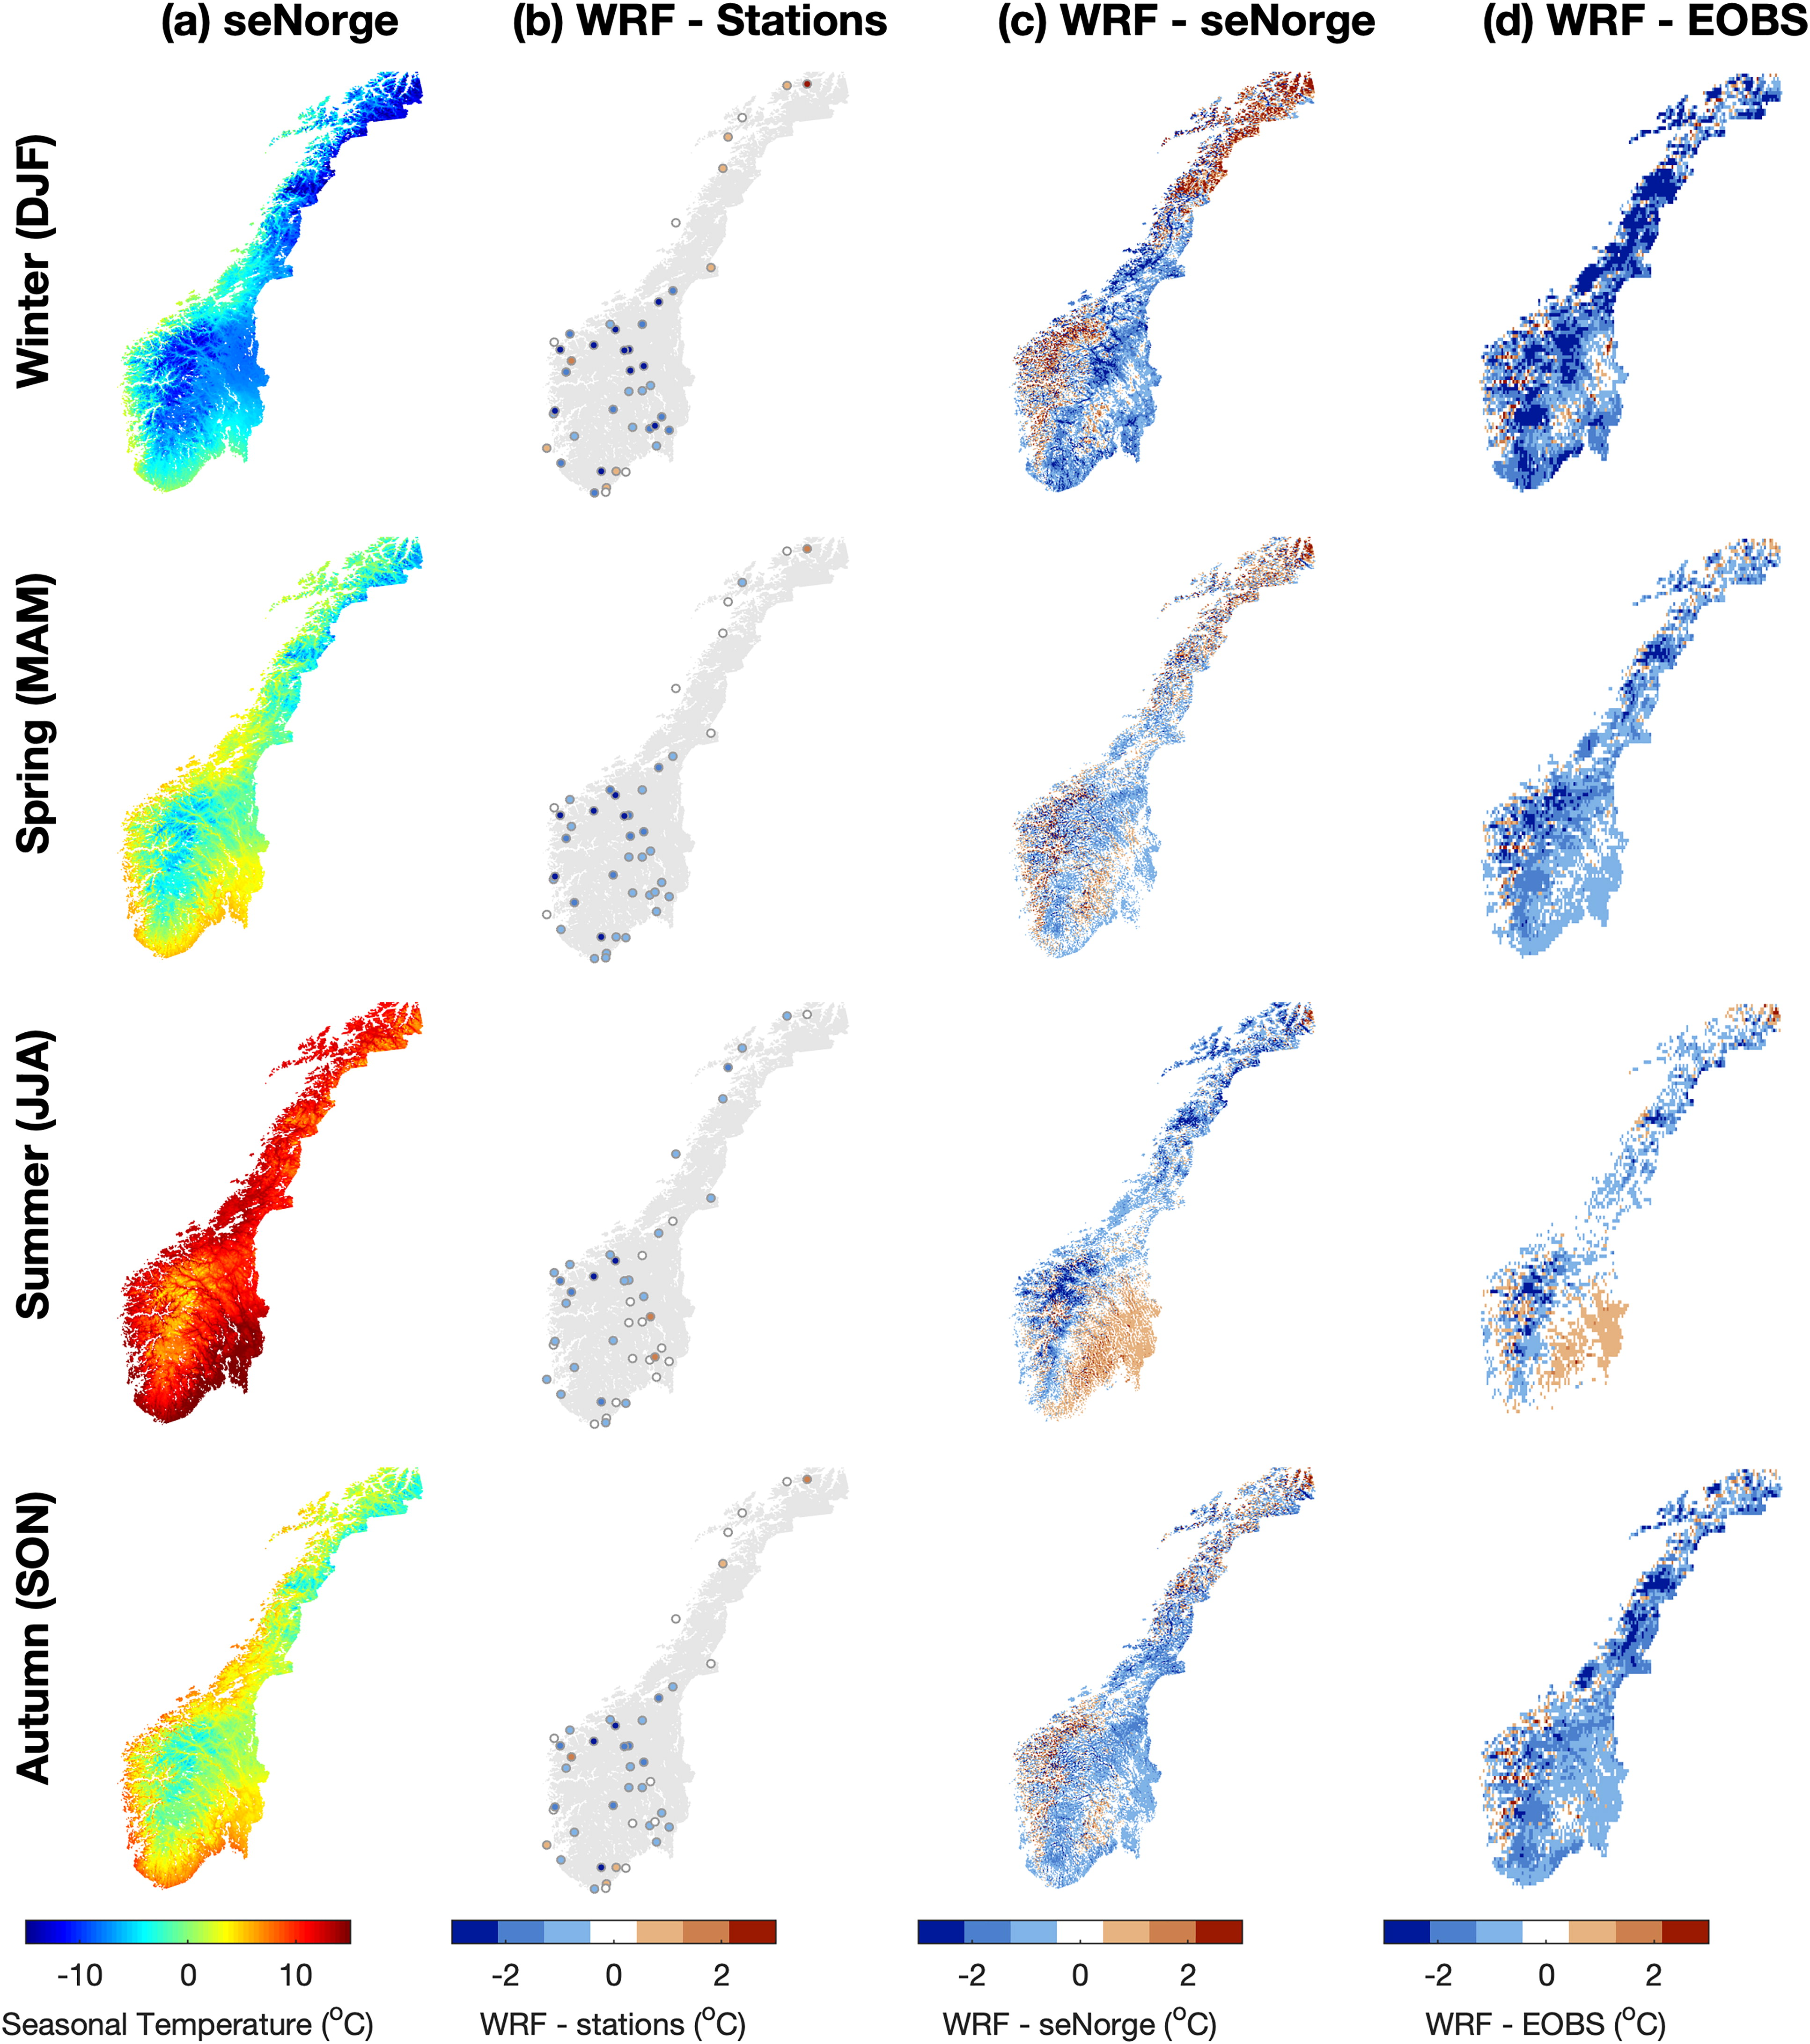
Fig. 4.
(a) Seasonal surface air temperature at 2 m (T2m) from the gridded observational product seNorge2018. (b) Bias in seasonal simulated T2m based on observed station data. (c) Bias in seasonal simulated T2m based on seNorge2018 gridded observational product. (d) Bias in seasonal simulated T2m based on EOBS gridded observational product.
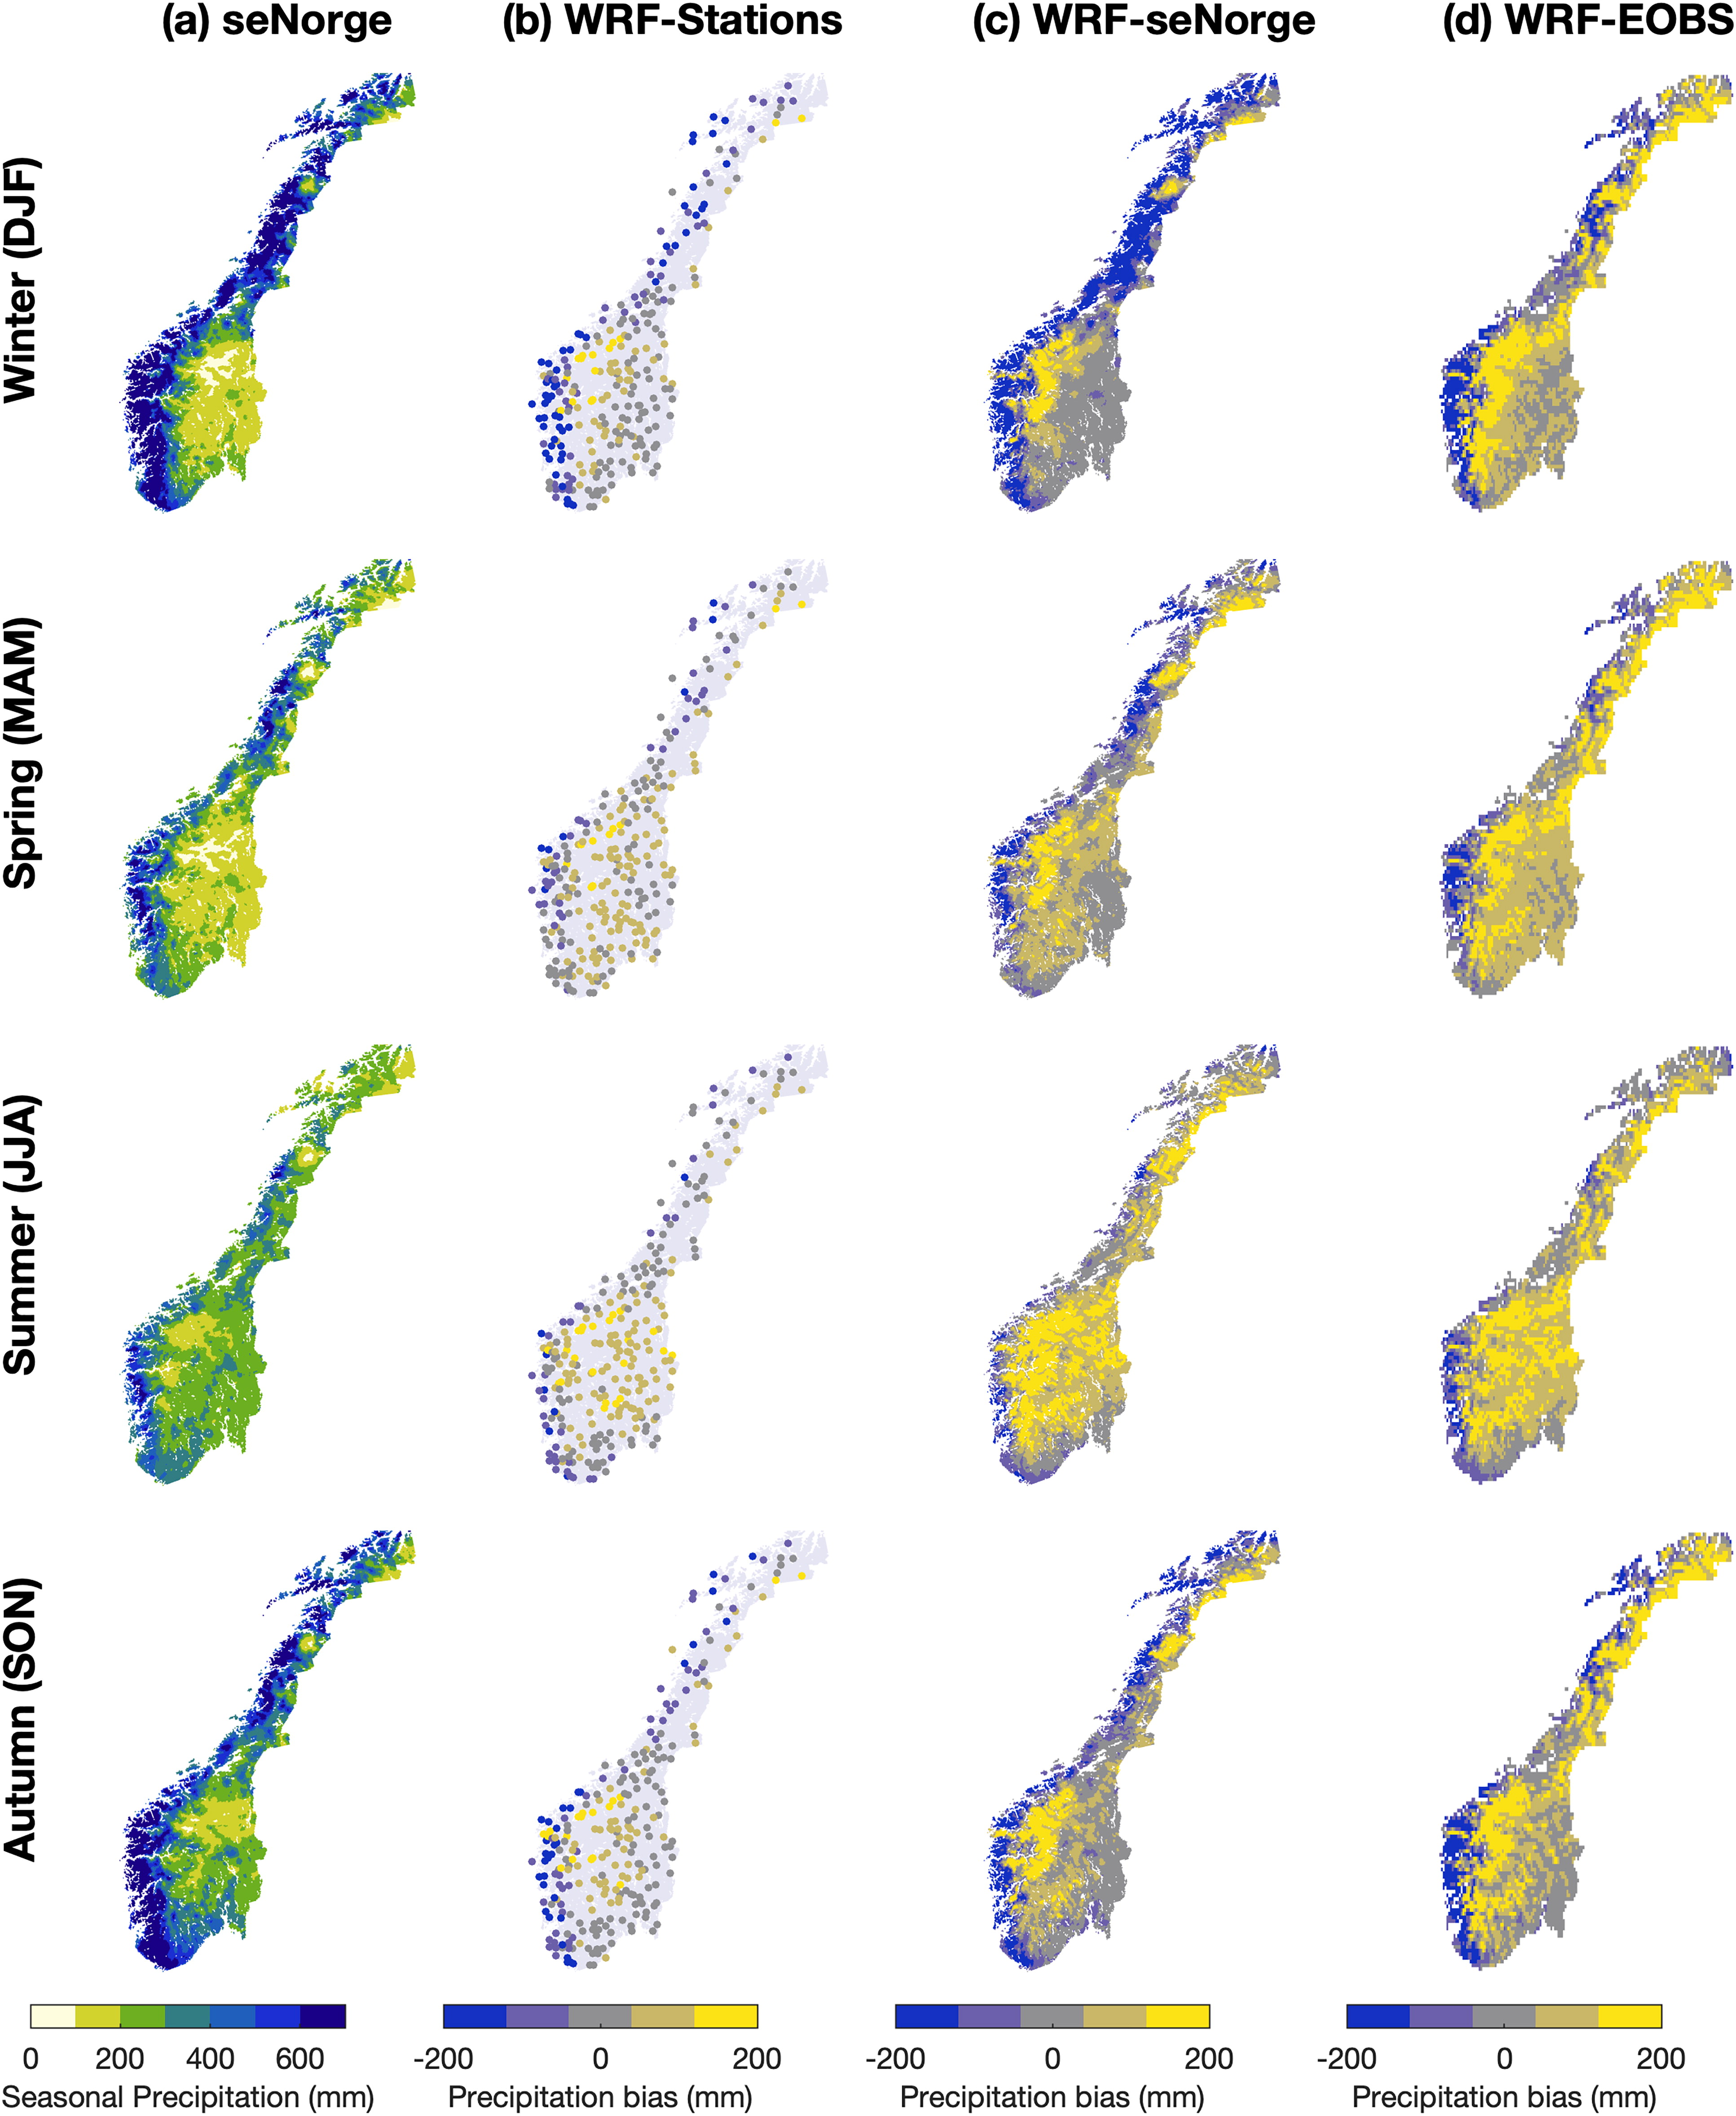
Fig. 5.
Same as Fig. 4 except for precipitation.
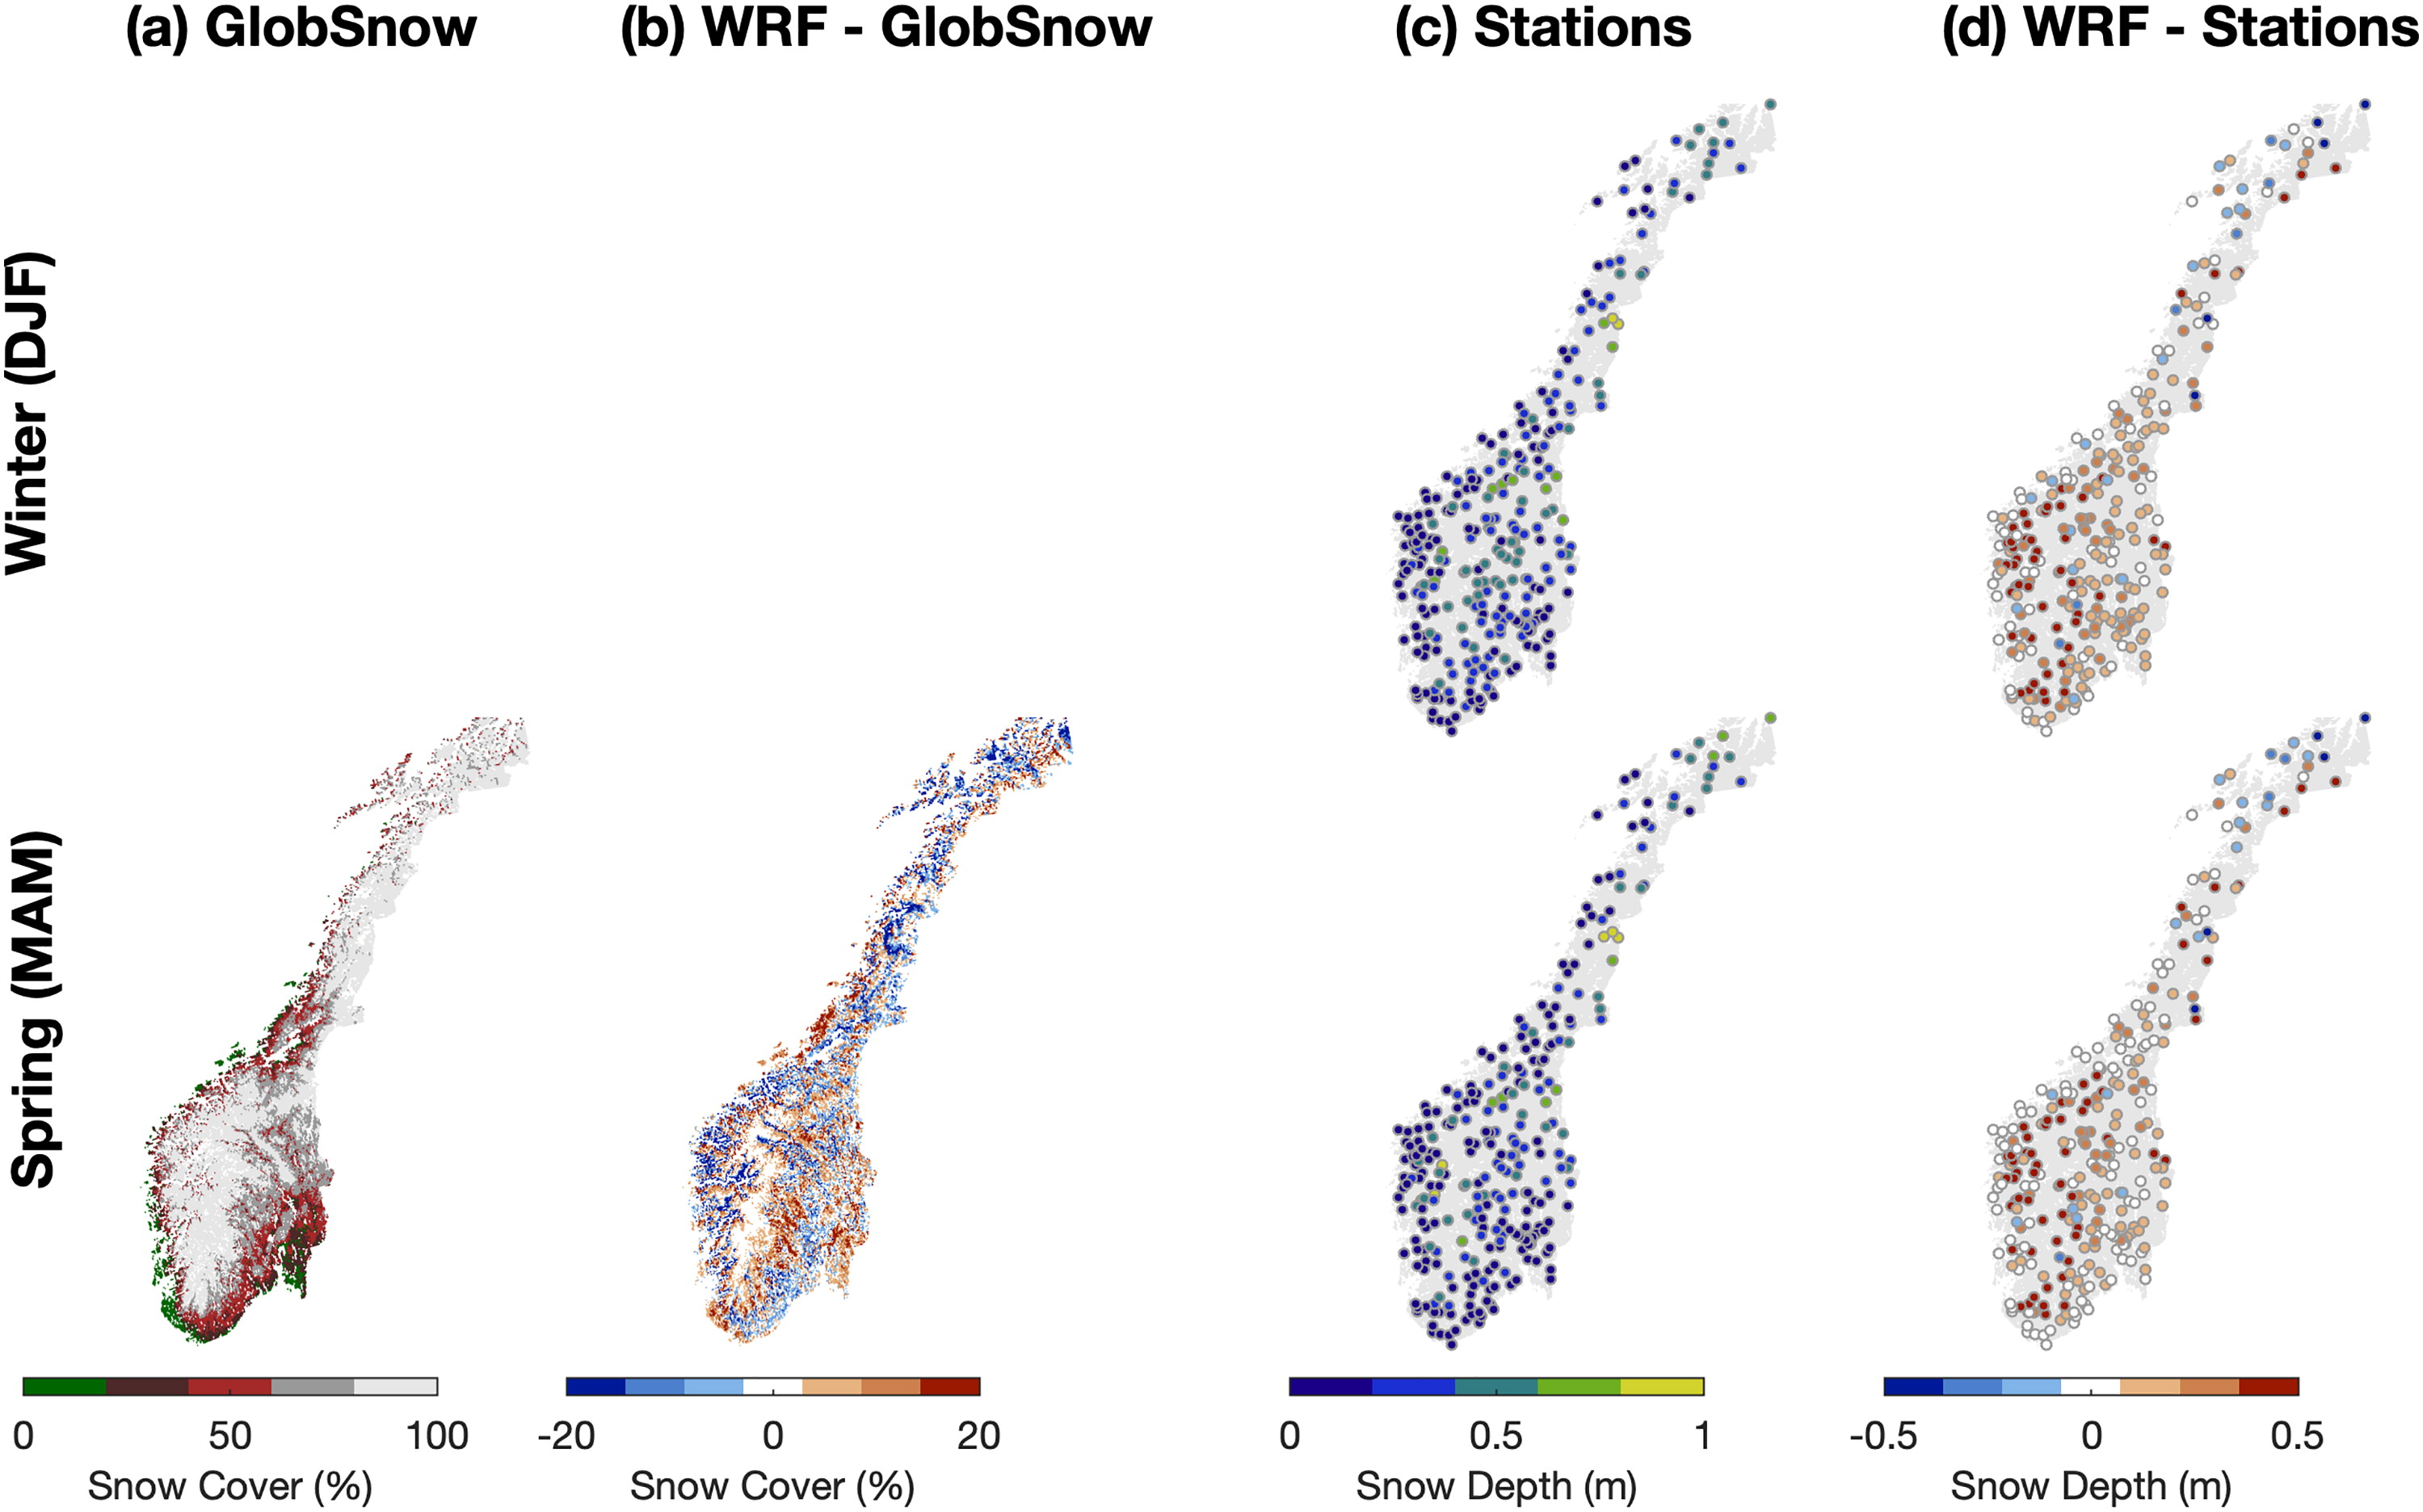
Fig. 6.
(a) Spring fractional snow cover from GlobSnow2. (b) Model bias in the spring fractional snow cover simulated by WRF over the 3 km domain. (c) Winter and spring snow depth at stations. (d) Model bias in snow depth for winter and spring simulated by WRF over the 3 km domain.
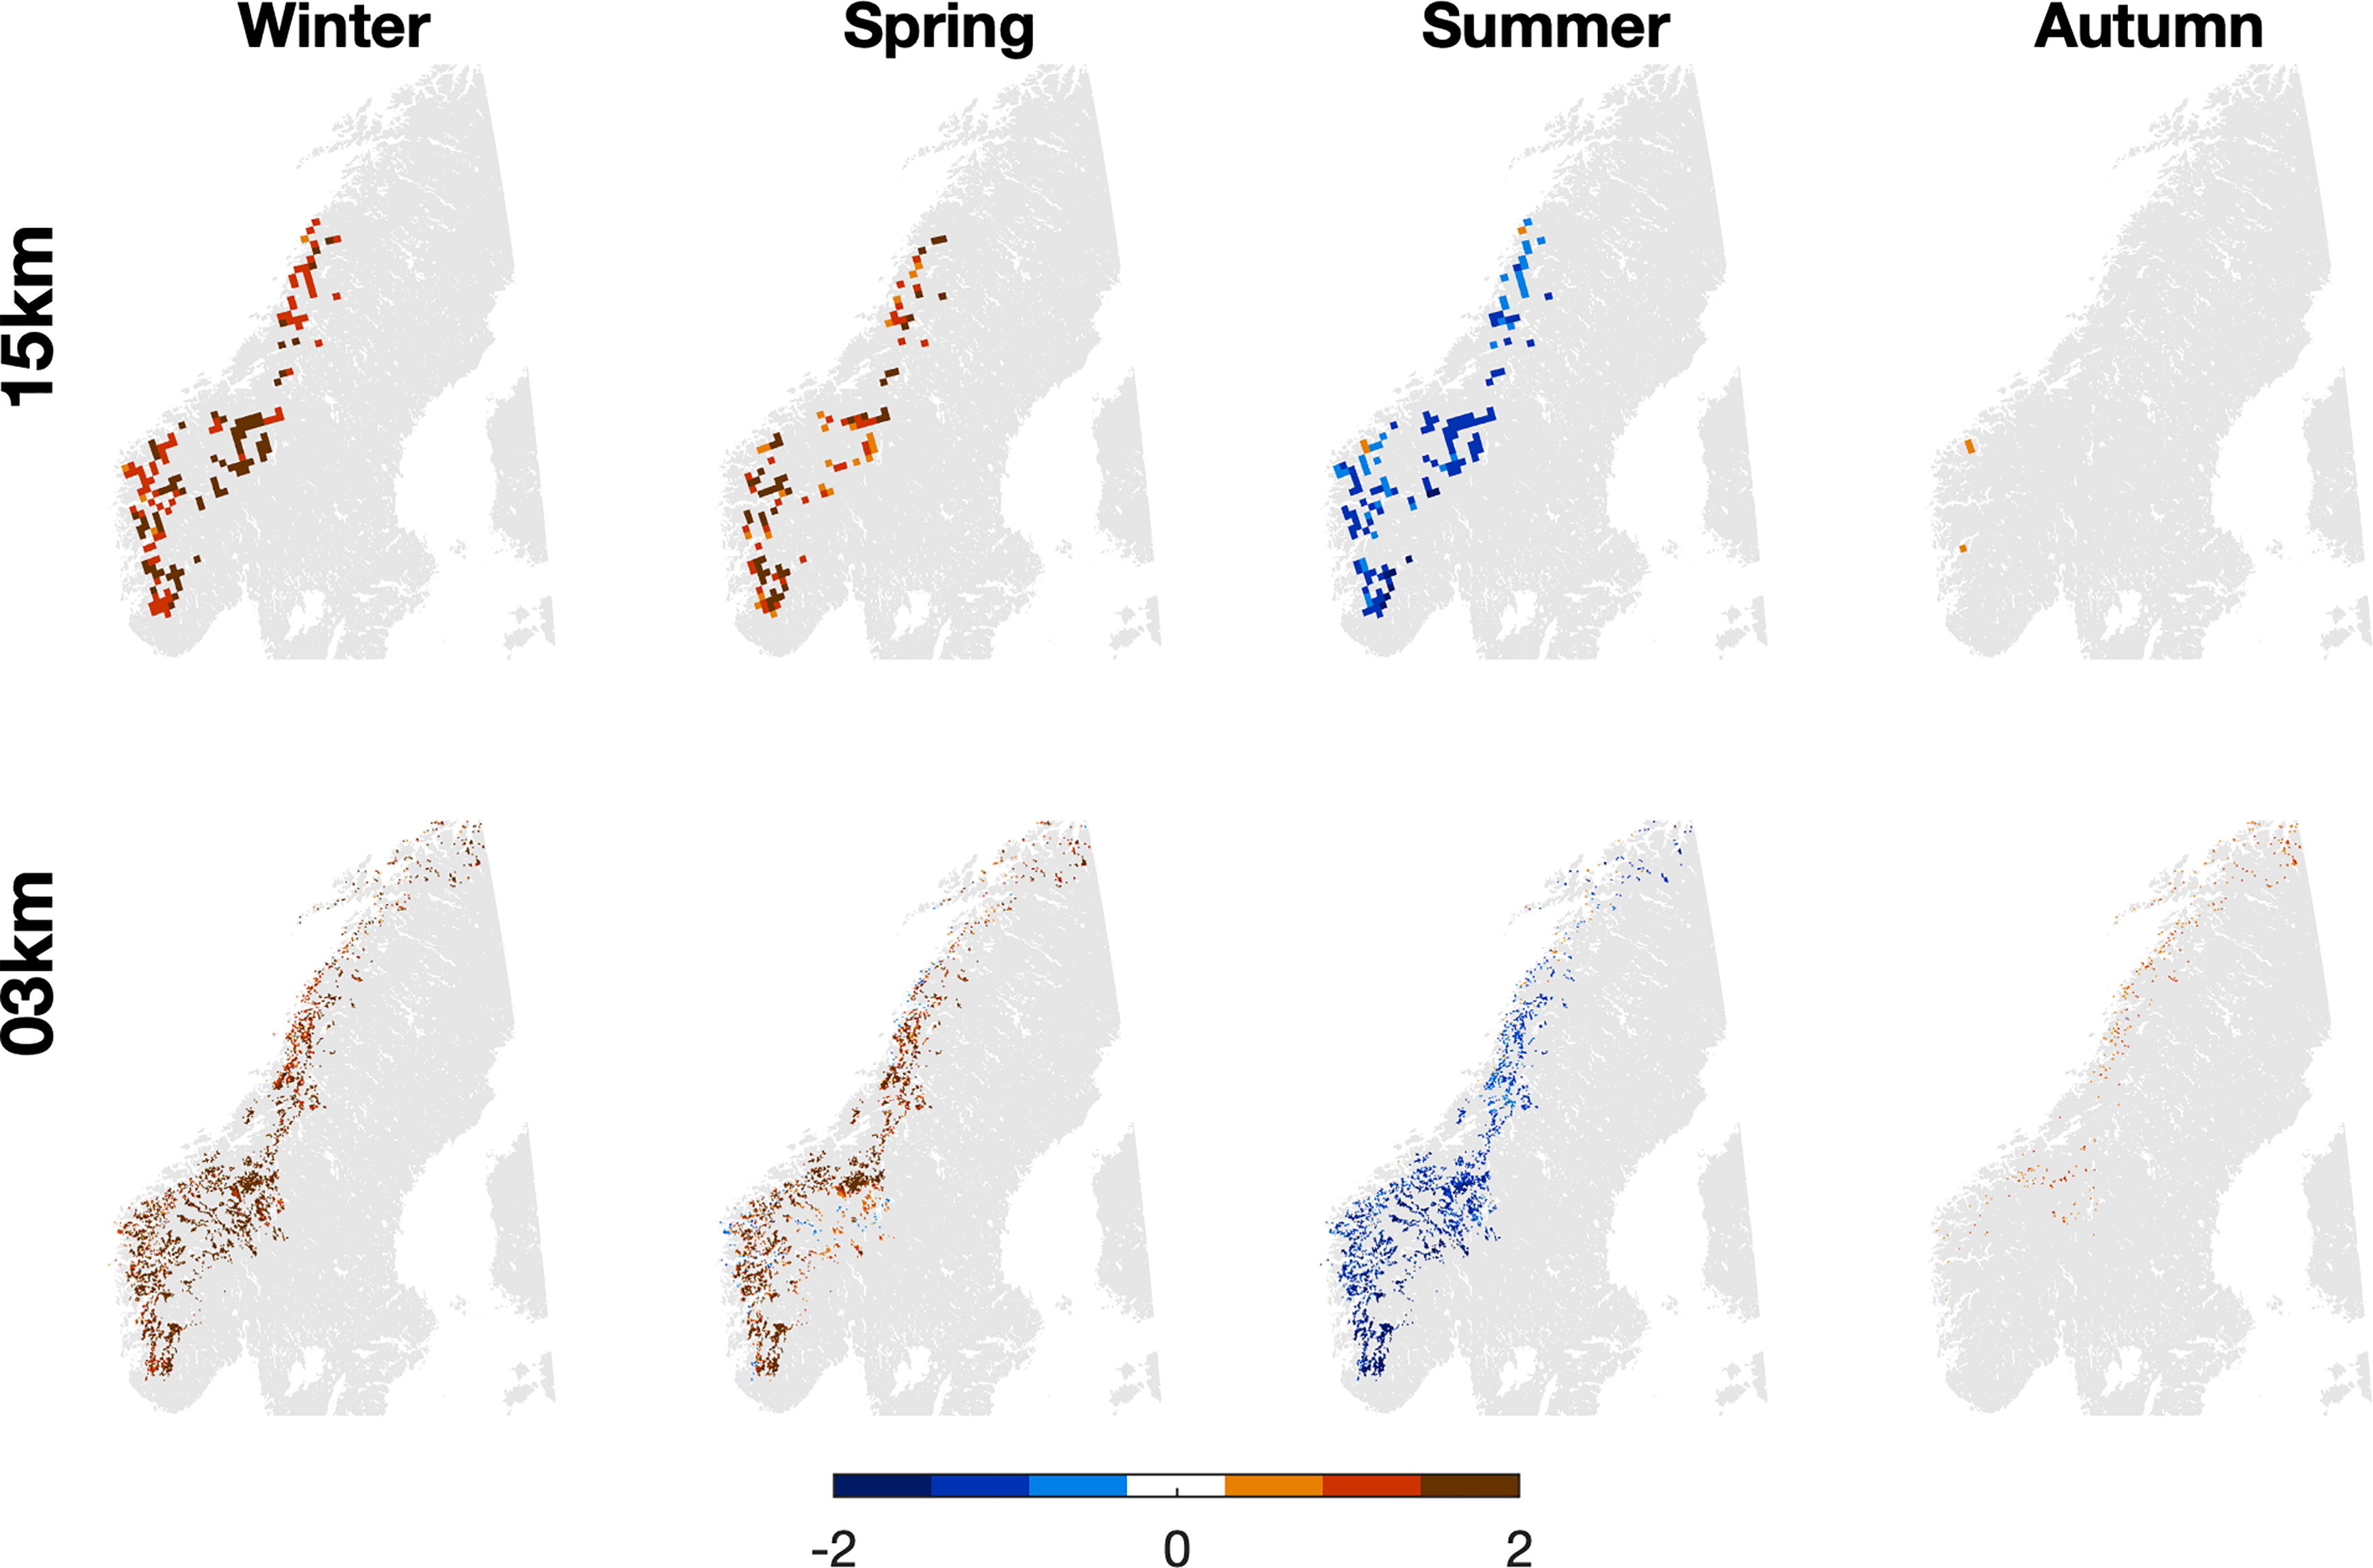
Fig. 7.
Simulated daytime (12 UTC) surface temperature response to converting the land cover from grasslands to evergreen in the 15 km simulation (top row) and in the 3 km simulation (2nd row) for each of the four northern hemisphere seasons (columns) over the historical period (1996–2005). Only grid boxes that exhibit a statistically significant change at the 95% level are shown.
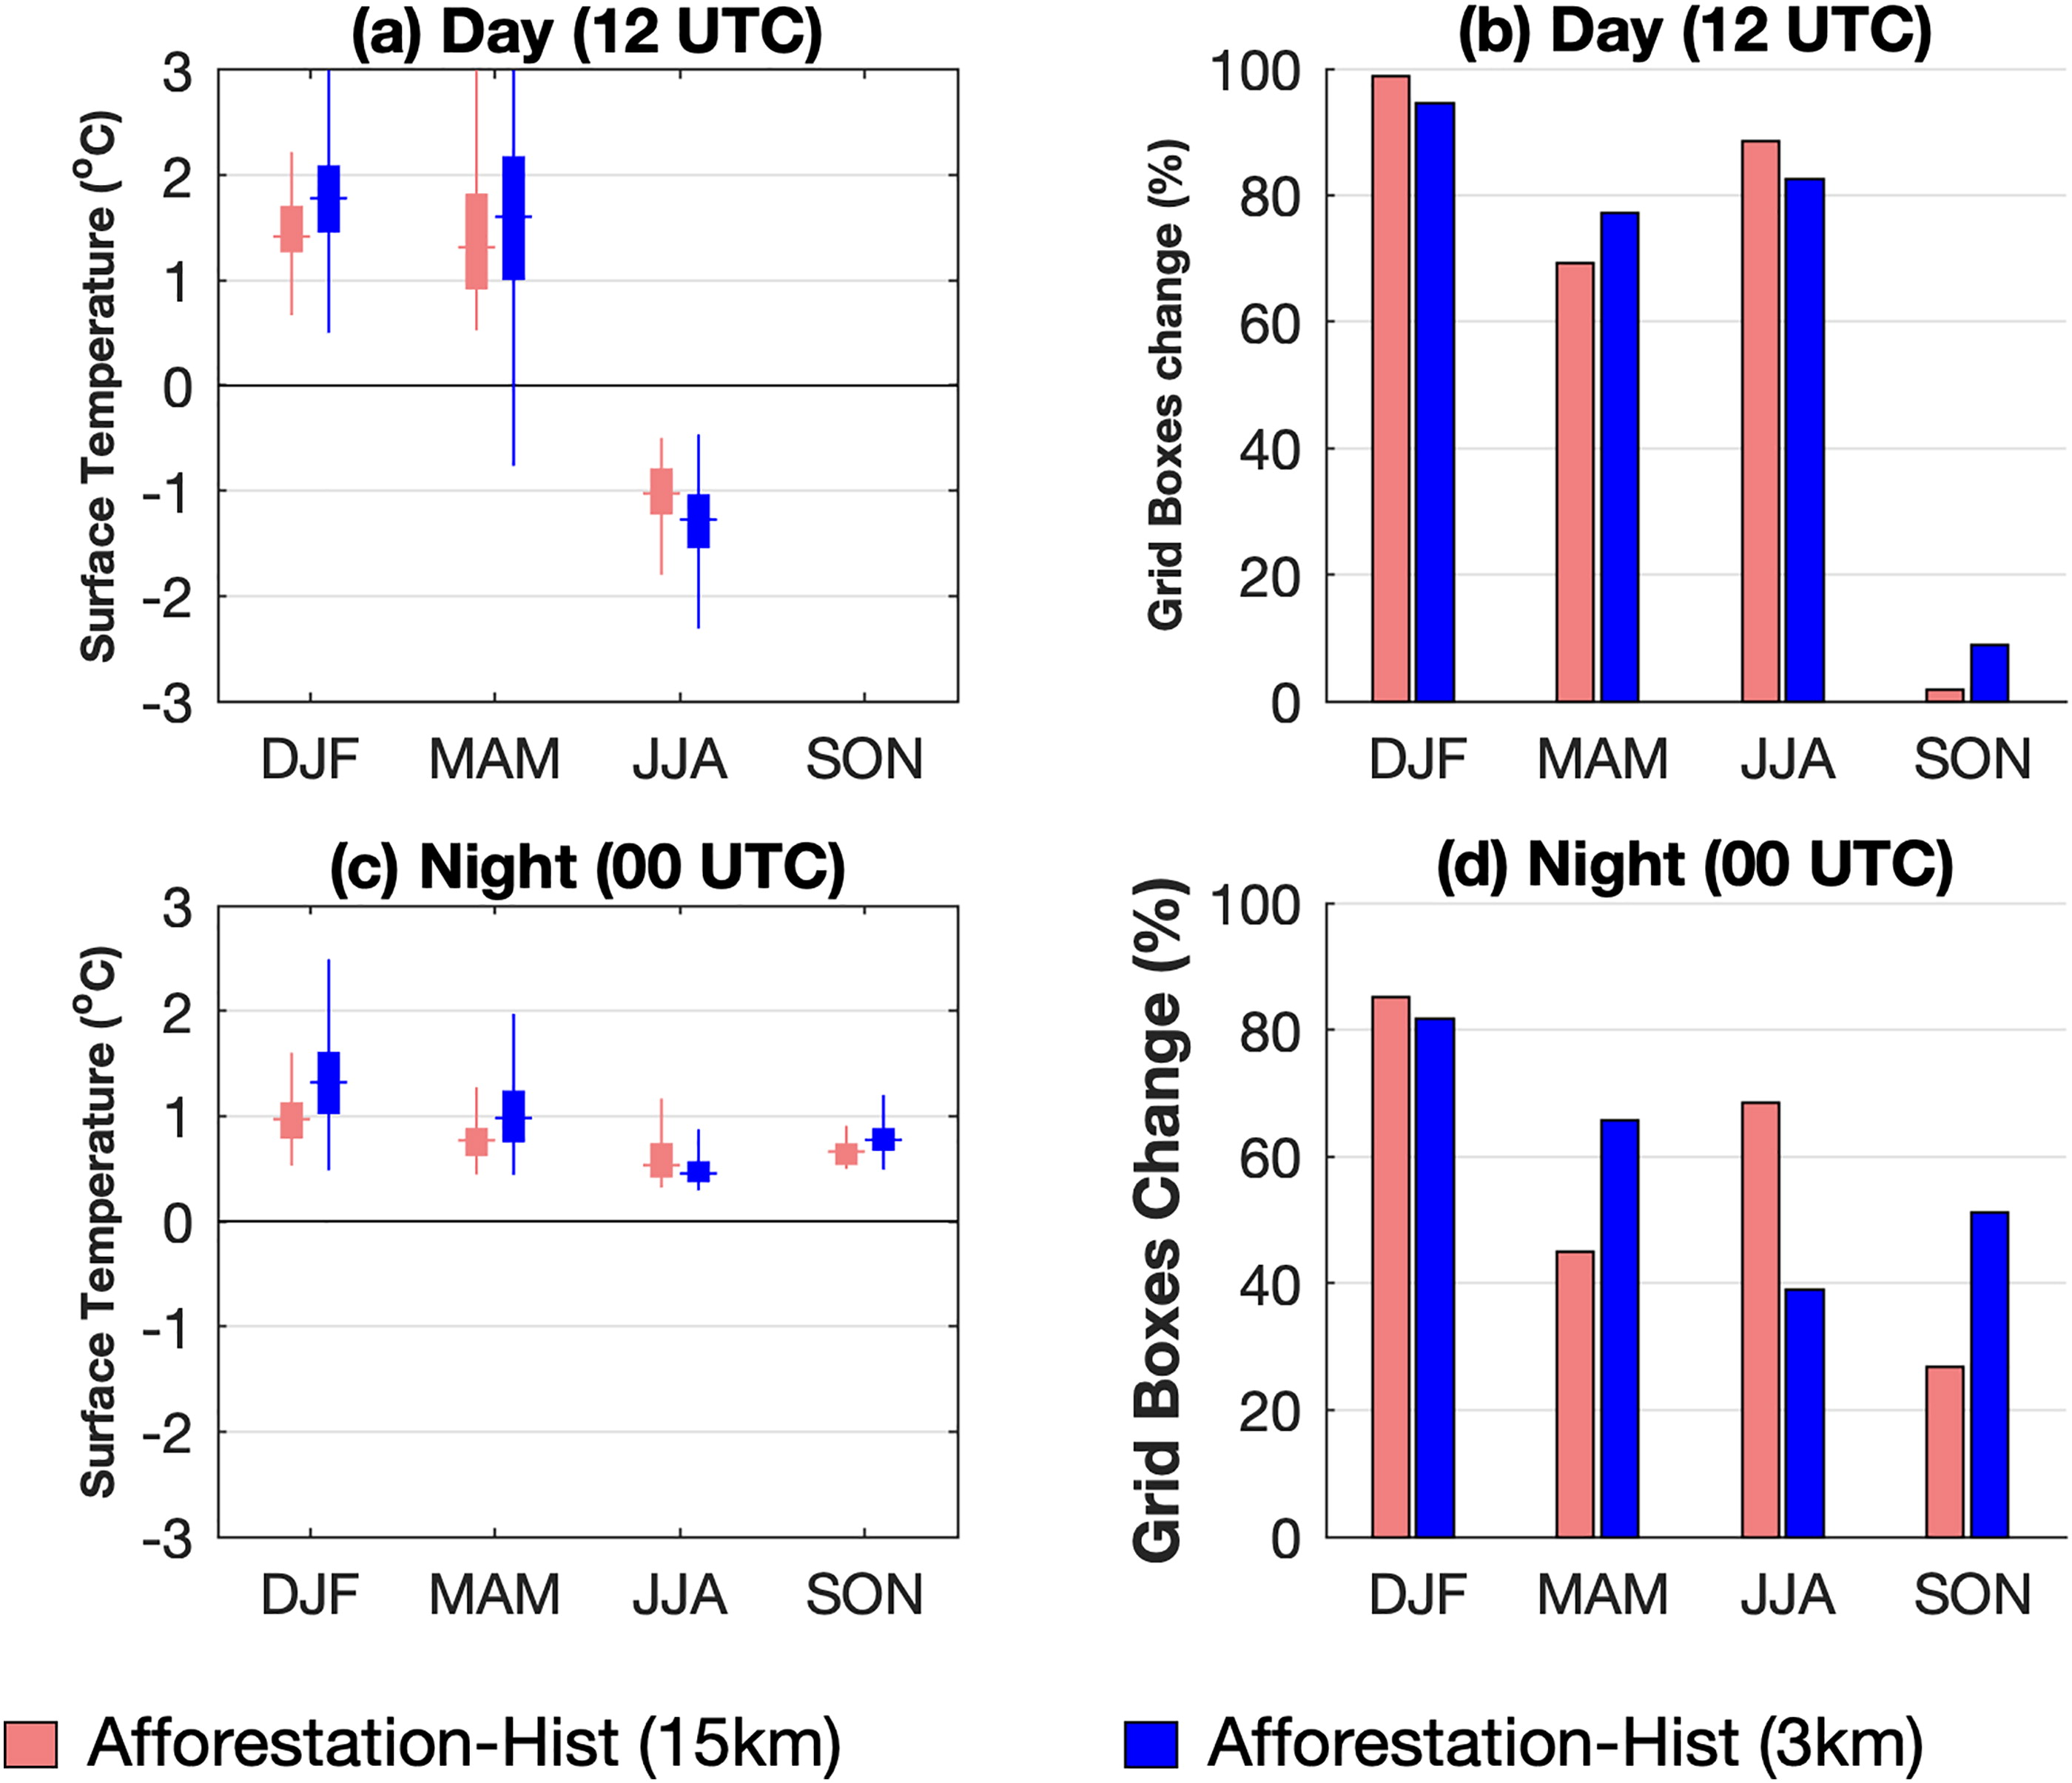
Fig. 8.
(a) Spatial mean and variability of the daytime surface temperature response for each season for both the 15 km (red) and 3 km (blue) simulations. (b) Percentage of LULCC grid boxes that show a statistically significant (95% confidence level) surface temperature response to the LULCC during the daytime. (c) and (d) same as (a) and (b) except for night-time.
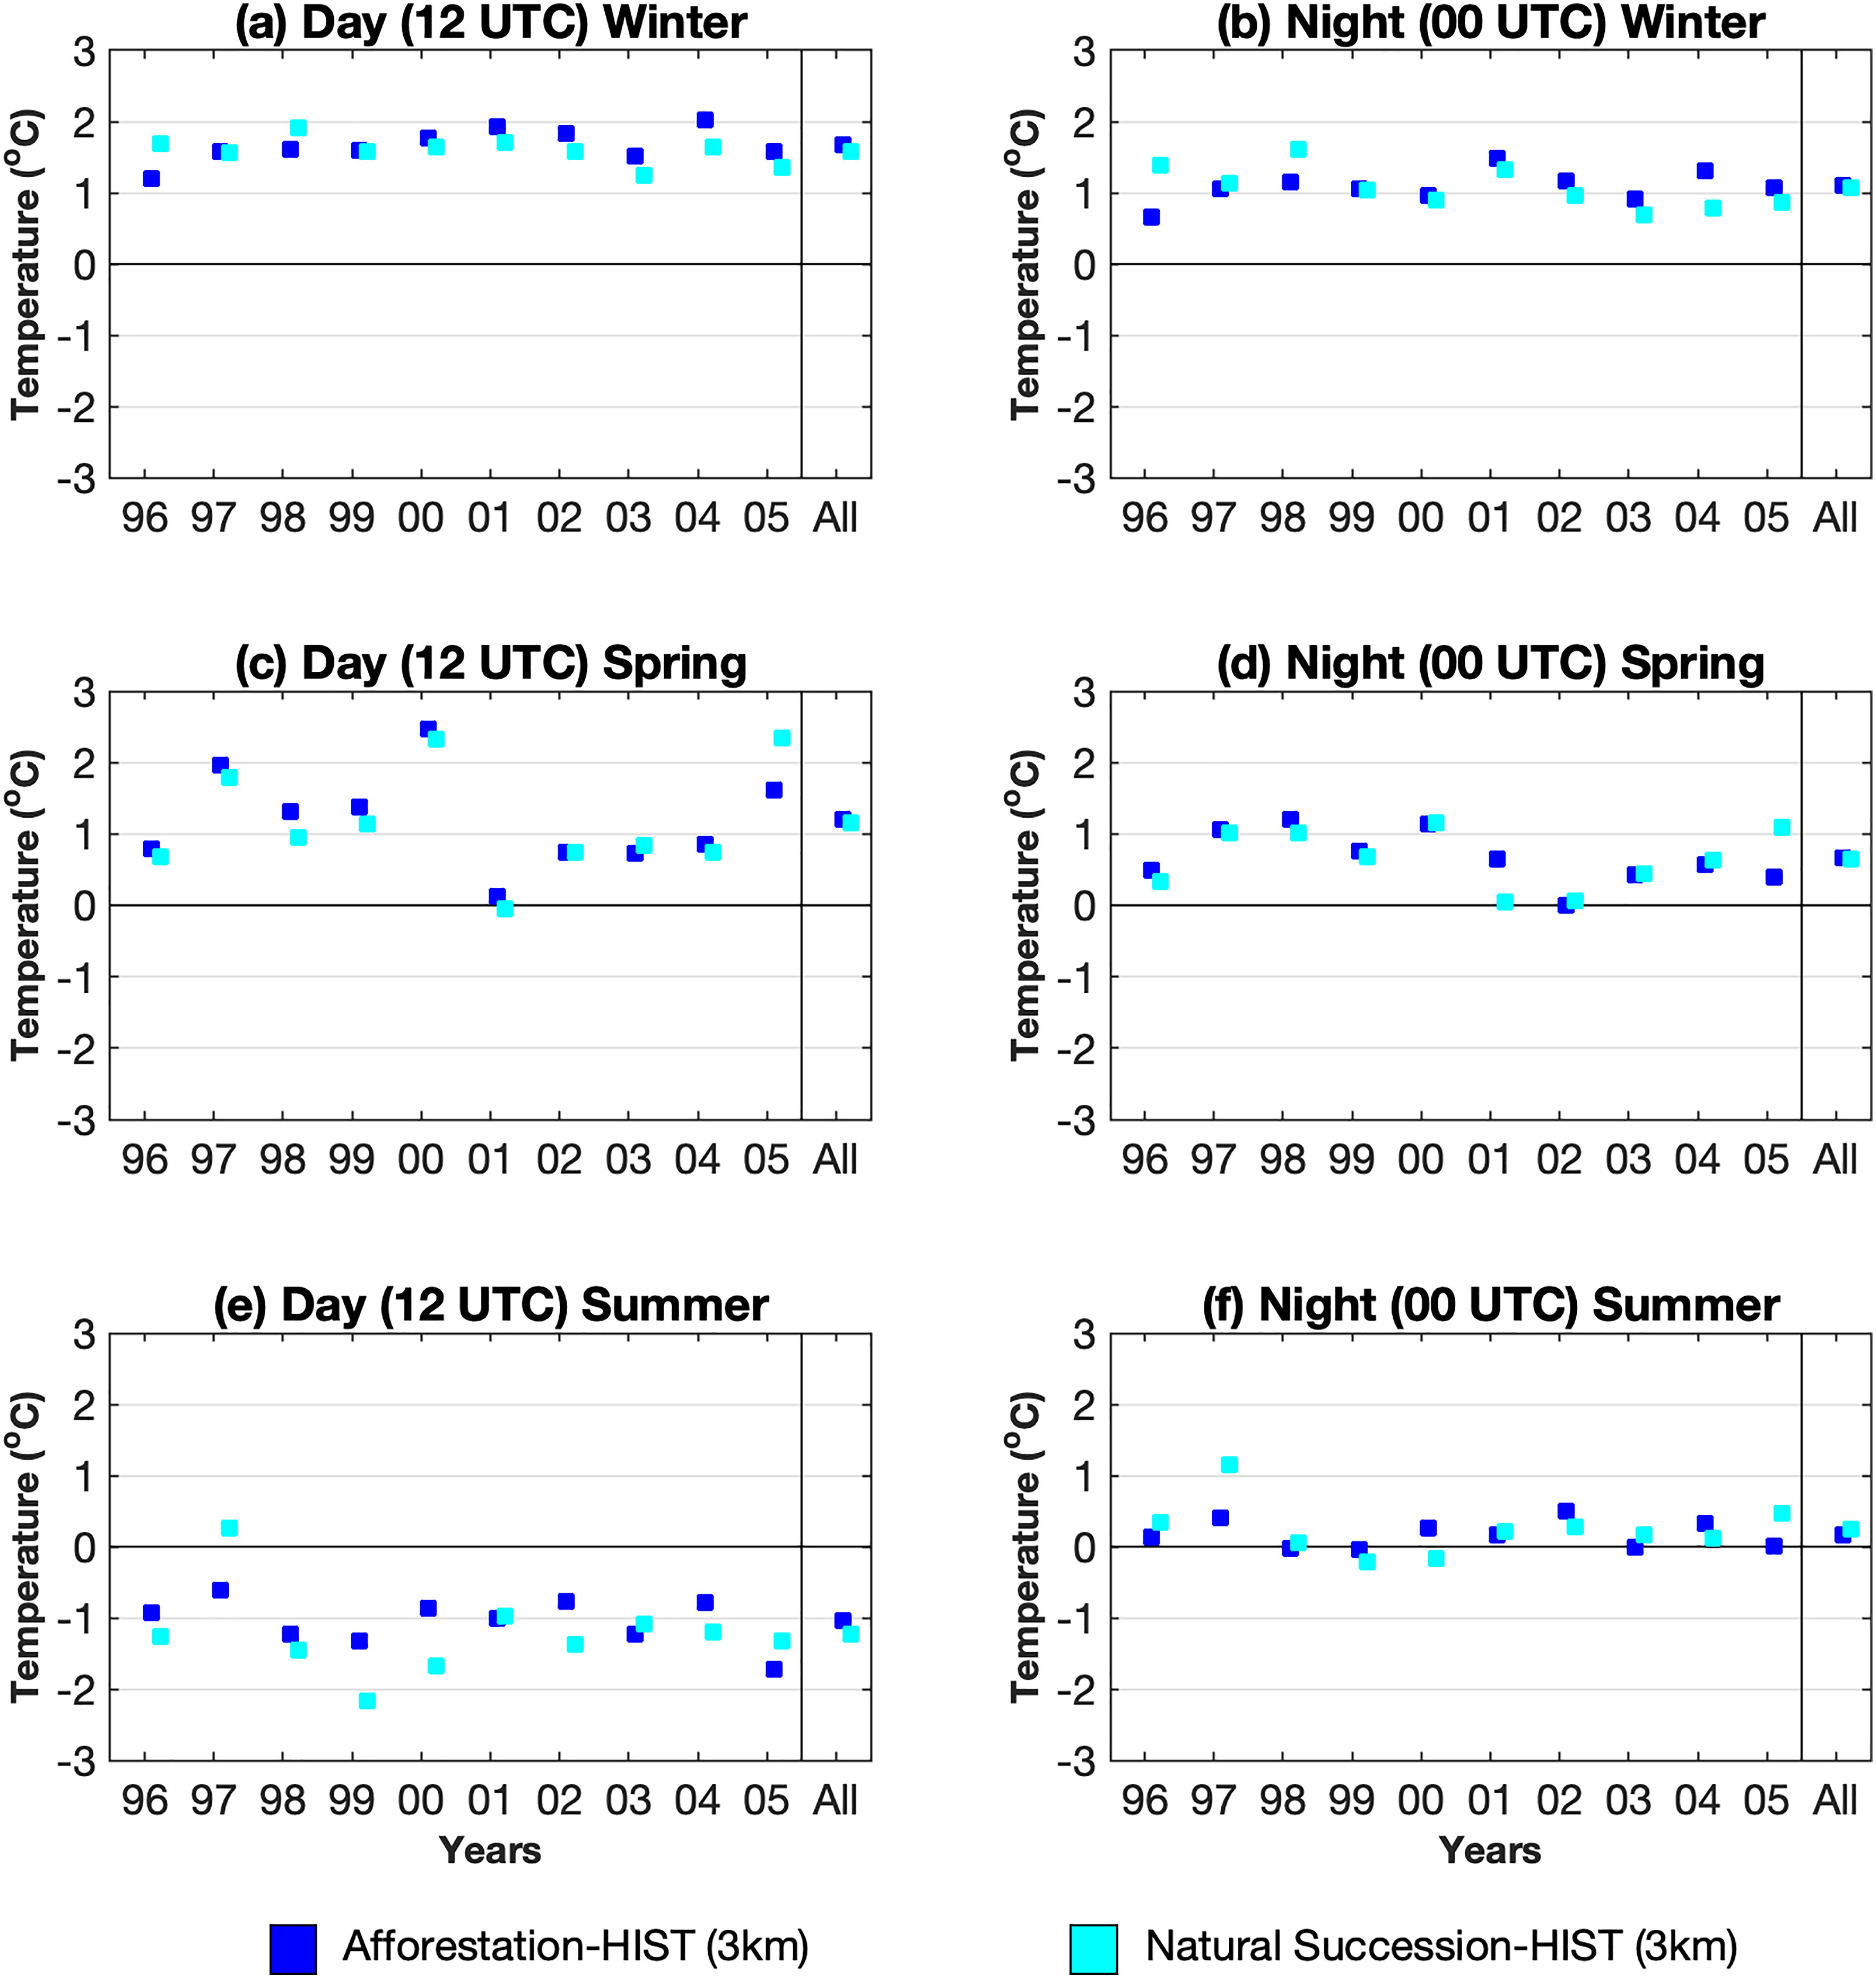
Fig. 9.
(a) Mean daytime surface temperature response to LUC for winter of each year (96 - 05) and for the entire 10-year period (marked ‘All’ on x-axis). (b) same as (a) except for night-time. (c) and (d) Same as (a) and (b) except for spring. (e) and (f) Same as (a) and (b) except for summer.
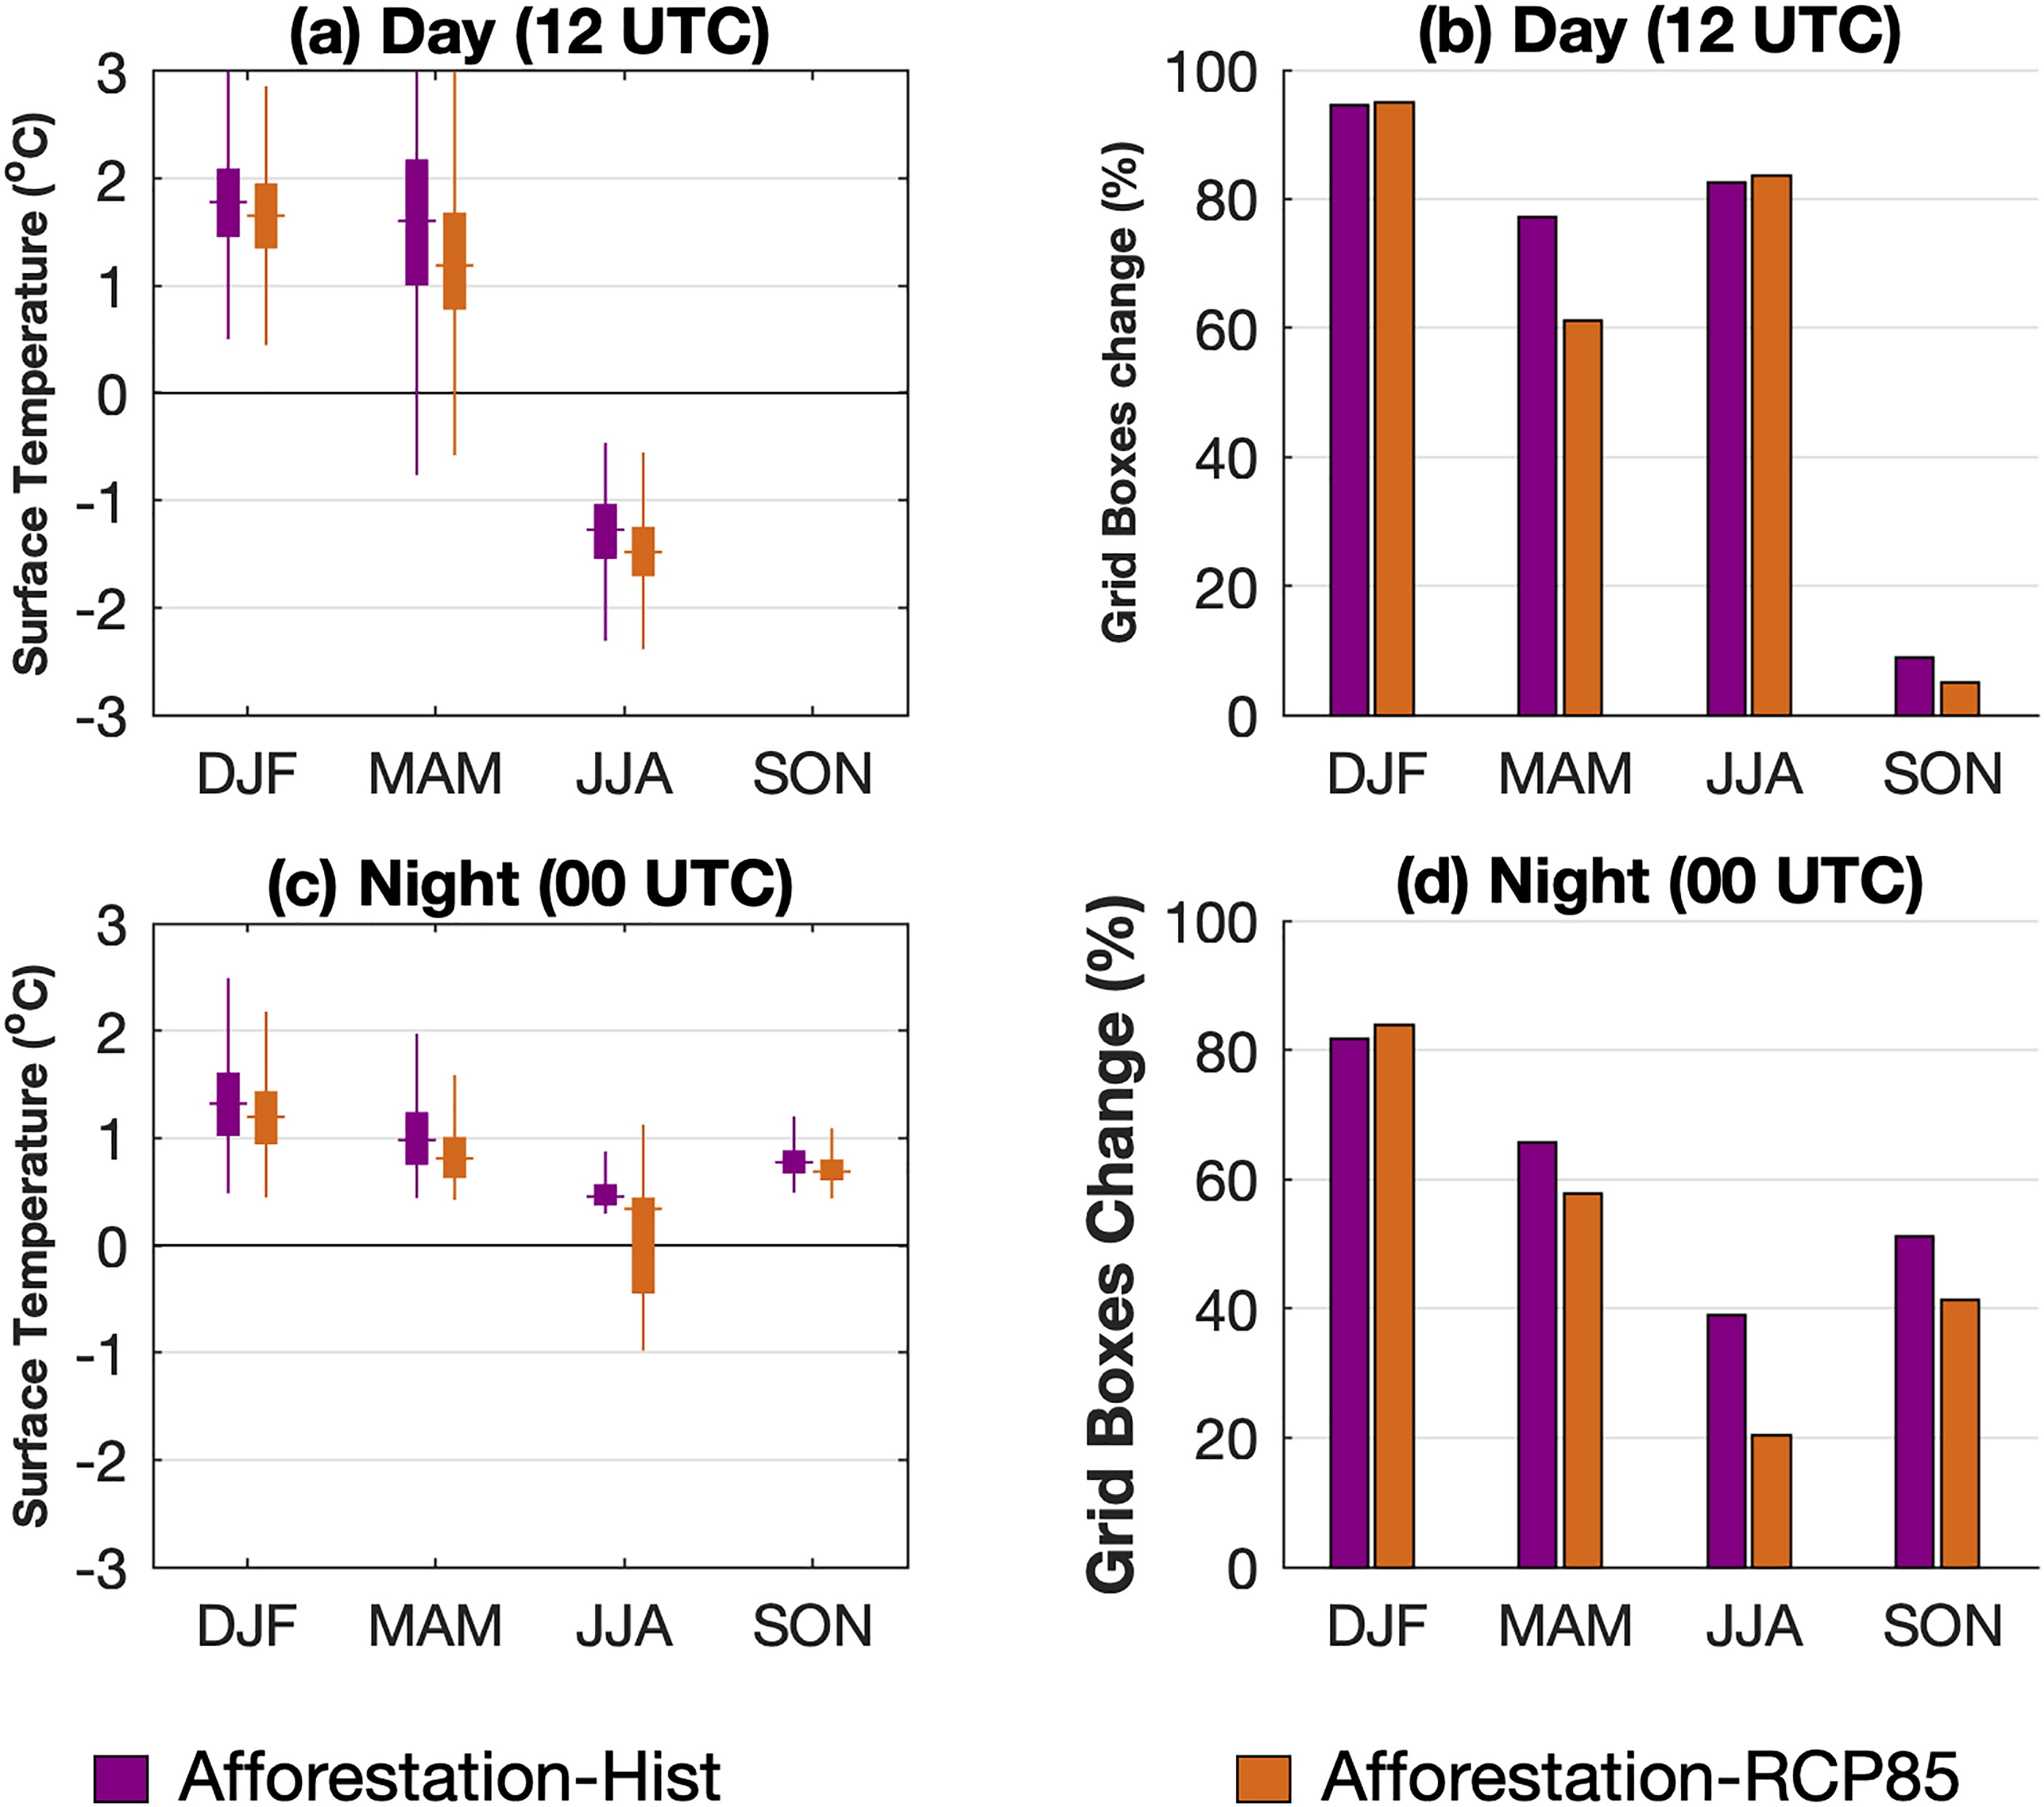
Fig. 10.
(a) Spatial mean and variability of the daytime surface temperature response from the 3 km simulations for each season for different background climates: historical climate (purple) and Mid-Century RCP8.5 climate (brown). (b) Percentage of LULCC grid boxes that show a statistically significant surface temperature response (95% confidence level) to the LULCC during the day. (c) and (d) same as (a) and (b) except for night-time.