
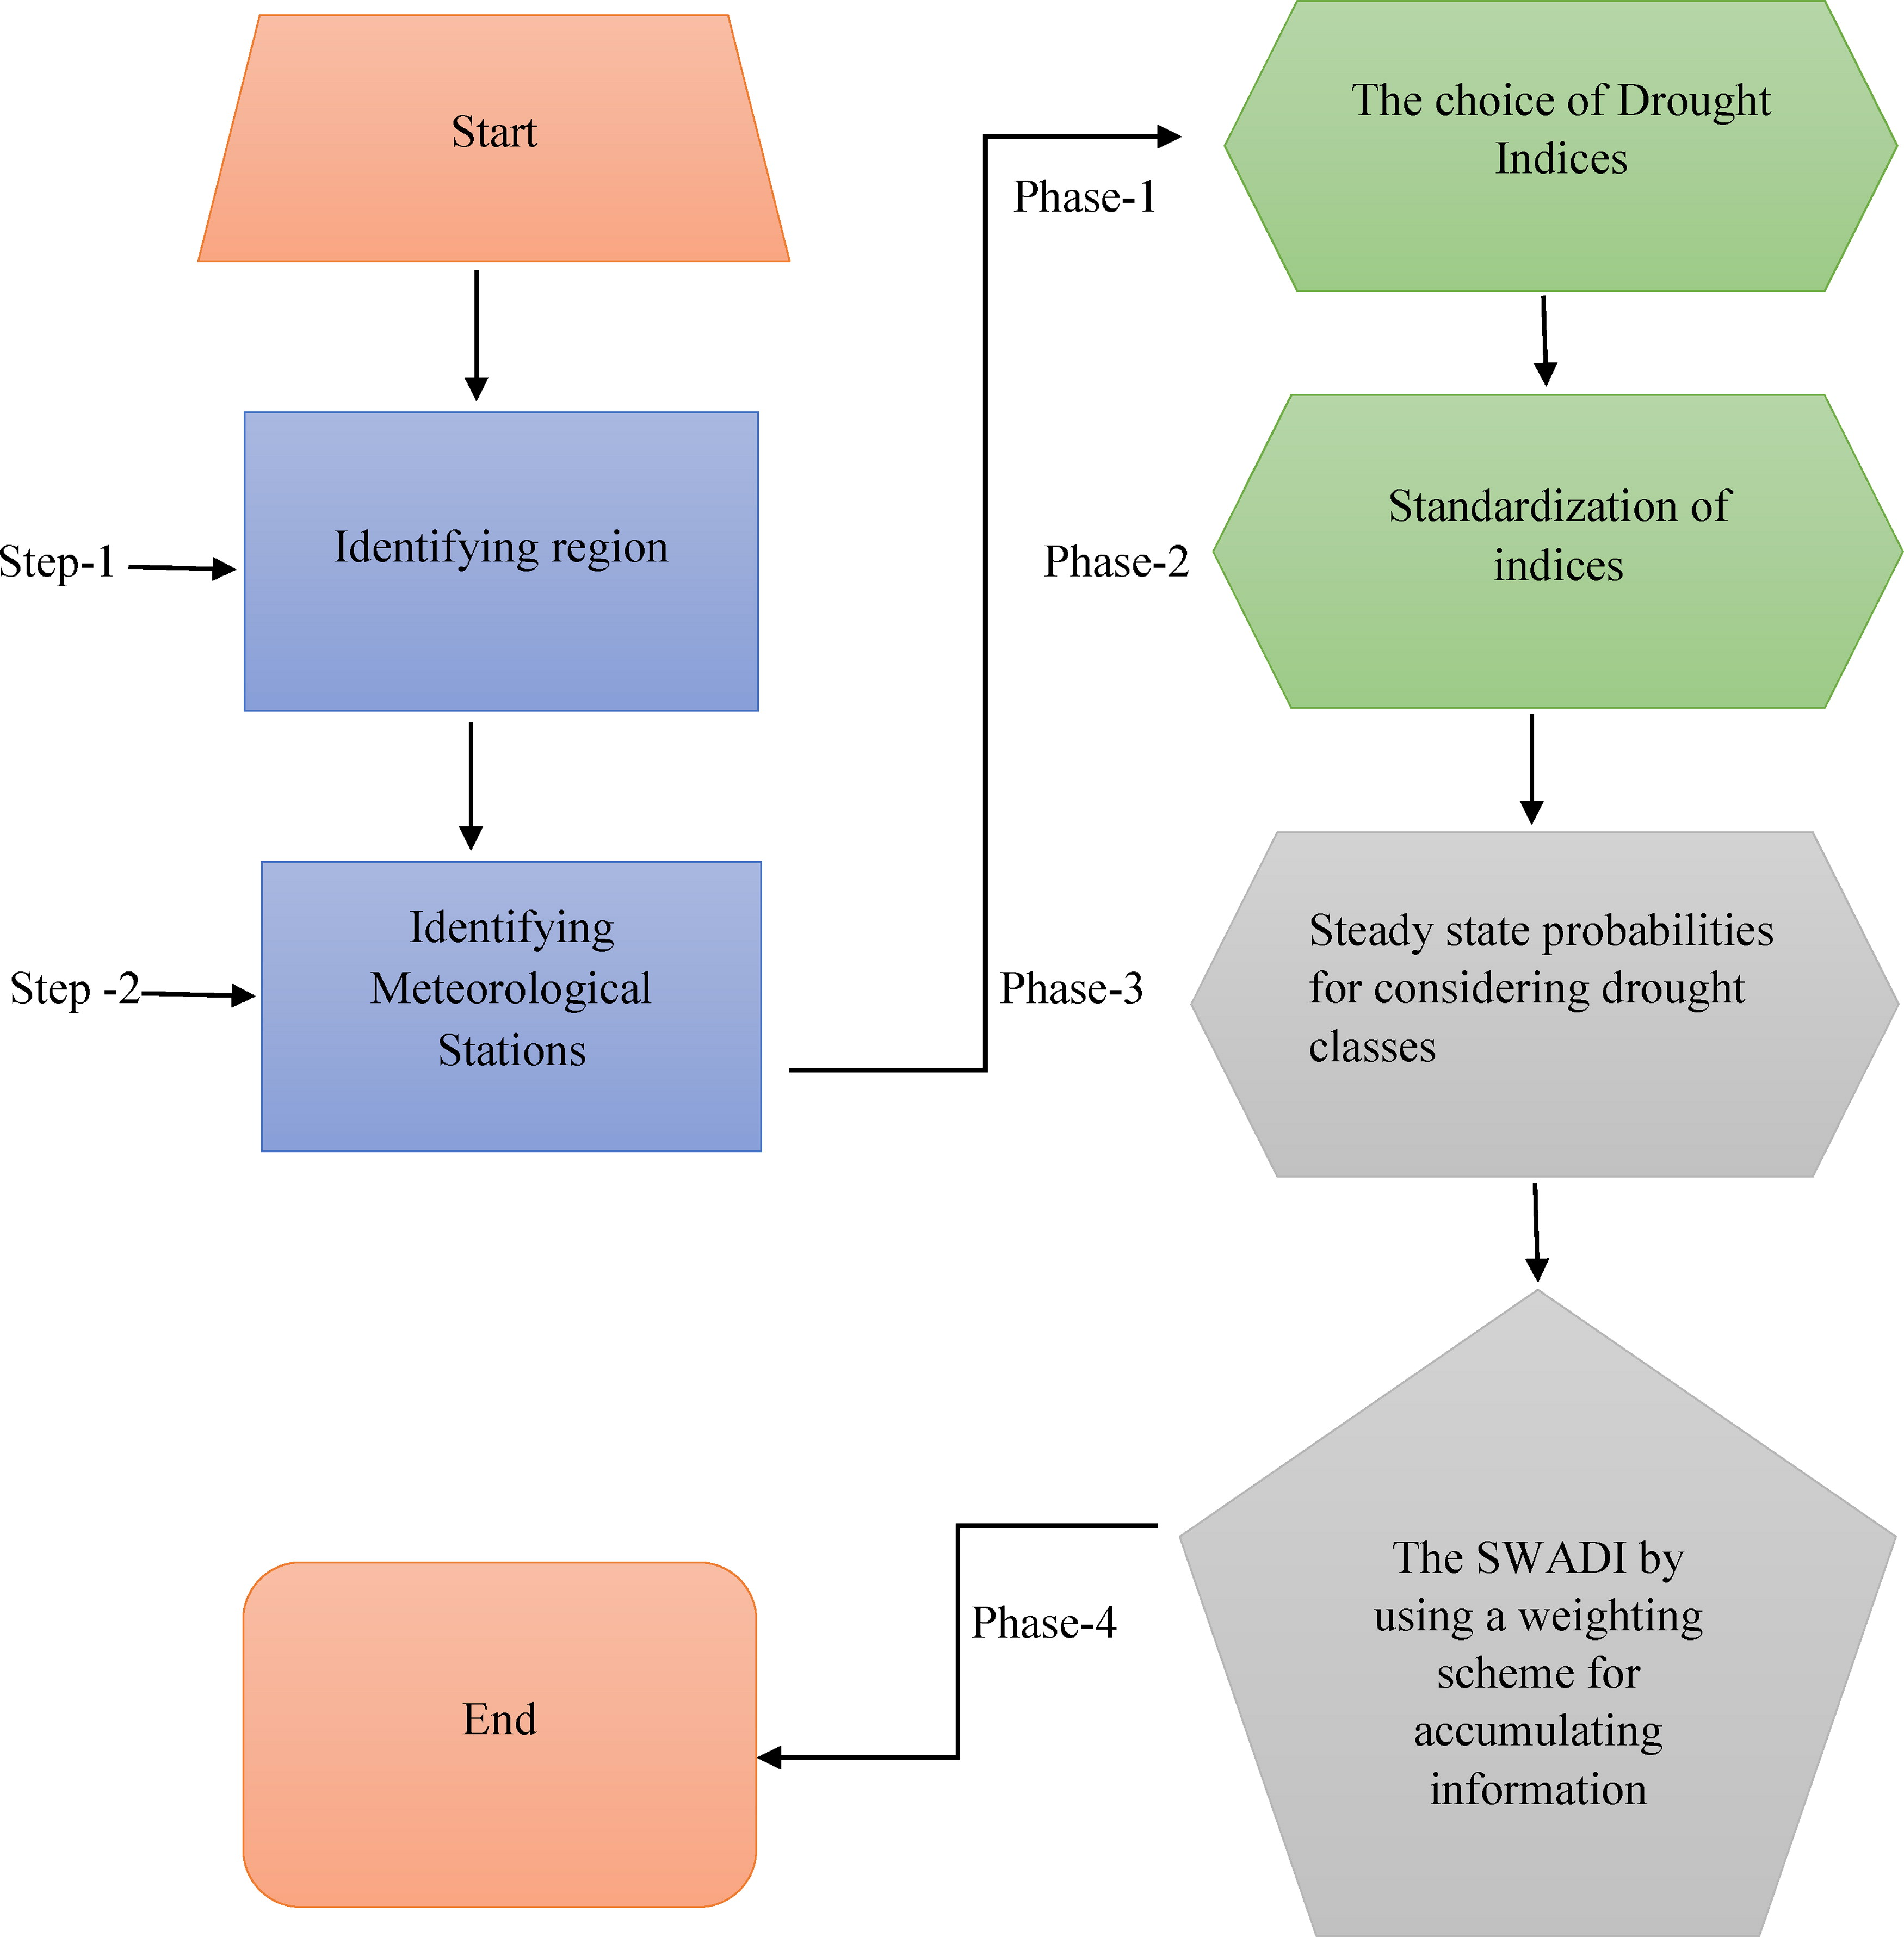
Fig. 1.
Flow chart of the proposed procedure.
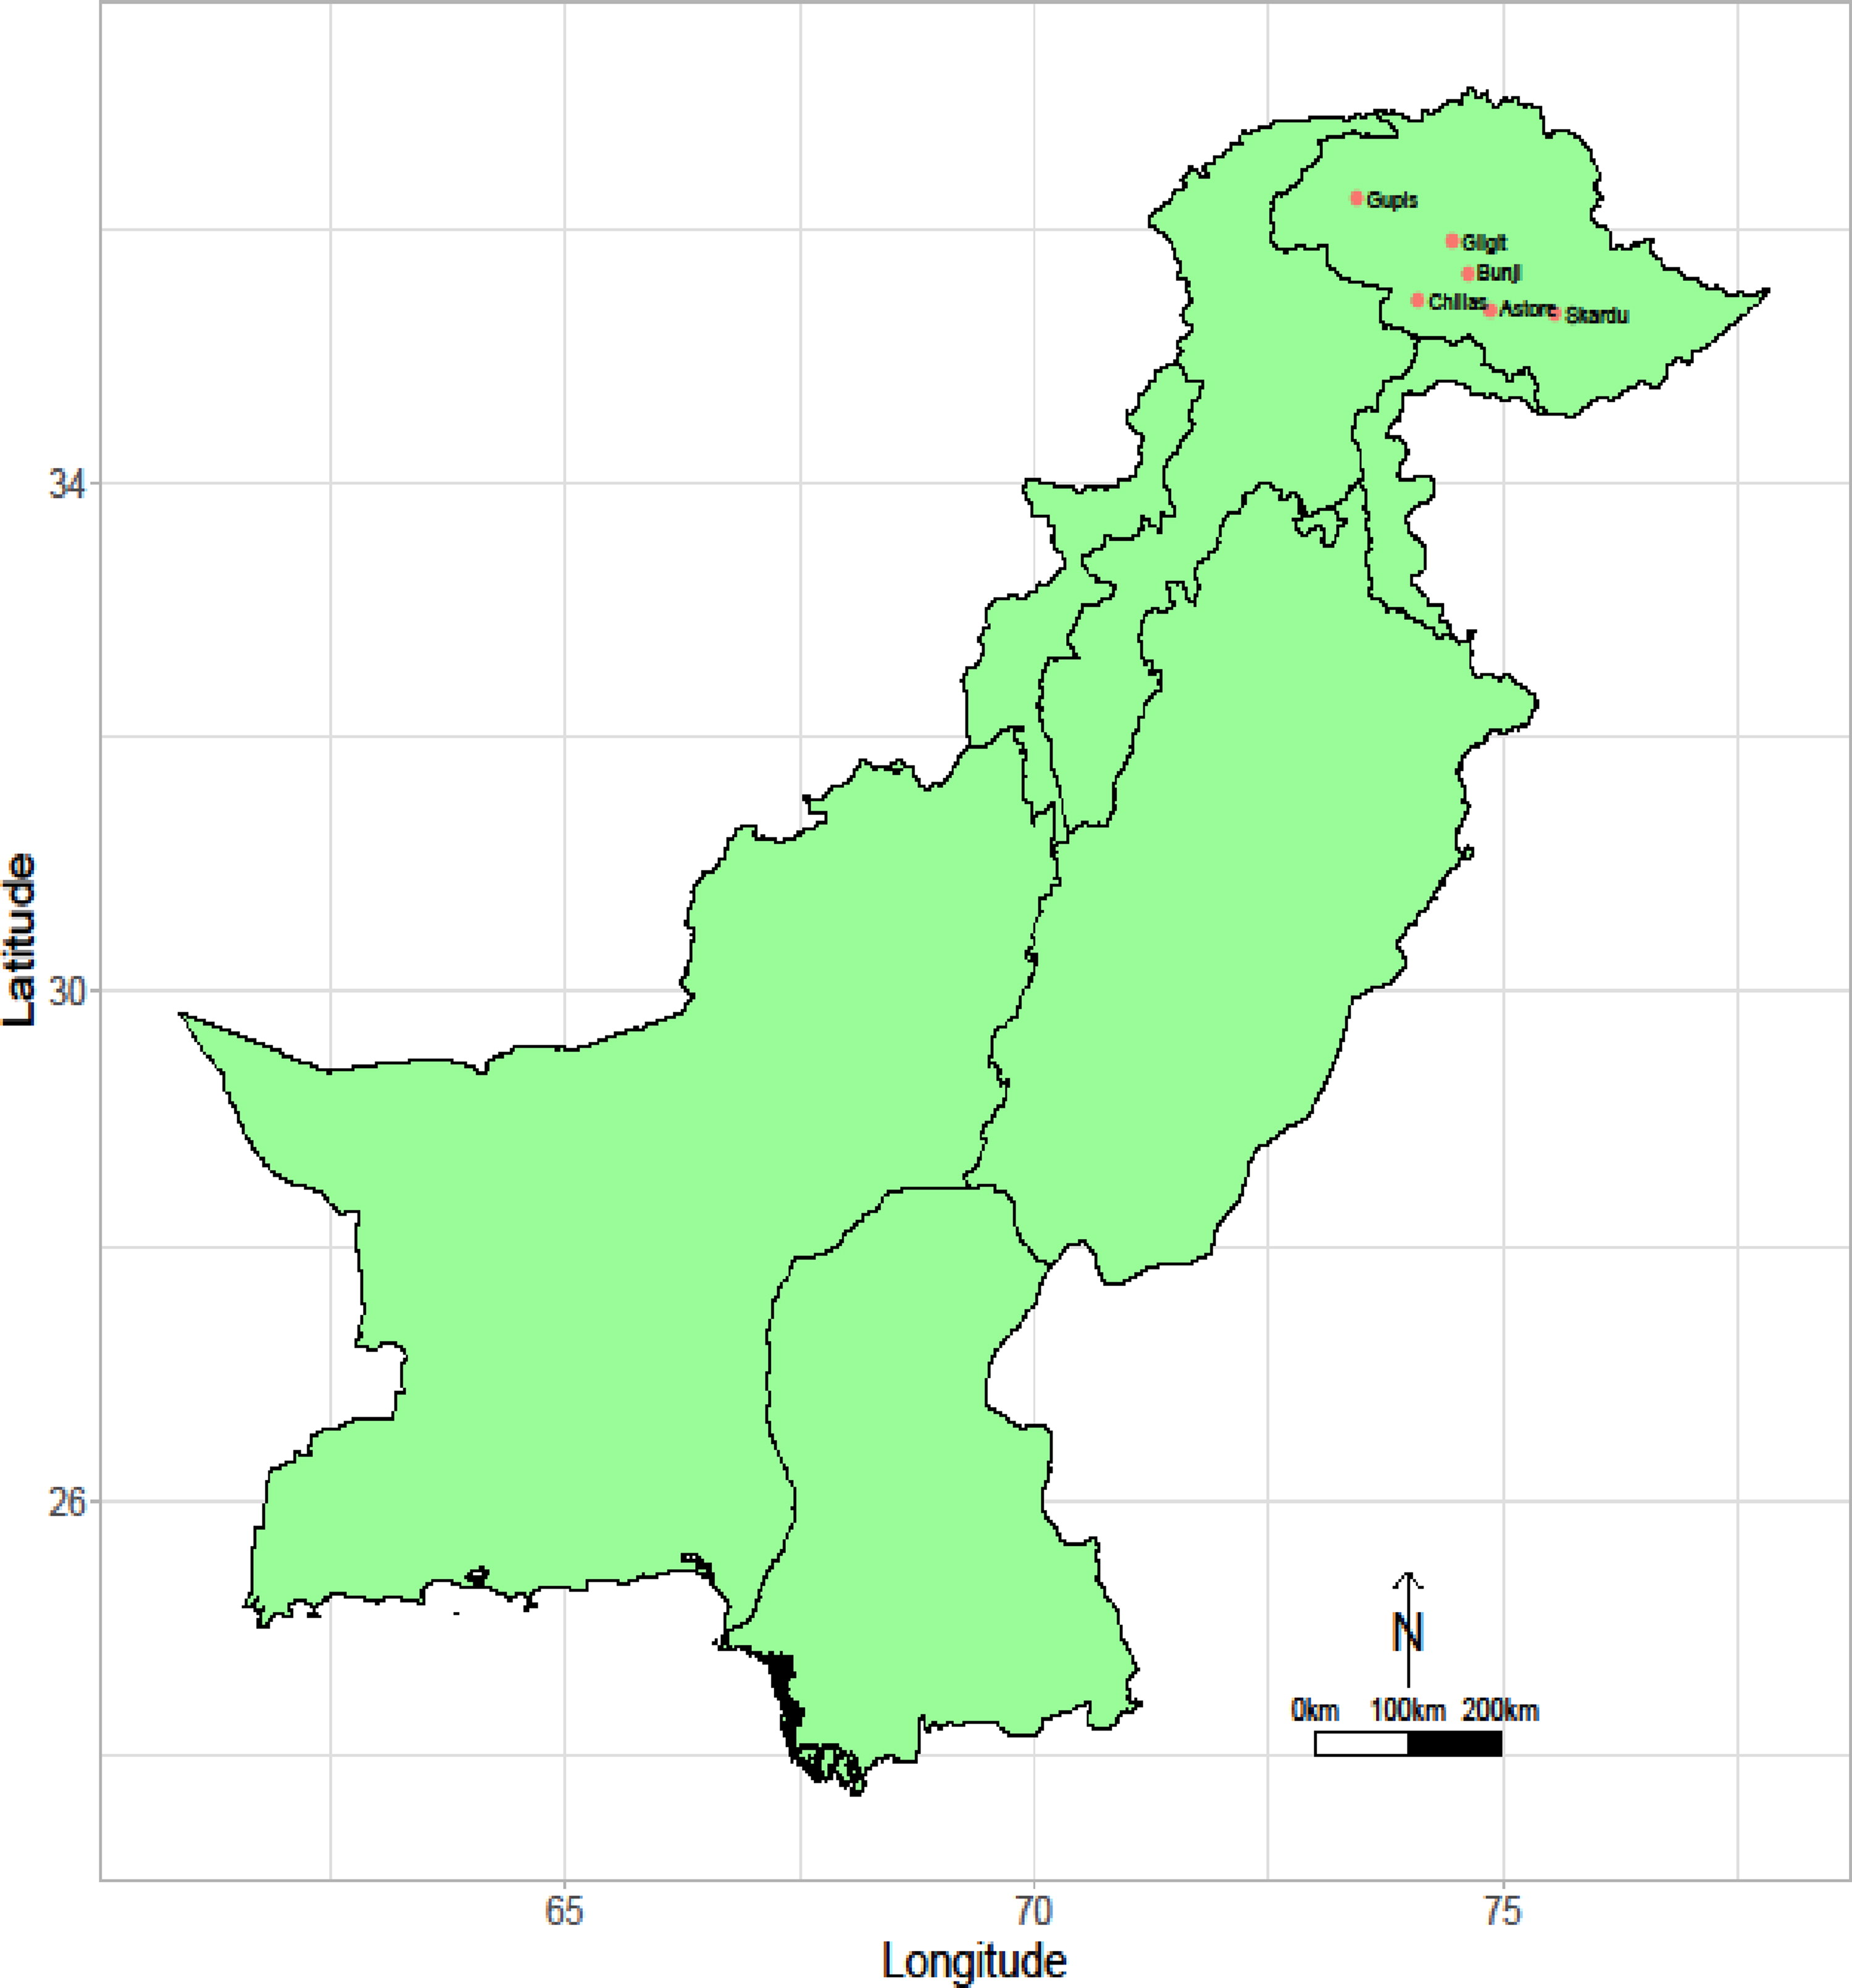
Fig. 2.
Geographical locations of the six selected stations of the Northern area of Pakistan.
Table 2.
An initial classification of drought categories based on the values of the SDI.
Table 4.
Steady-state probabilities for seven drought classes at scale-1 on varying indices (SPI, SPEI and SPTI) for selected stations.
Table 1.
The climatology characteristics during the period 1971–2017 of six selected stations.
Table 3.
BIC of selected probability distributions for SPI, SPEI and SPTI on six stations at scale-1.
Table 5.
Correlation coefficients among different stations at scale-1.

Fig. 3.
Theoretical vs. empirical histograms of selected distributions for six stations.
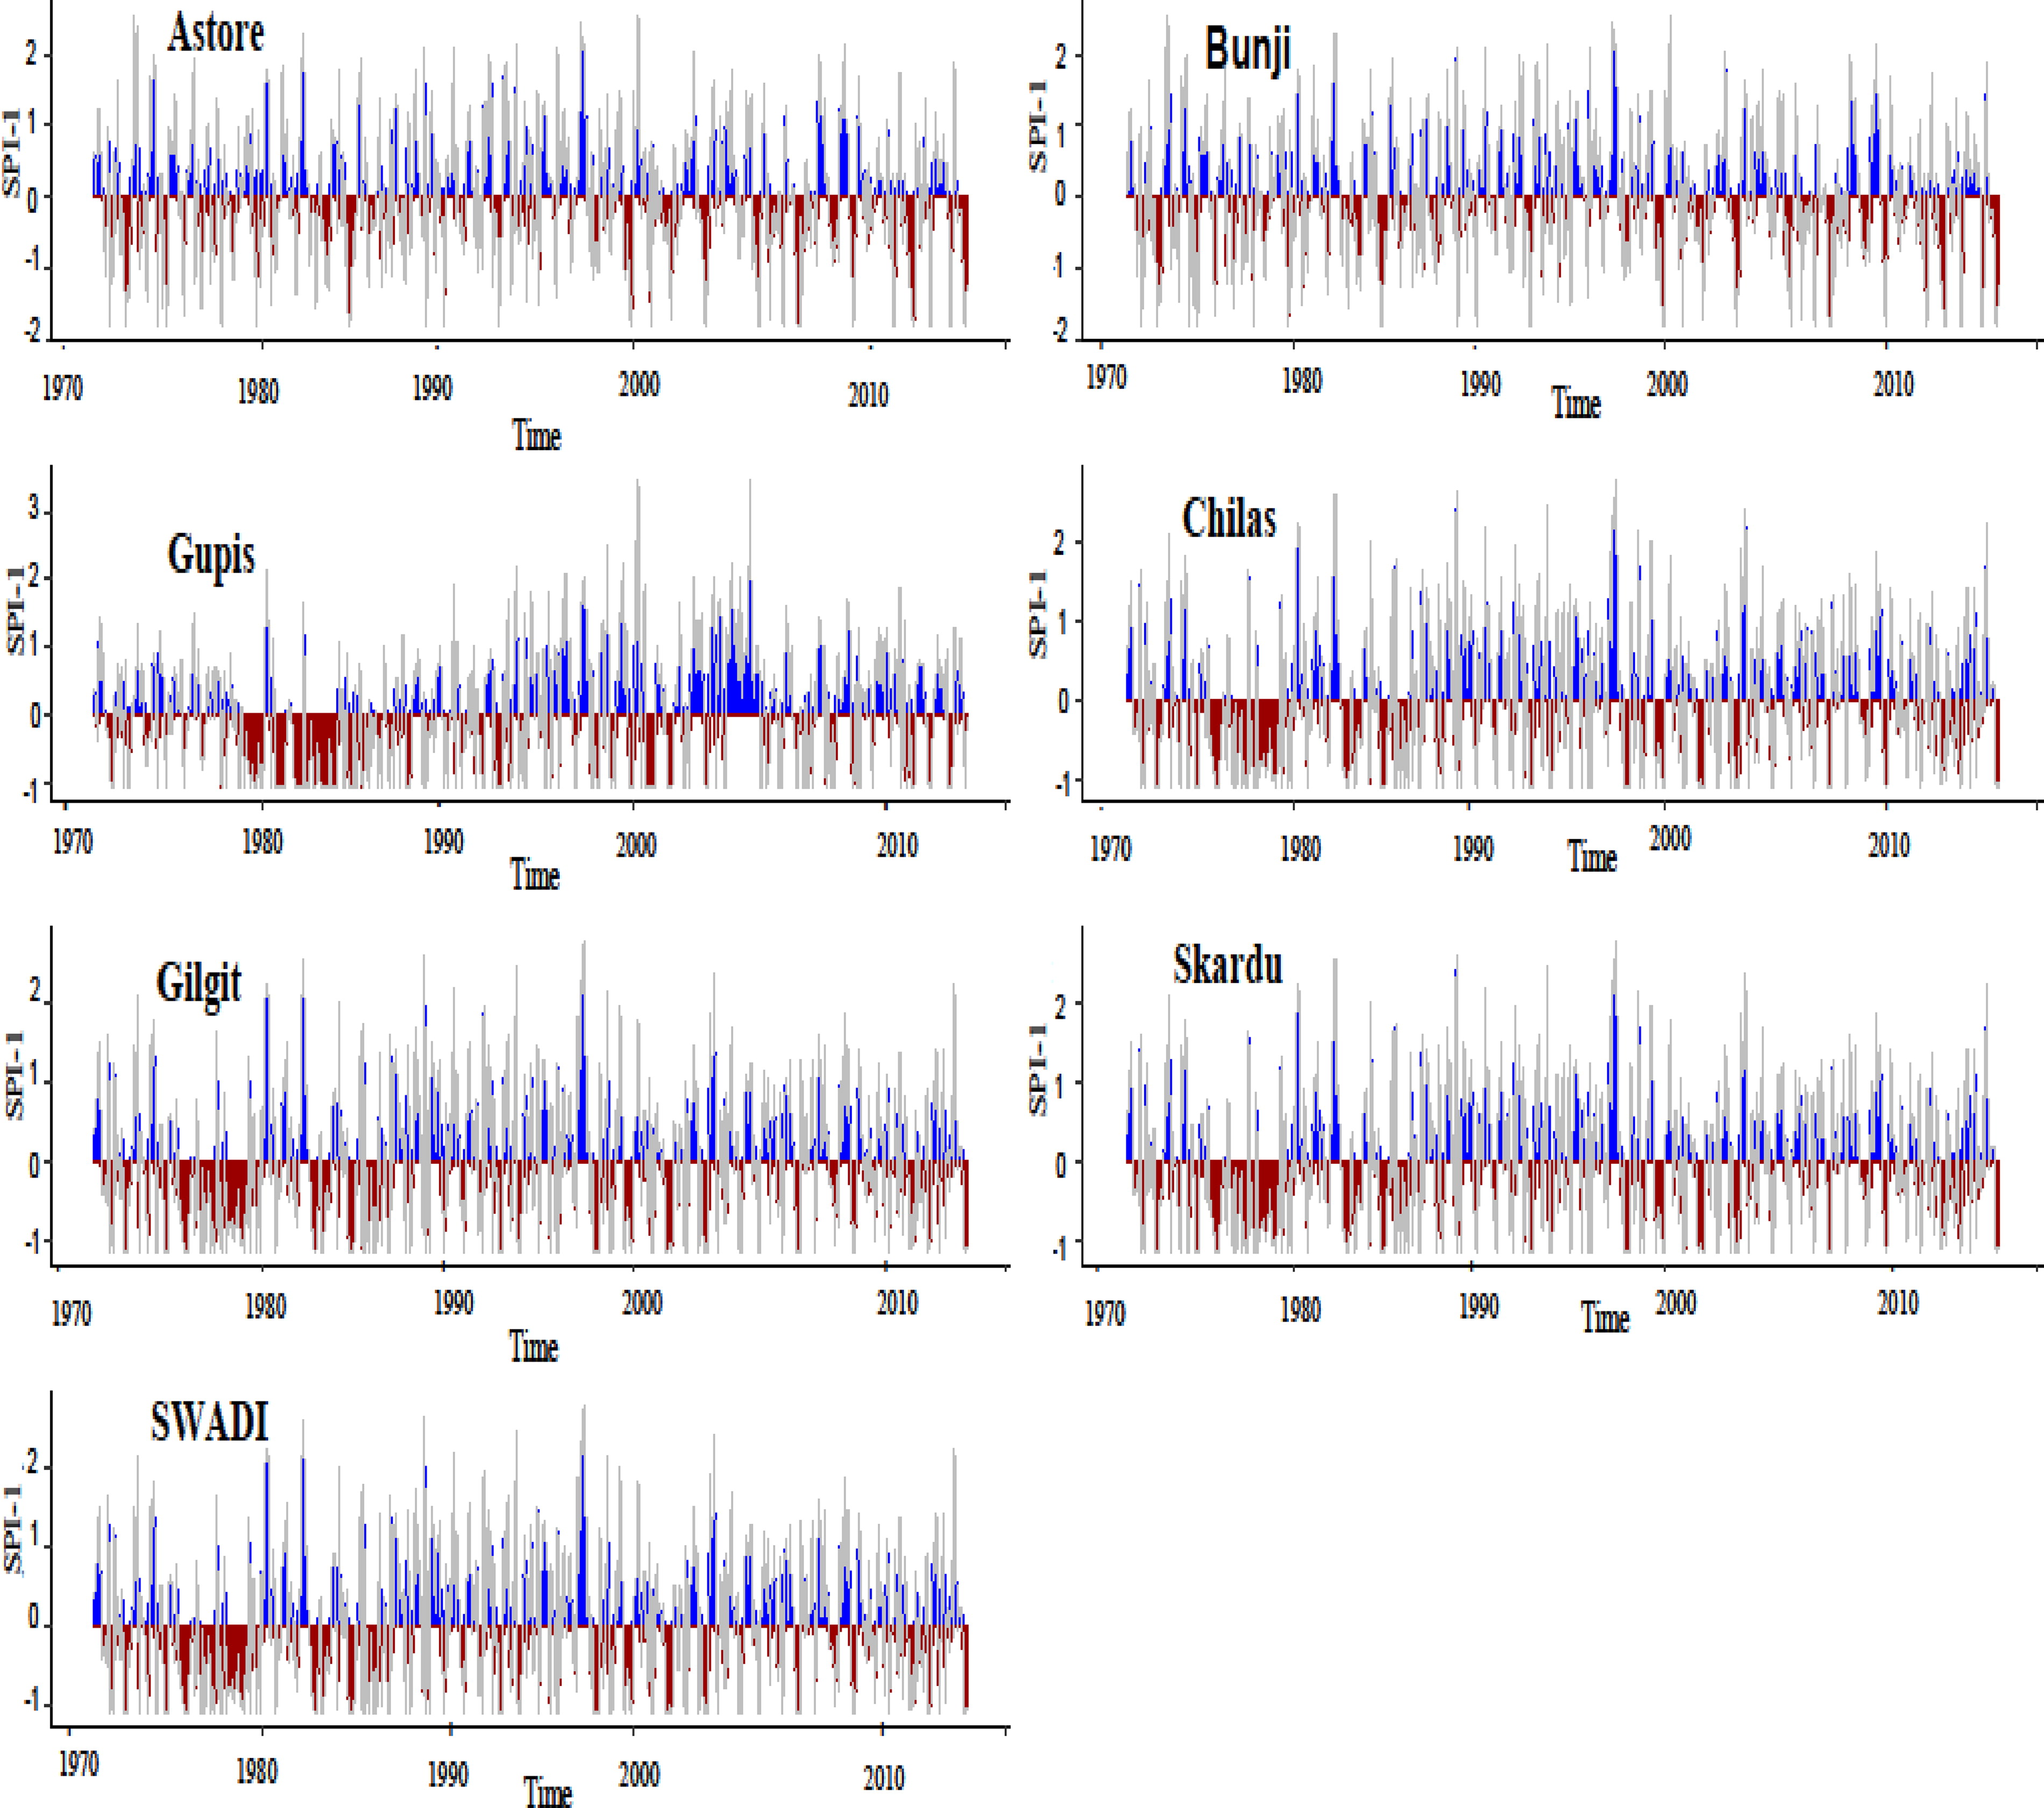
Fig. 4.
Temporal plots of SPI index for six stations and SWADI at scale-1.
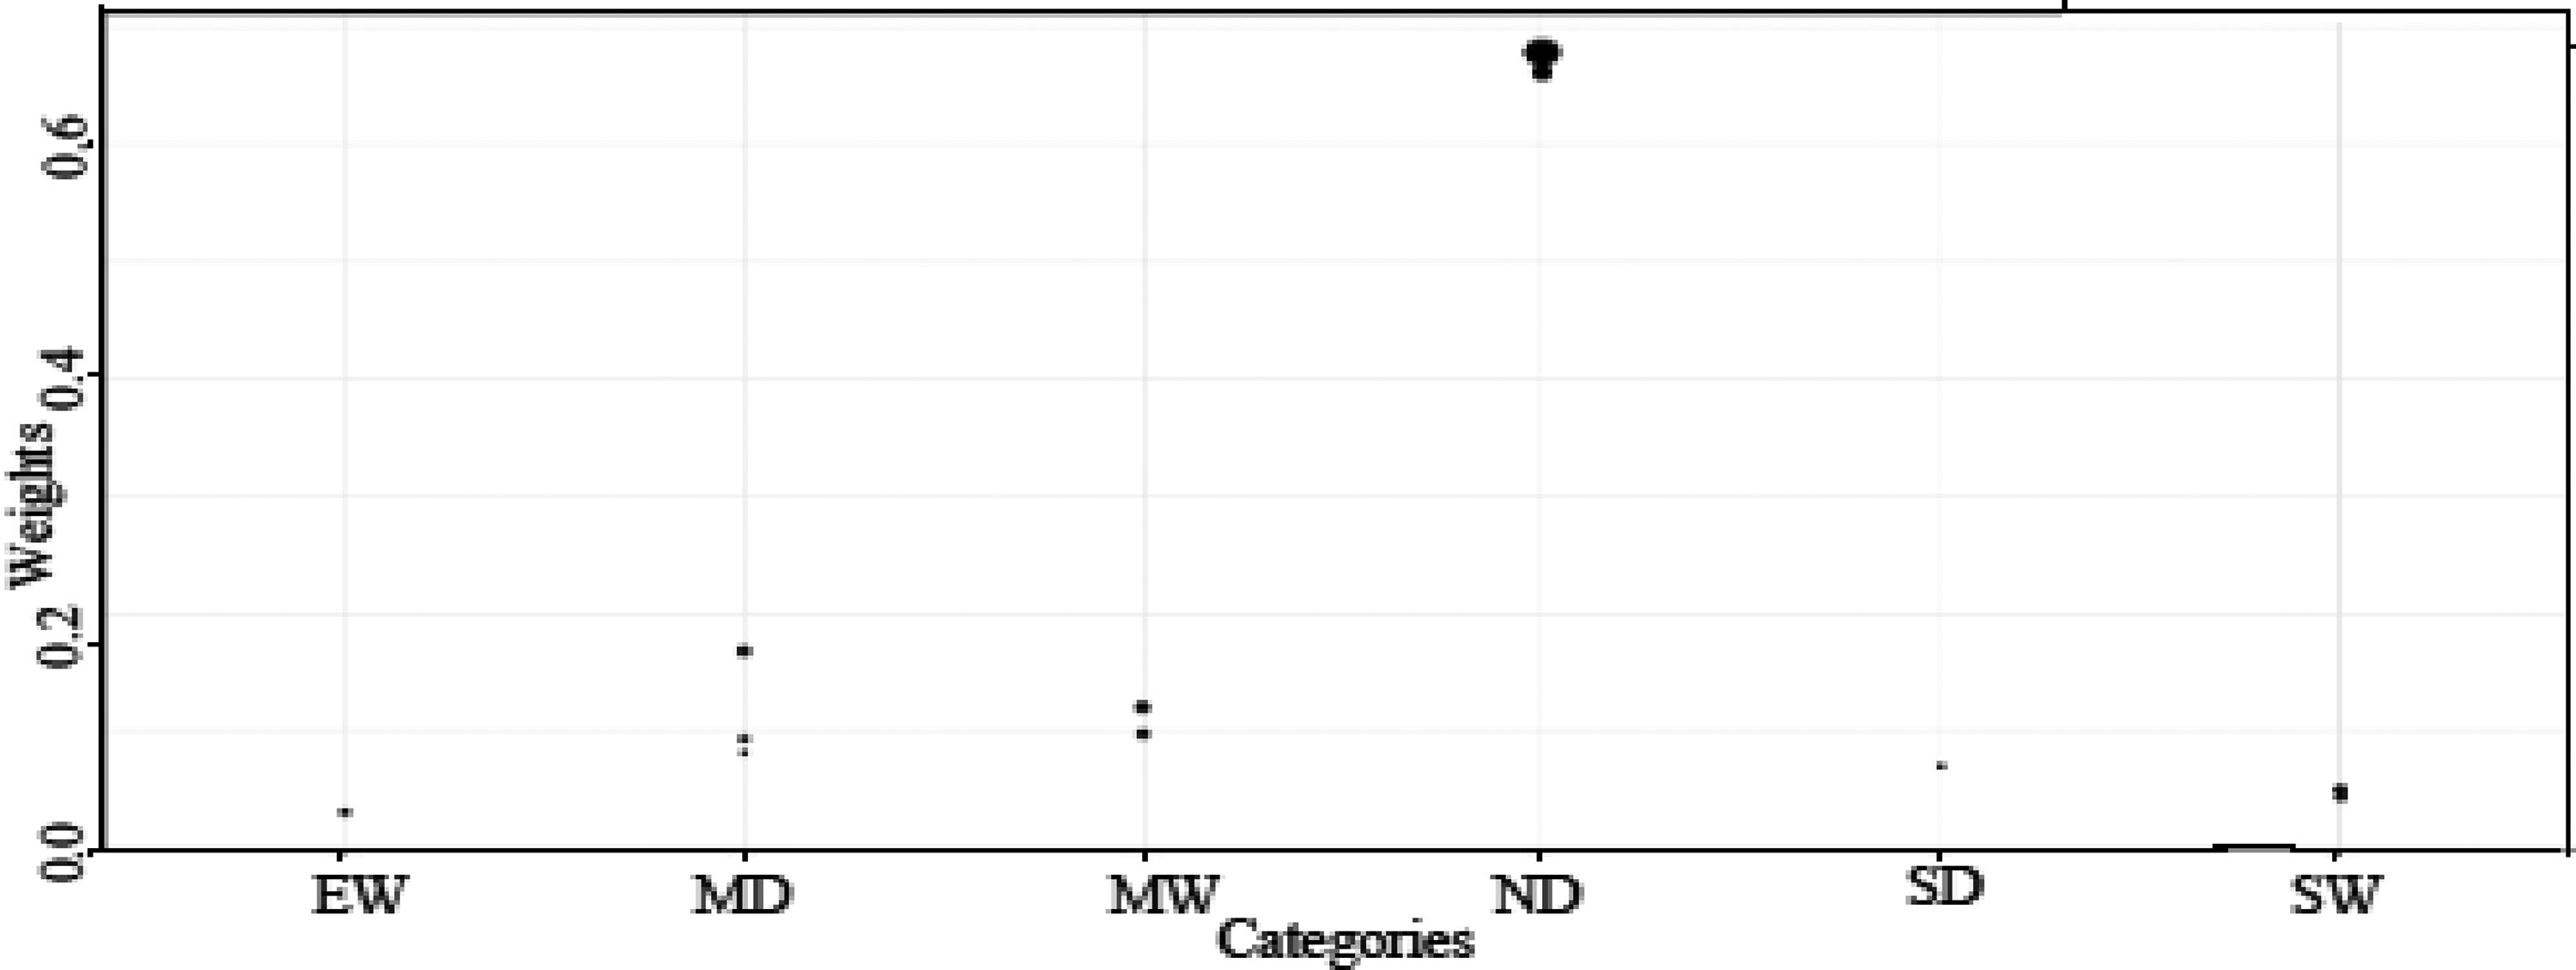
Fig. 5.
Count-plot for drought categories vs steady-state probabilities weights for Astore at scale-1.
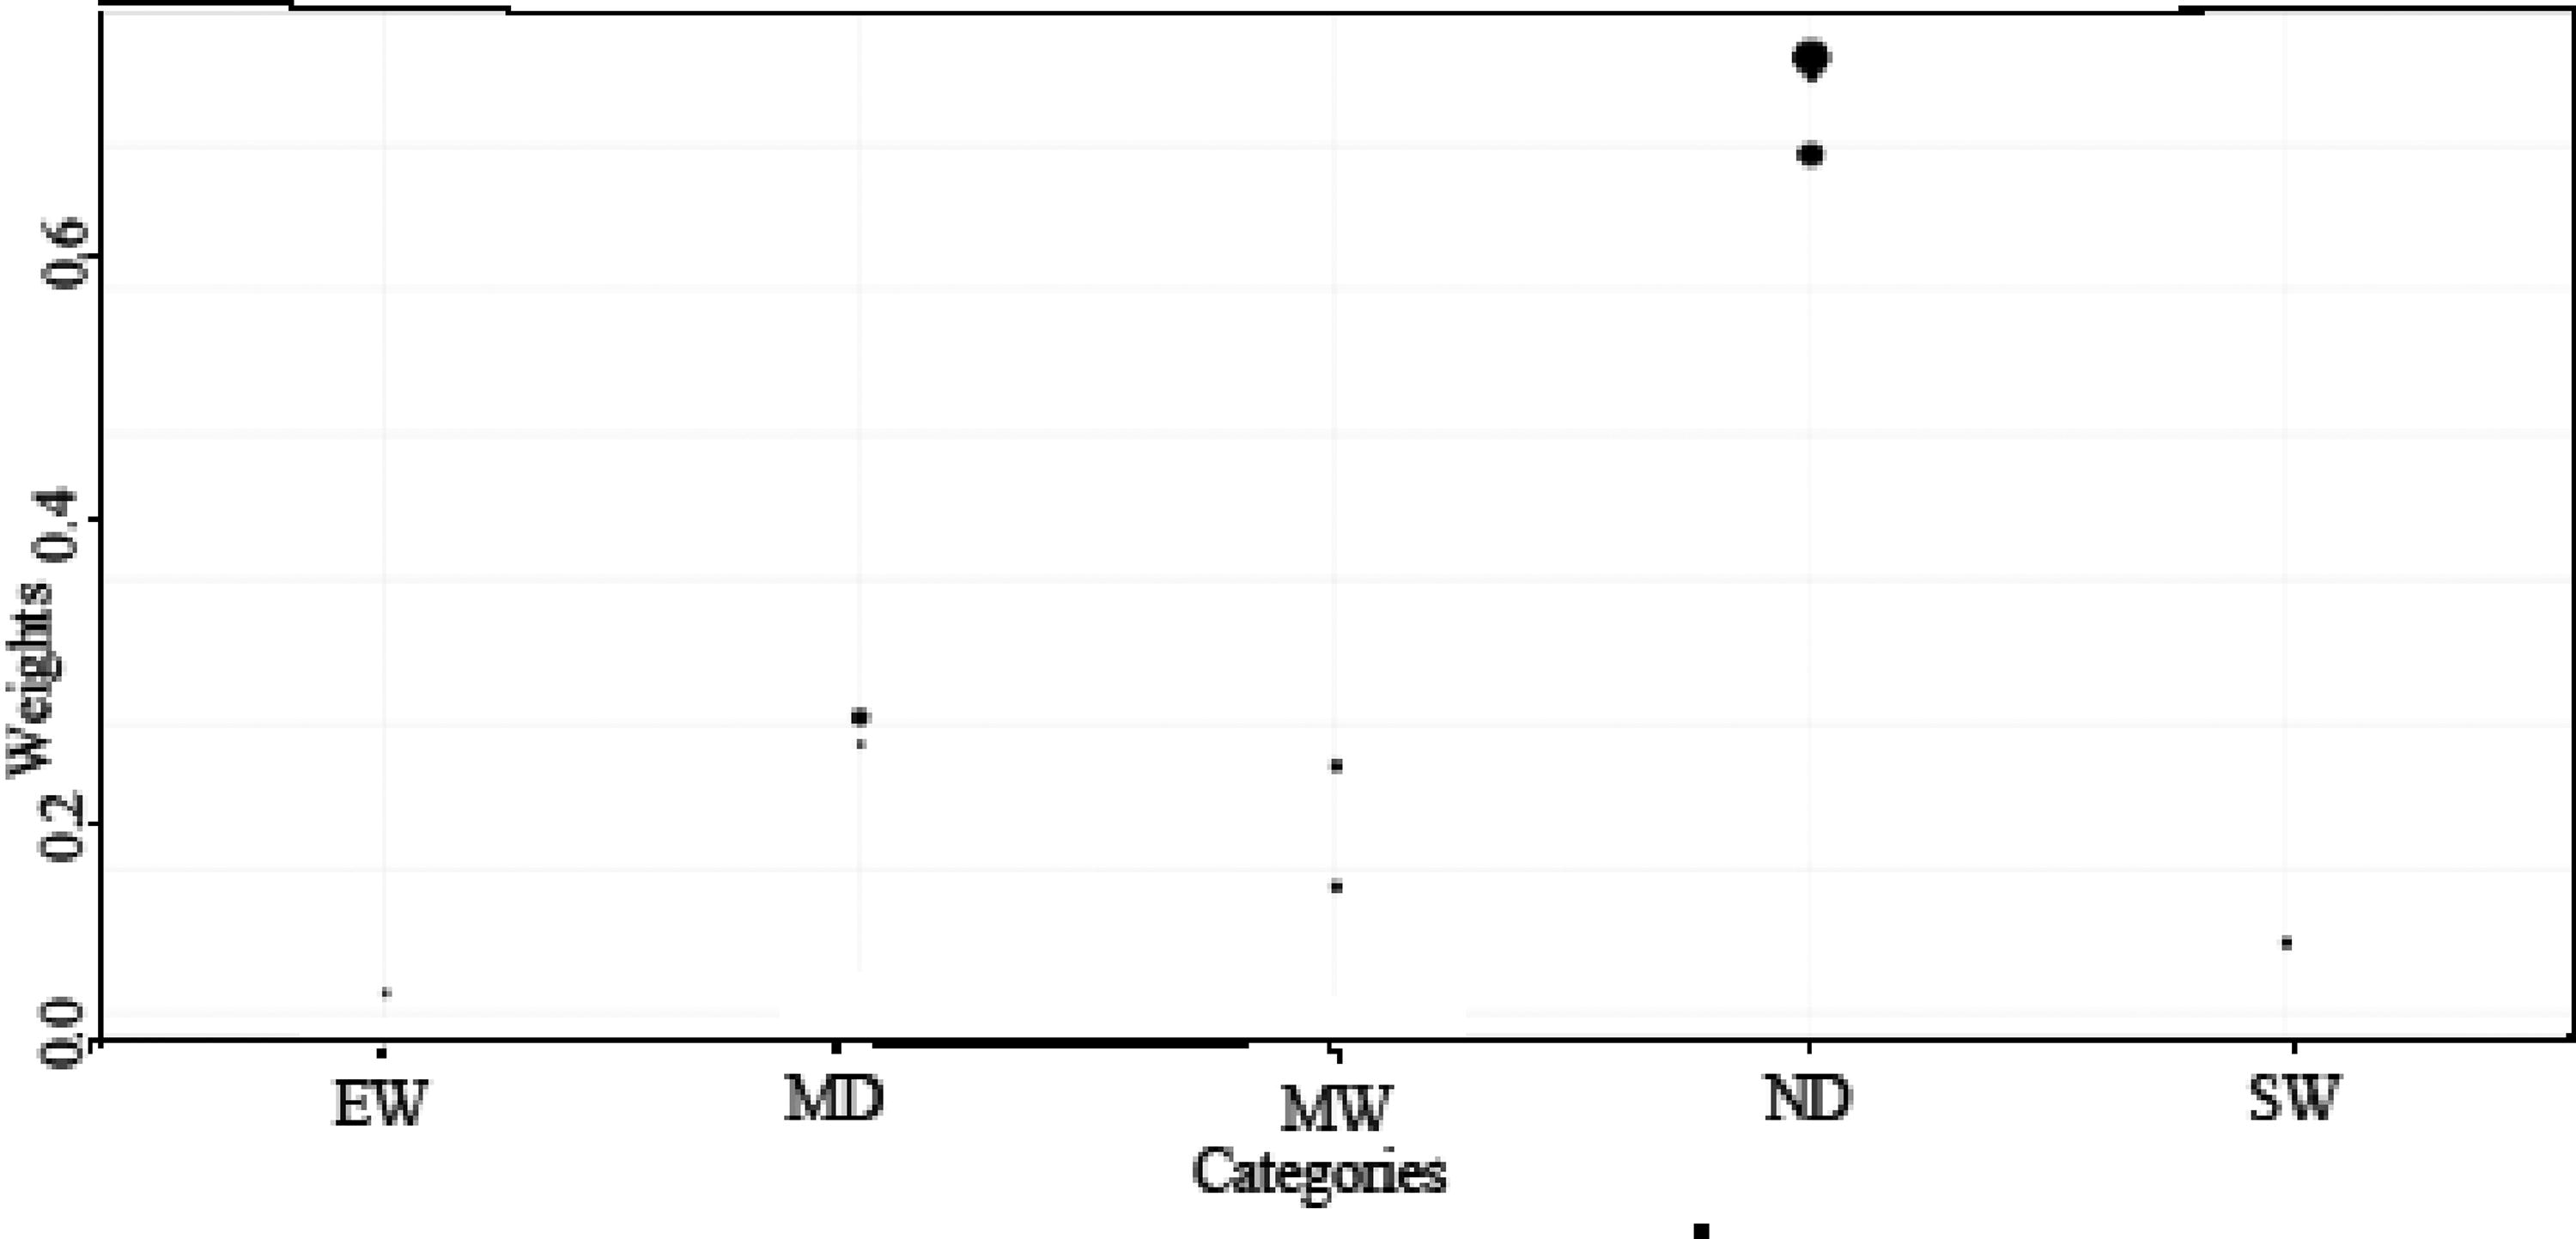
Fig. 6.
Count-plot for drought categories vs steady-state weights for Bunji at scale-1.