
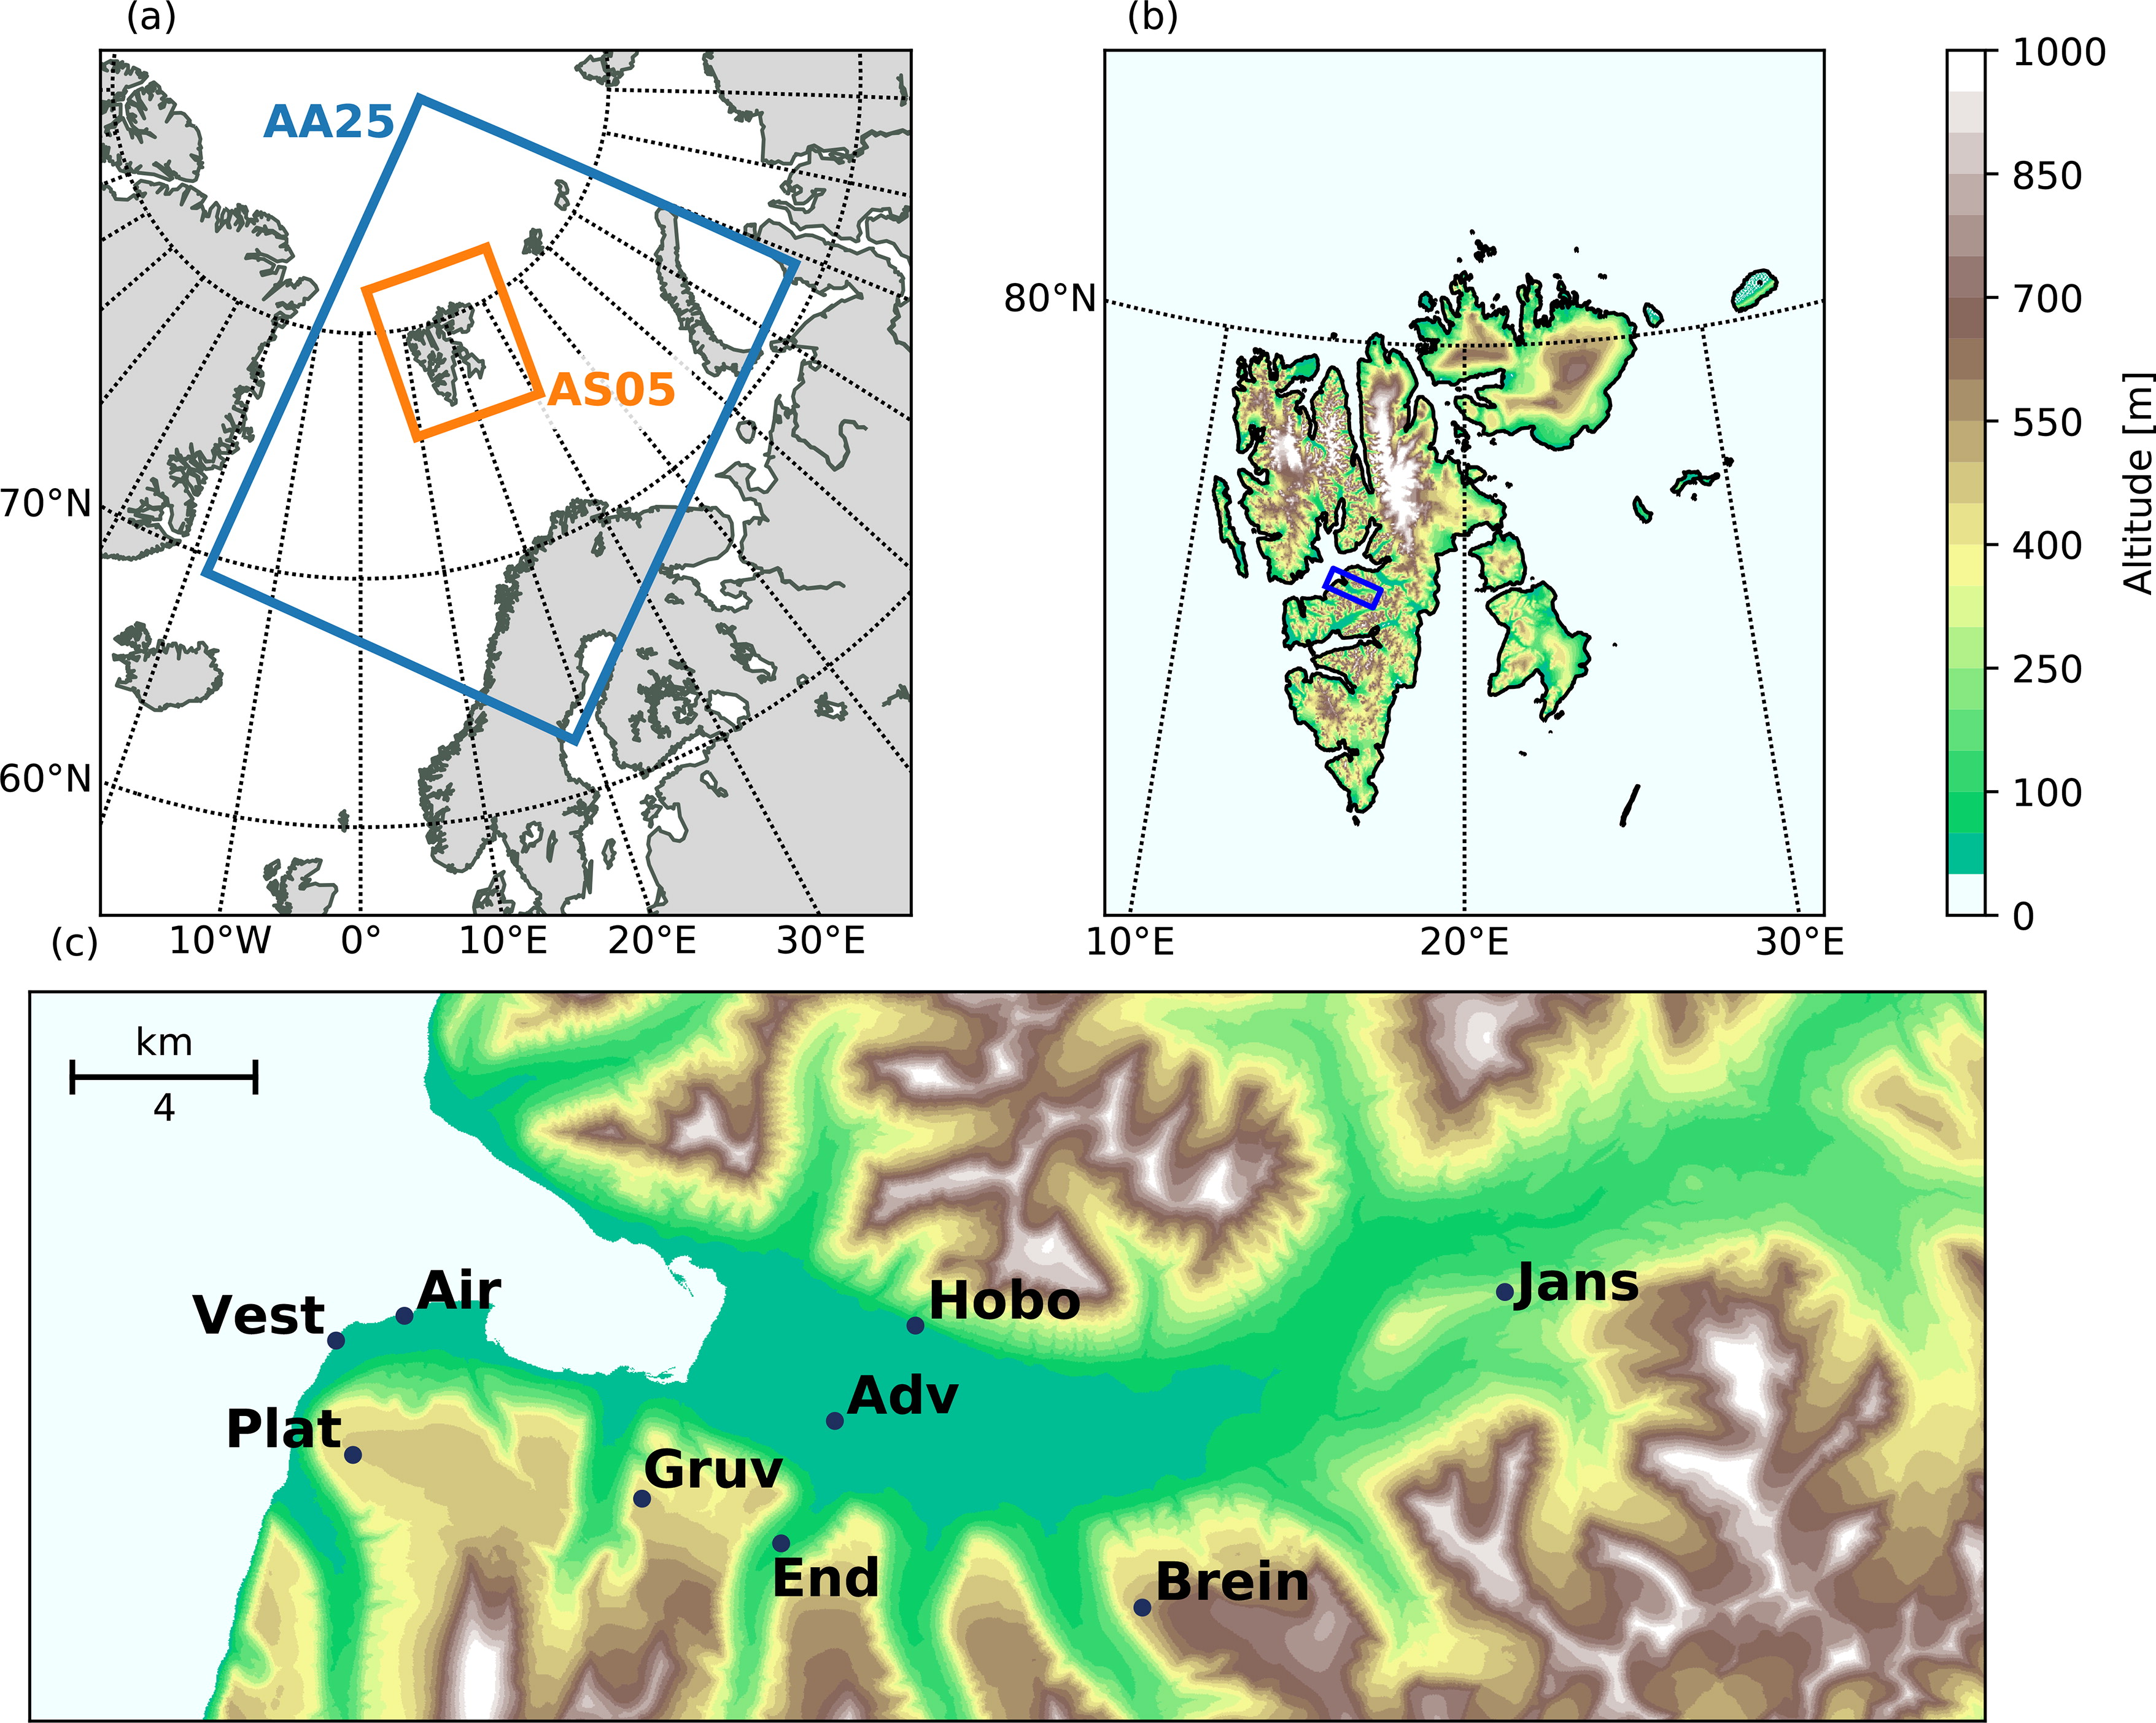
Fig. 1.
Location of the model domains and weather stations in the Adventdalen valley. (a) The model domains of AA25 at 2.5 km and AS05 at 0.5 km horizontal grid spacing. (b) AS05 model domain with the representation of the model topography. The blue box shows the location of the Adventdalen valley. (c) Close-up view of the Adventdalen valley showing the local topography according to the Norwegian Polar Institute (2014) and the locations of the weather stations: Vestpynten (Vest), Svalbard Airport (Air), Platåberget (Plat), Gruvefjellet (Gruv), Adventdalen (Adv), Hobo, Endalen (End), Breinosa (Brein) and Janssonhaugen (Jans).
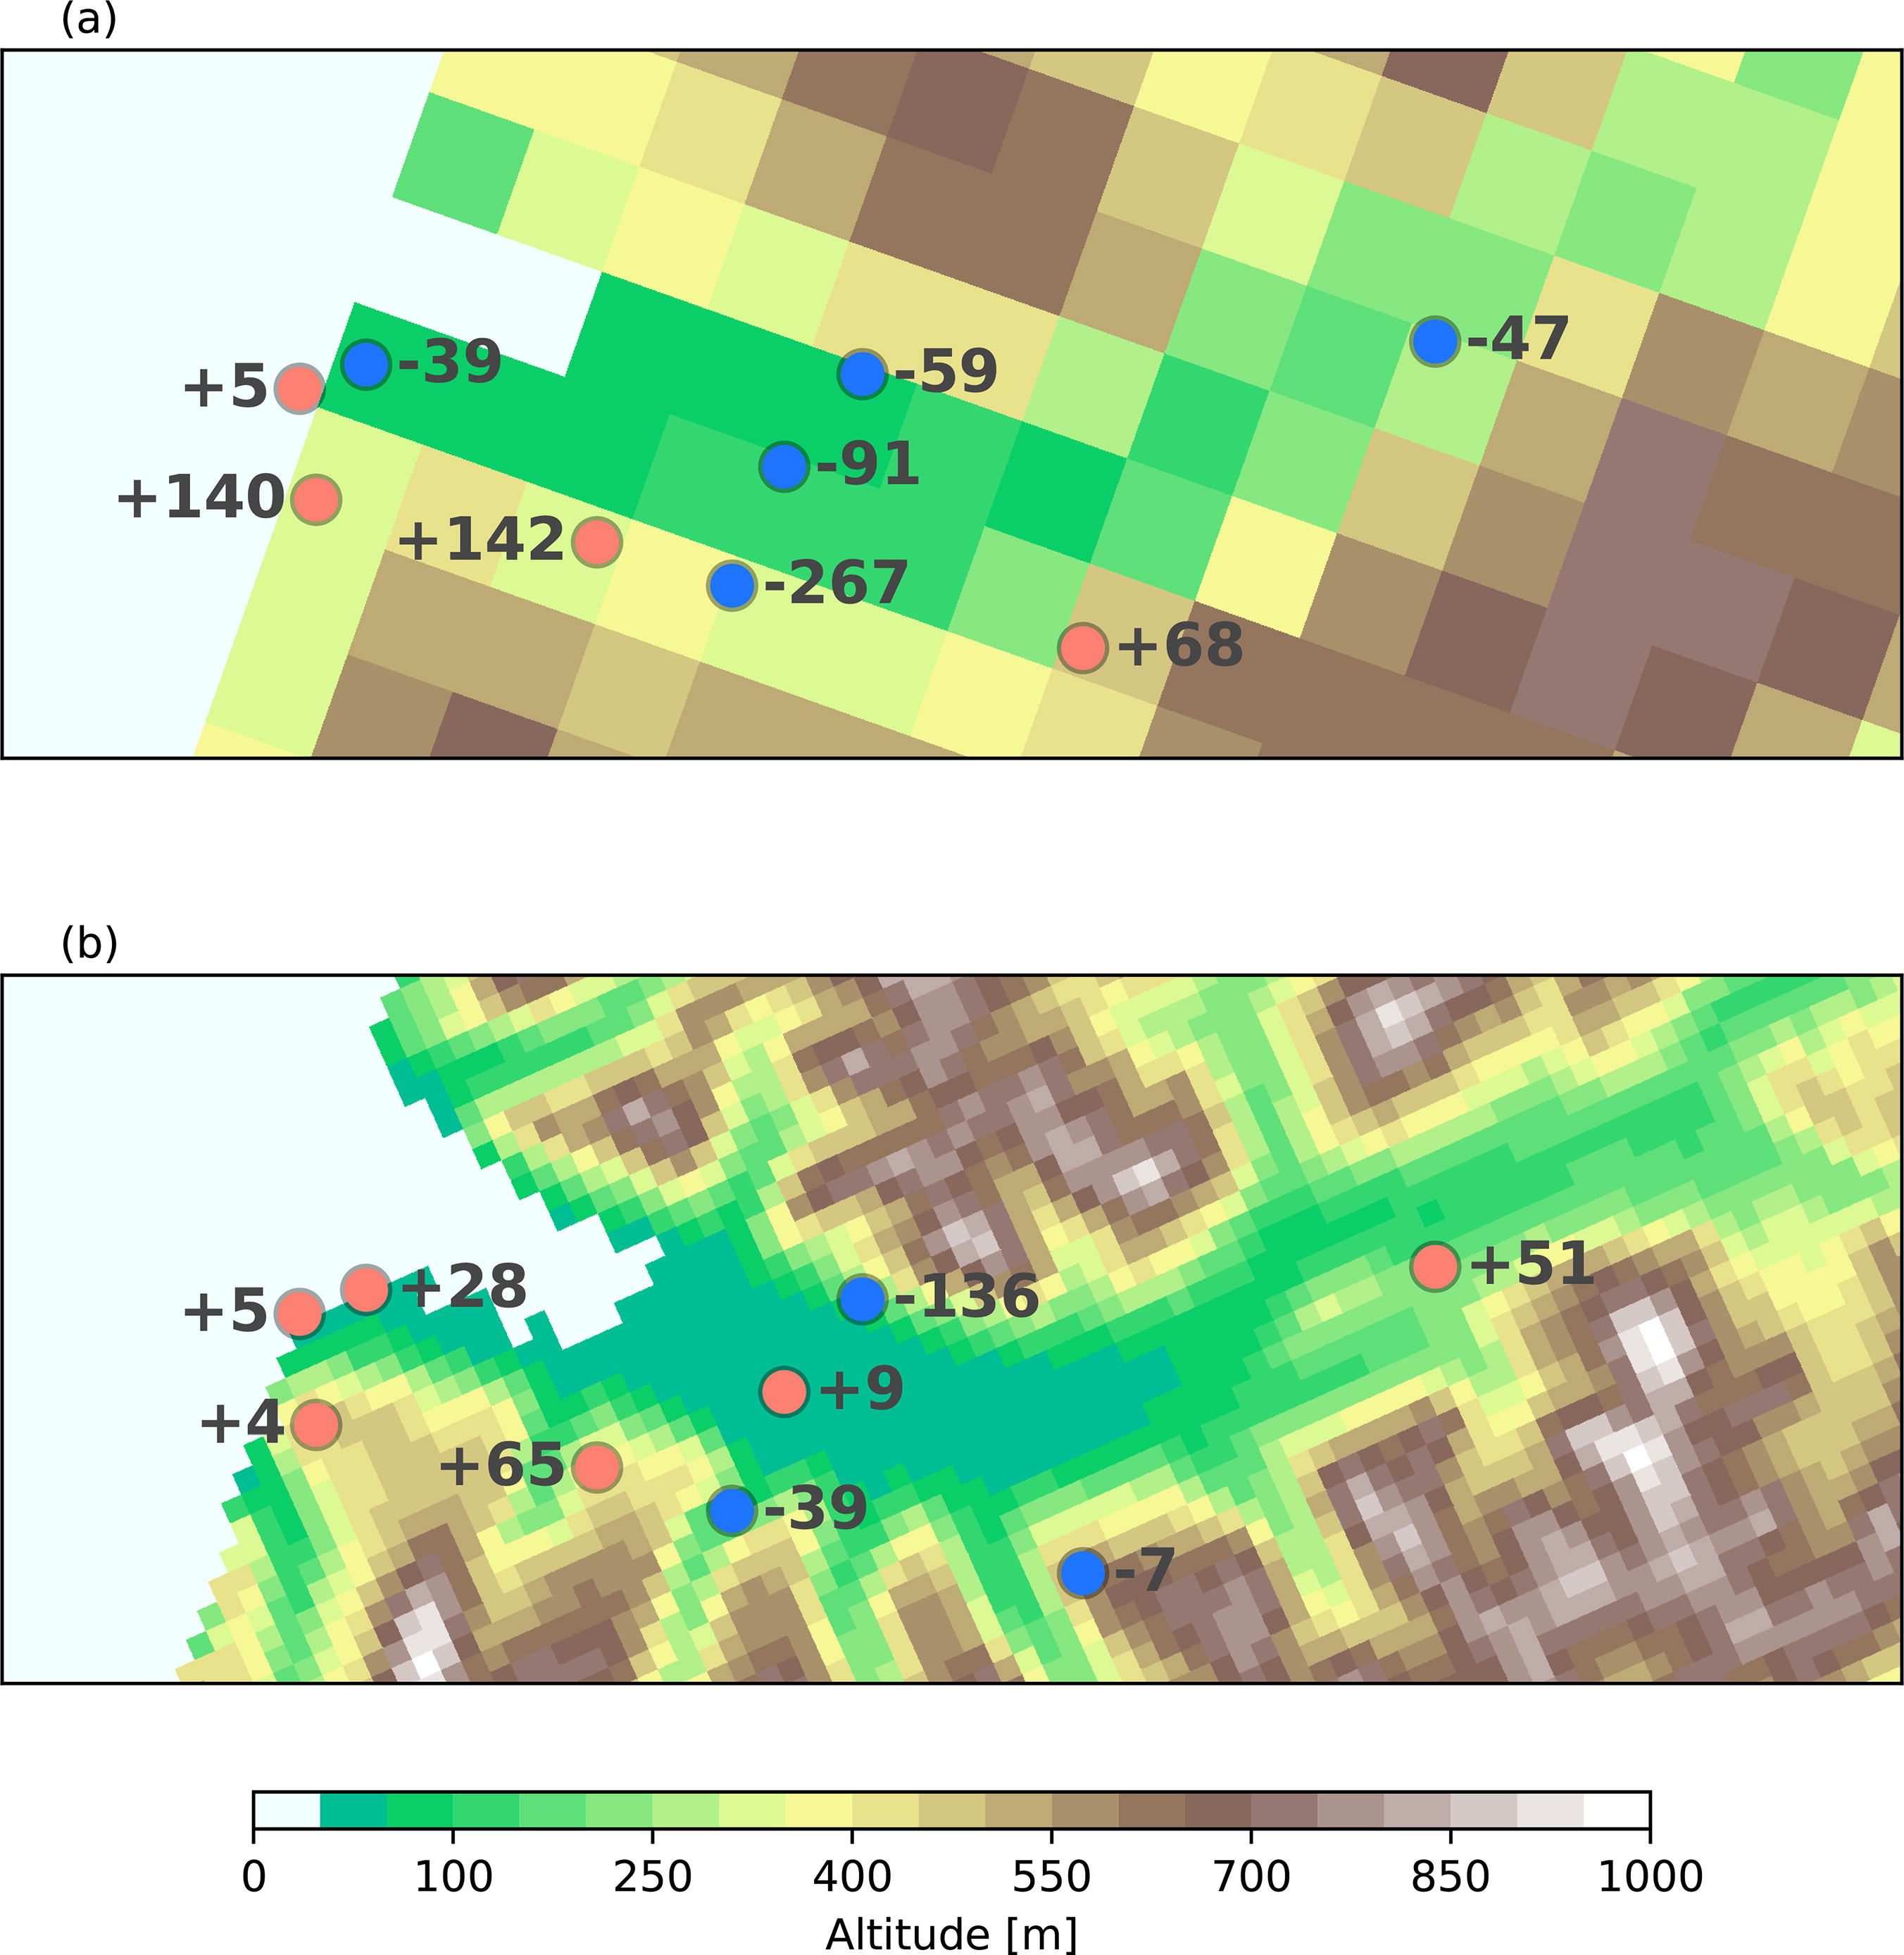
Fig. 2.
The topography of the Adventdalen area and difference between the altitude of the weather stations and model topography: (a) AA25, (b) AS05. Positive altitude difference means that the altitude of the weather station is above the model terrain elevation of the nearest grid cell.
Table 1.
Model experiments and their configurations.
Table 2.
List of weather stations in the Adventdalen area and observations used in this study.
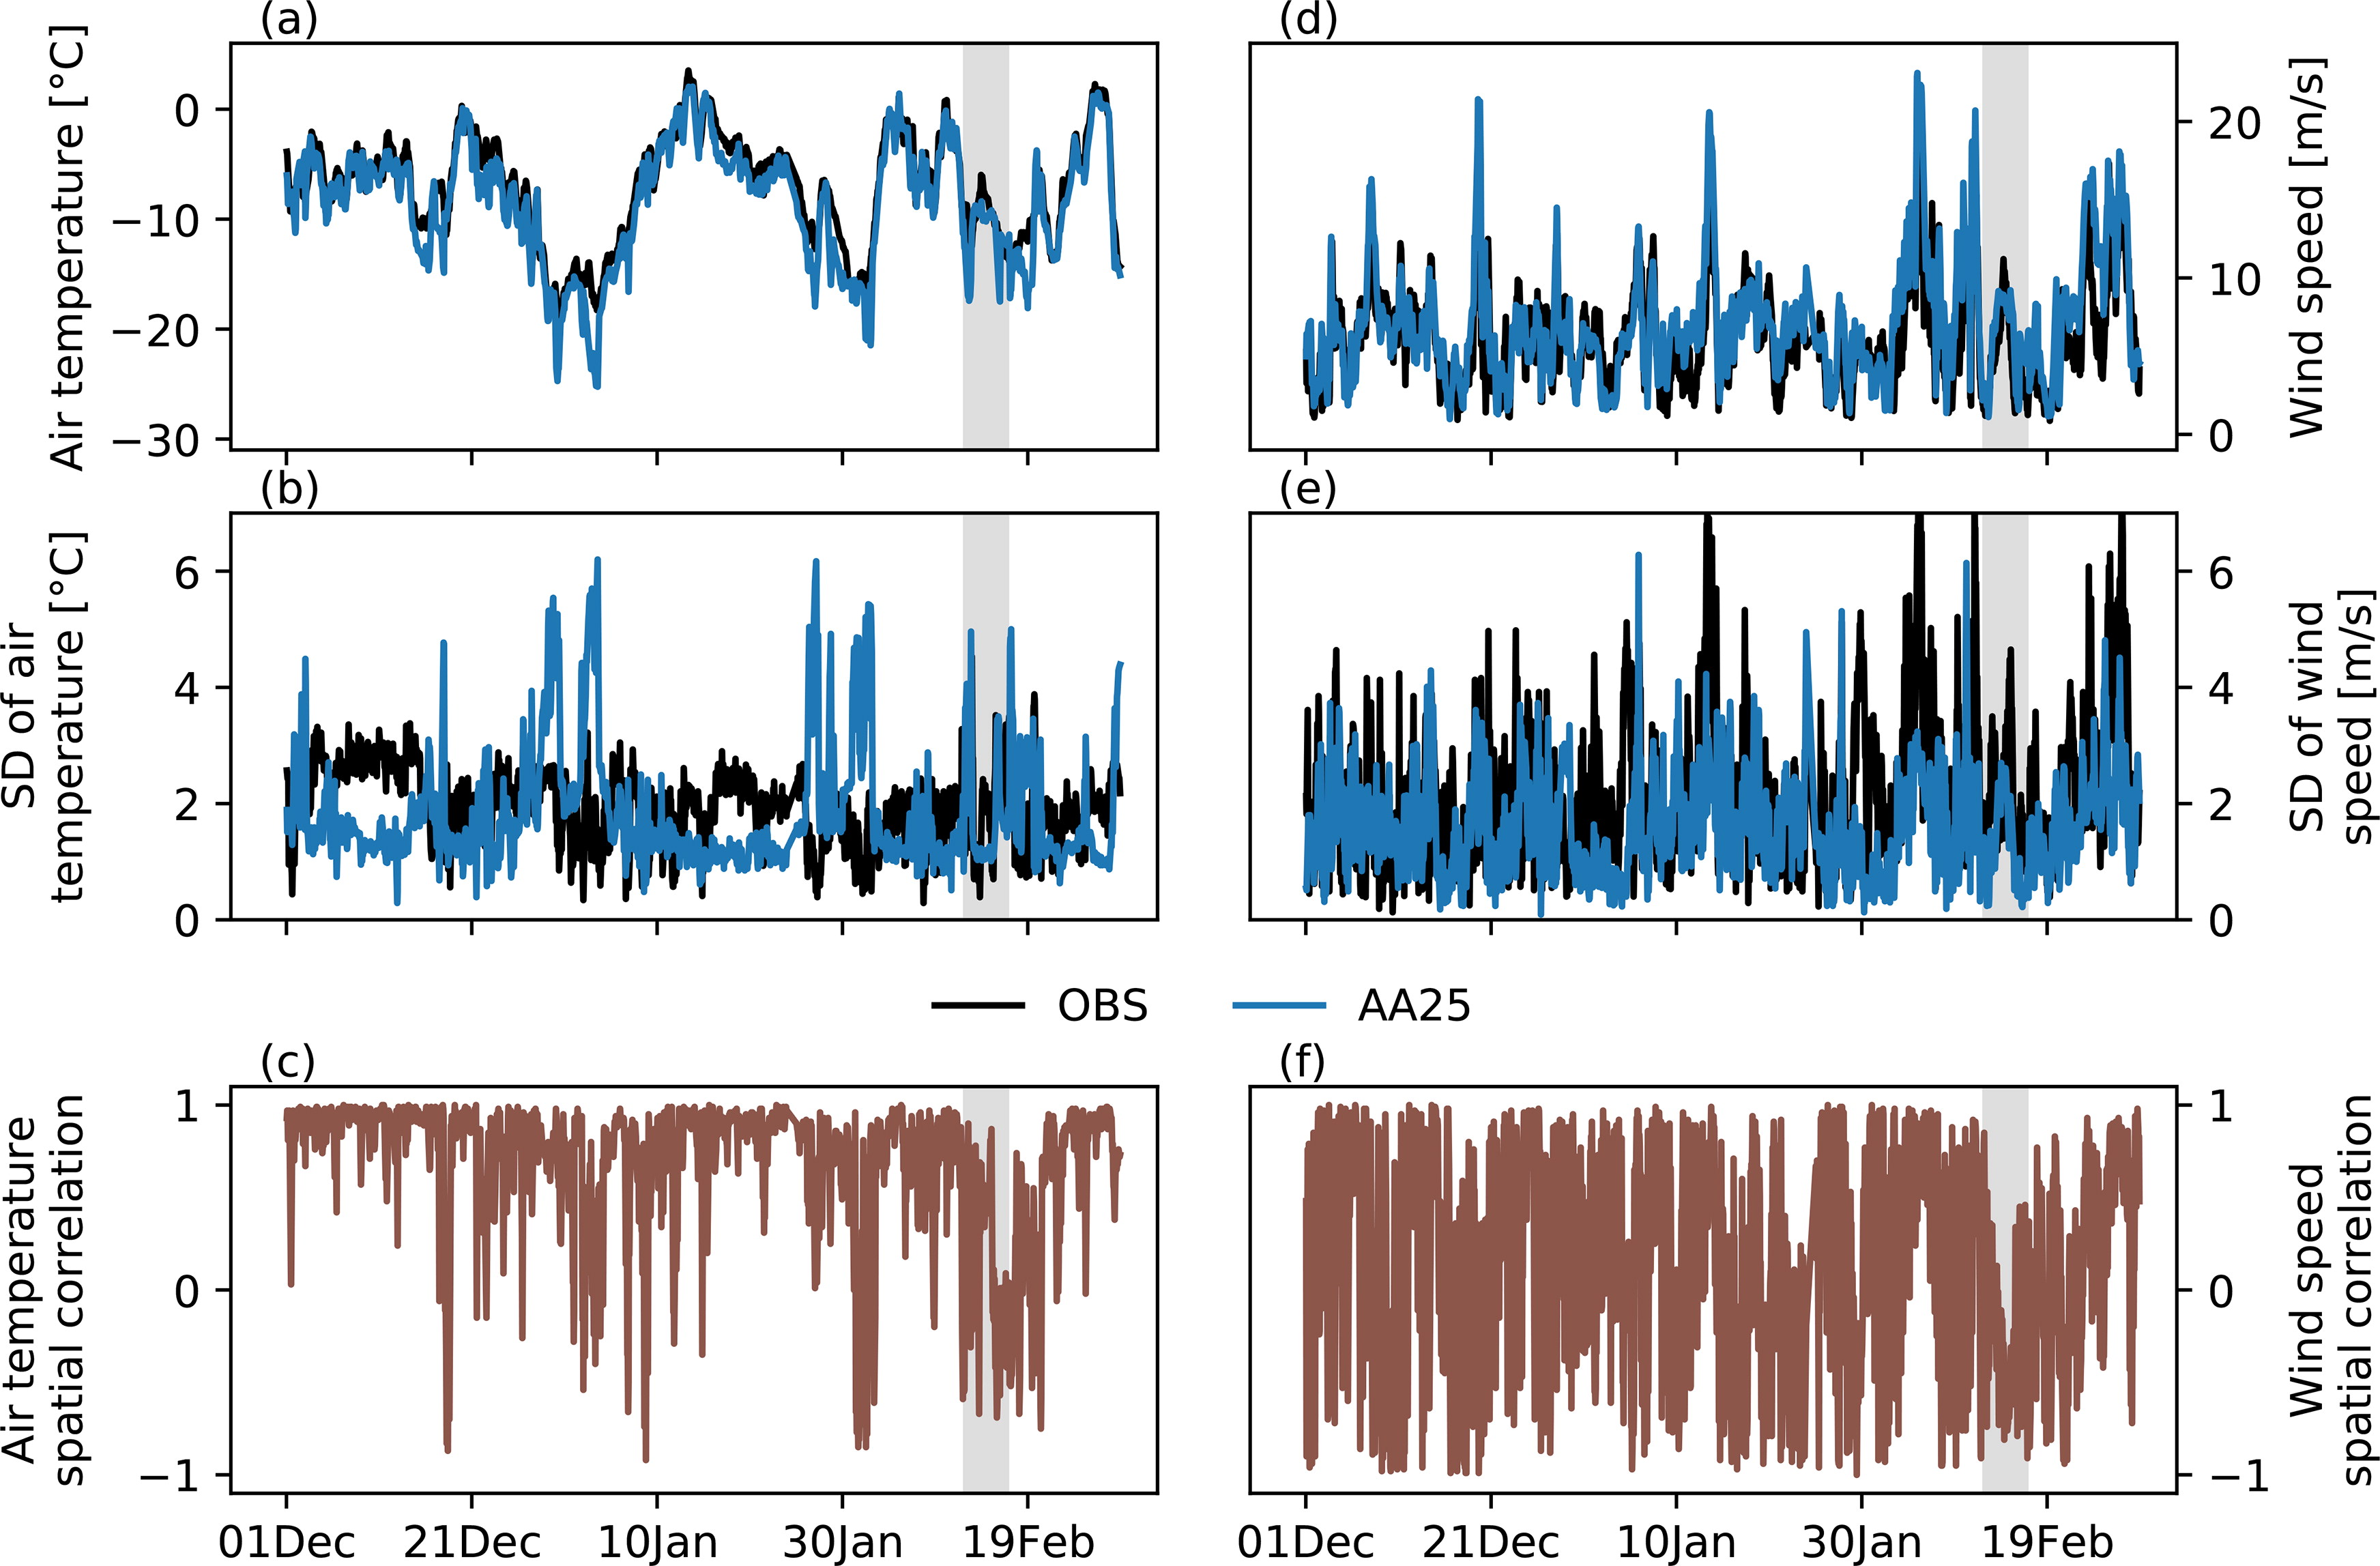
Fig. 3.
Time series for DJF 2017/18 for temperature (left panels) and wind speed (right panels) for the 6 permanent stations. (a) Mean observed (black) and forecasted (blue) values of the two metre air temperature; (b) standard deviation of two metre temperature representing the spatial variability; (c) correlation between forecasts and observations; (d–f) same as (a–c), but for 10-m wind speed. The period for the detailed investigation in this study is highlighted (grey shading).
Table 3.
Mean error (ME) and standard deviation of error (SDE) between the observations and the modelled values averaged at weather stations for the forecast lead times from 1 to 24 hours.
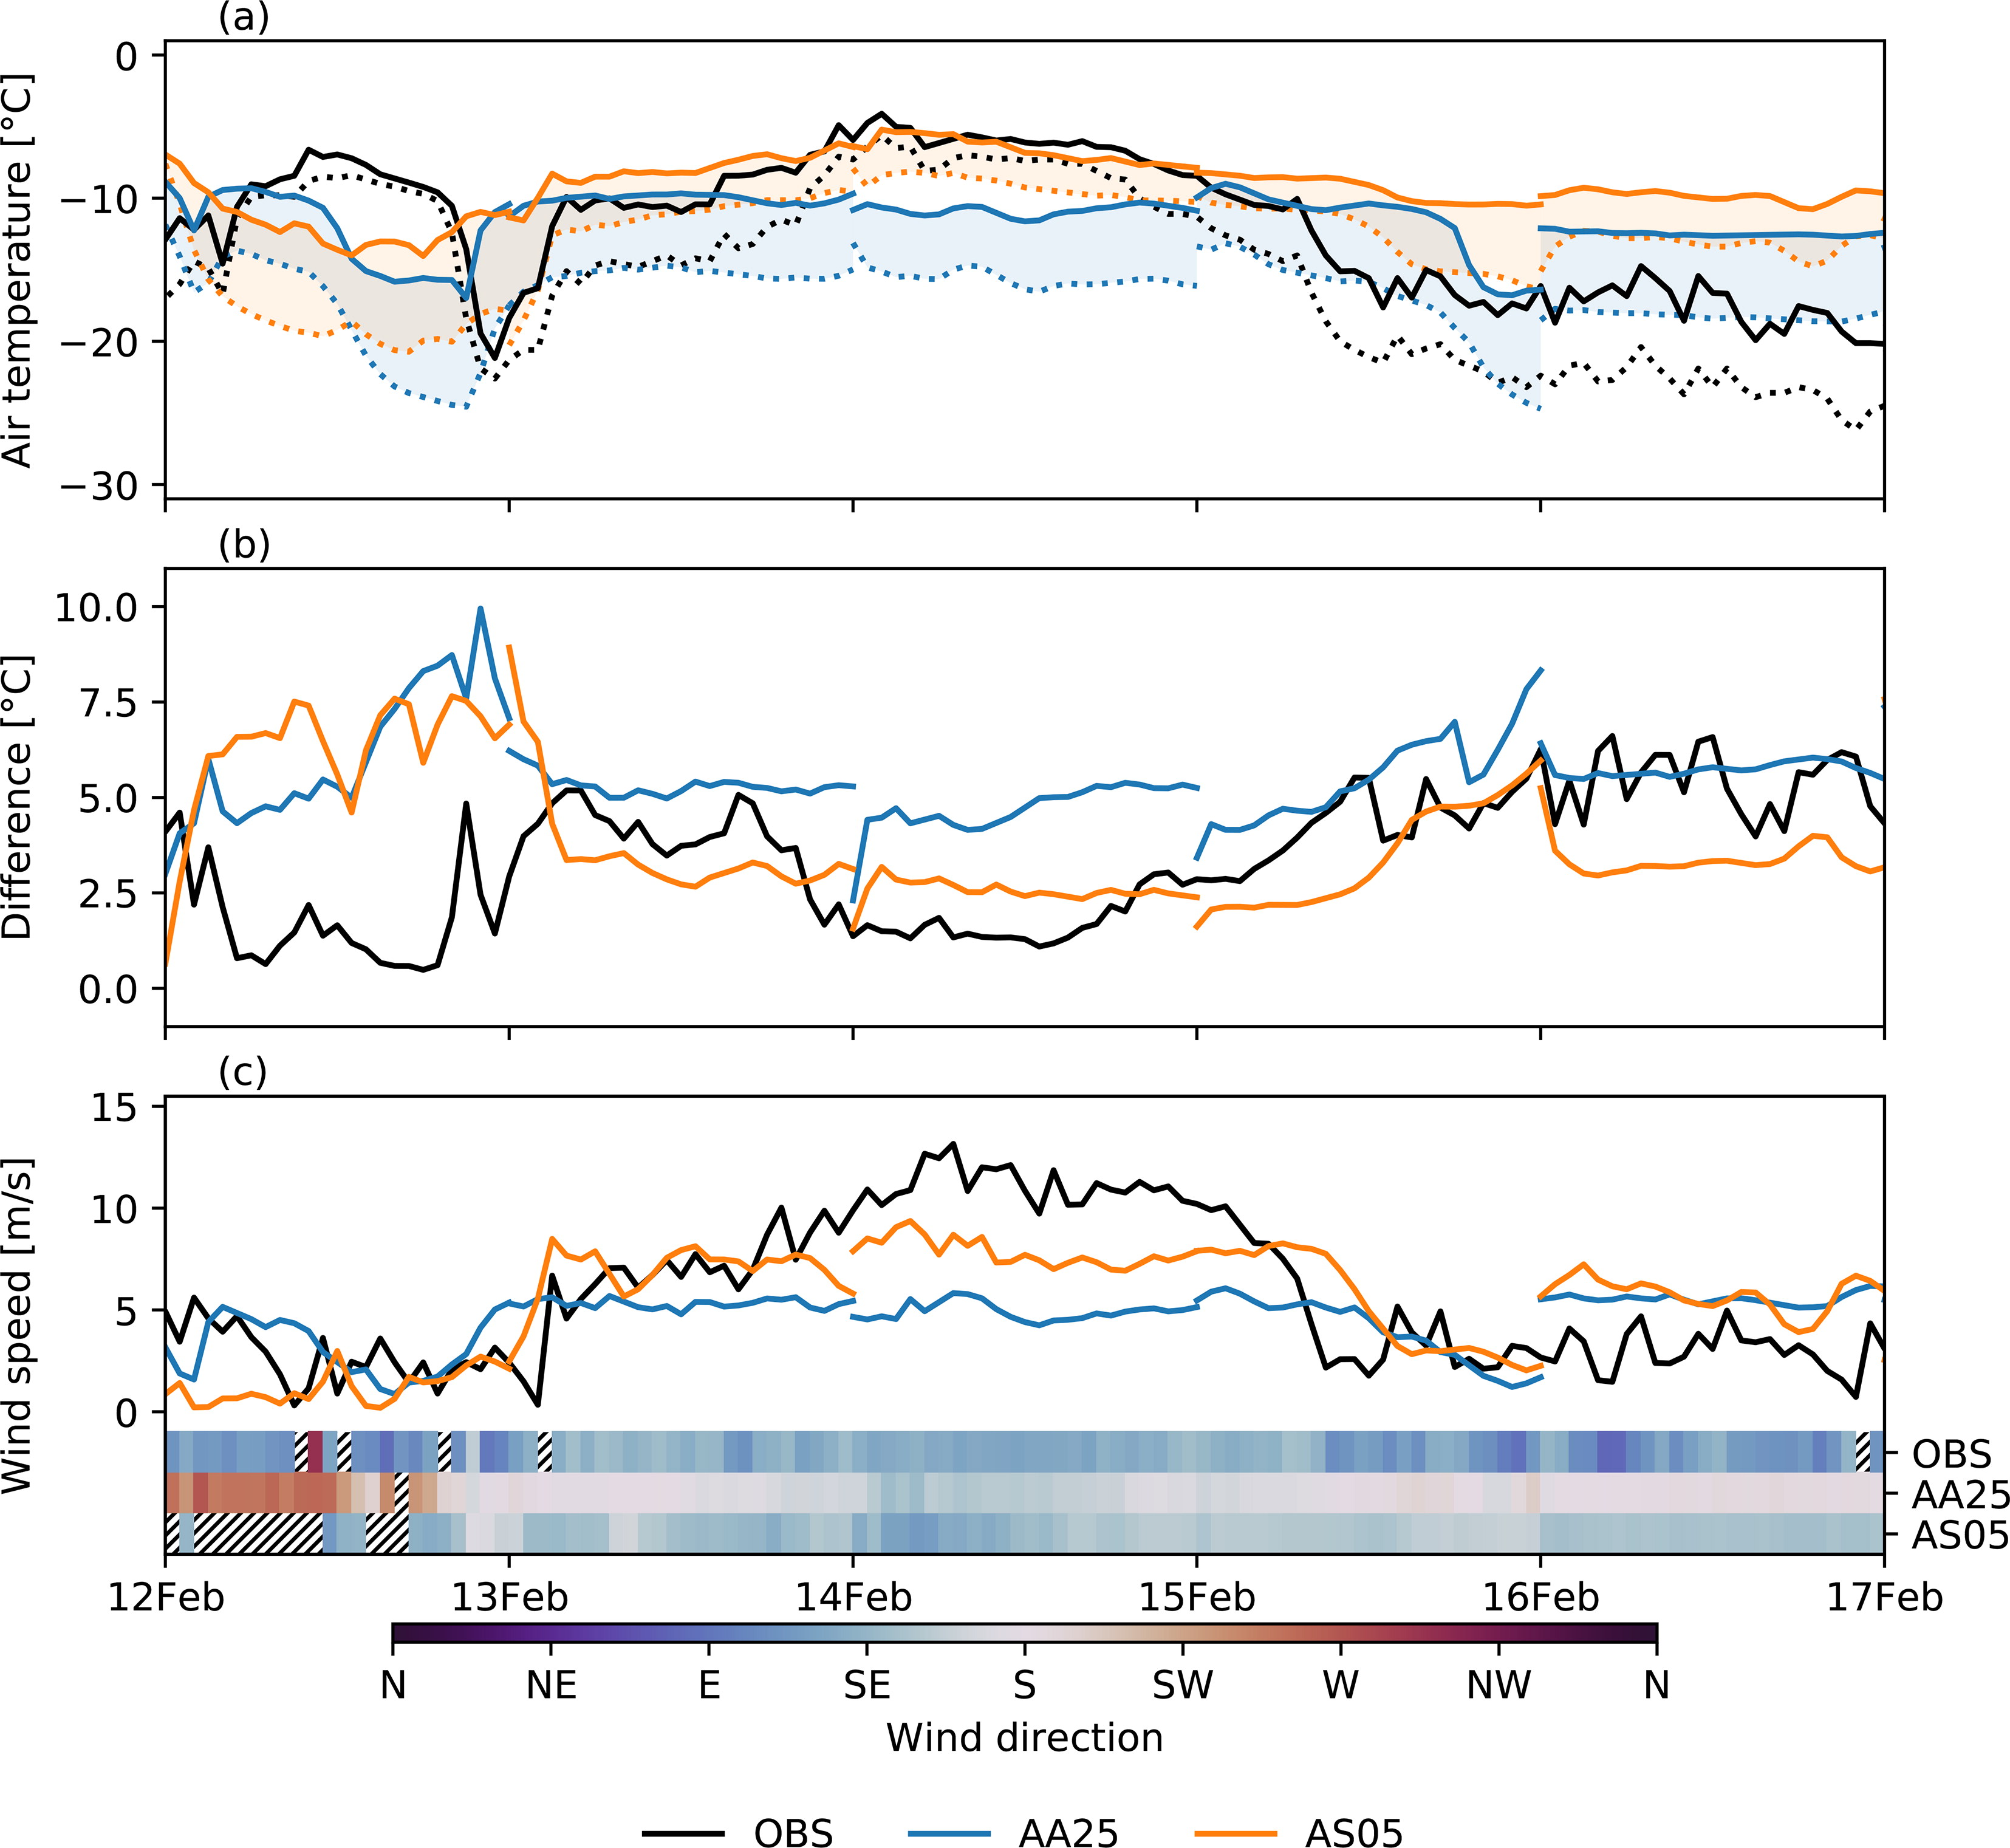
Fig. 4.
Time series of simulated and observed (a) 2-m air temperature (solid lines) and surface temperature (dotted lines); (b) difference between surface and 2-m air temperature; and (c) 10-m wind speed from the Adventdalen weather station. Wind direction is indicated in (c) using coloured shading. Hatched areas indicate wind speed less than 1 m/s.
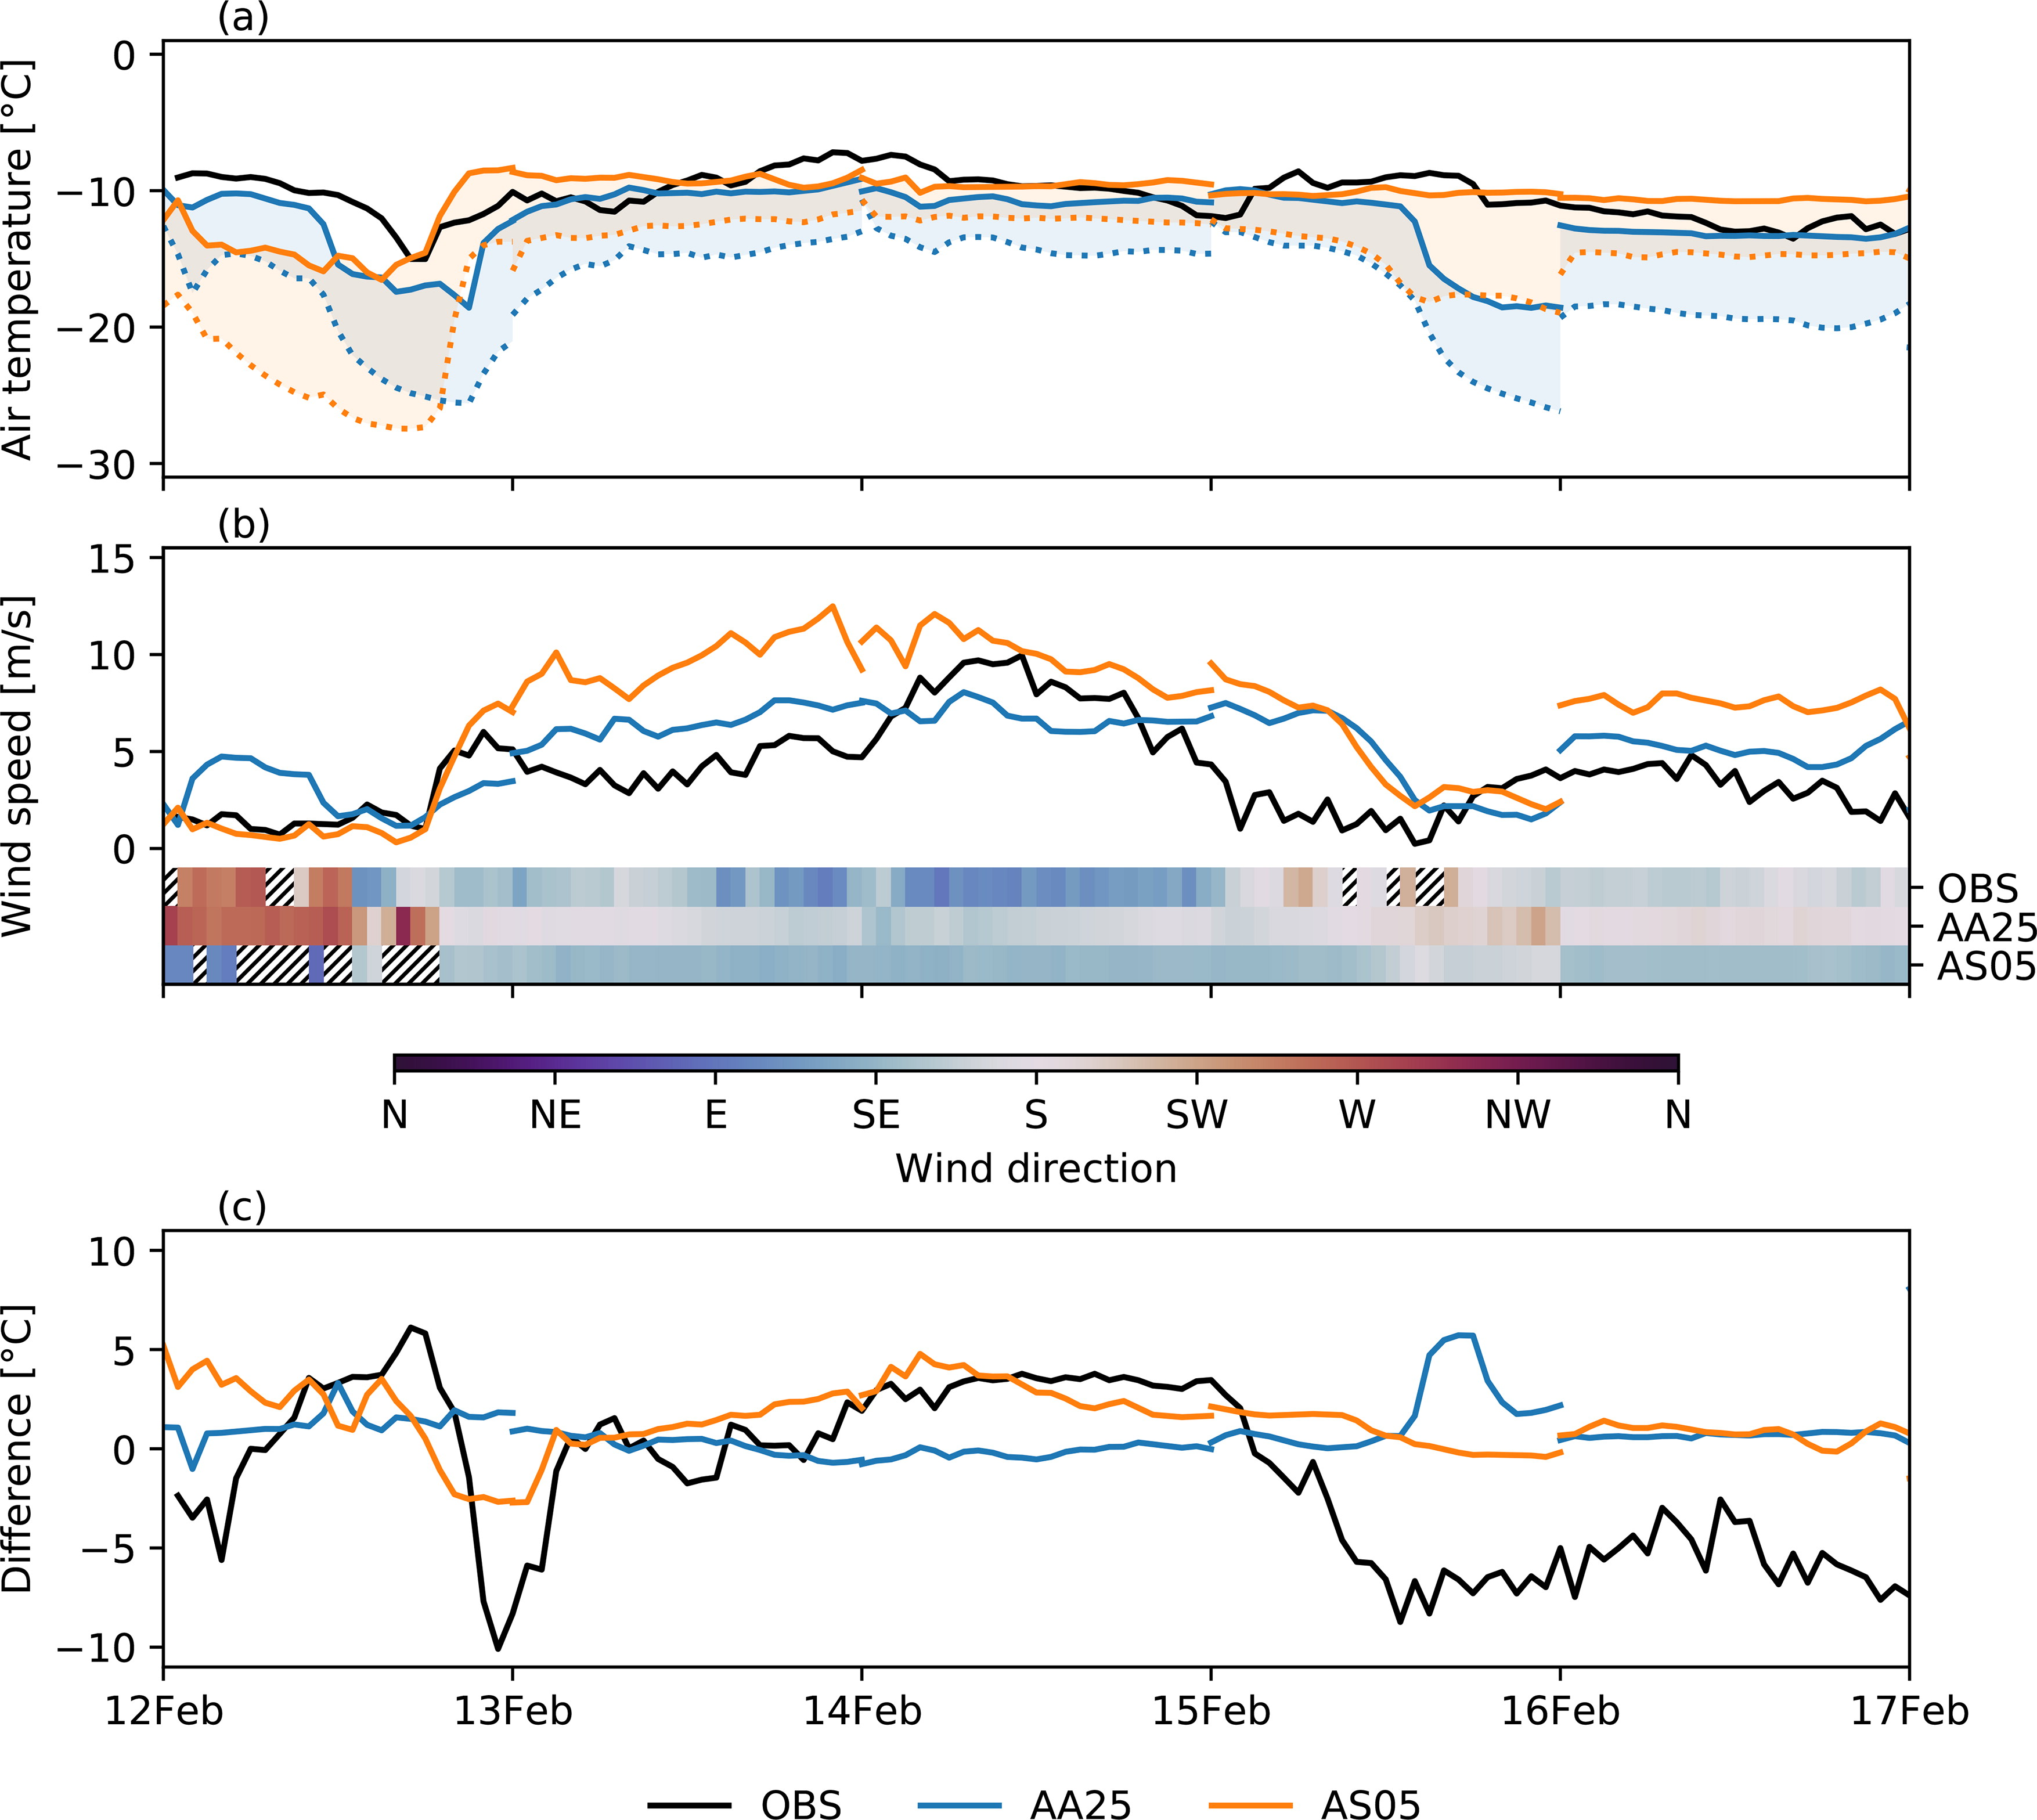
Fig. 5.
Time series of (a) simulated and observed 2-m air temperature (solid lines) and simulated surface temperature (dotted lines); (b) simulated and observed 10-m wind speed from the Gruvetfjellet weather station; and (c) simulated and observed difference between 2-m temperature at Adventdalen and Gruvefjellet. Observed surface temperature was not available for Gruvetfjellet. Also on (b) the observed and modelled wind direction is shown. Hatched areas indicate wind speed less than 1 m/s.
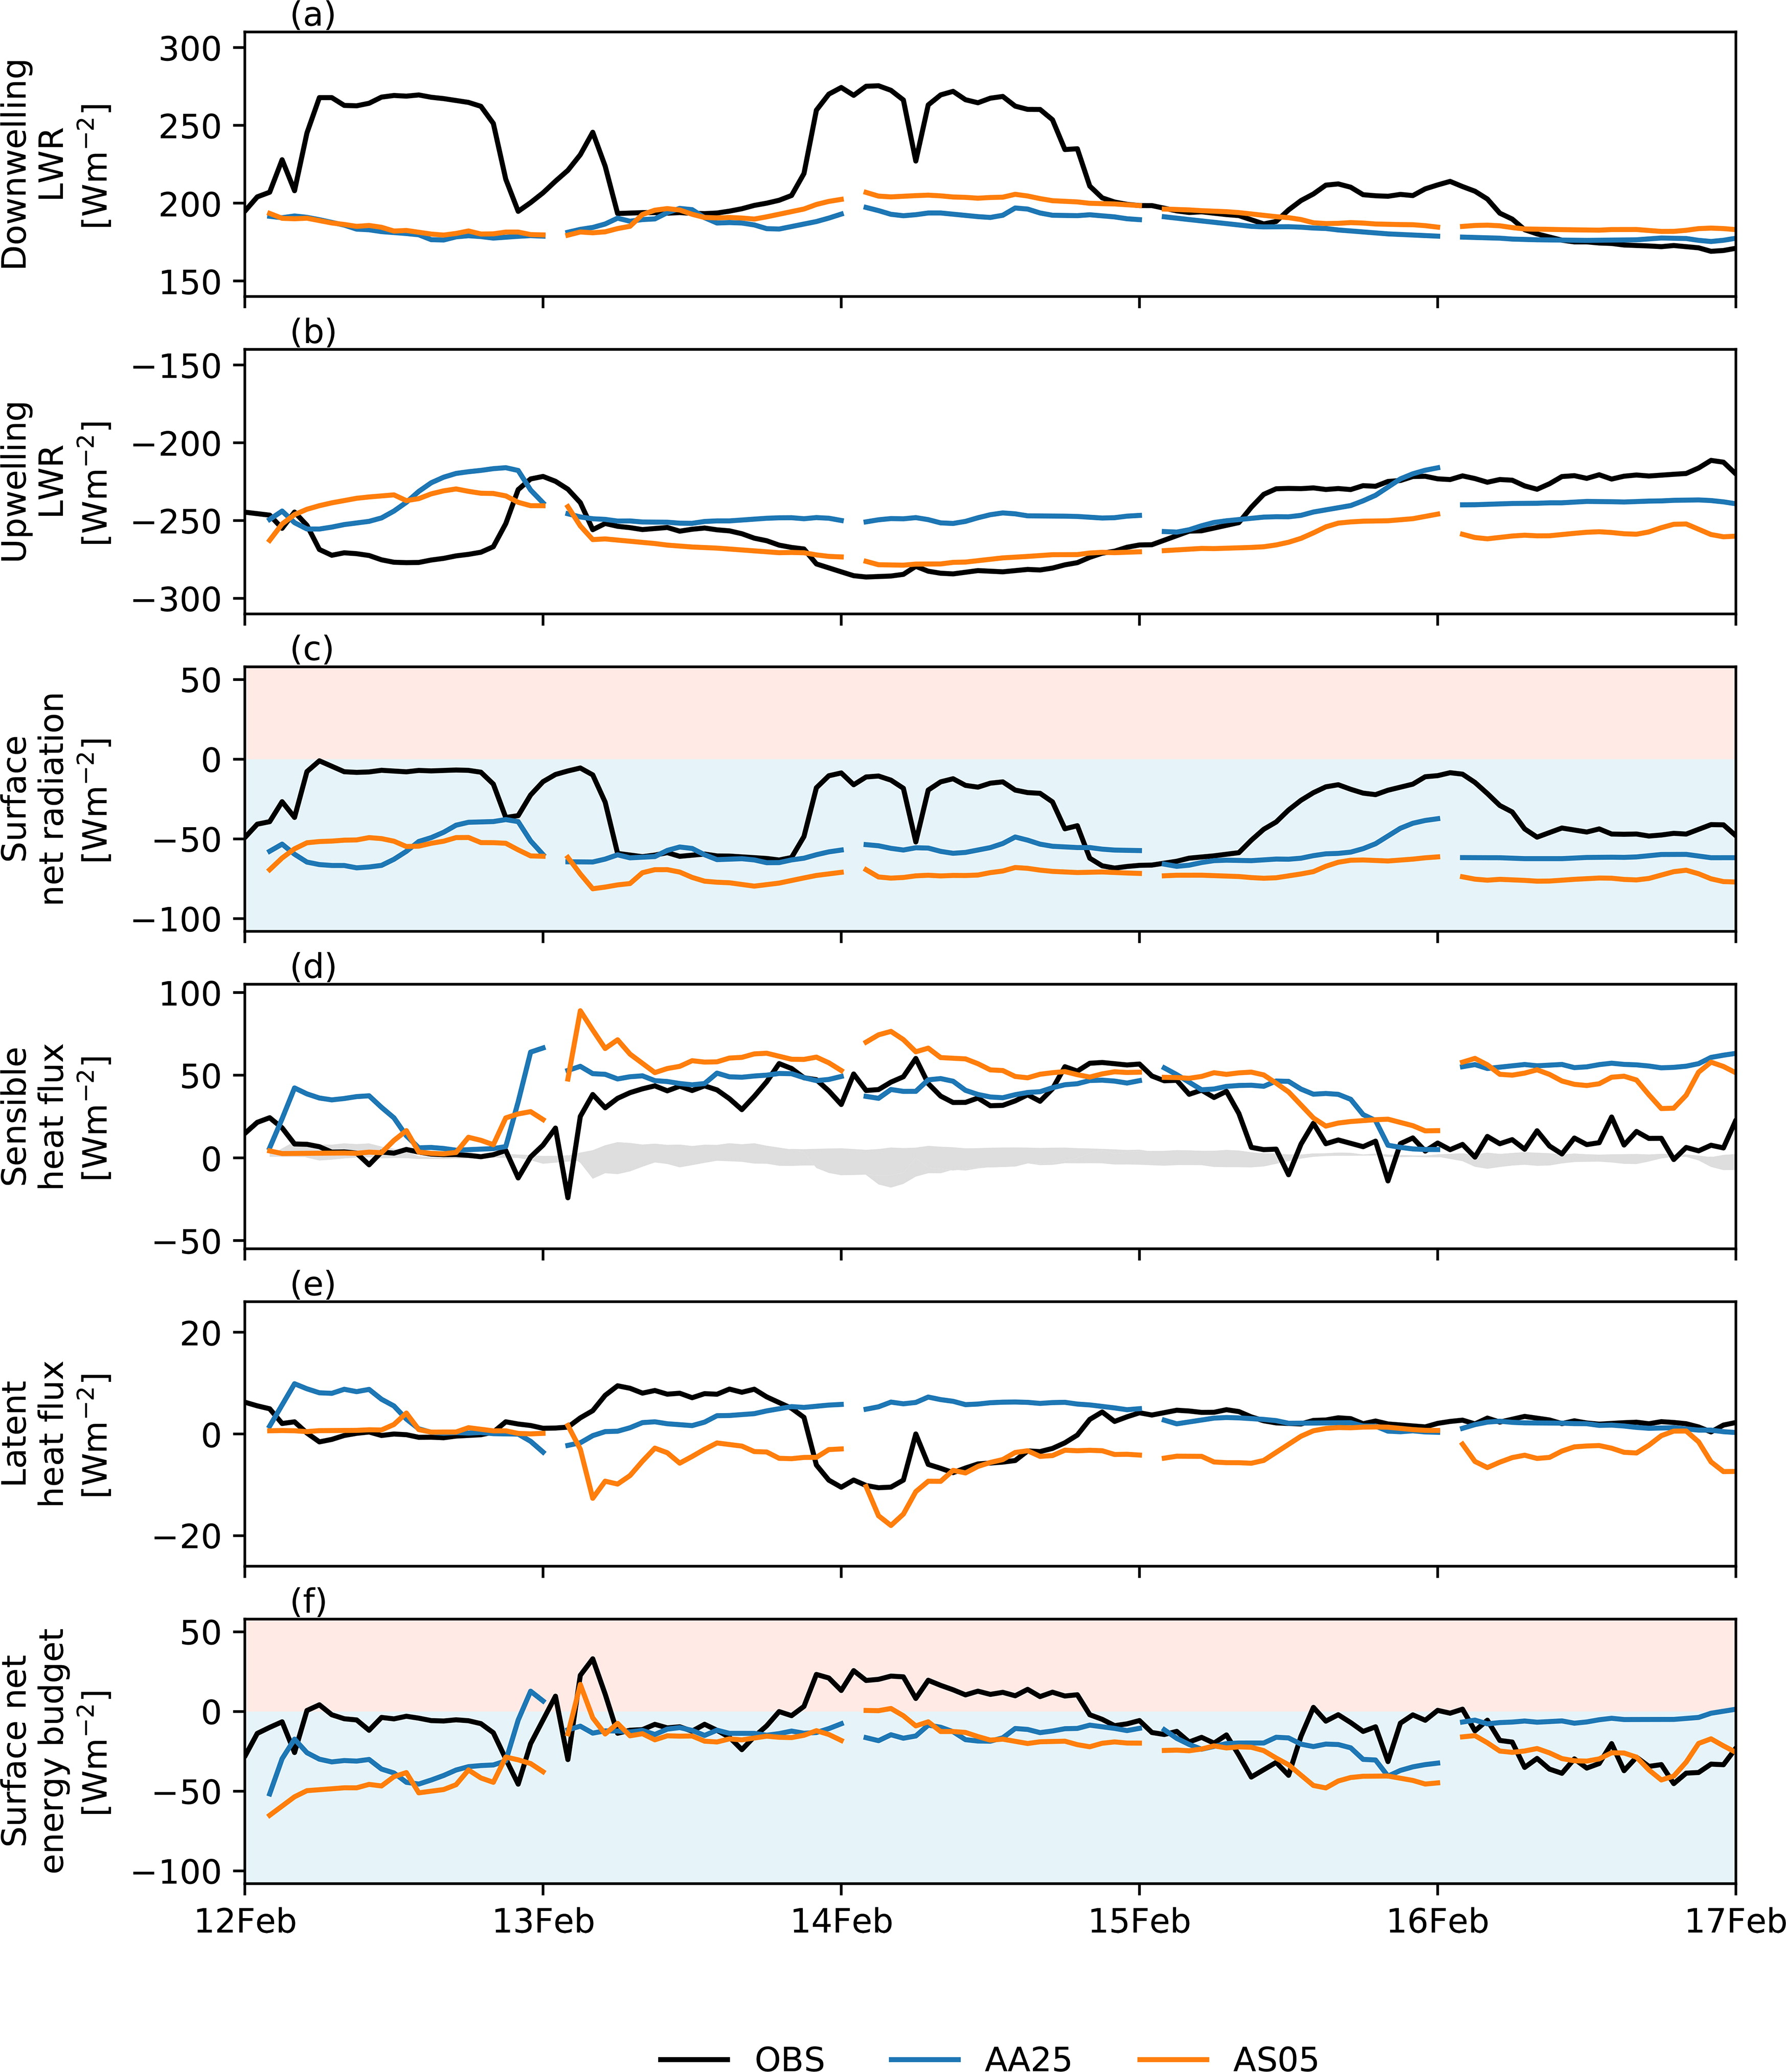
Fig. 6.
(a) Downwelling longwave radiation flux at the surface; (b) upwelling longwave radiation flux emitted by the surface; (c) net radiation flux at the surface including the contributions from both shortwave and longwave radiation fluxes; (d) sensible heat flux from surface to atmosphere; (e) latent heat flux from surface to atmosphere (note the different scale on y-axis); (f) surface net energy budget at the Adventdalen weather station. Also on (d) the latent heat flux from the panel (e) is outlined to scale. All the fluxes are downwards-positive.
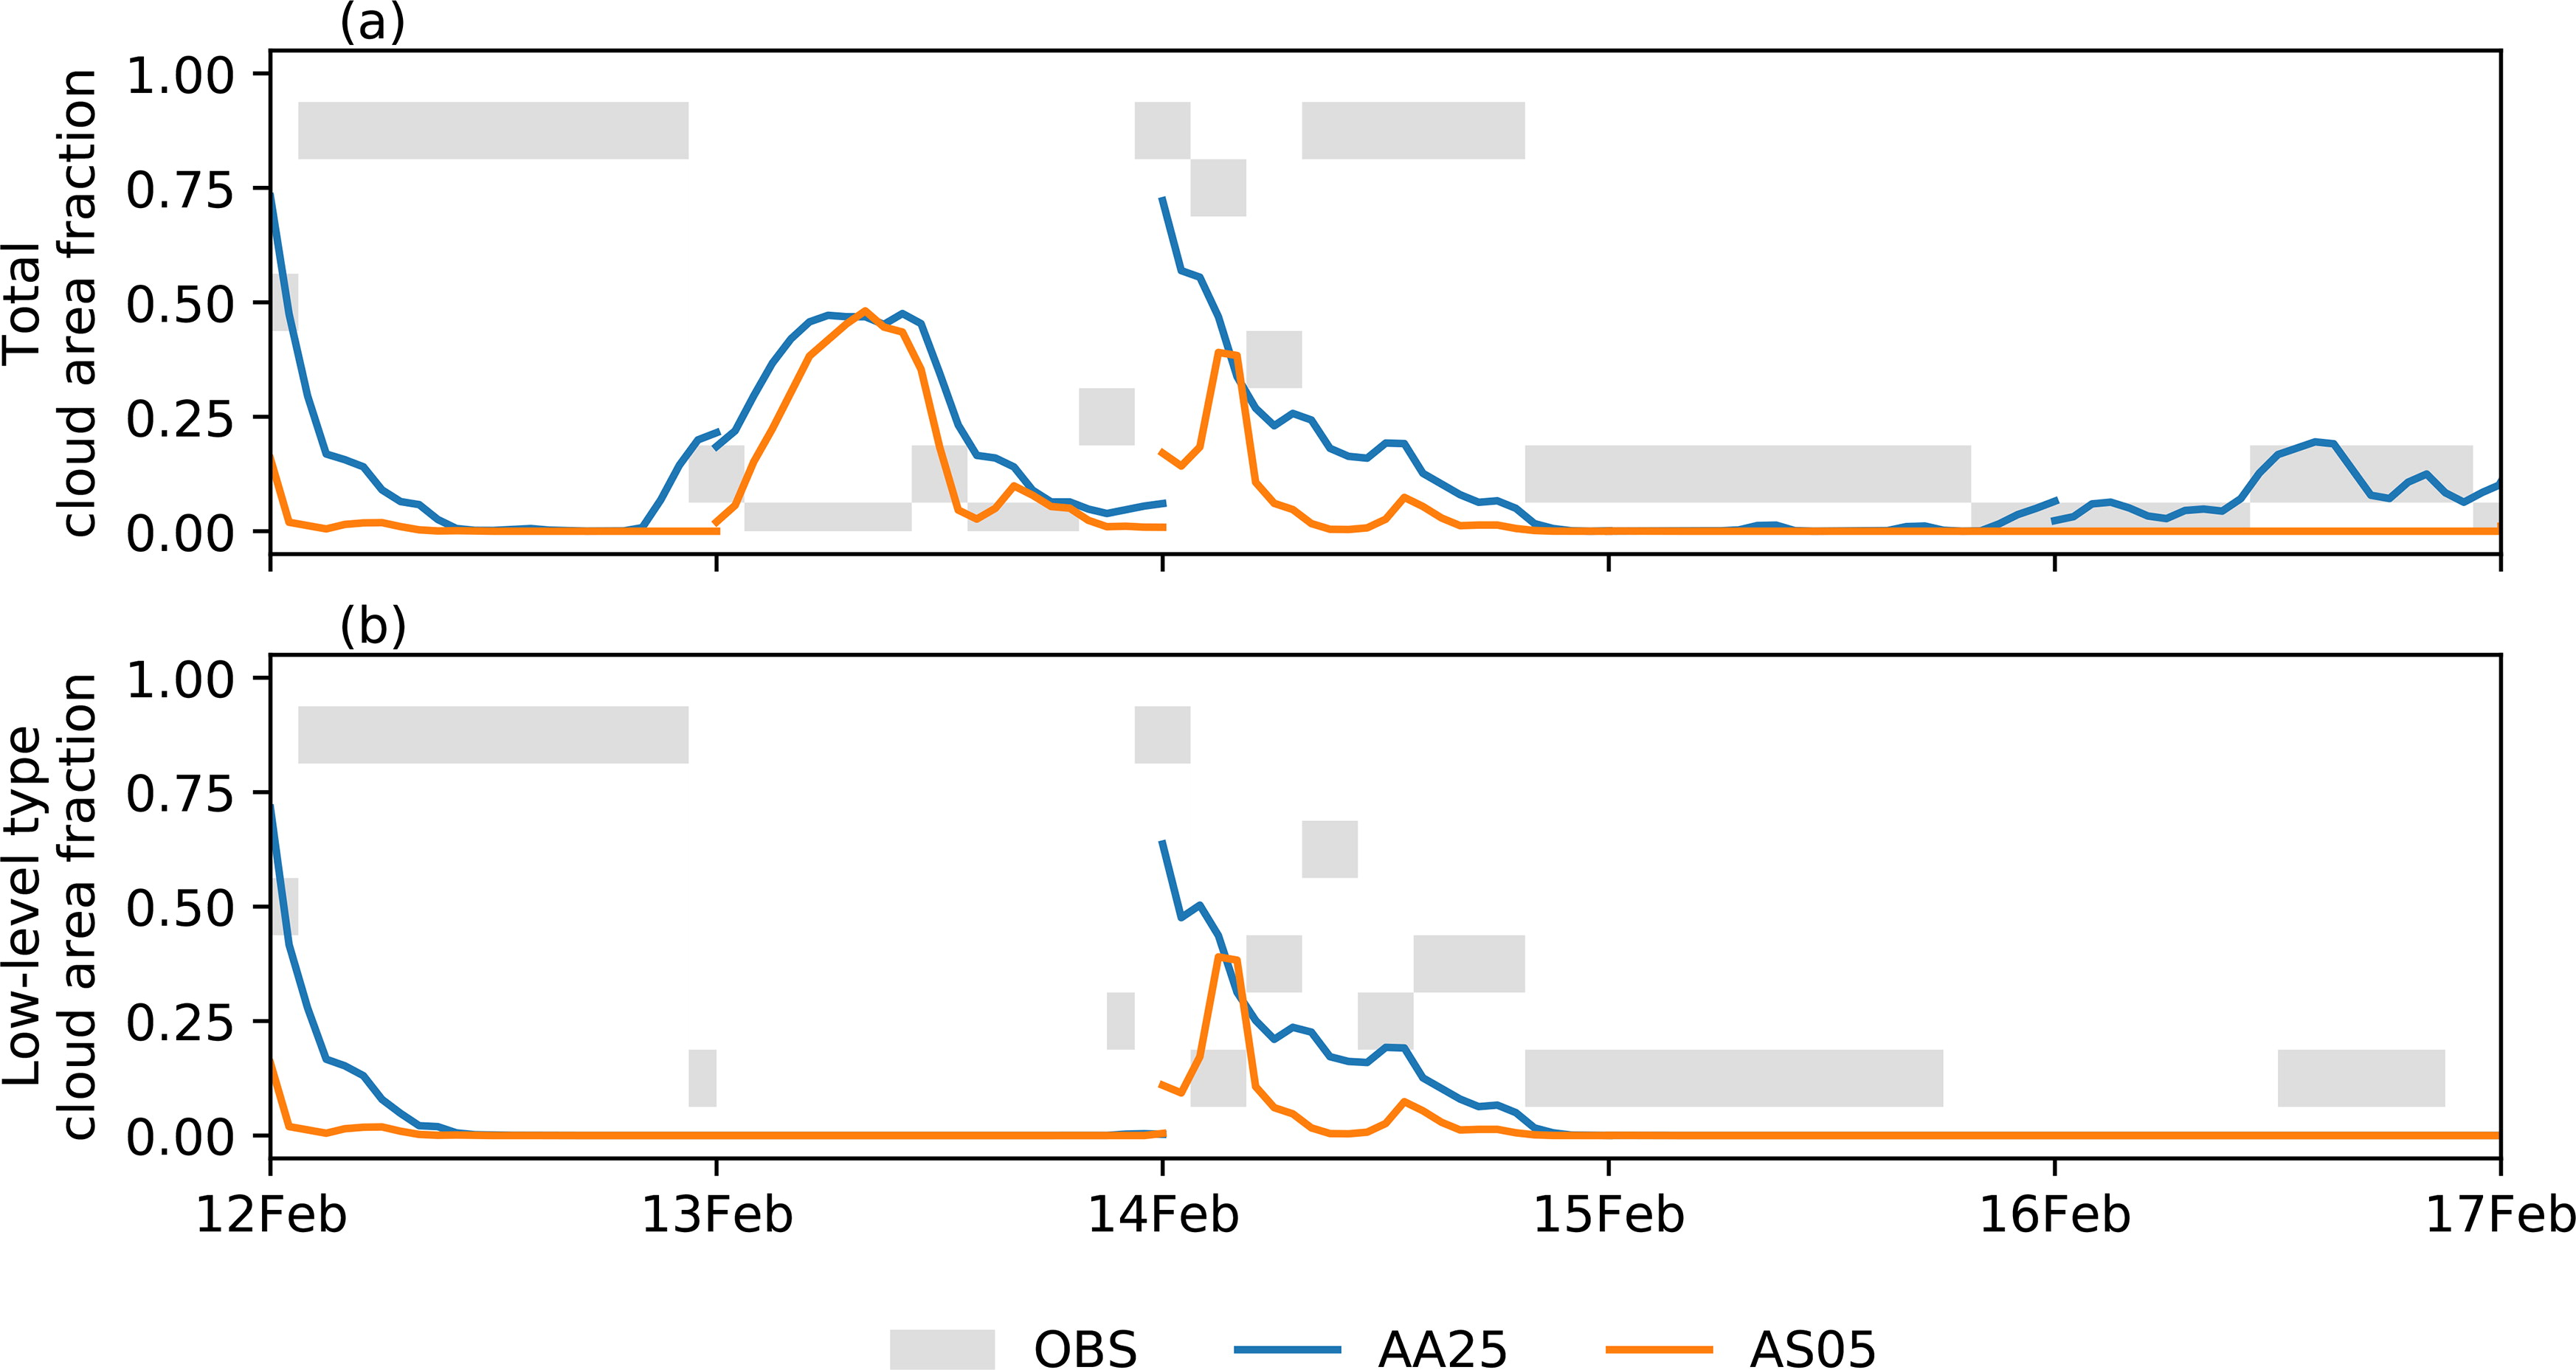
Fig. 7.
Time series of (a) total cloud cover and (b) low-level cloud cover as observed at Svalbard Airport (grey shading) and in the AA25 and AS05 experiments (colors).
Table 4.
Mean error (ME) and standard deviation of error (SDE) between the observations and the modelled values for components of the surface energy budget at the Adventdalen weather station.
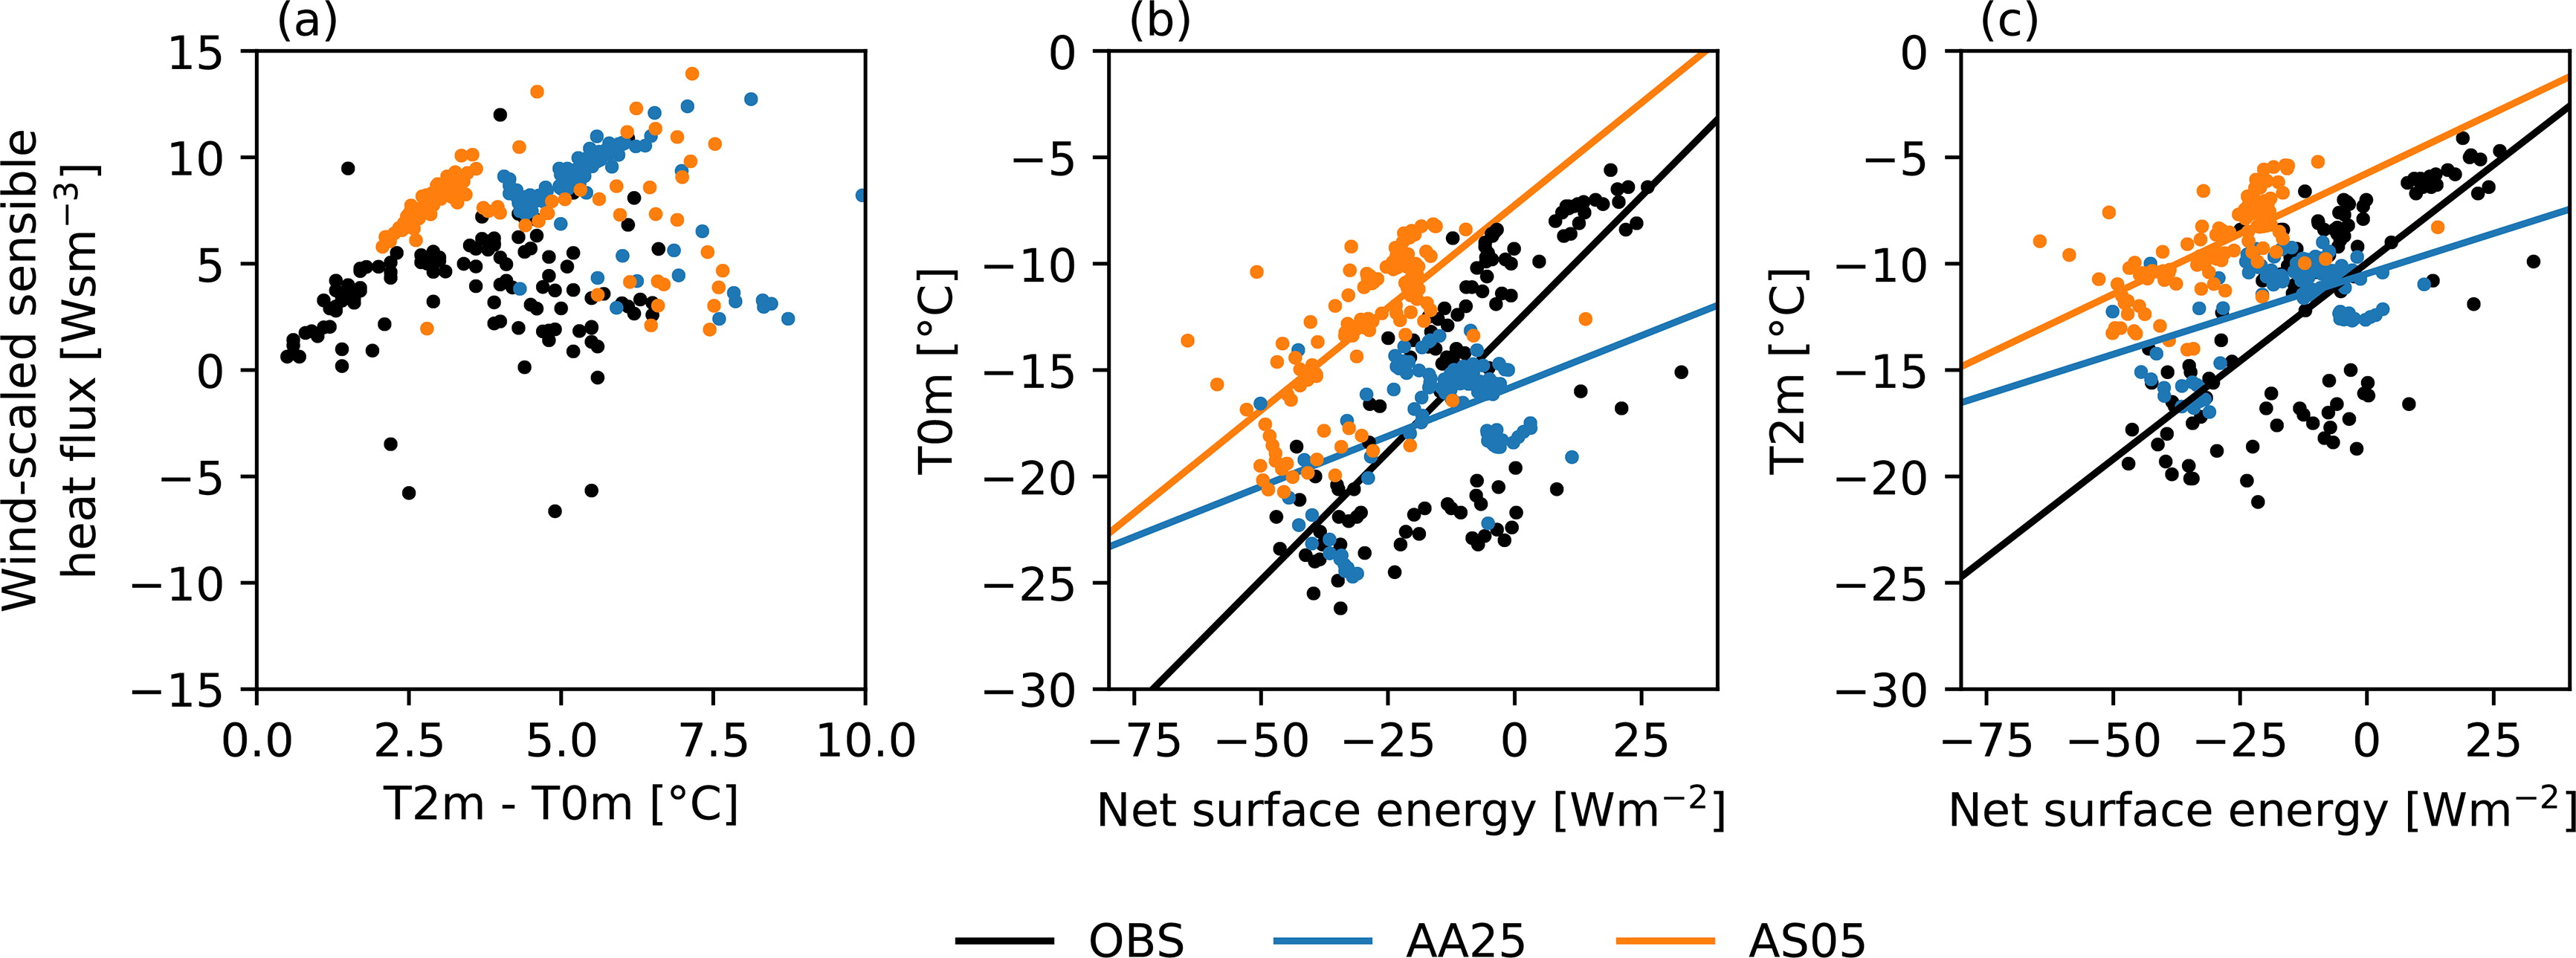
Fig. 8.
(a) Sensible heat flux divided by the 10-m wind speed against temperature difference between 2 m and surface, (b) surface temperature, and (c) 2-m temperature against the net energy (LWnet + SH + LE) at the Adventdalen station in observations and in the AA25 and AS05 experiments. Least-squares regression lines are included in (b) and (c).
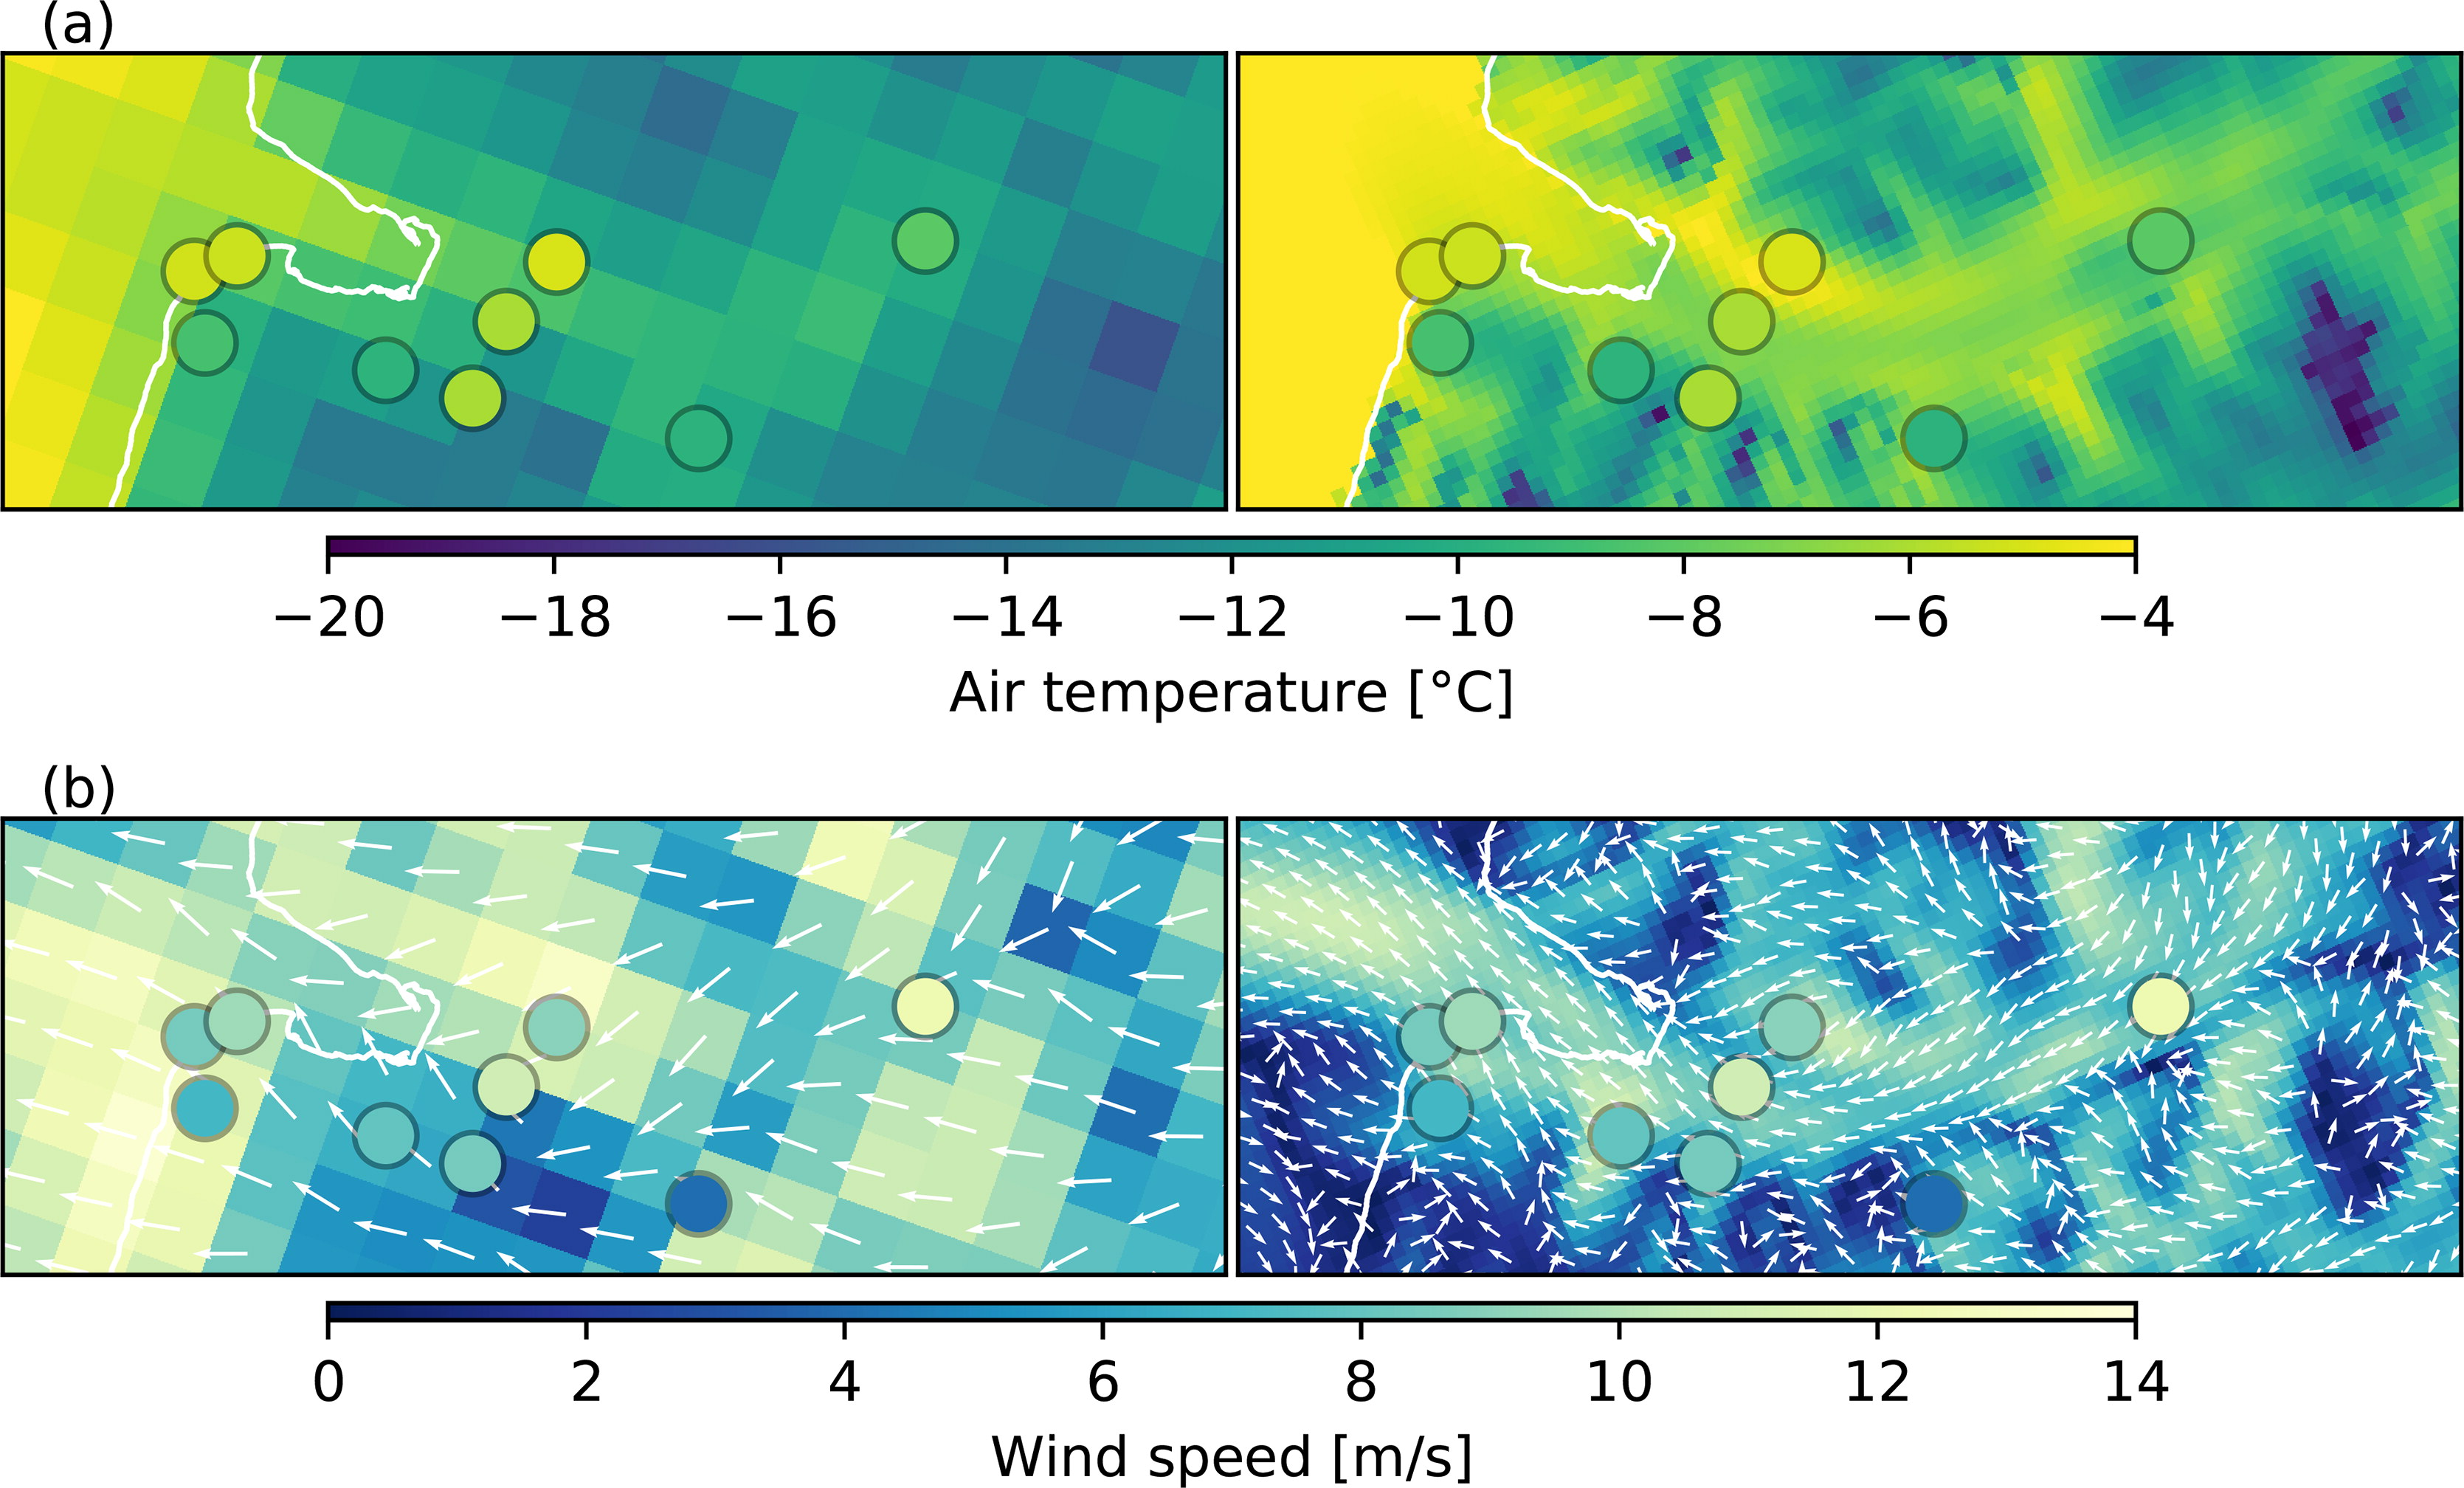
Fig. 9.
(a) Two-metre temperature and (b) 10-m wind speed and wind direction in AA25 (left column) and AS05 (right column) on 14 February at 12 UTC. For AS05, only the wind direction in each second grid cell is presented. The white contour shows the coastline according to the local topography by the Norwegian Polar Institute (see Fig. 1). Superimposed (filled circles) are in-situ observations of 2-m temperature and 10-m wind speed.
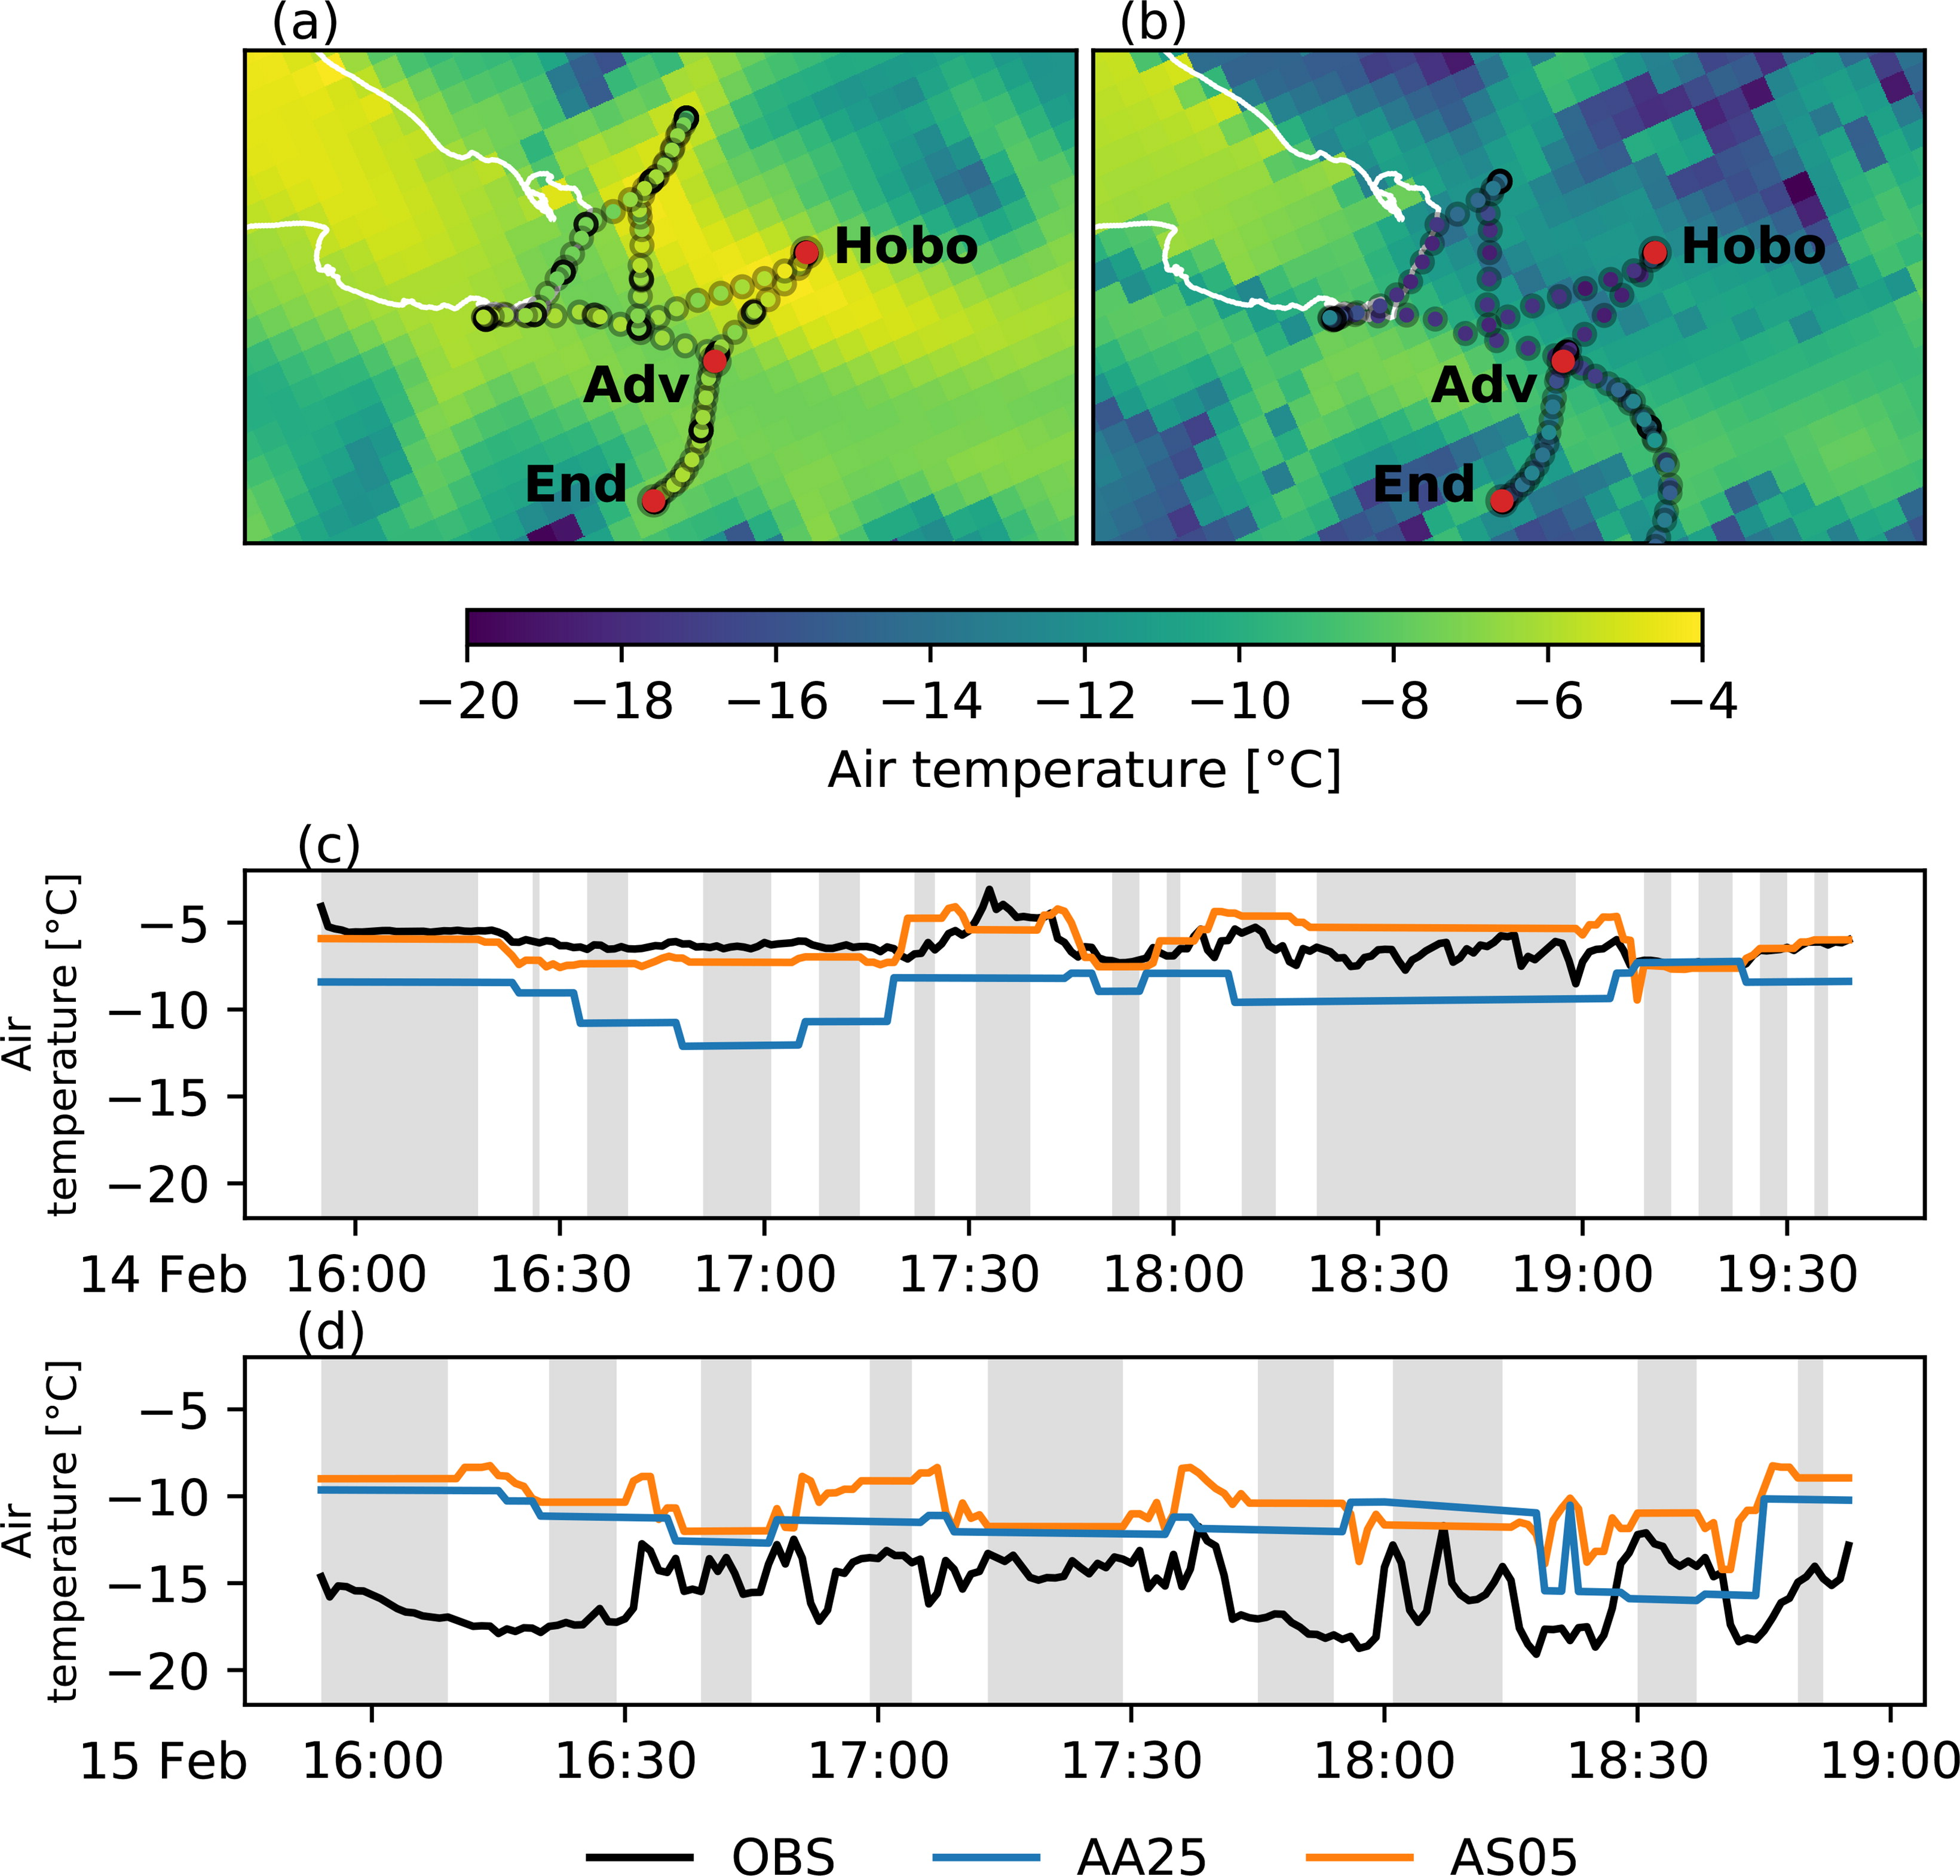
Fig. 10.
Two-metre temperature field from AS05 compared to measurements from snowmobile. (a) AS05 forecast from 14 February 18 UTC and air temperature measured along the snowmobile track; (b) same as (a) but for 15 February 18 UTC; (c) time series of snowmobile measurements shown in the panel (a) compared to AS05 forecast, shaded areas correspond to stops of the snowmobile; (d) same as (c), but for the series of snowmobile measurements shown in the panel (b).
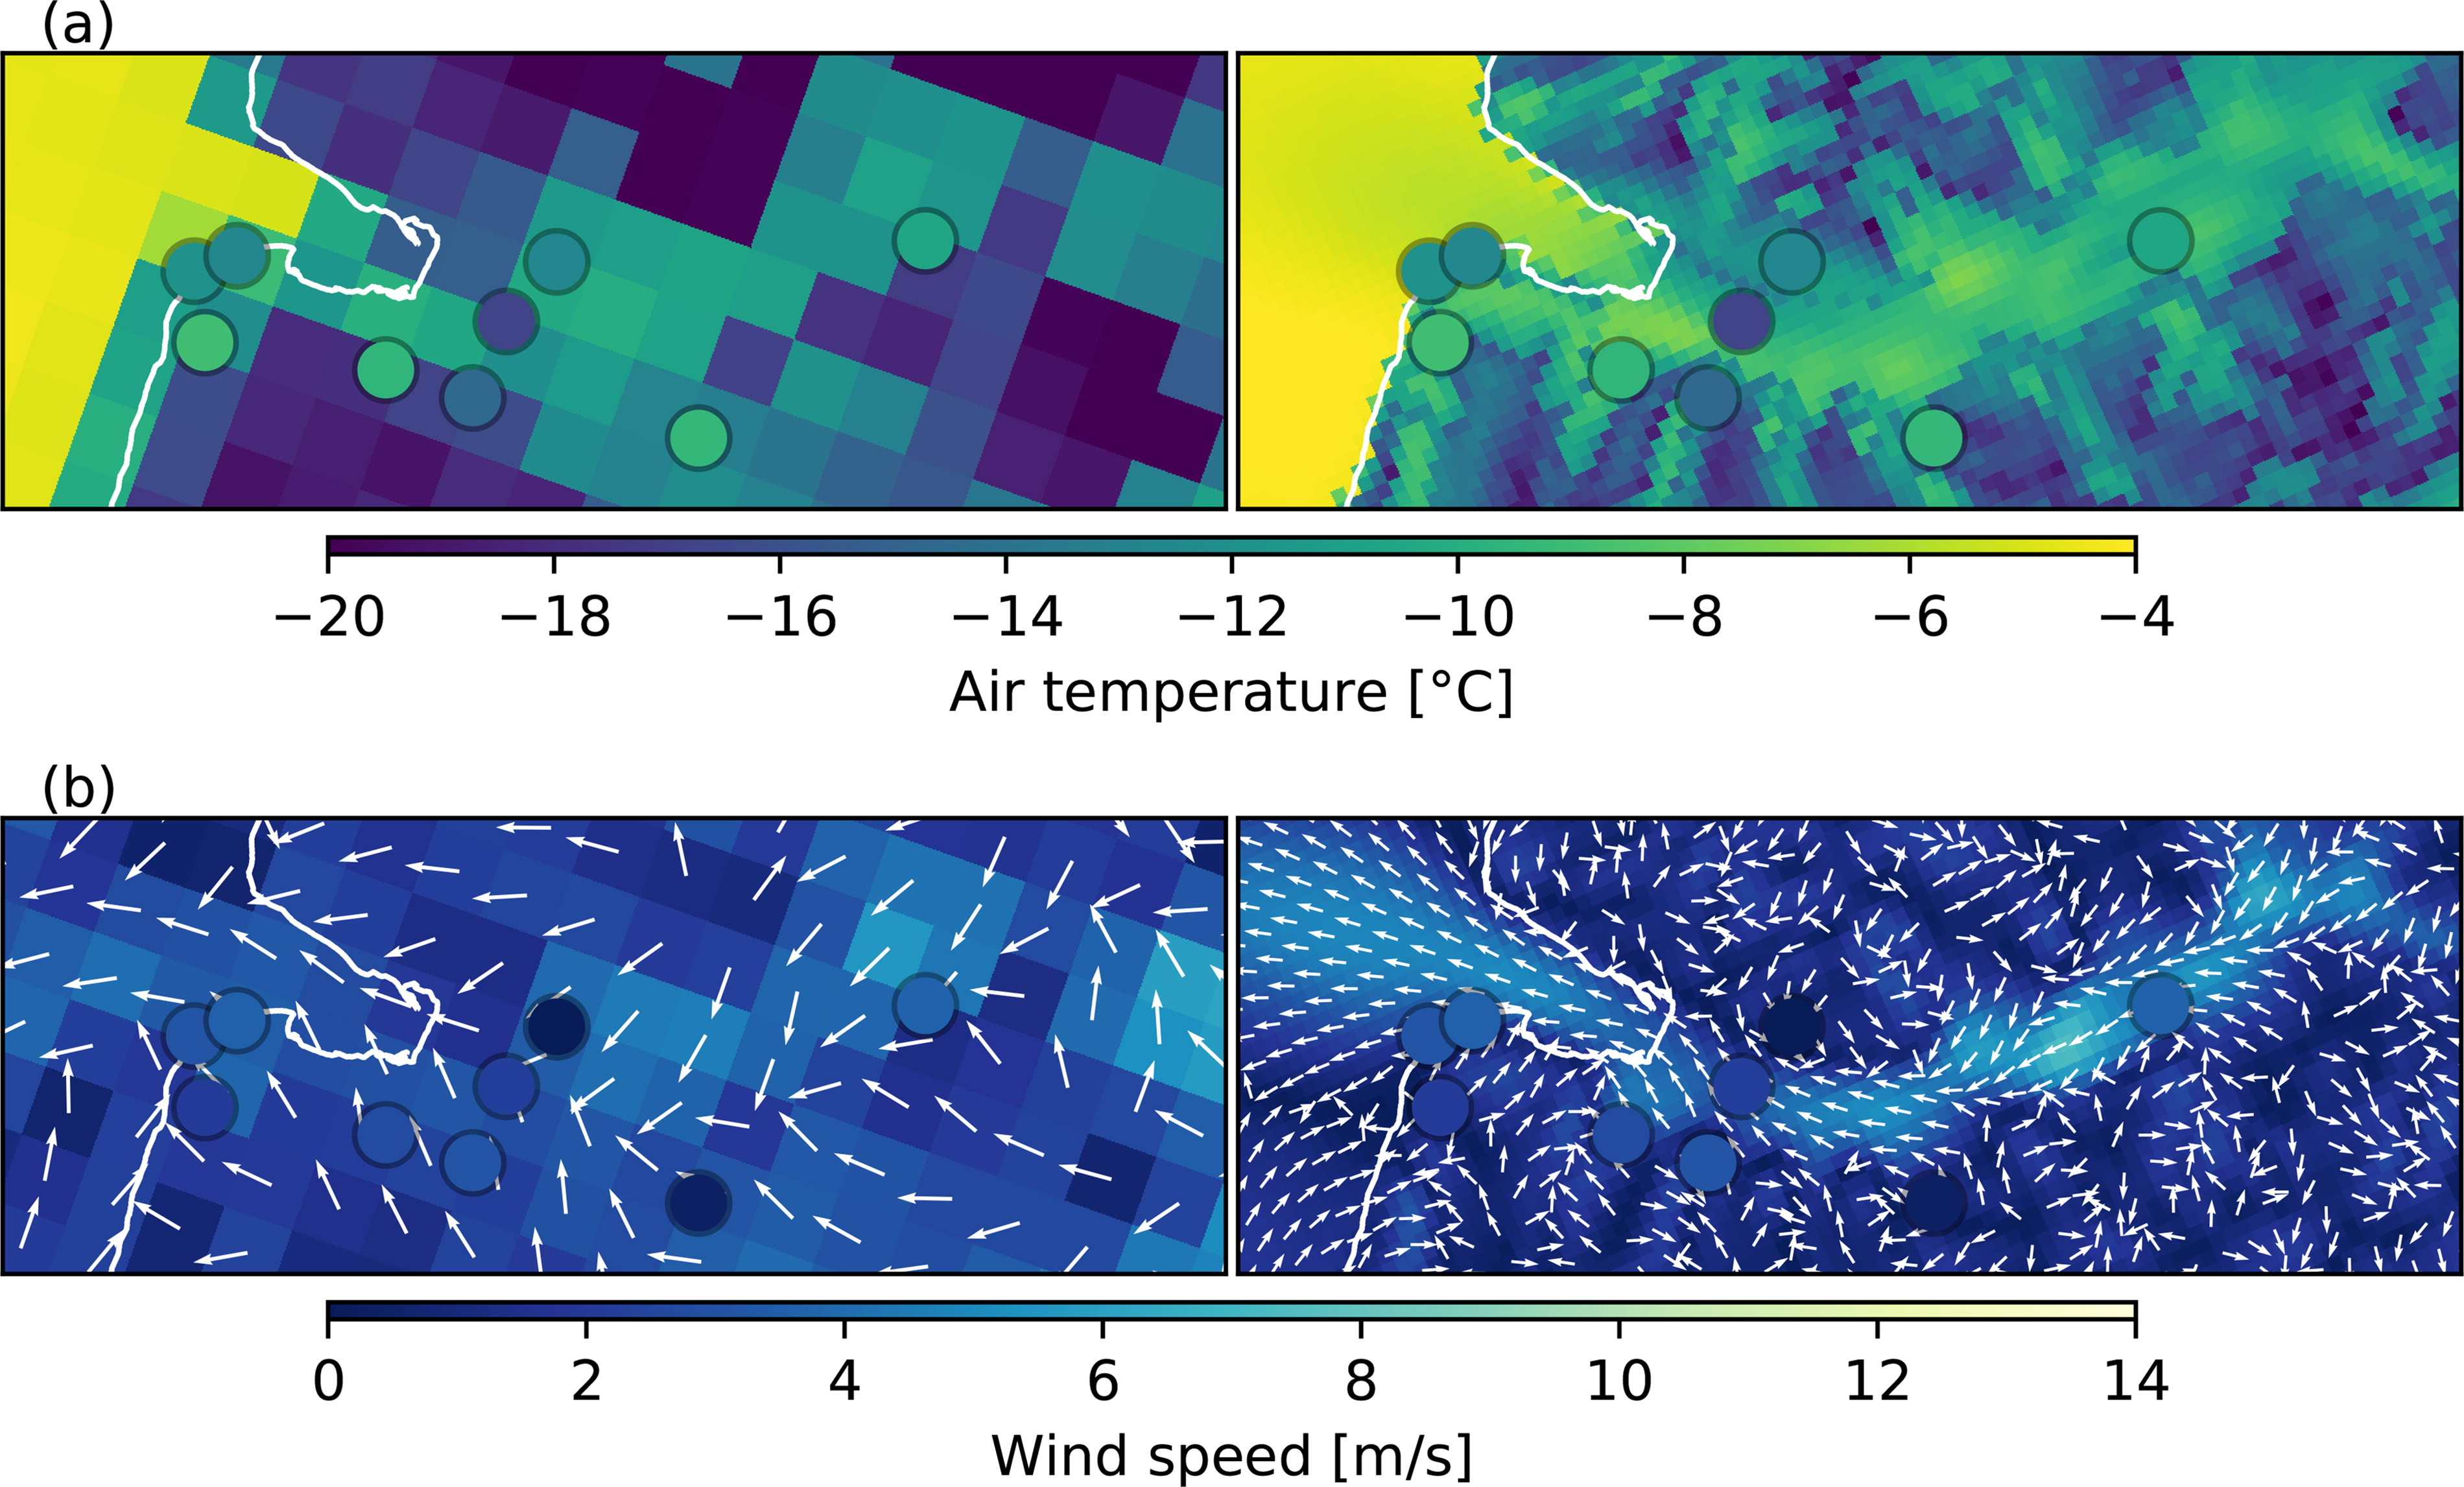
Fig. 11.
As Fig. 9 but for 15 February 18:00 UTC.
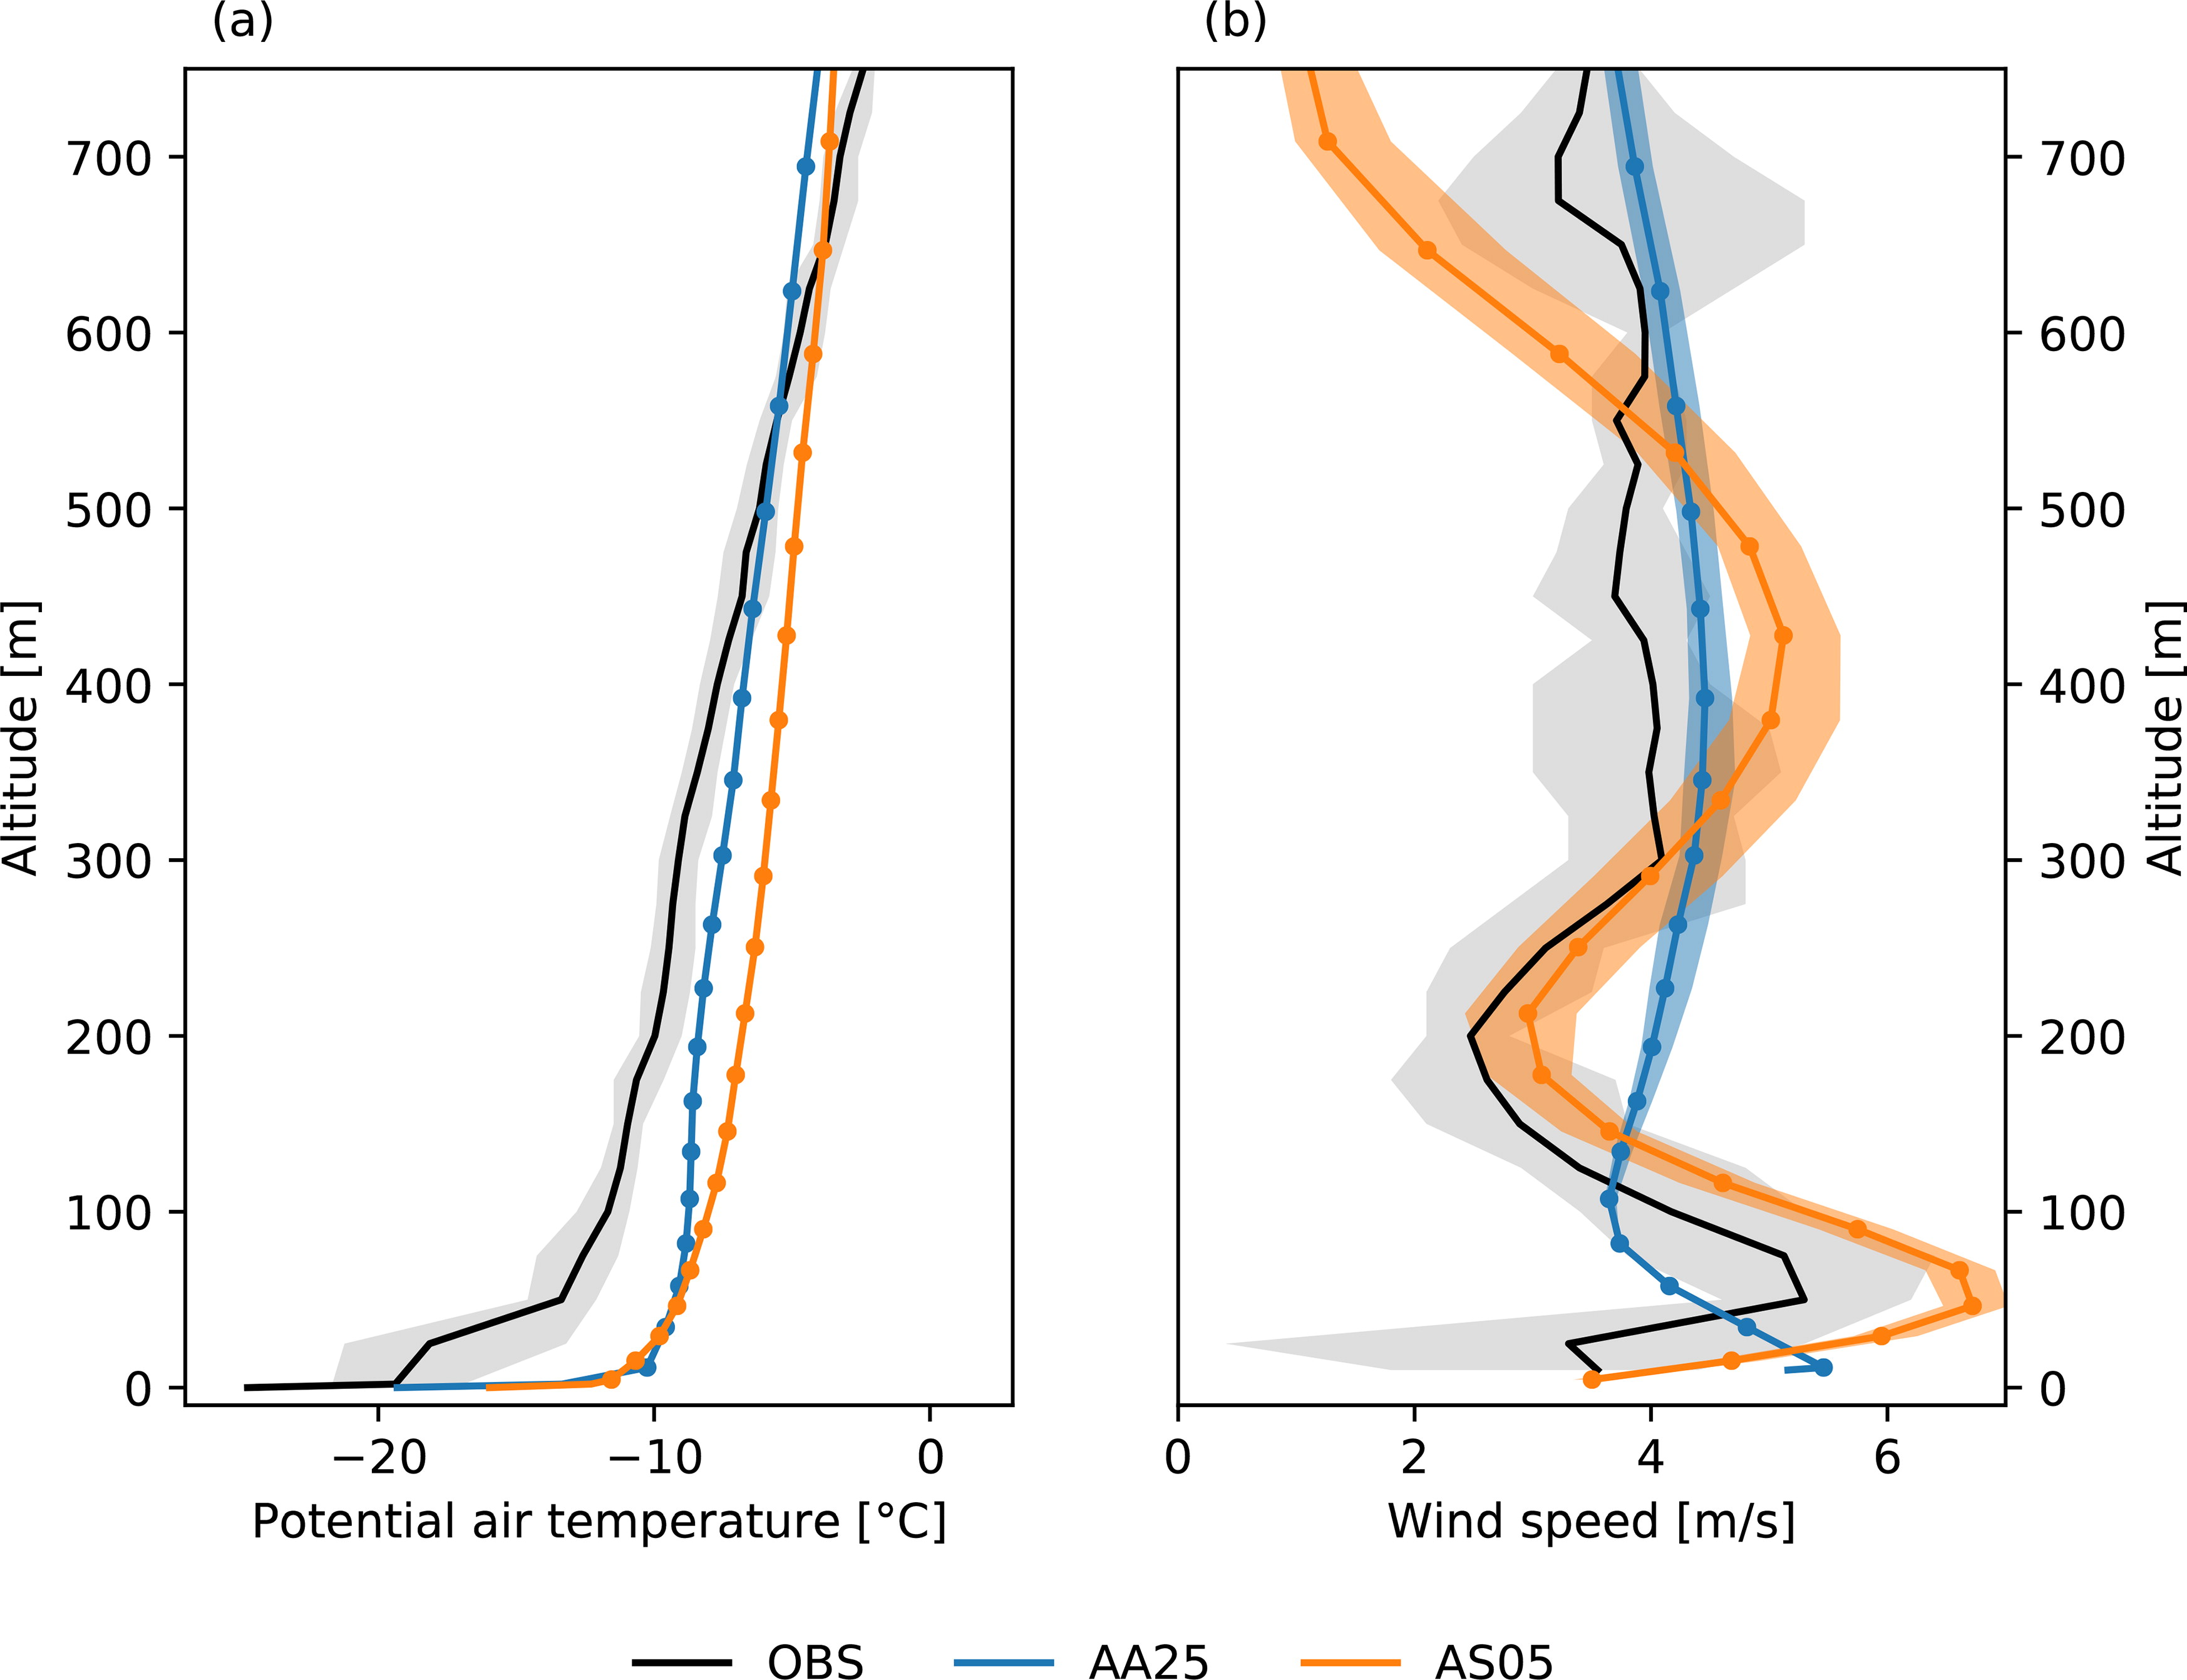
Fig. 12.
Observed (tethersonde) and modelled (AA25 and AS05) vertical profiles of (a) potential temperature and (b) wind speed at the Adventdalen weather station. The tethersonde data are from two profiles, each with two sensors, obtained on 16 February between 17:34 and 19:12 UTC. The model data are from 17:00 to 19:00 UTC. Solid lines indicate the average of the profiles and the range is shown with shading. The potential temperature profiles have been extended to surface by including 2-m and surface temperature and the AA25 wind speed profile has been extended by including the 10-m data.
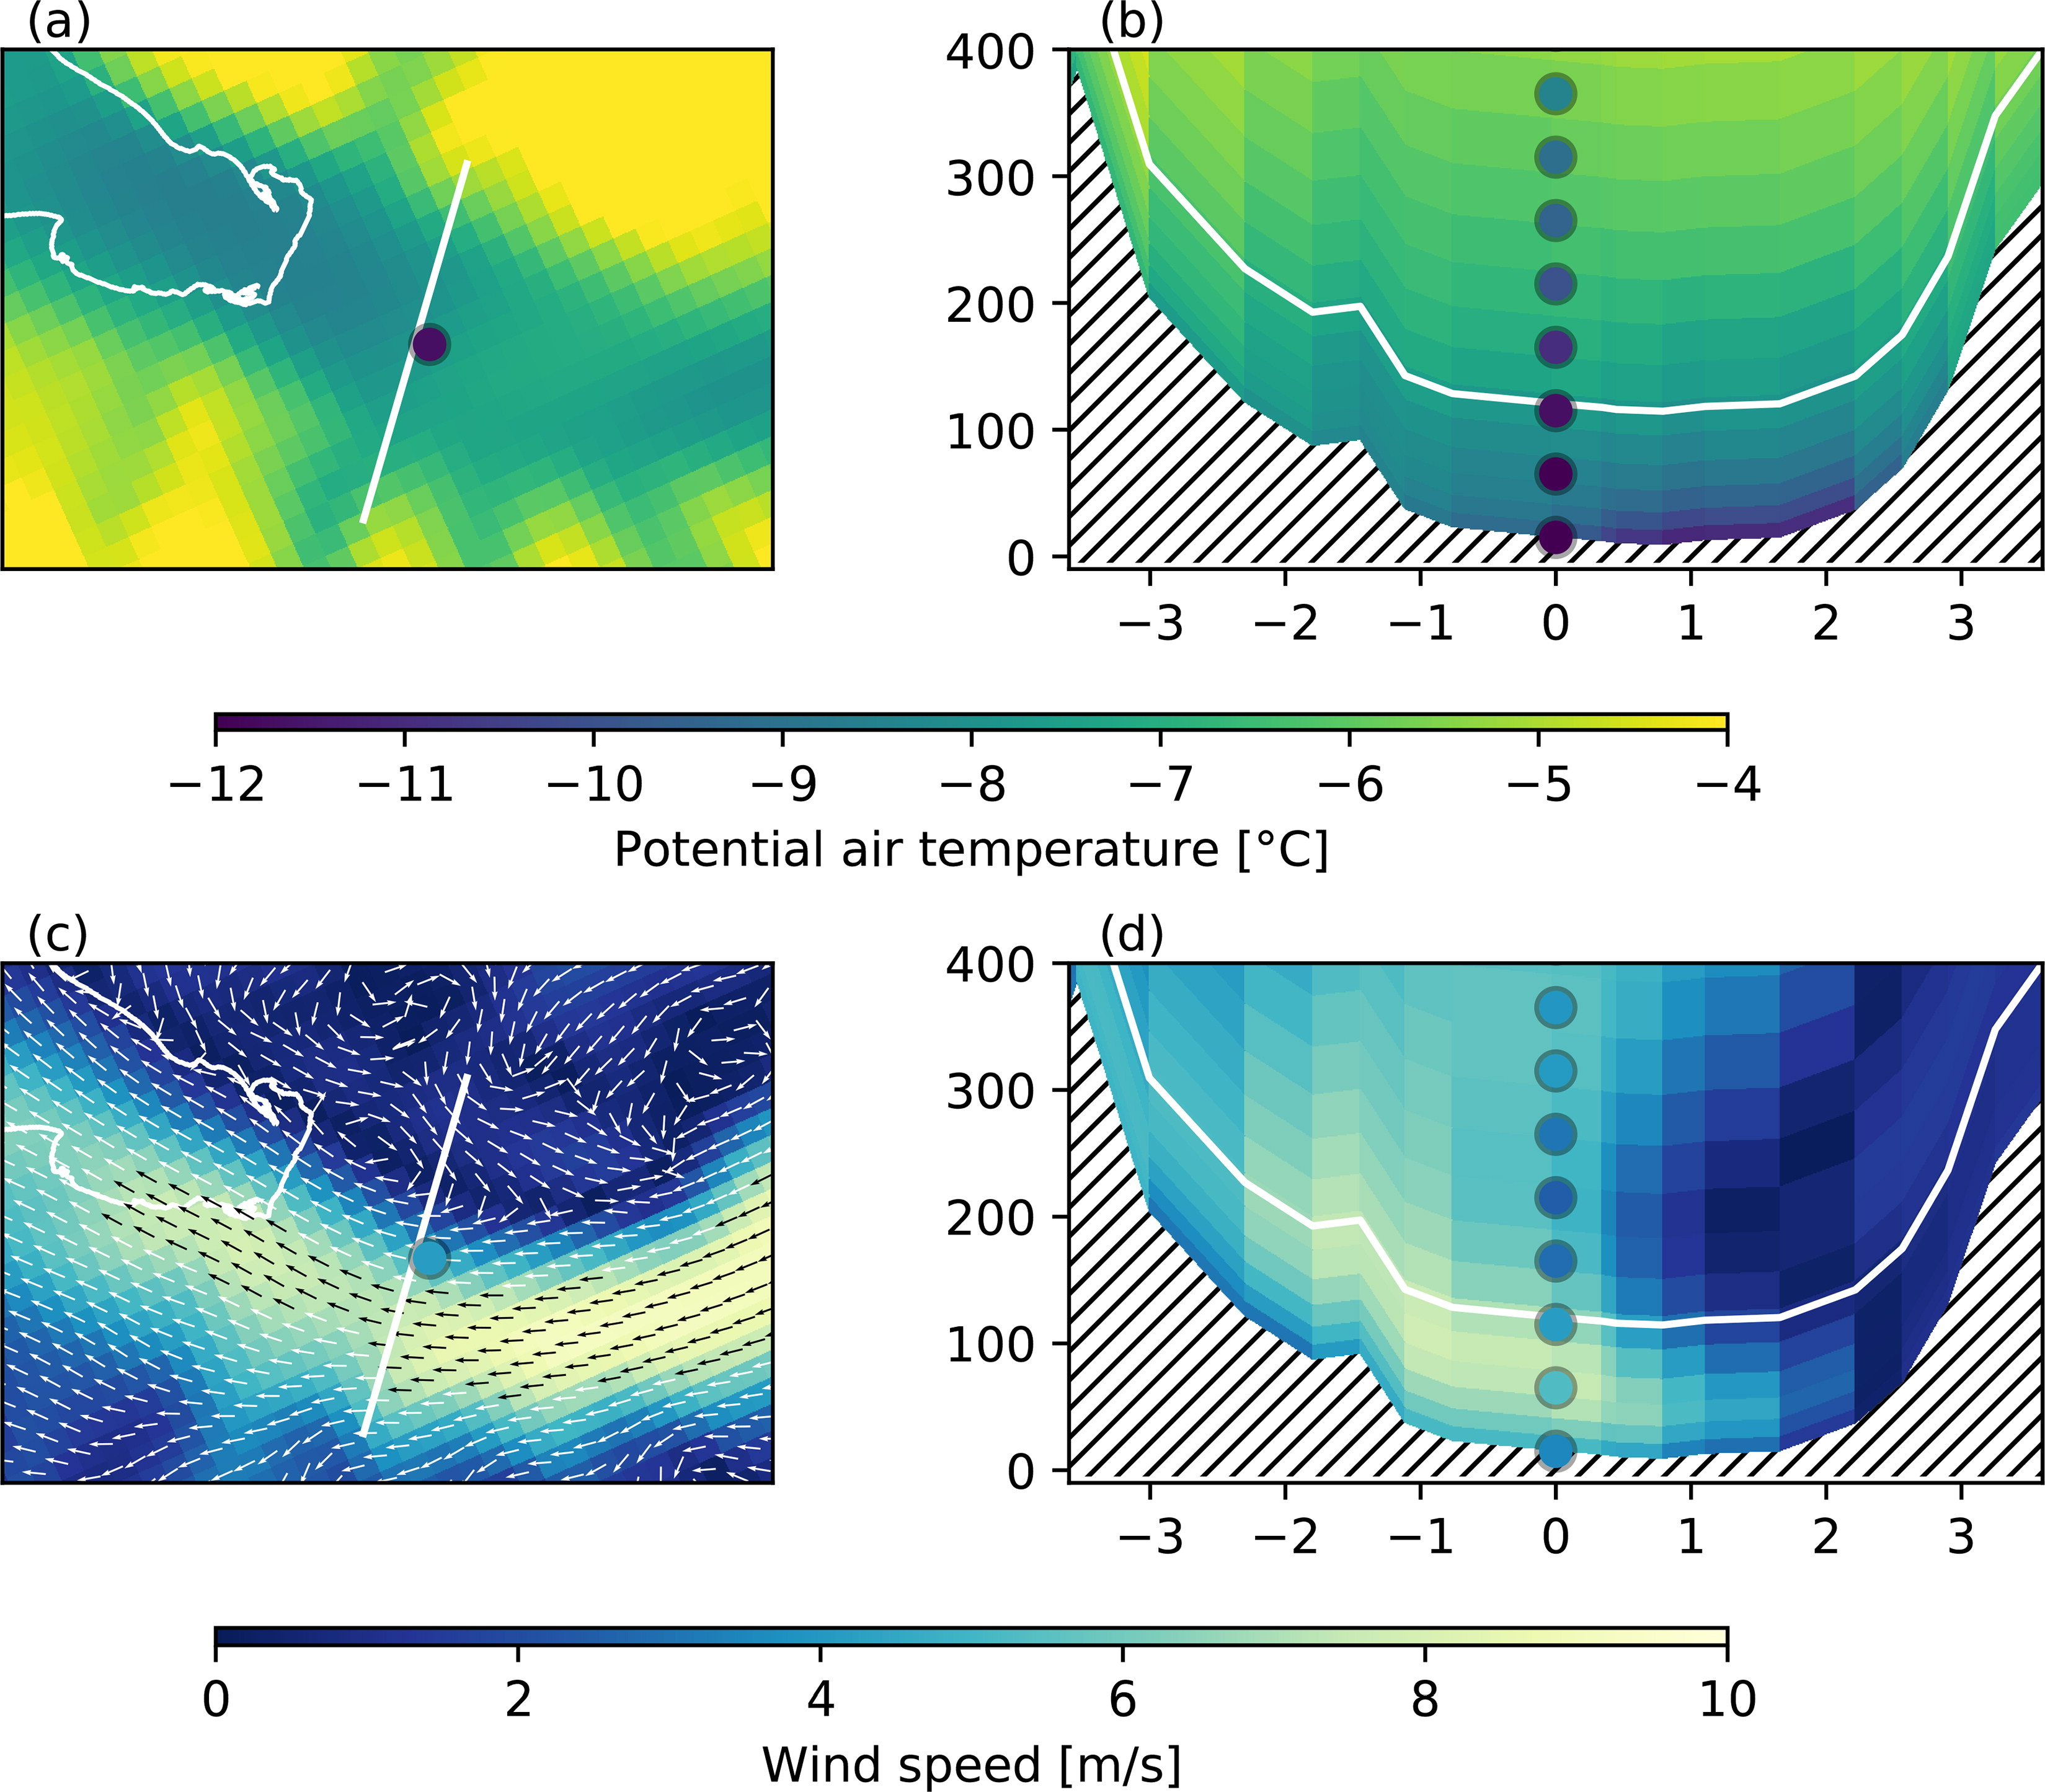
Fig. 13.
Vertical cross-section of the AS05 potential air temperature and wind speed compared to the mean profile from tethersonde soundings. The tethersonde data are from two profiles, each with two sensors, obtained on 16 February between 17:34 and 19:12 UTC. The model data are from 18:00 UTC. (a) Potential air temperature at 110 metre height above the model topography in AS05; (b) vertical cross-section of the potential air temperature in AS05 across the Adventdalen valley; (c) same as (a) but for wind speed; (d) same as (b) but for wind speed. Also on (a–d) observations from the tethersonde are shown with filled circles.