
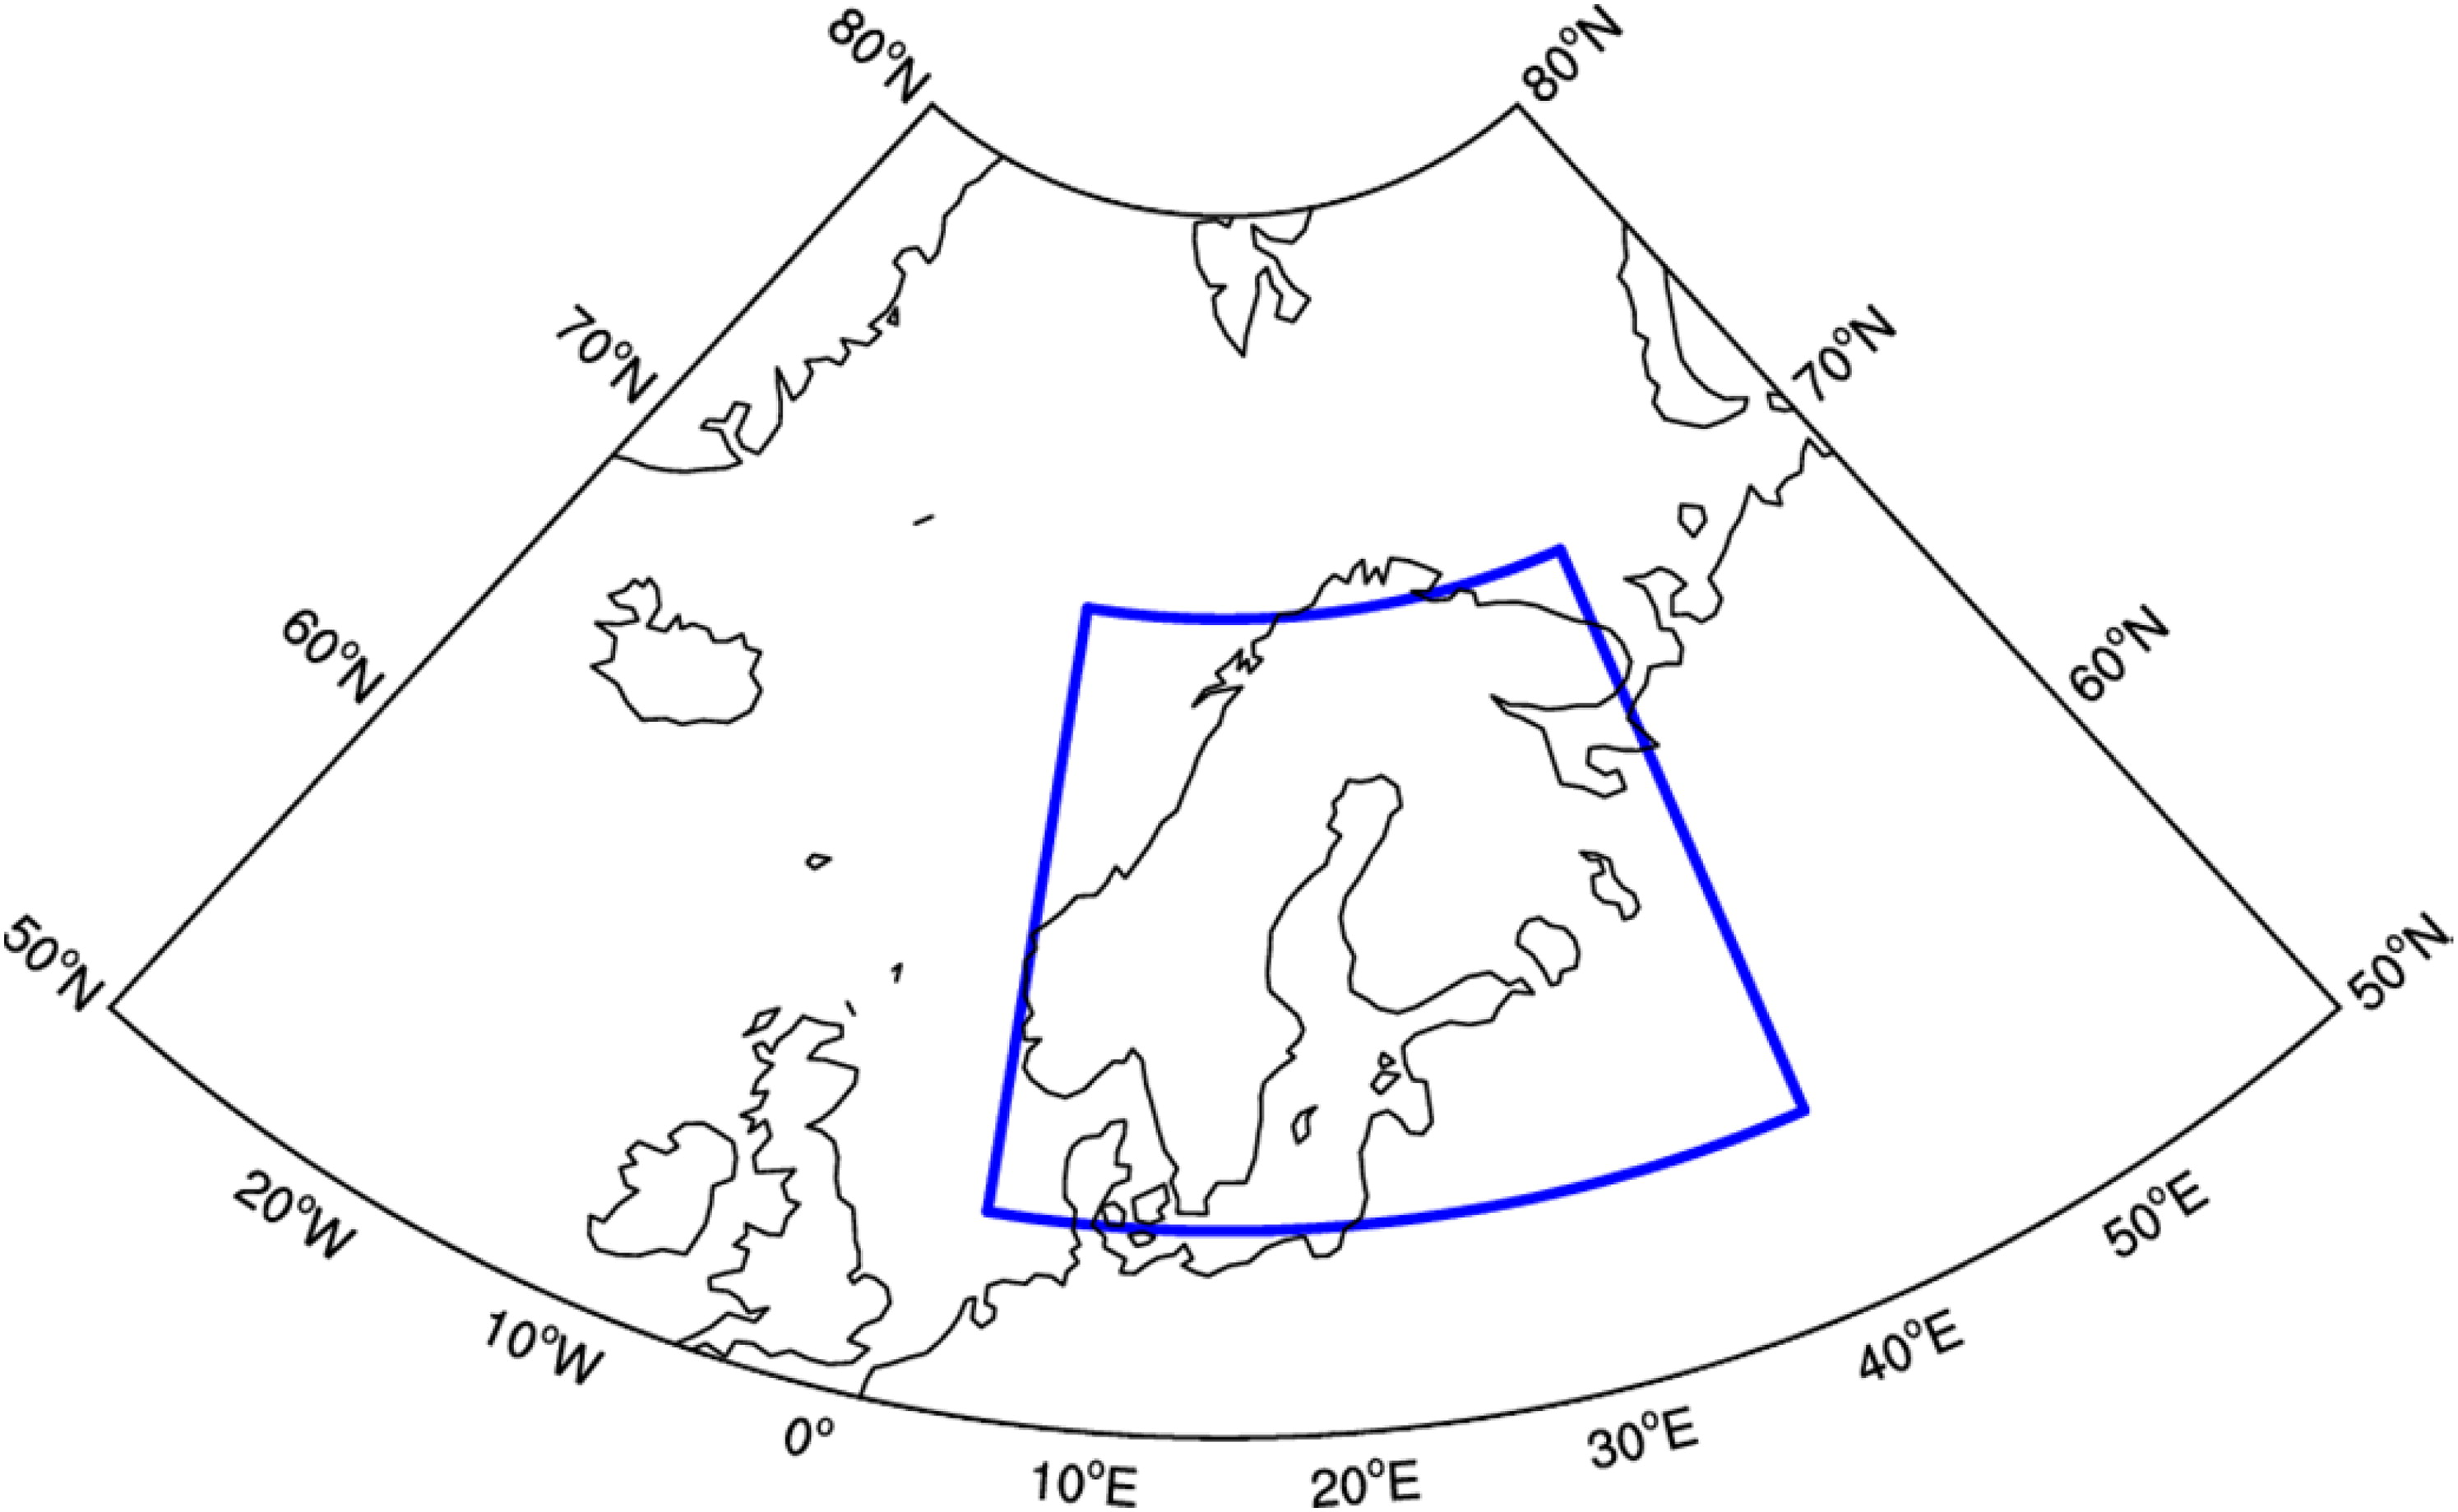
Fig. 1.
The studying area. The blue box indicates the region where widespread extreme events were identified.
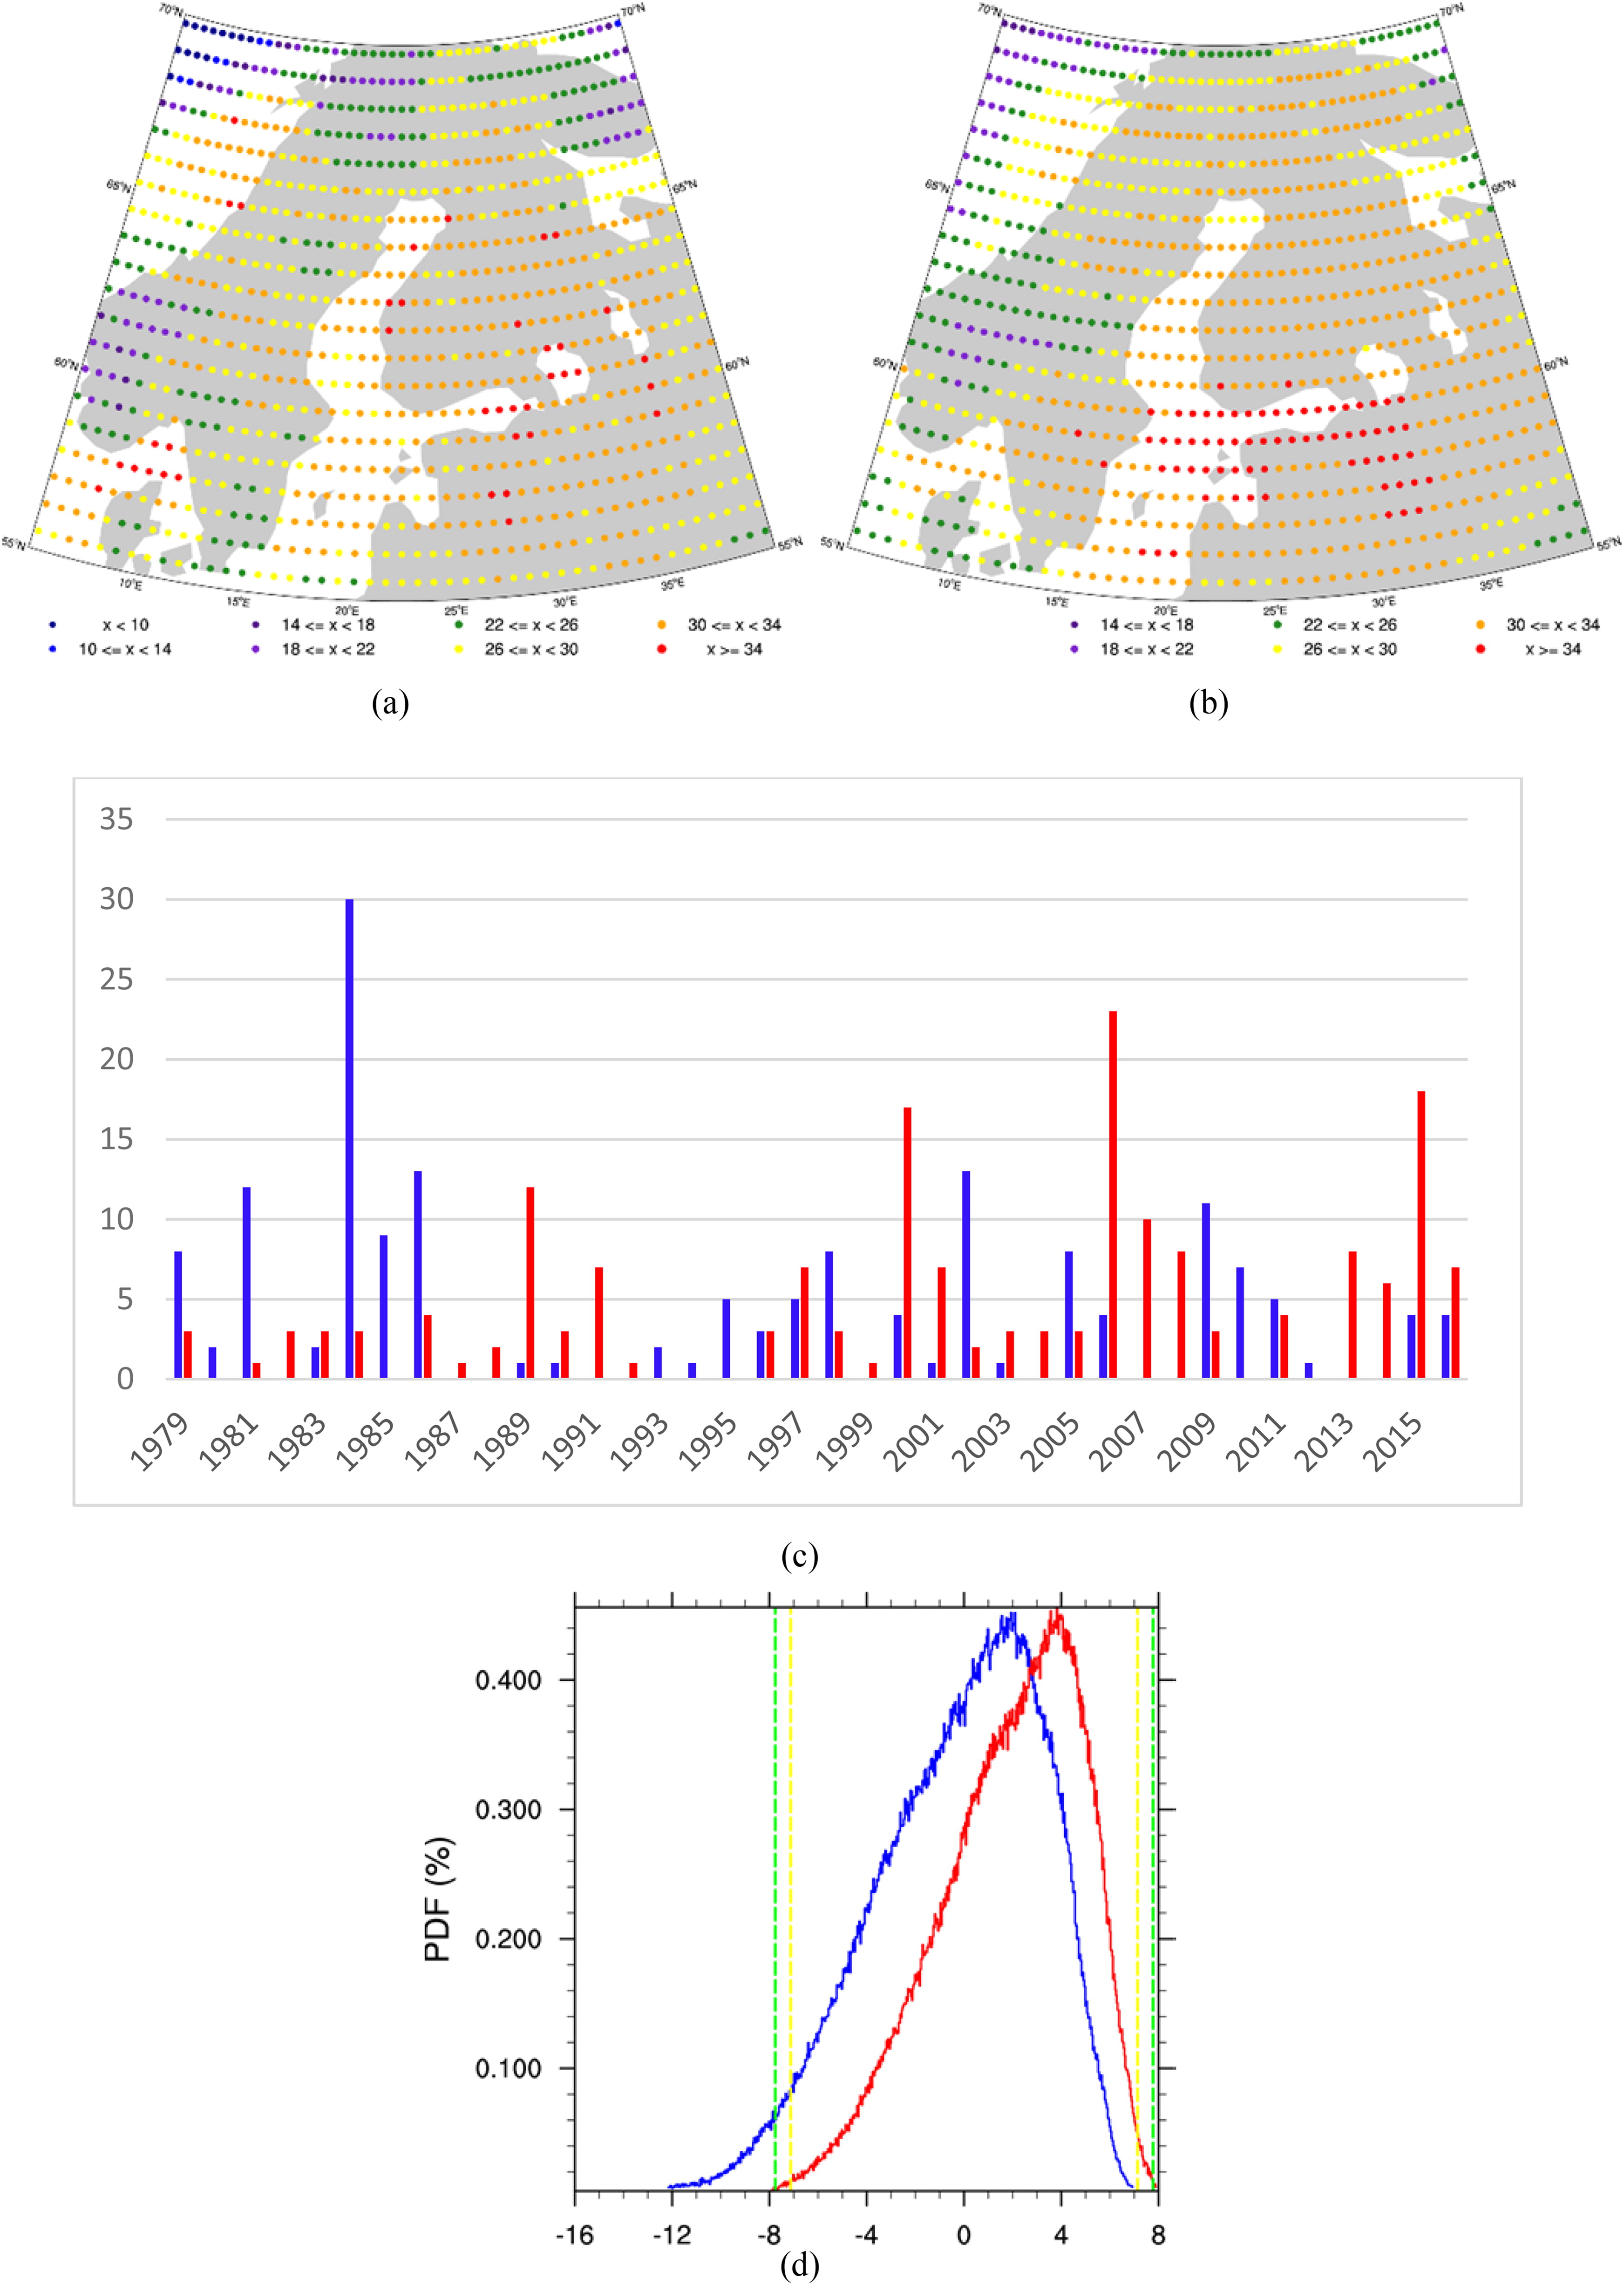
Fig. 2.
The total number of days of widespread (a) extremely cold and (b) extremely warm temperatures for each grid cell of the ERA-Interim reanalysis during 1979–2016, (c) the number of widespread extremely cold (blue bars) and warm (red bars) days per winter from 1979 to 2016 and (d) PDF of air temperature anomaly in the study area for 2006–2016 (red line) and 1979–1989 (blue line). The anomalies are calculated with respect to the reference period of 1981–2010. The dashed lines stand for quantiles of 95% and 99%.
Table 1.
The number of extreme days, single-day events, all multiday events and events lasting for four or more days.
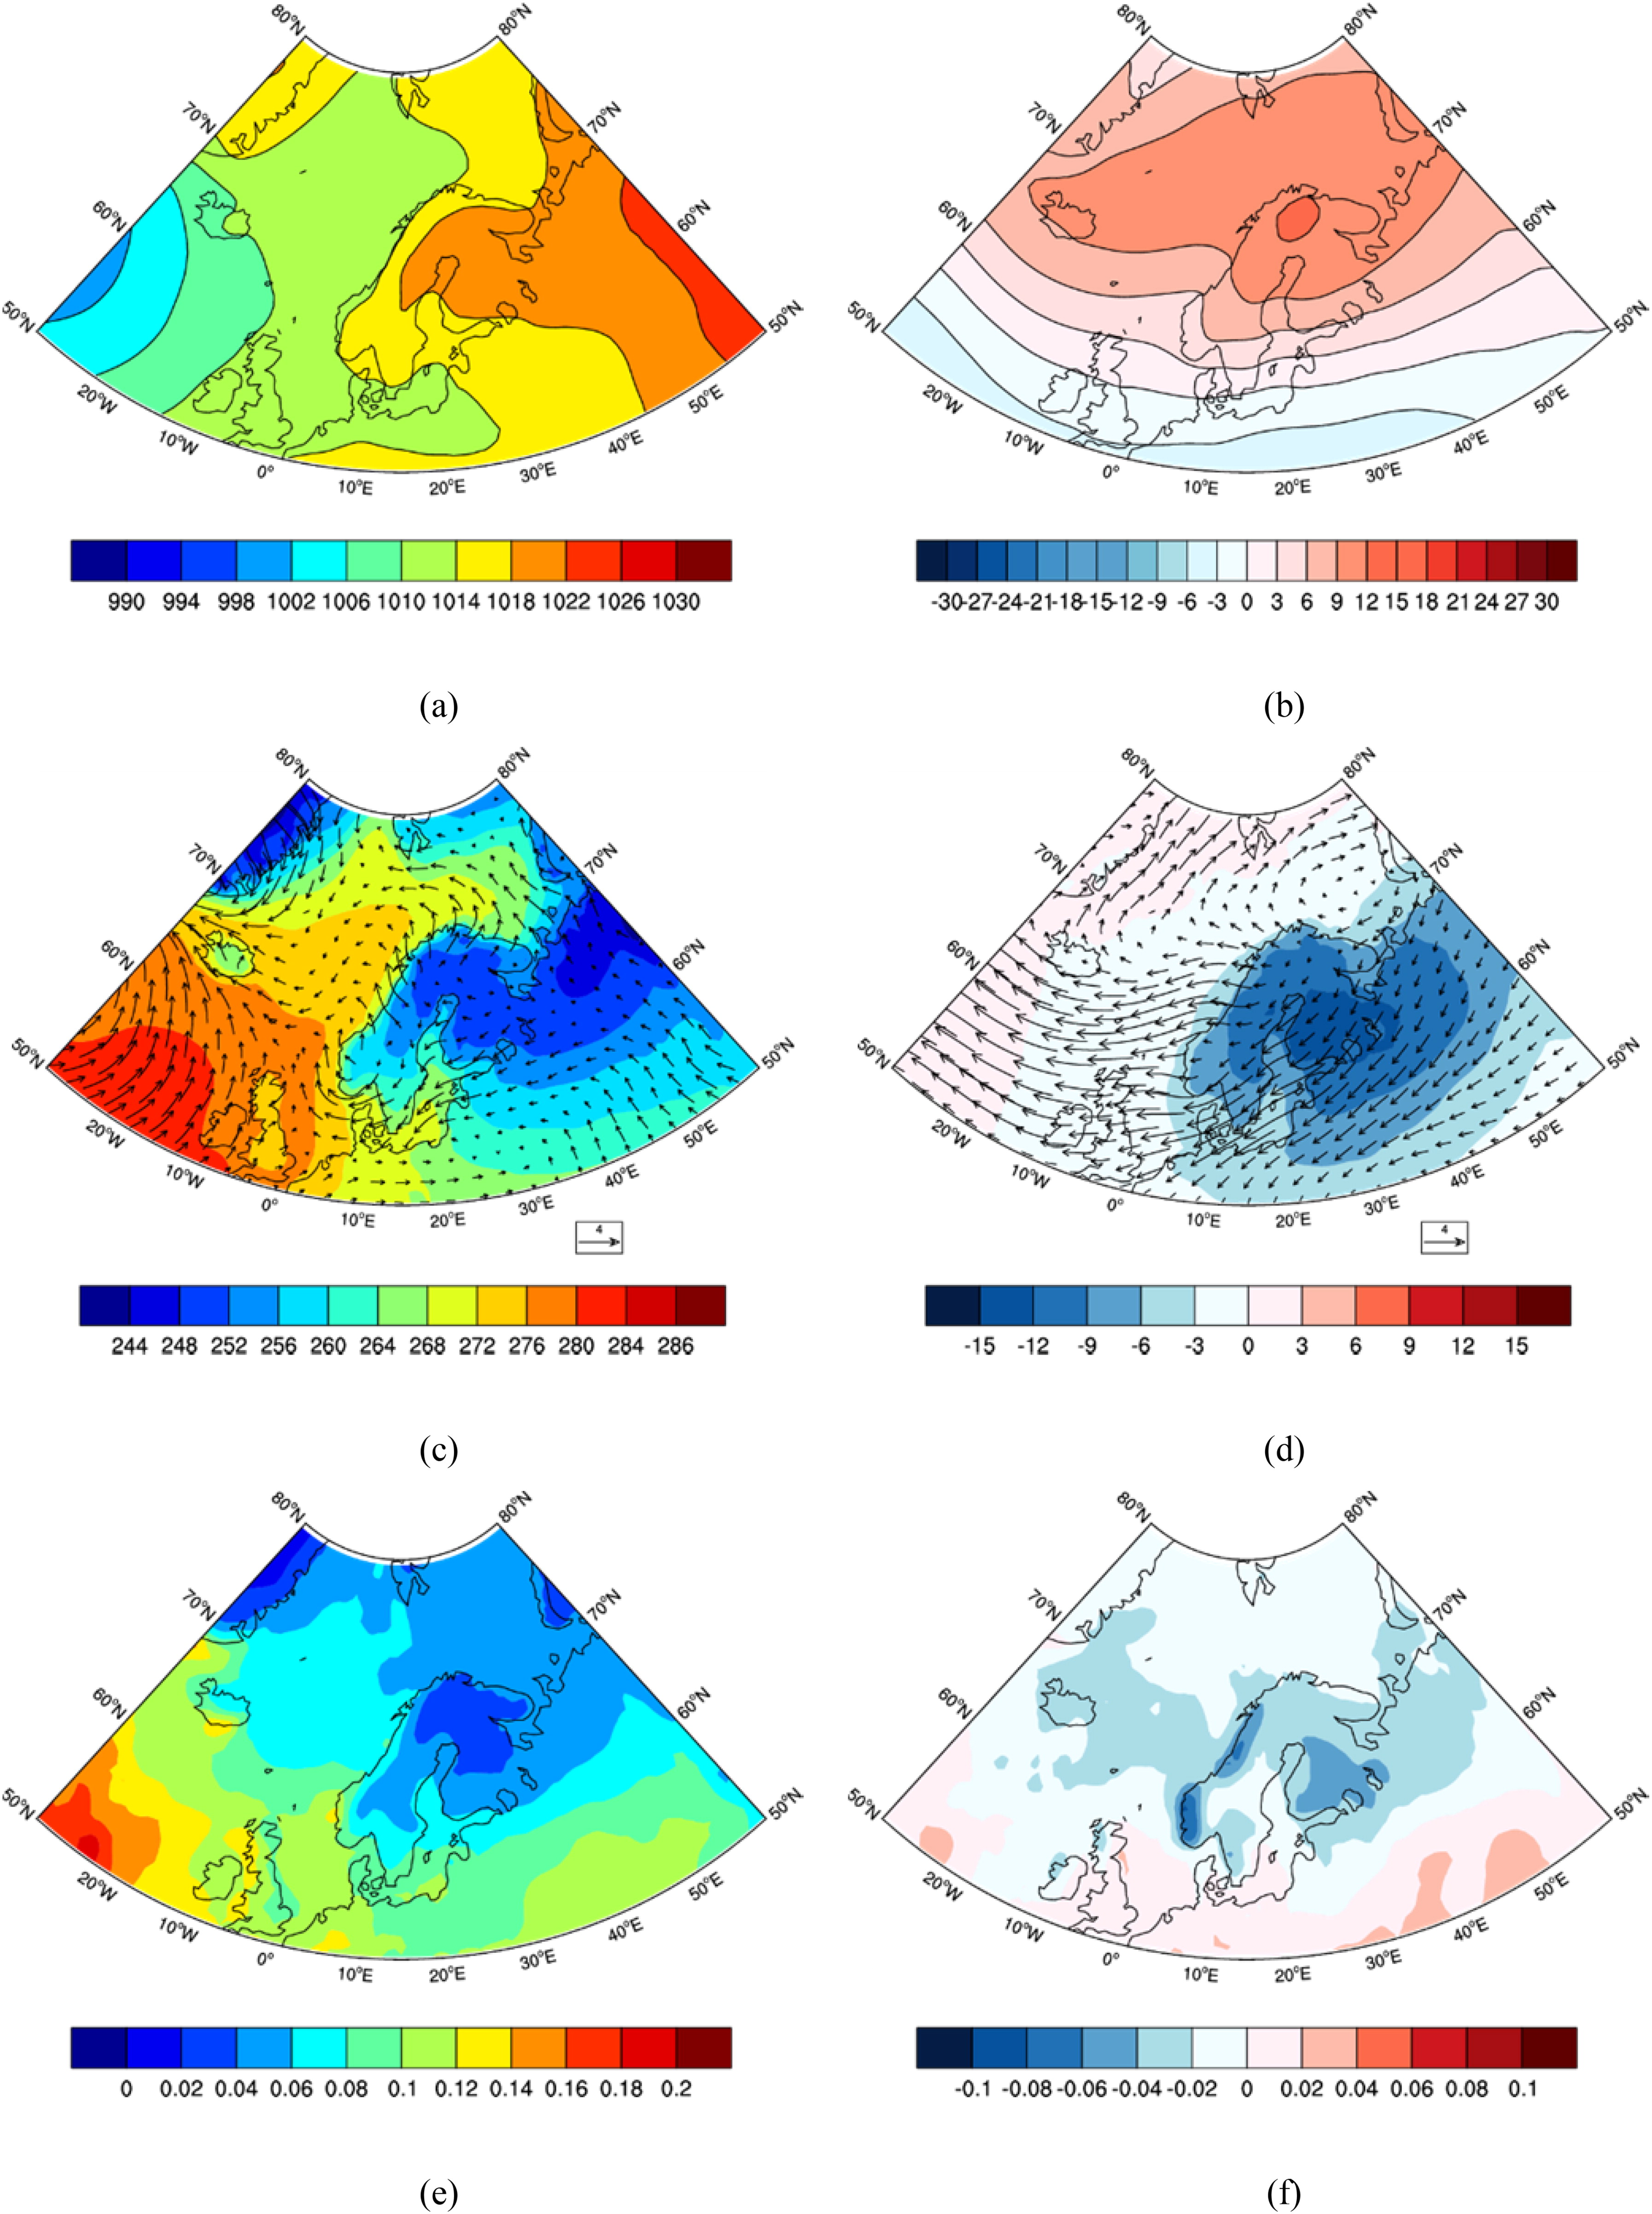
Fig. 3.
Composites for all widespread cold extreme days of sea level pressure (a), its anomaly (b), 2-m air temperature and 10-m wind vector (c), their anomalies (d), vertically integrated cloud condensate content (e) and its anomaly (f).The units are hPa, °C, m/s and kg/m2, respectively.
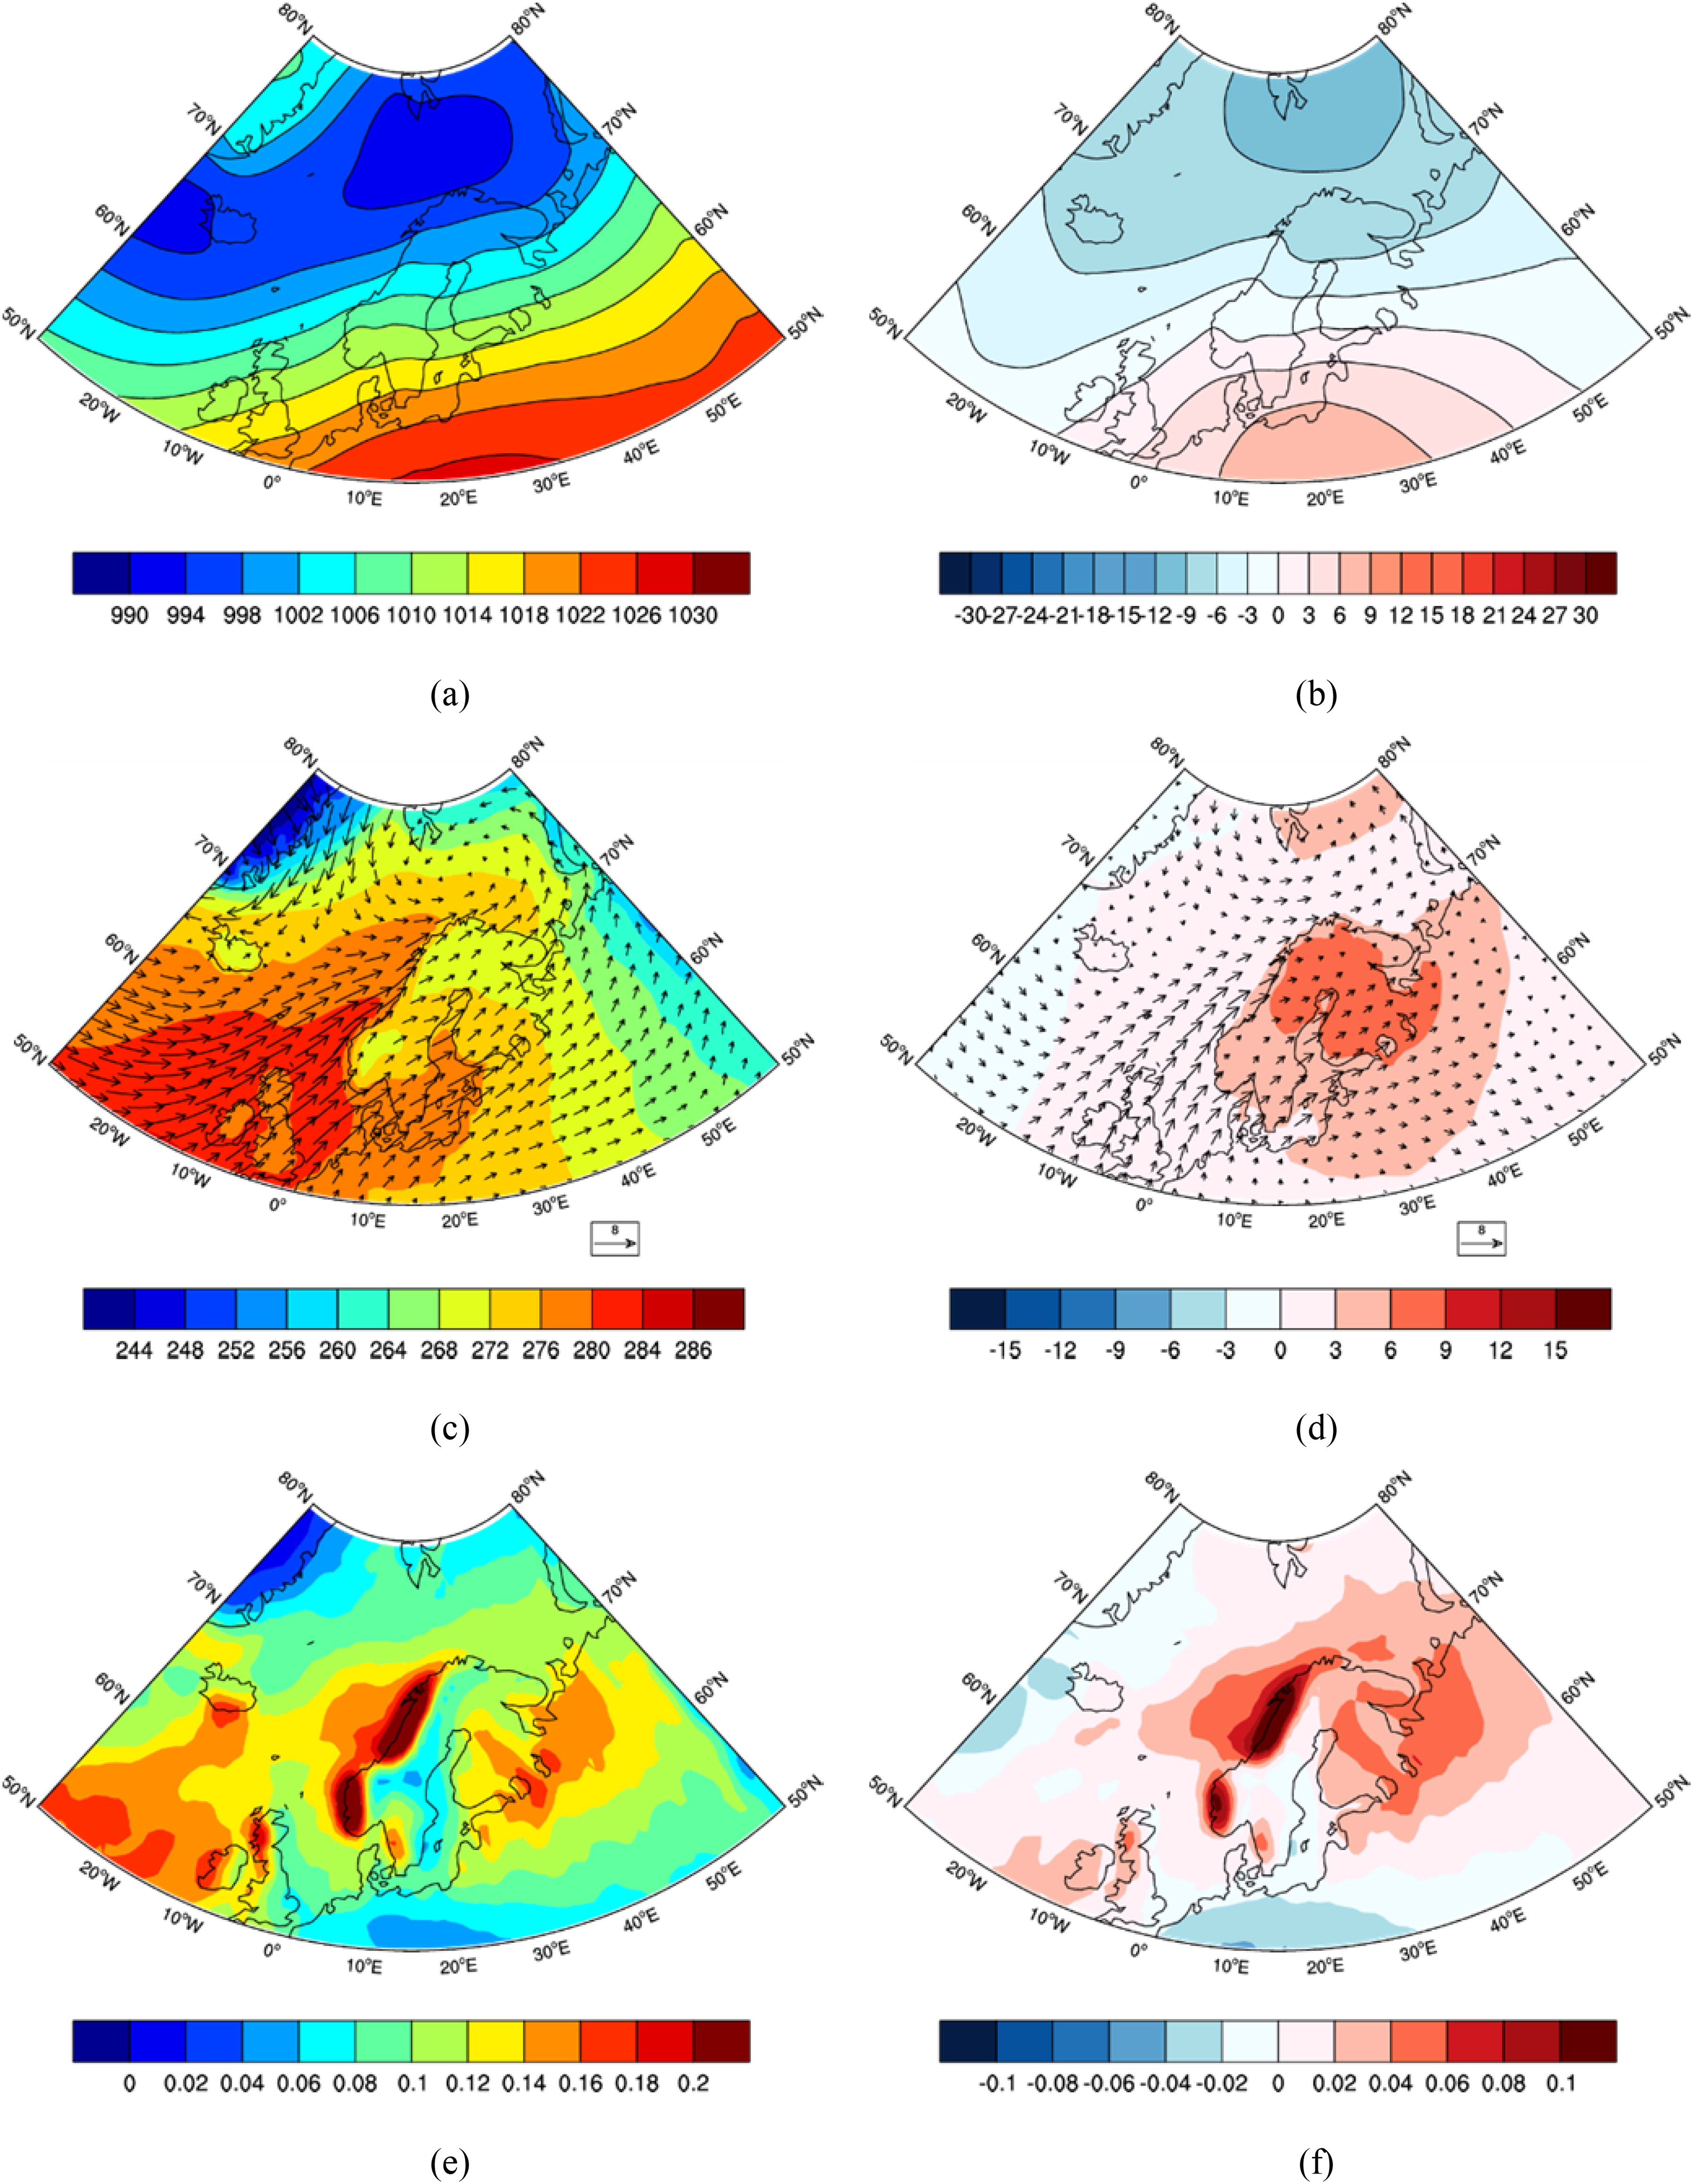
Fig. 4.
As Fig. 3 but for the composites for all widespread warm extreme days.
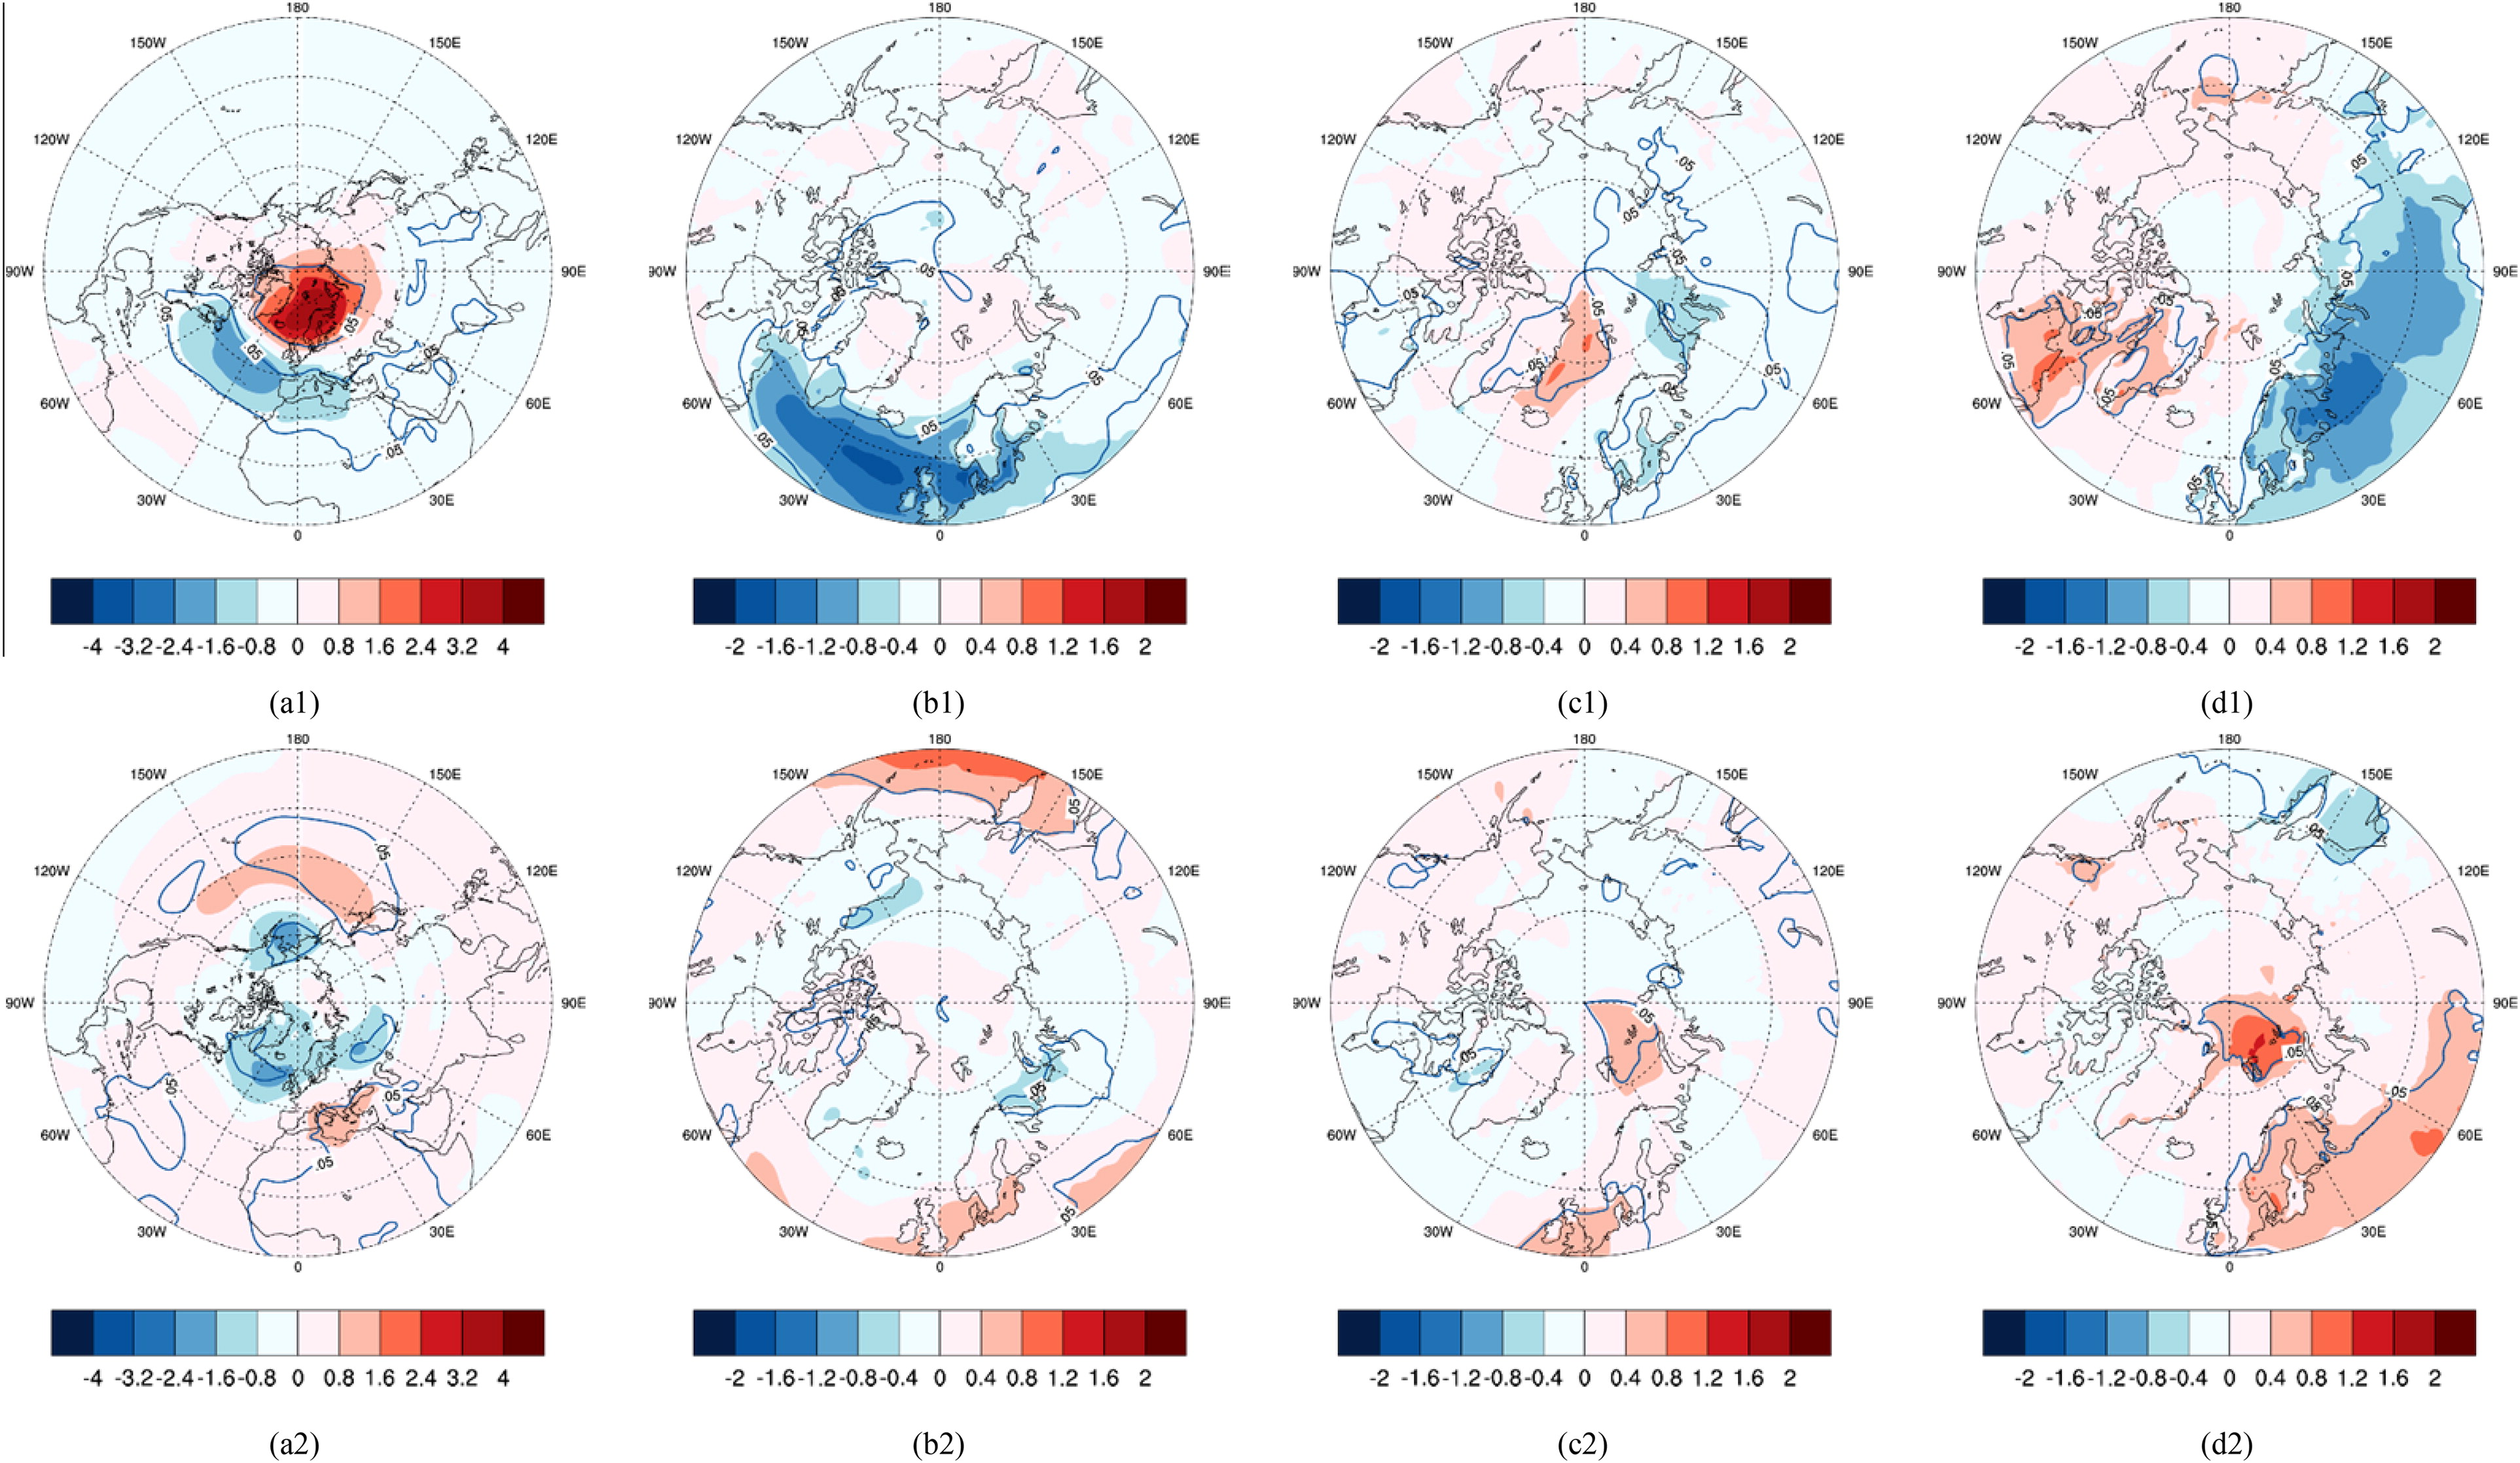
Fig. 5.
Regression maps of the sea level pressure (a1, a2), u10 (b1, b2), v10 (c1, c2) and downward longwave radiation (d1, d2) on the time series of the frequency of occurrence of extremely cold (upper row) and warm (lower row) events. The regions with blue line indicate results significant at 95% confidence level. The units are hPa, m/s, m/s and W/m2, respectively. The regression coefficients shown as colour codes were calculated on the basis of the linear equation: y = a x + b, where y is the frequency of occurrence of warm/cold extremes, x is the explaining variable and a is the regression coefficient.
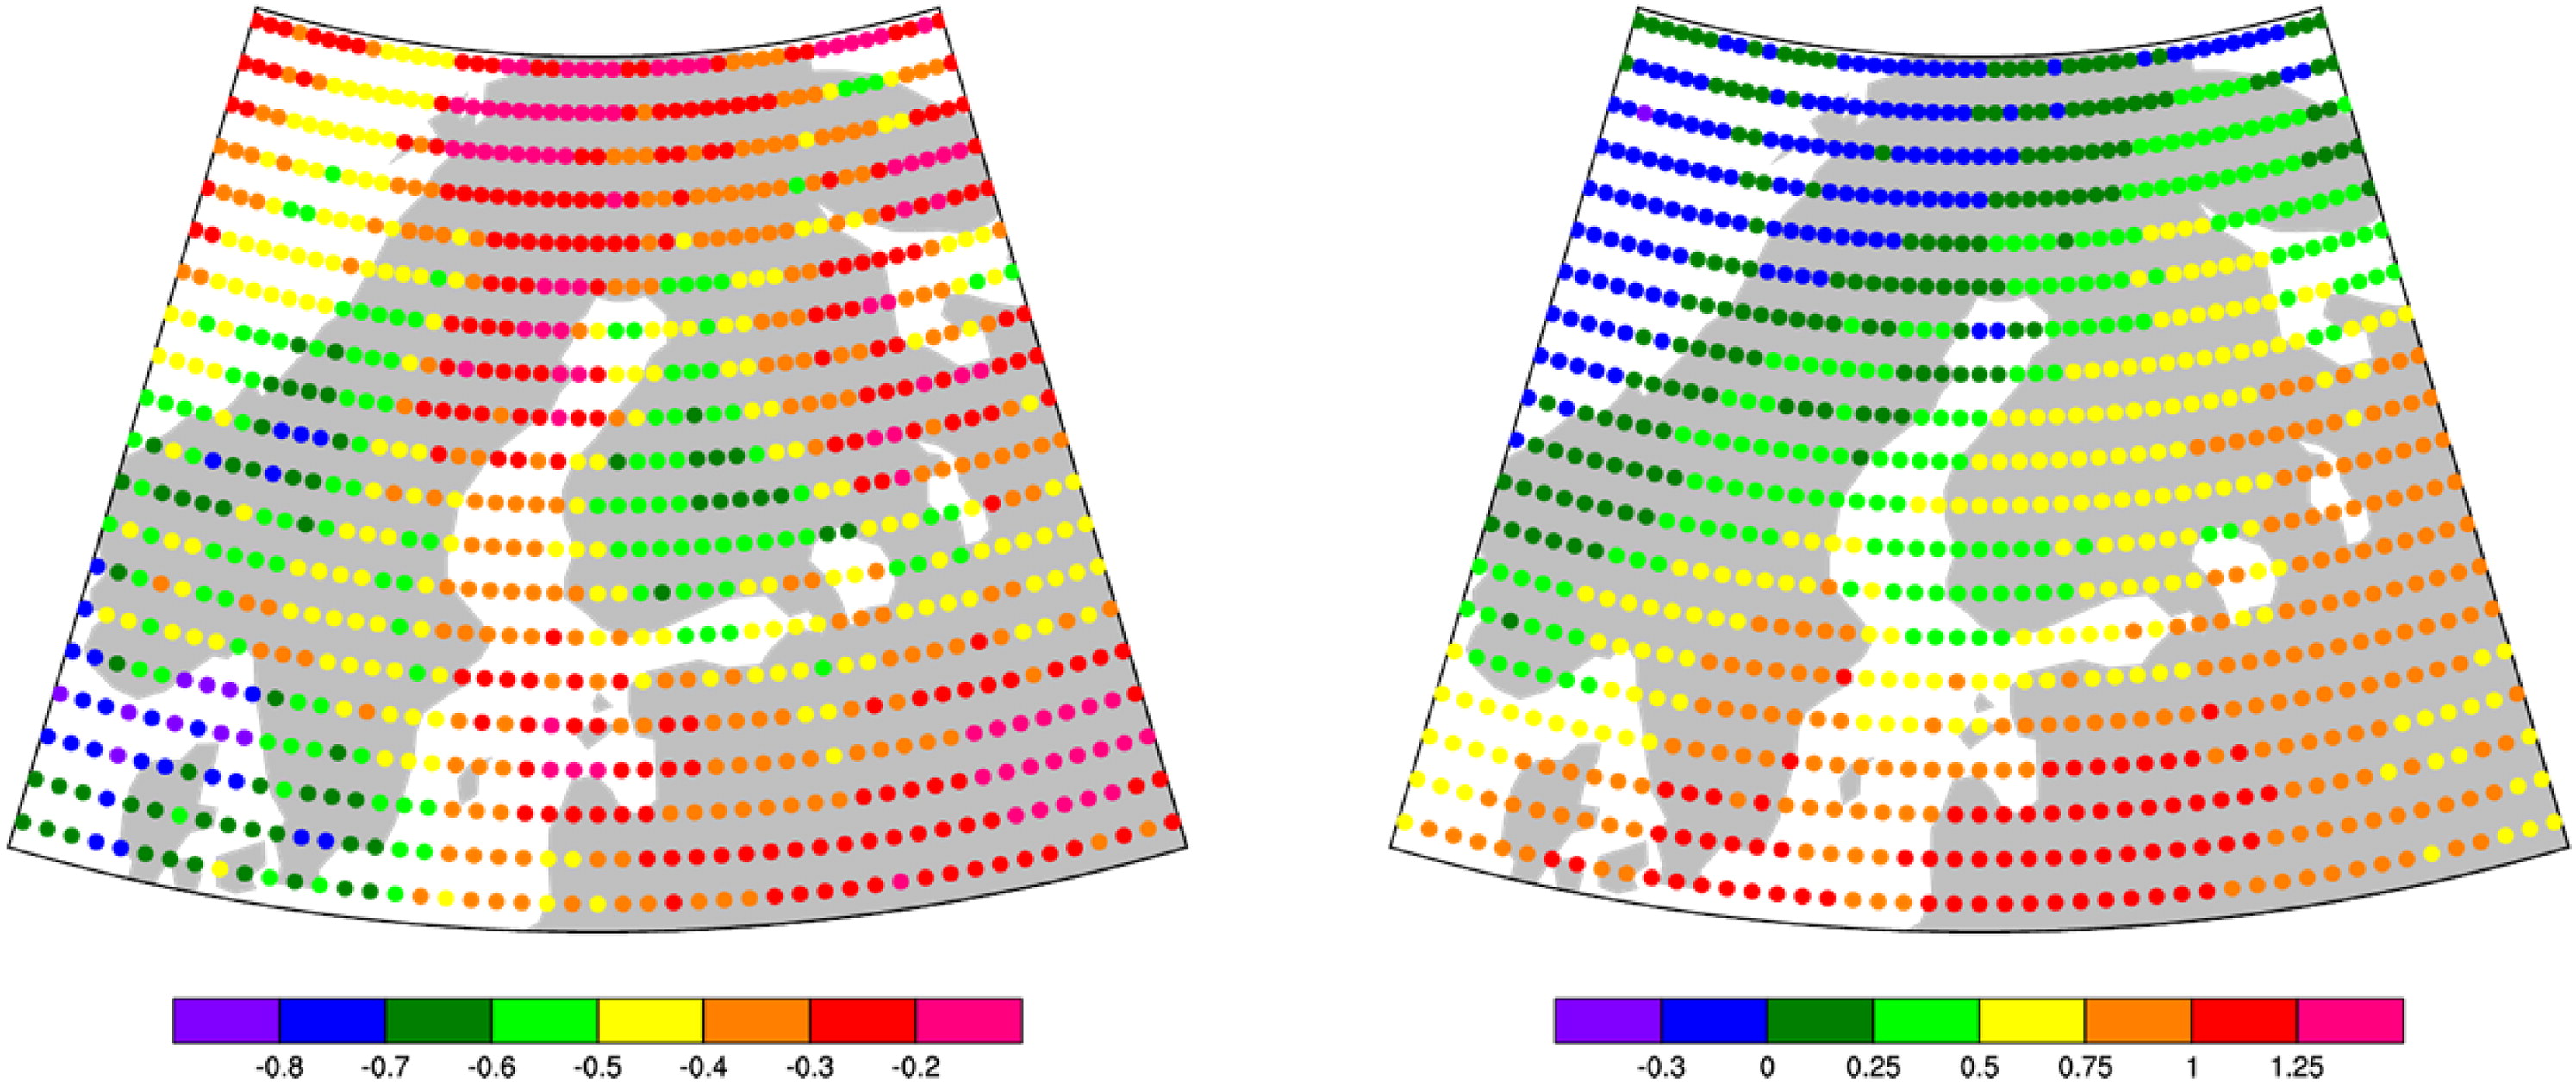
Fig. 6.
Mean values of NAO index averaged over days when extremely cold (left) and warm days (right) occurred in each grid cell of ERA-Interim reanalysis.
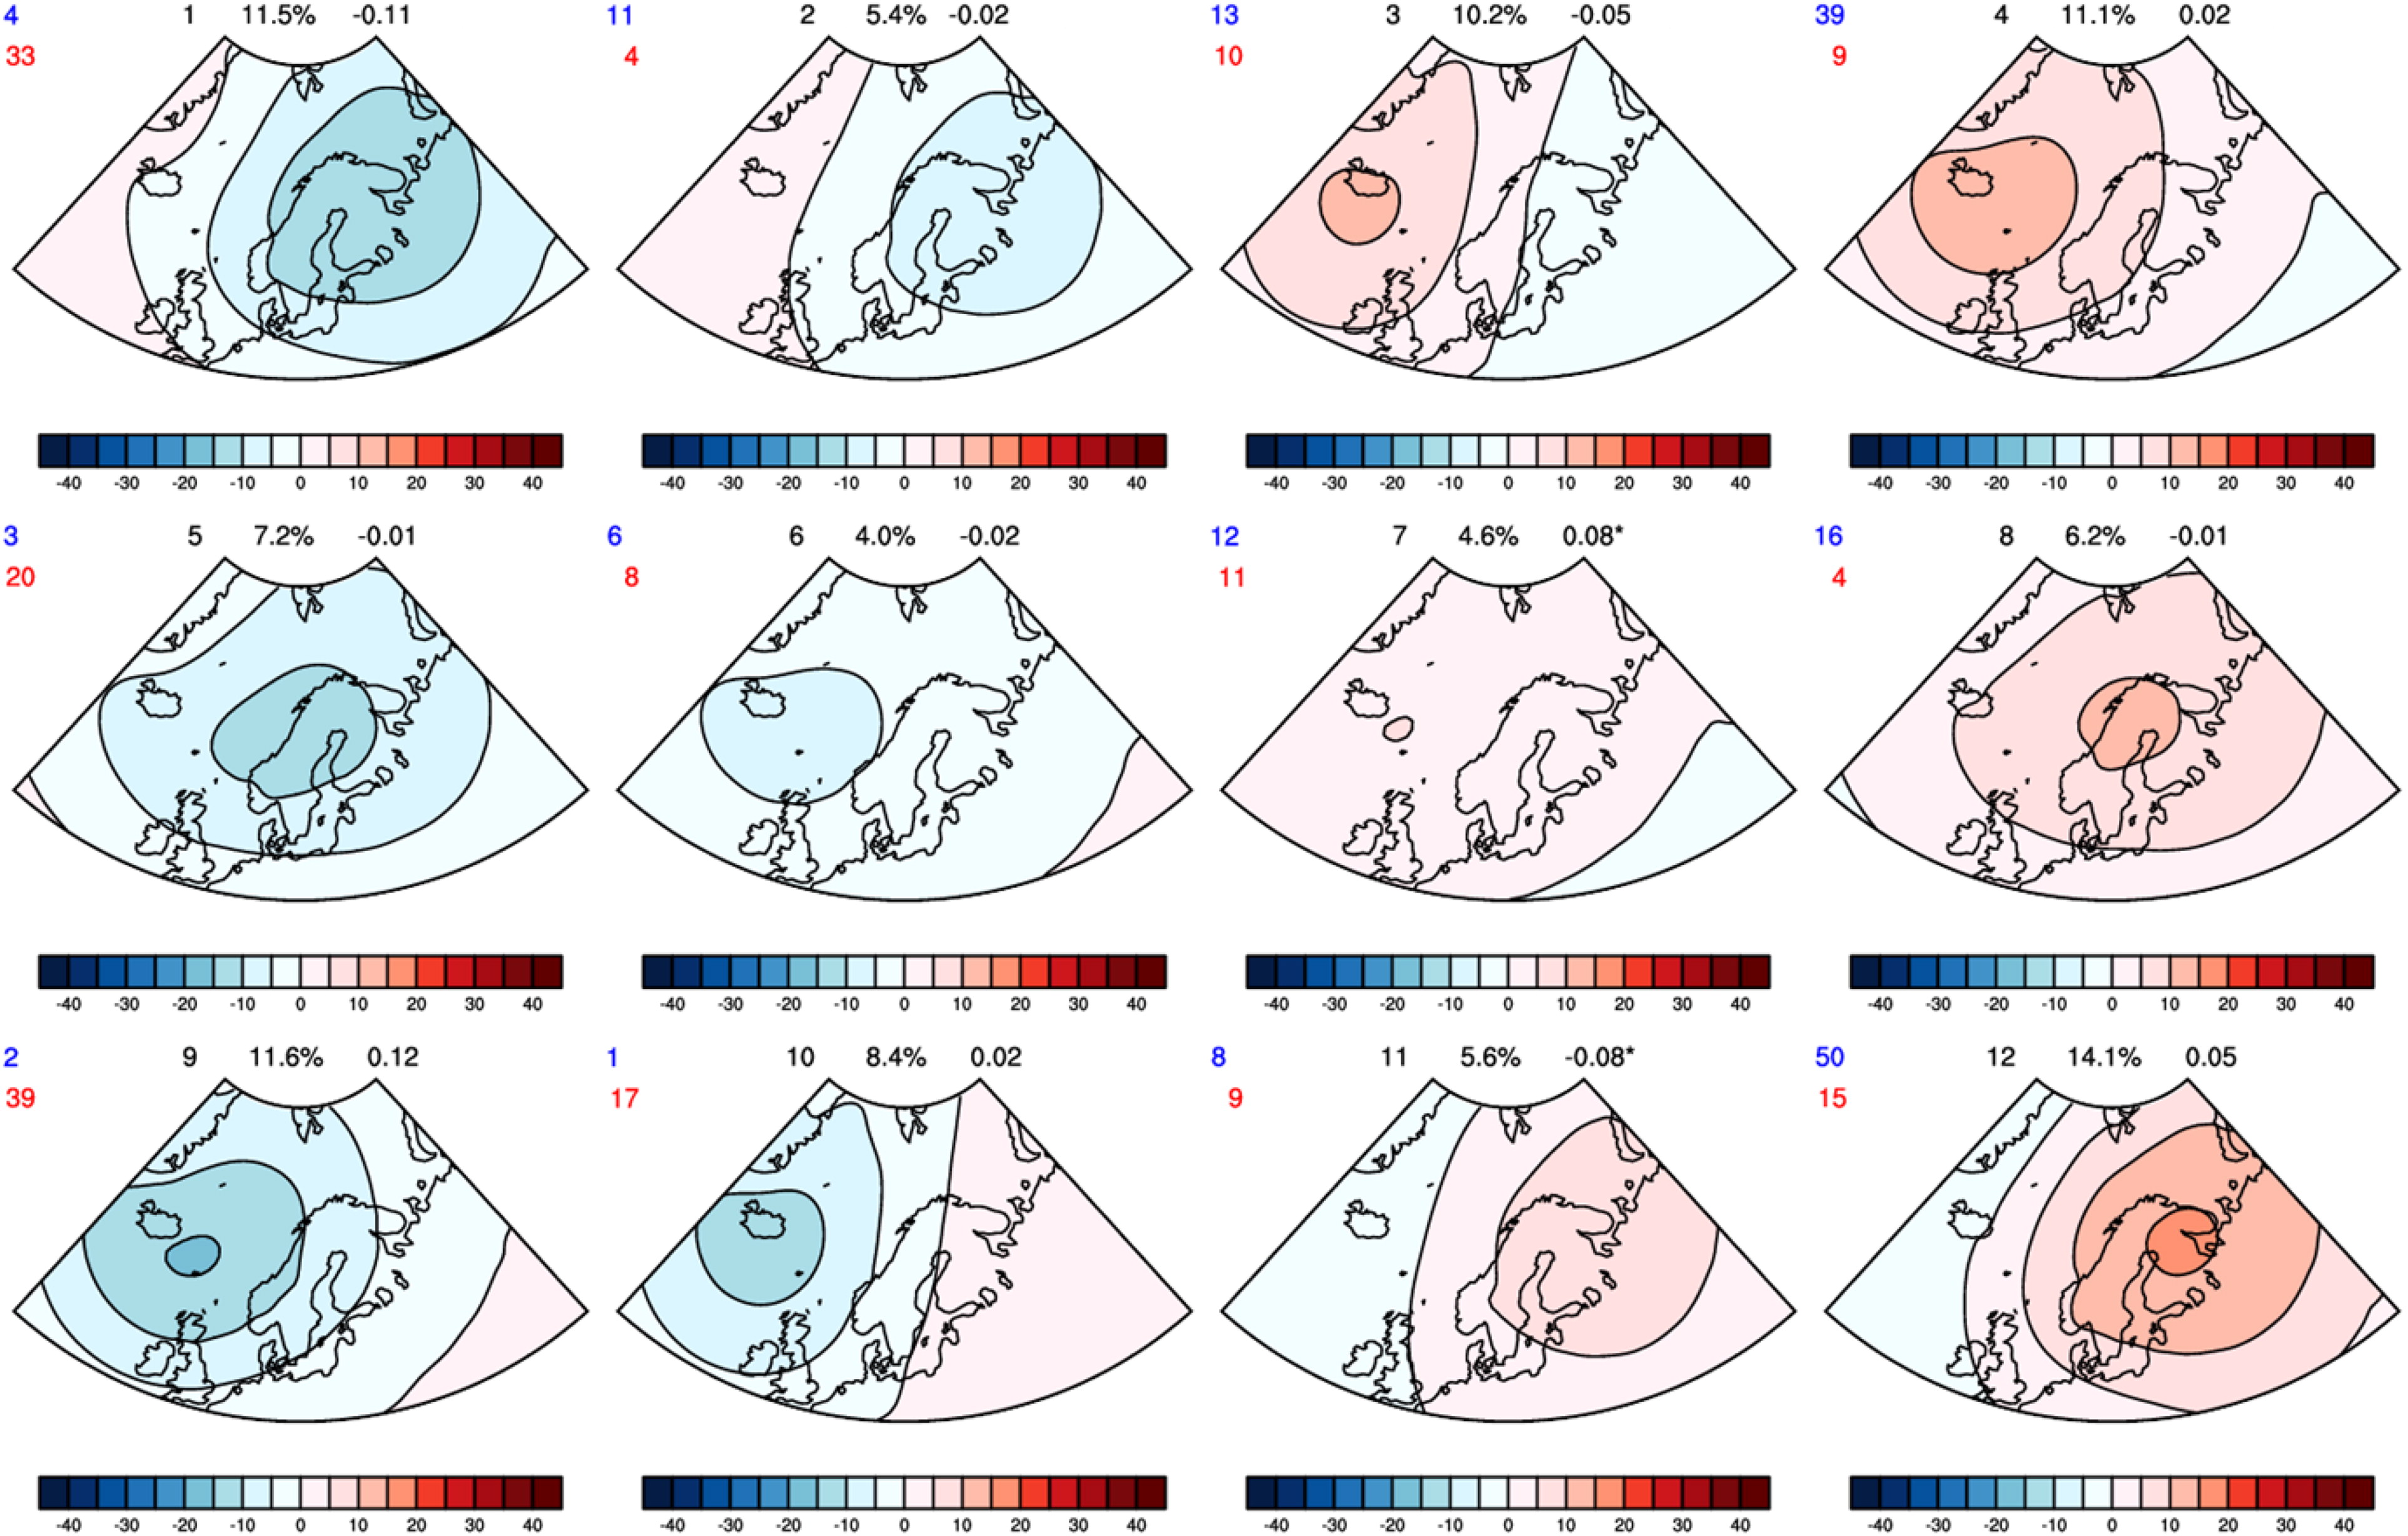
Fig. 7.
Self-Organizing Maps (SOM) for wintertime (DJF) SLP anomaly for the 1979–2016 period. The blue and red numbers in the upper left corner of each SOM node denote number of extremely cold (blue) and warm days (red) that have occurred for the node. The numbers on top of each node mark the number of the node (1 to 12), its relative frequency of occurrence (in %) and the trend of the frequency of occurrence (day/yr). An asterisk (*) after the trend indicates results significant at 95% confidence level.
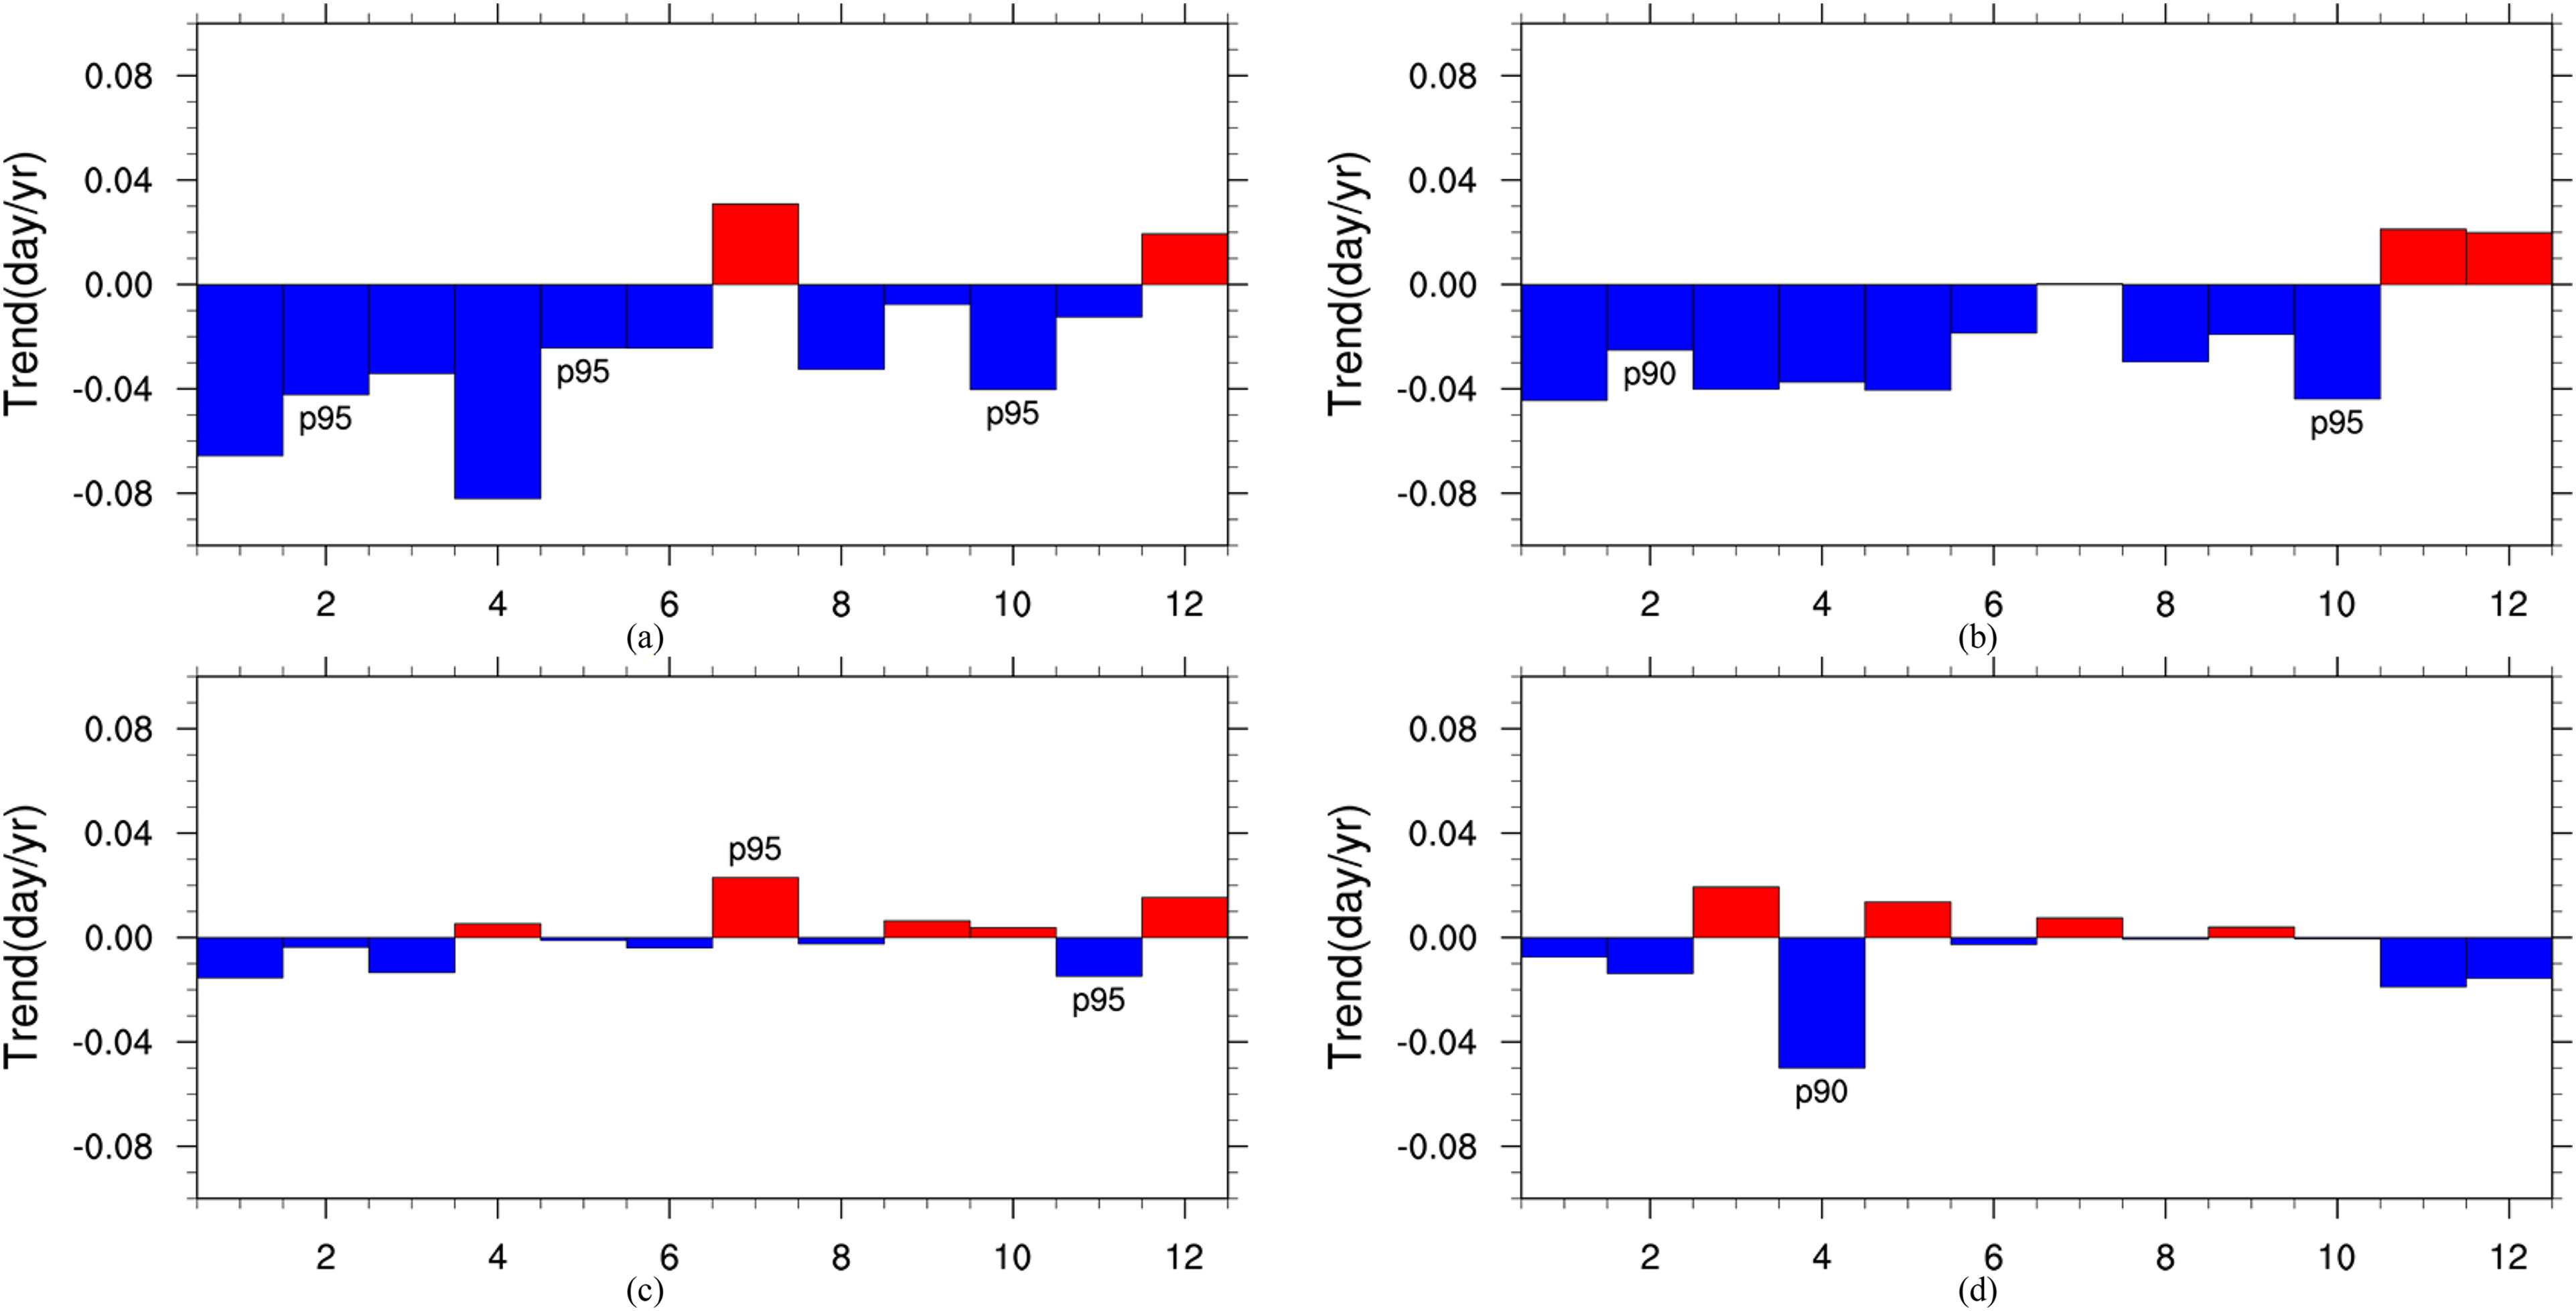
Fig. 8.
The trend (day/yr) in the frequency of occurrence of extremely cold days for each SOM node during 1979–2016: (a) total trend, (b) thermodynamic contribution to the trend, (c) dynamic contribution and (d) interaction contribution. The number p95 (p90) indicate results significant at 95% (90%) confidence level.
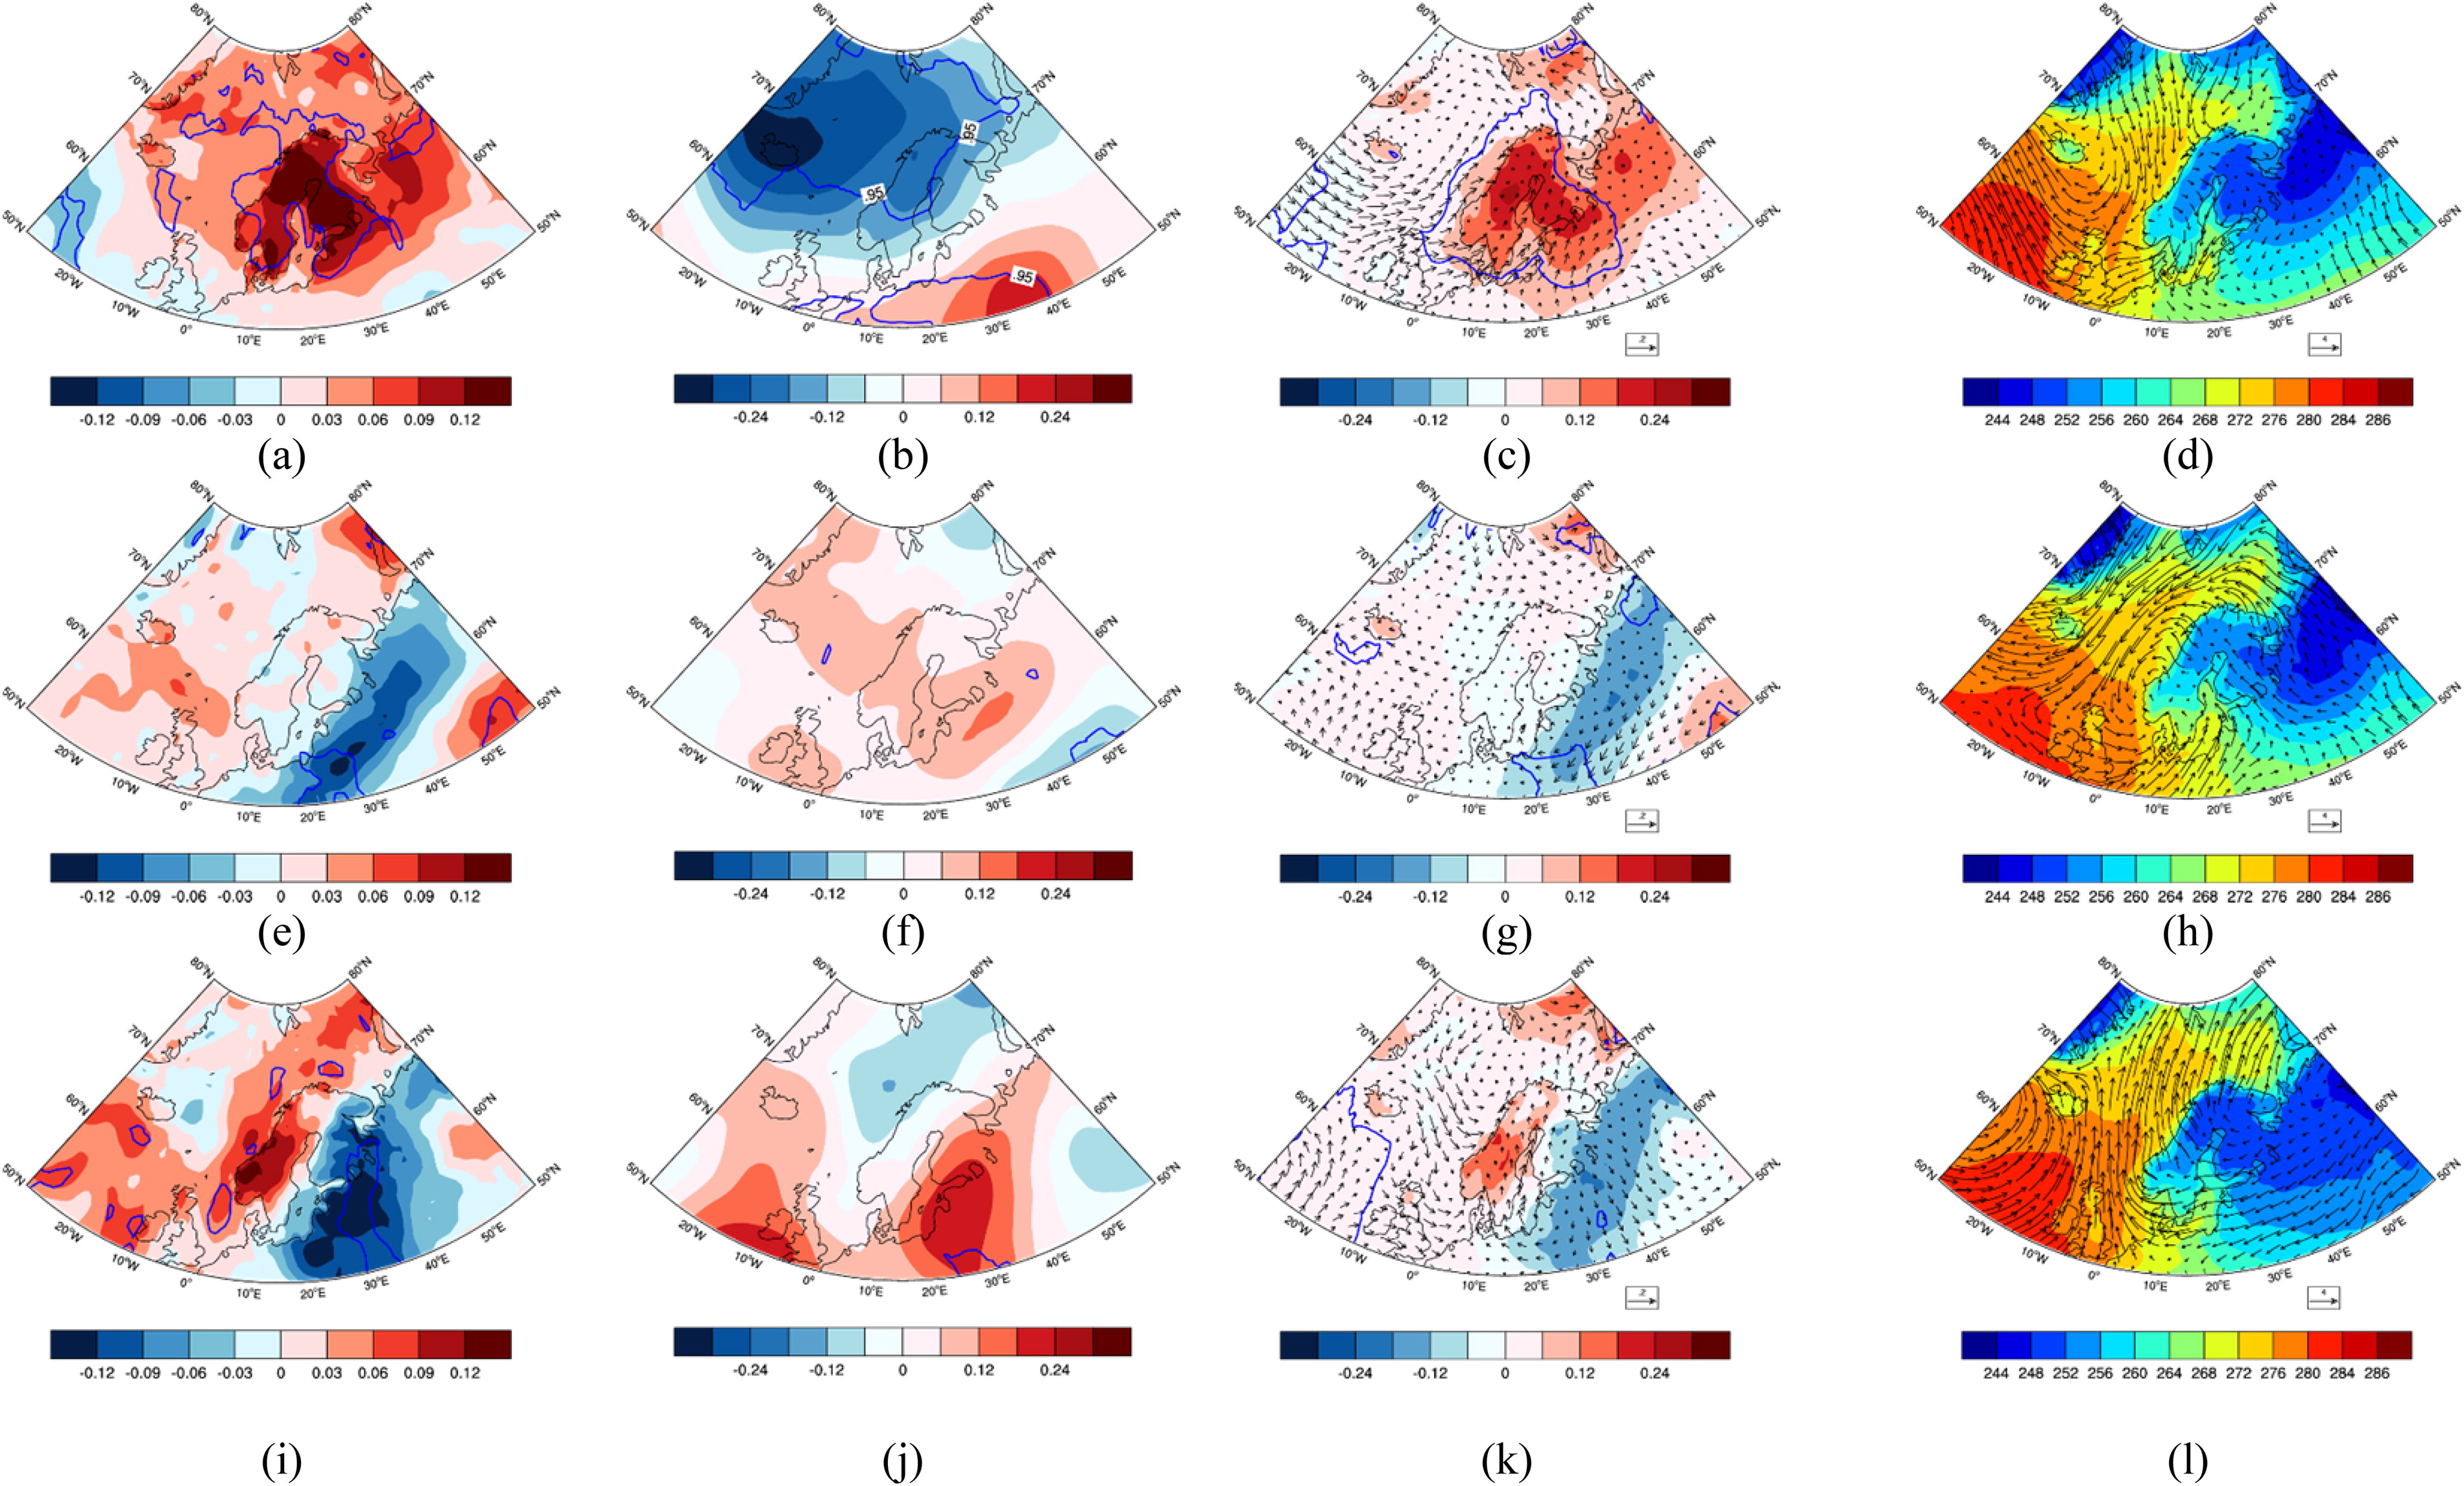
Fig. 9.
The trends of the downward longwave radiation anomaly (first column), sea level pressure anomaly (second column), 2-m air temperature and 10-m wind anomalies (third column) and the composites of 2-m air temperature and 10-m wind in extremely cold cases of node 4 (uppermost row), node 7 (middle row) and node 12 (lowermost row). The regions surrounded by a blue curve indicate results significant at 95% confidence level.
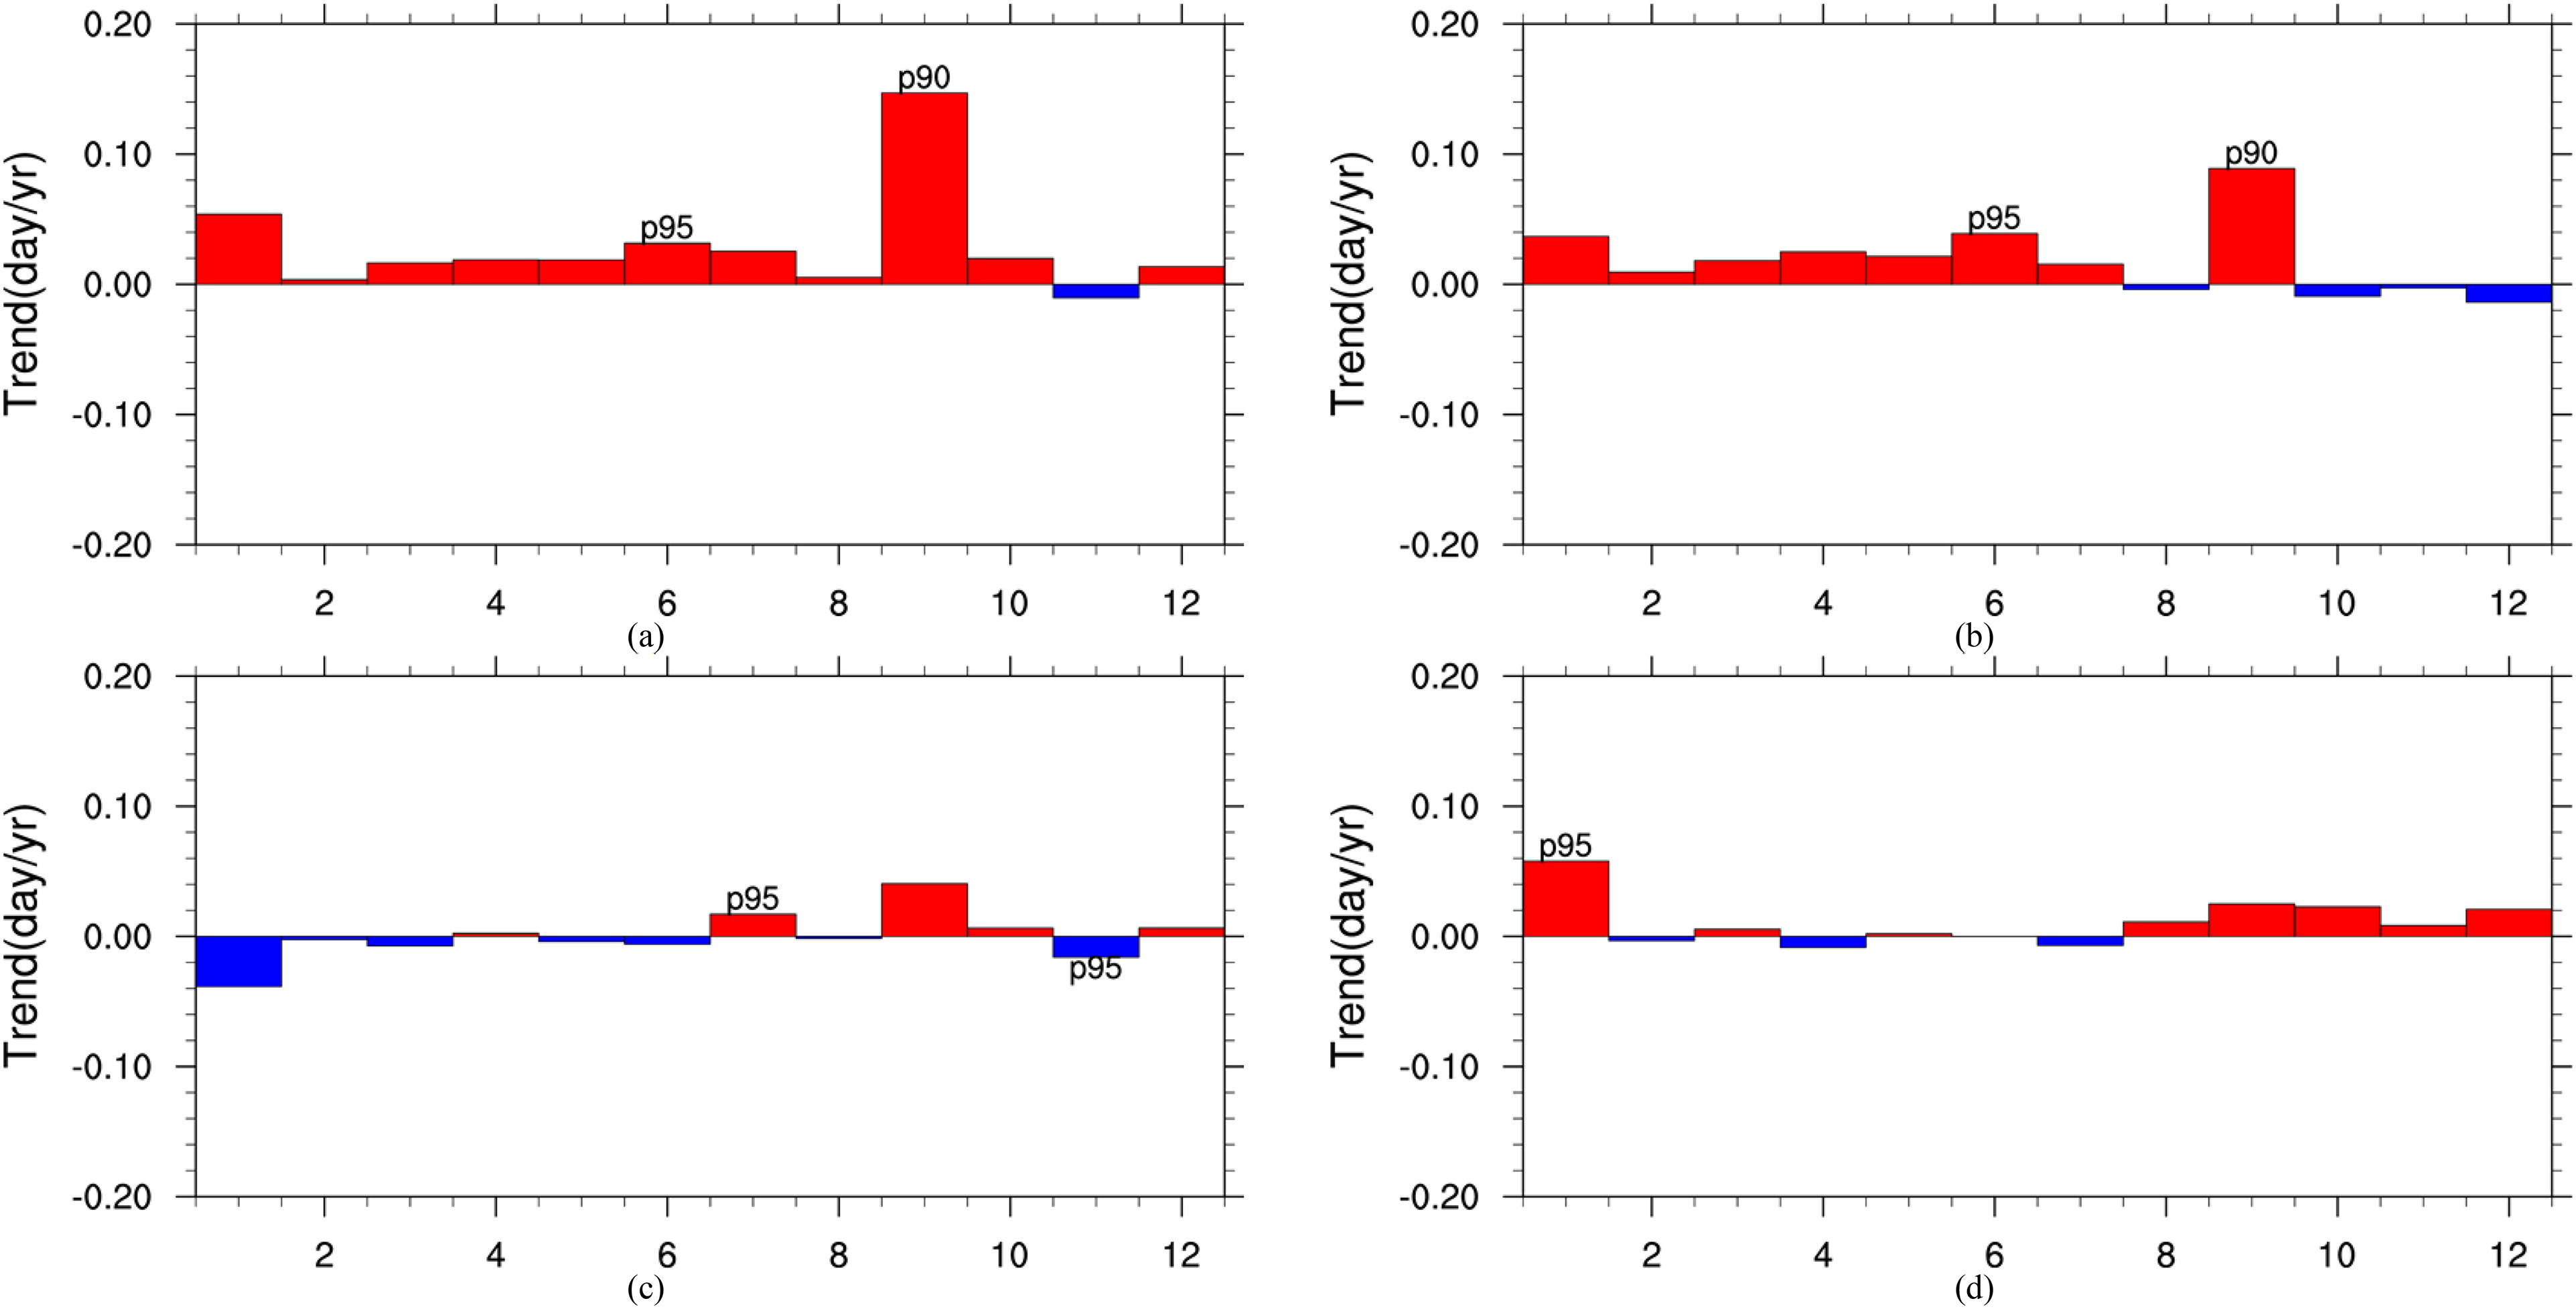
Fig. 10.
As Fig. 8, but for the extremely warm days.
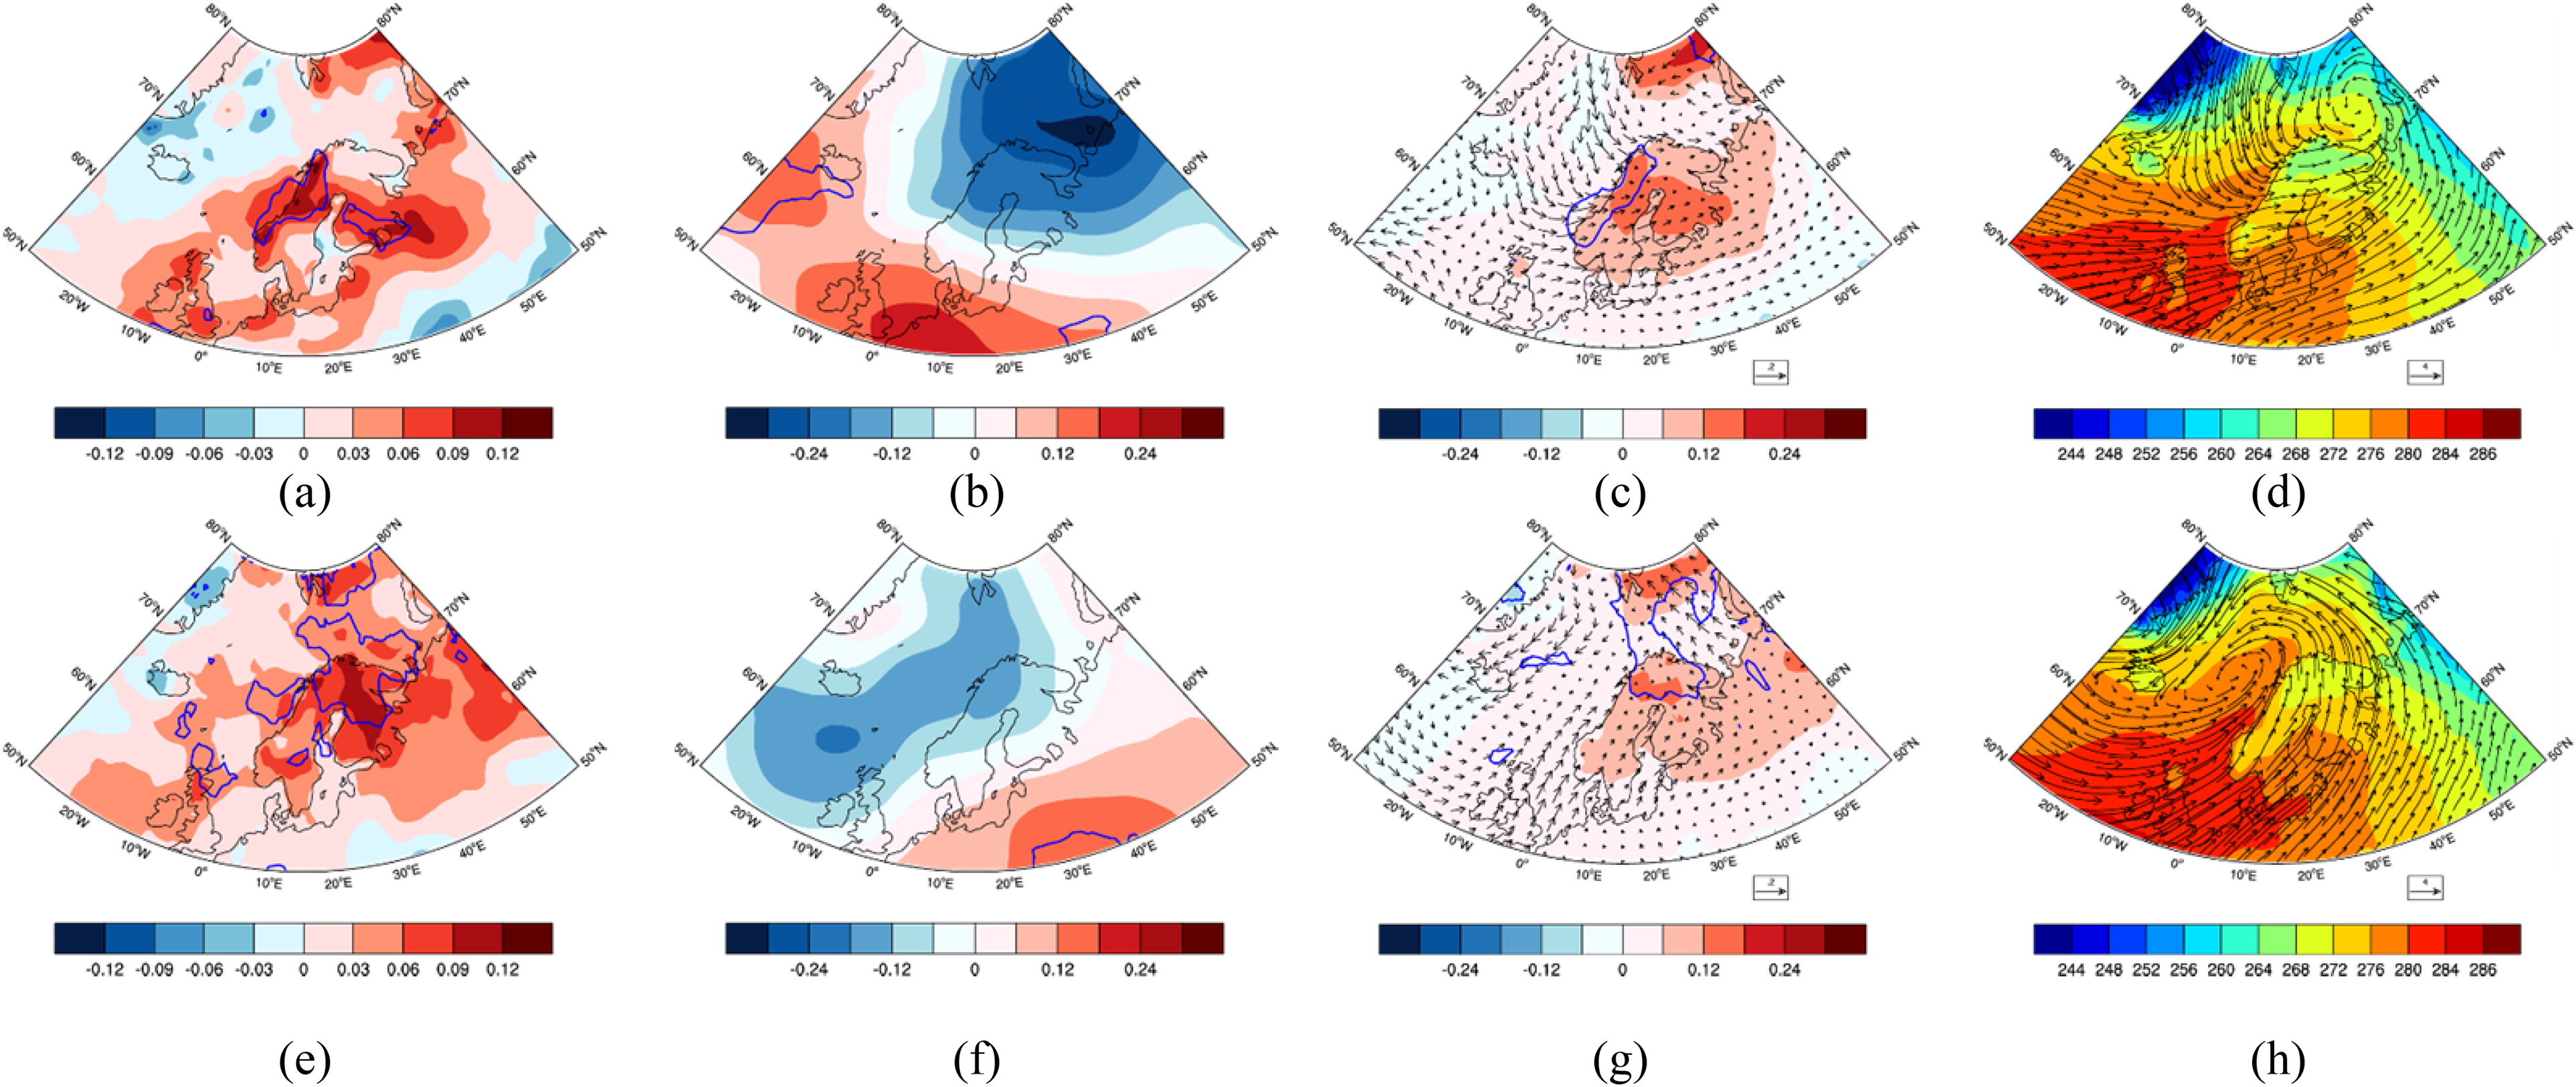
Fig. 11.
As Fig. 9 but for extremely warm days for nodes 1 (upper row) and 9 (lower row).
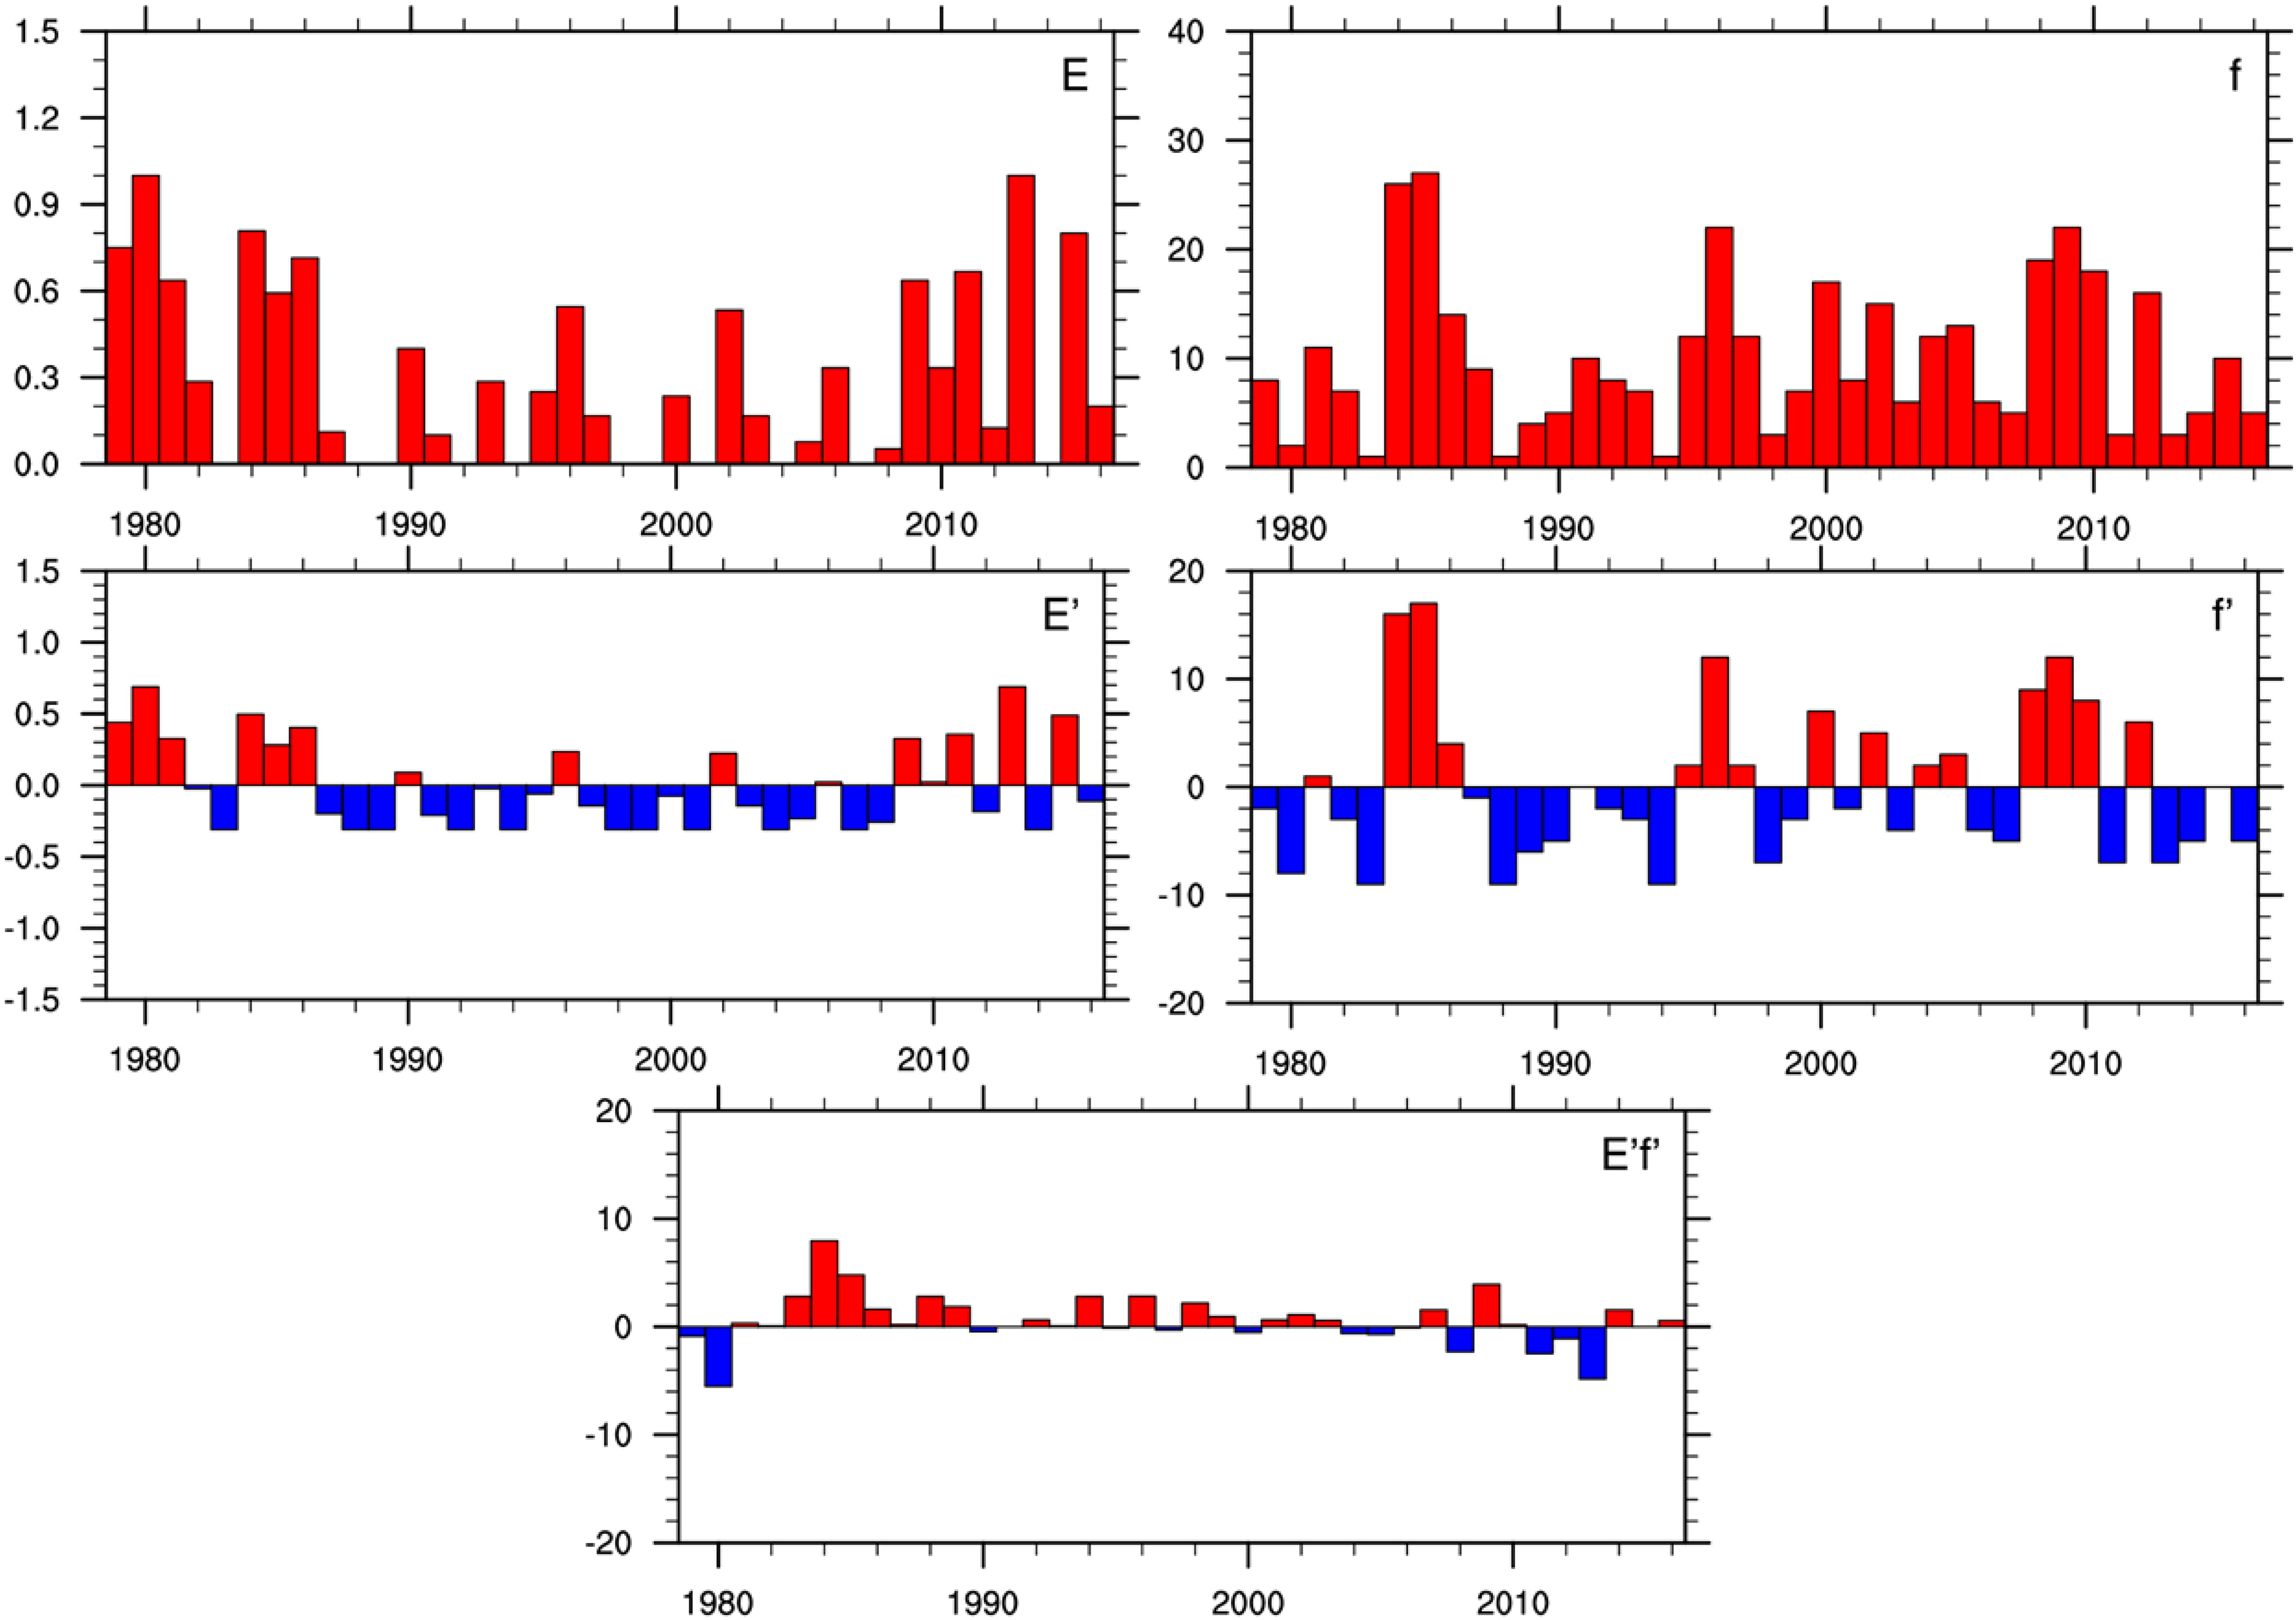
Fig. 12.
Time series of and for node 4 in the case of cold extremes.
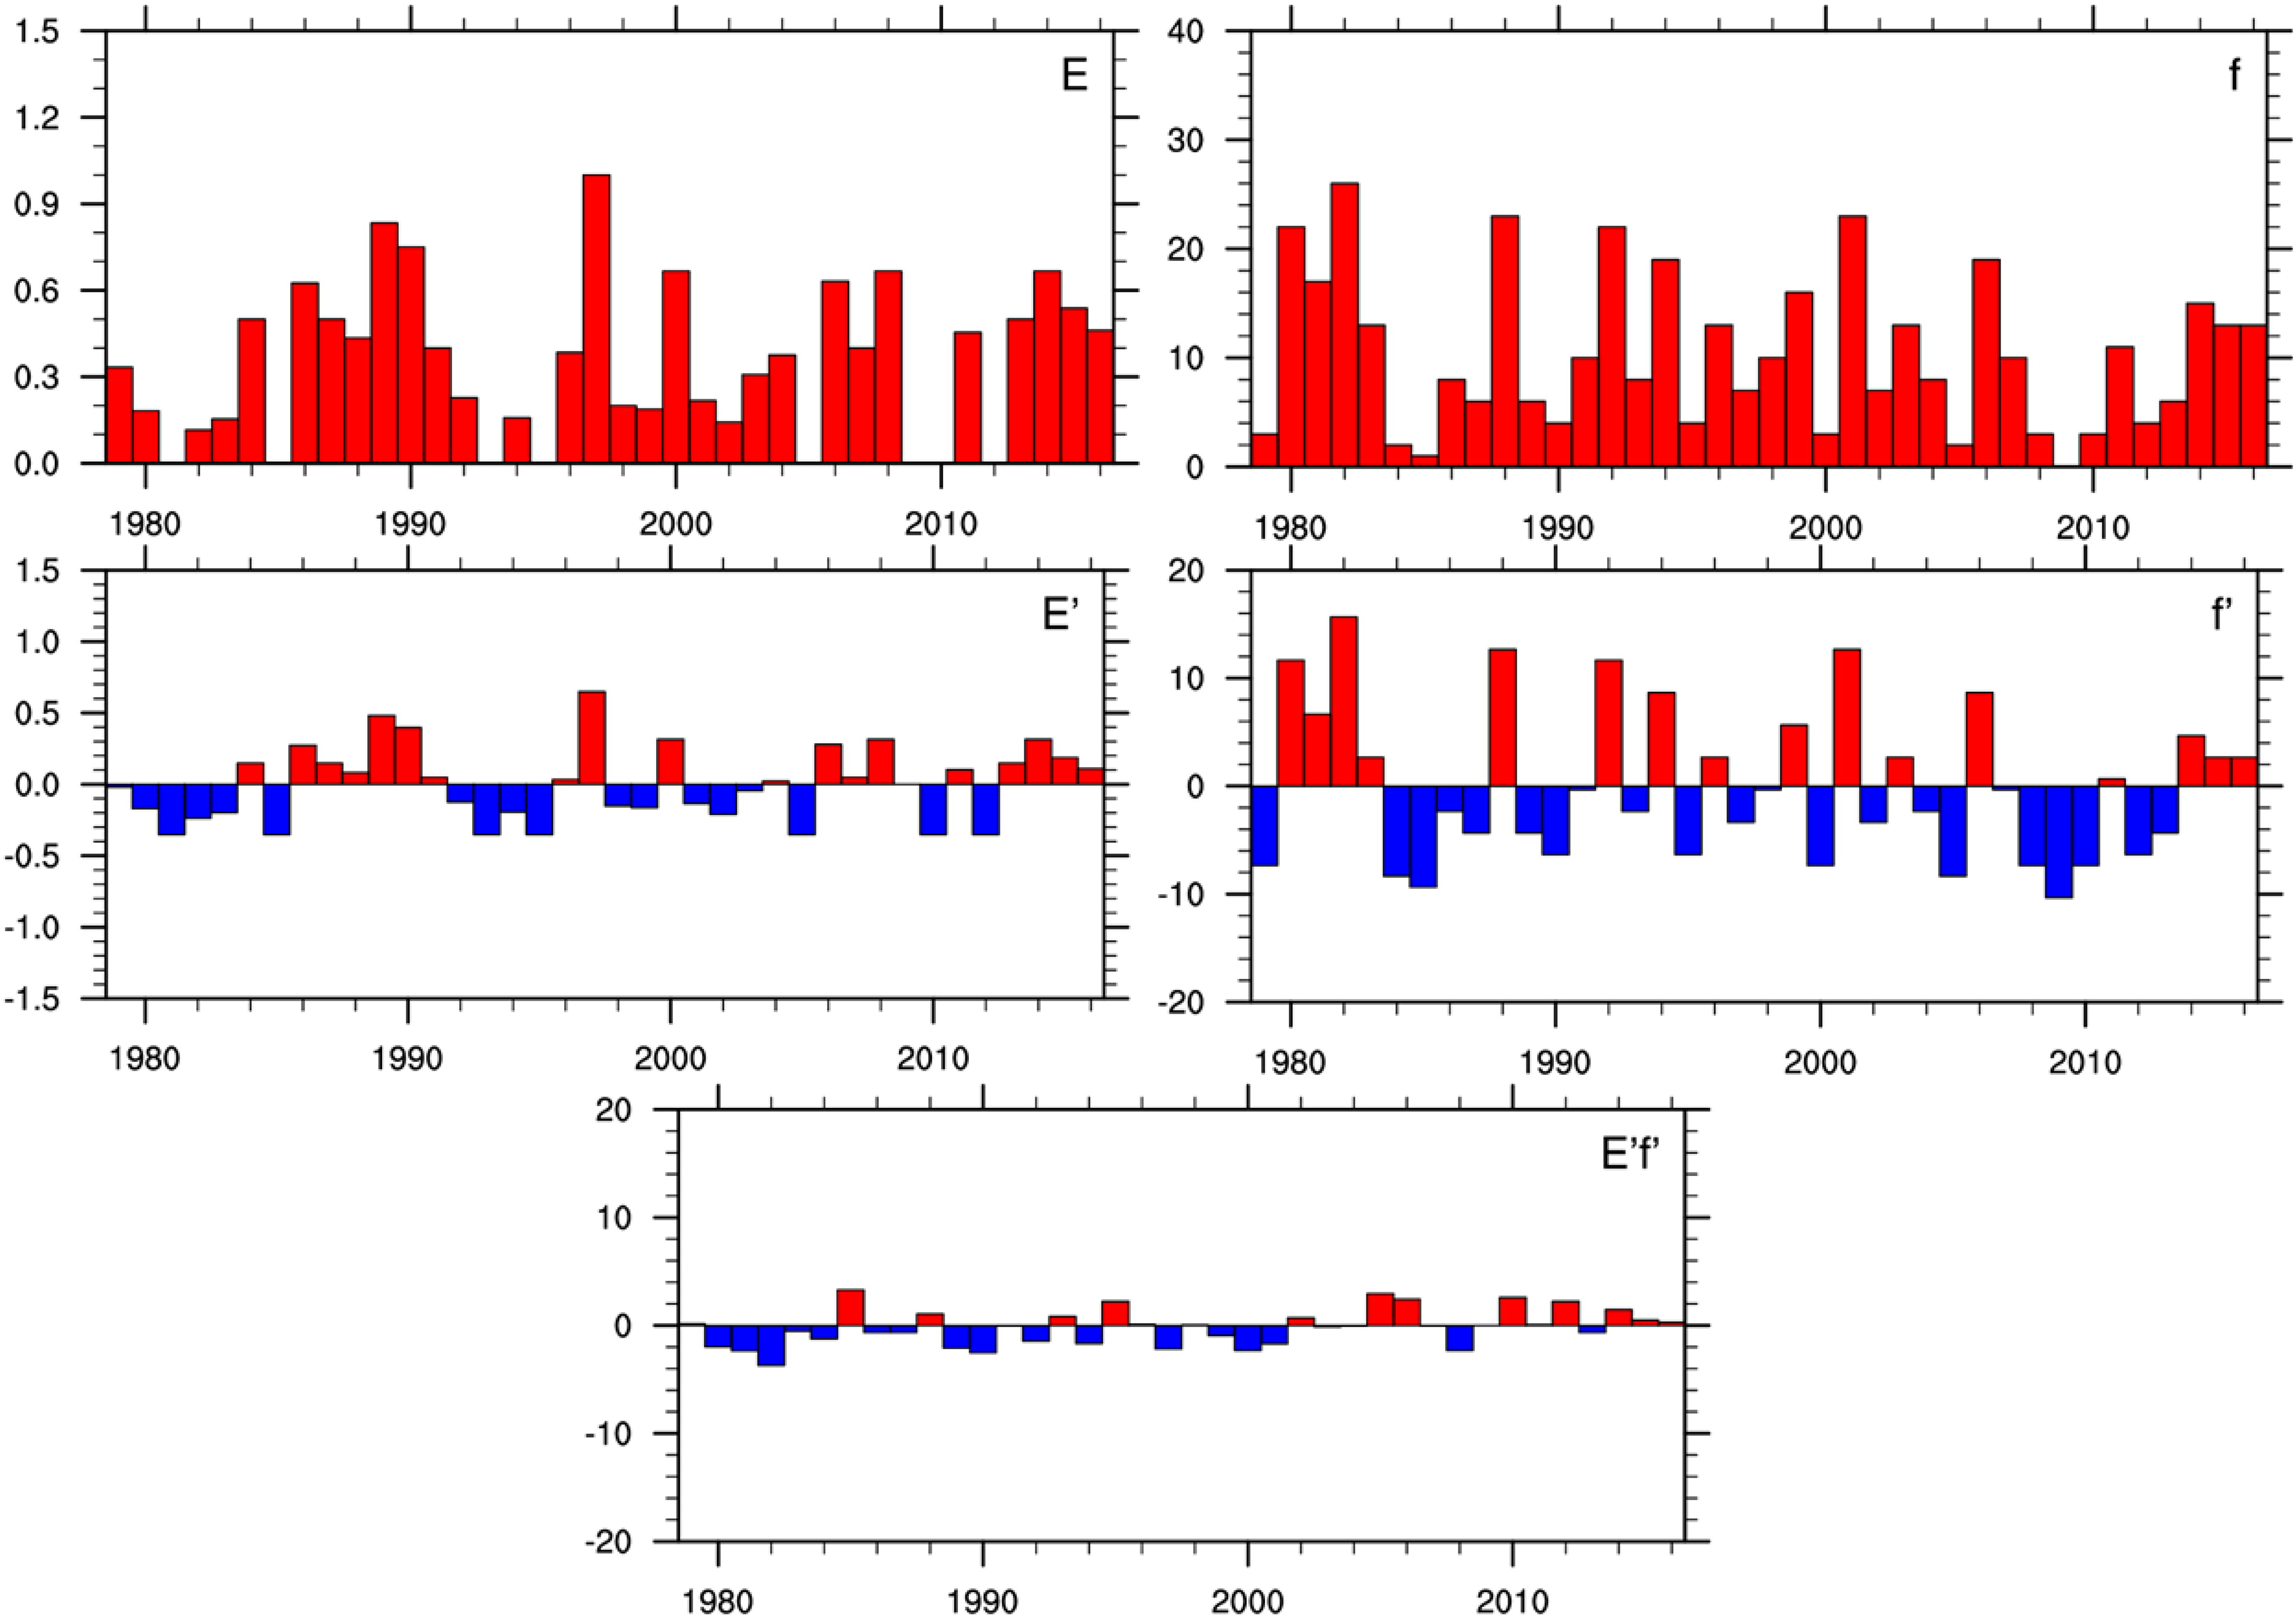
Fig. 13.
As Fig. 12 but for node 1 in the case of warm extremes.