
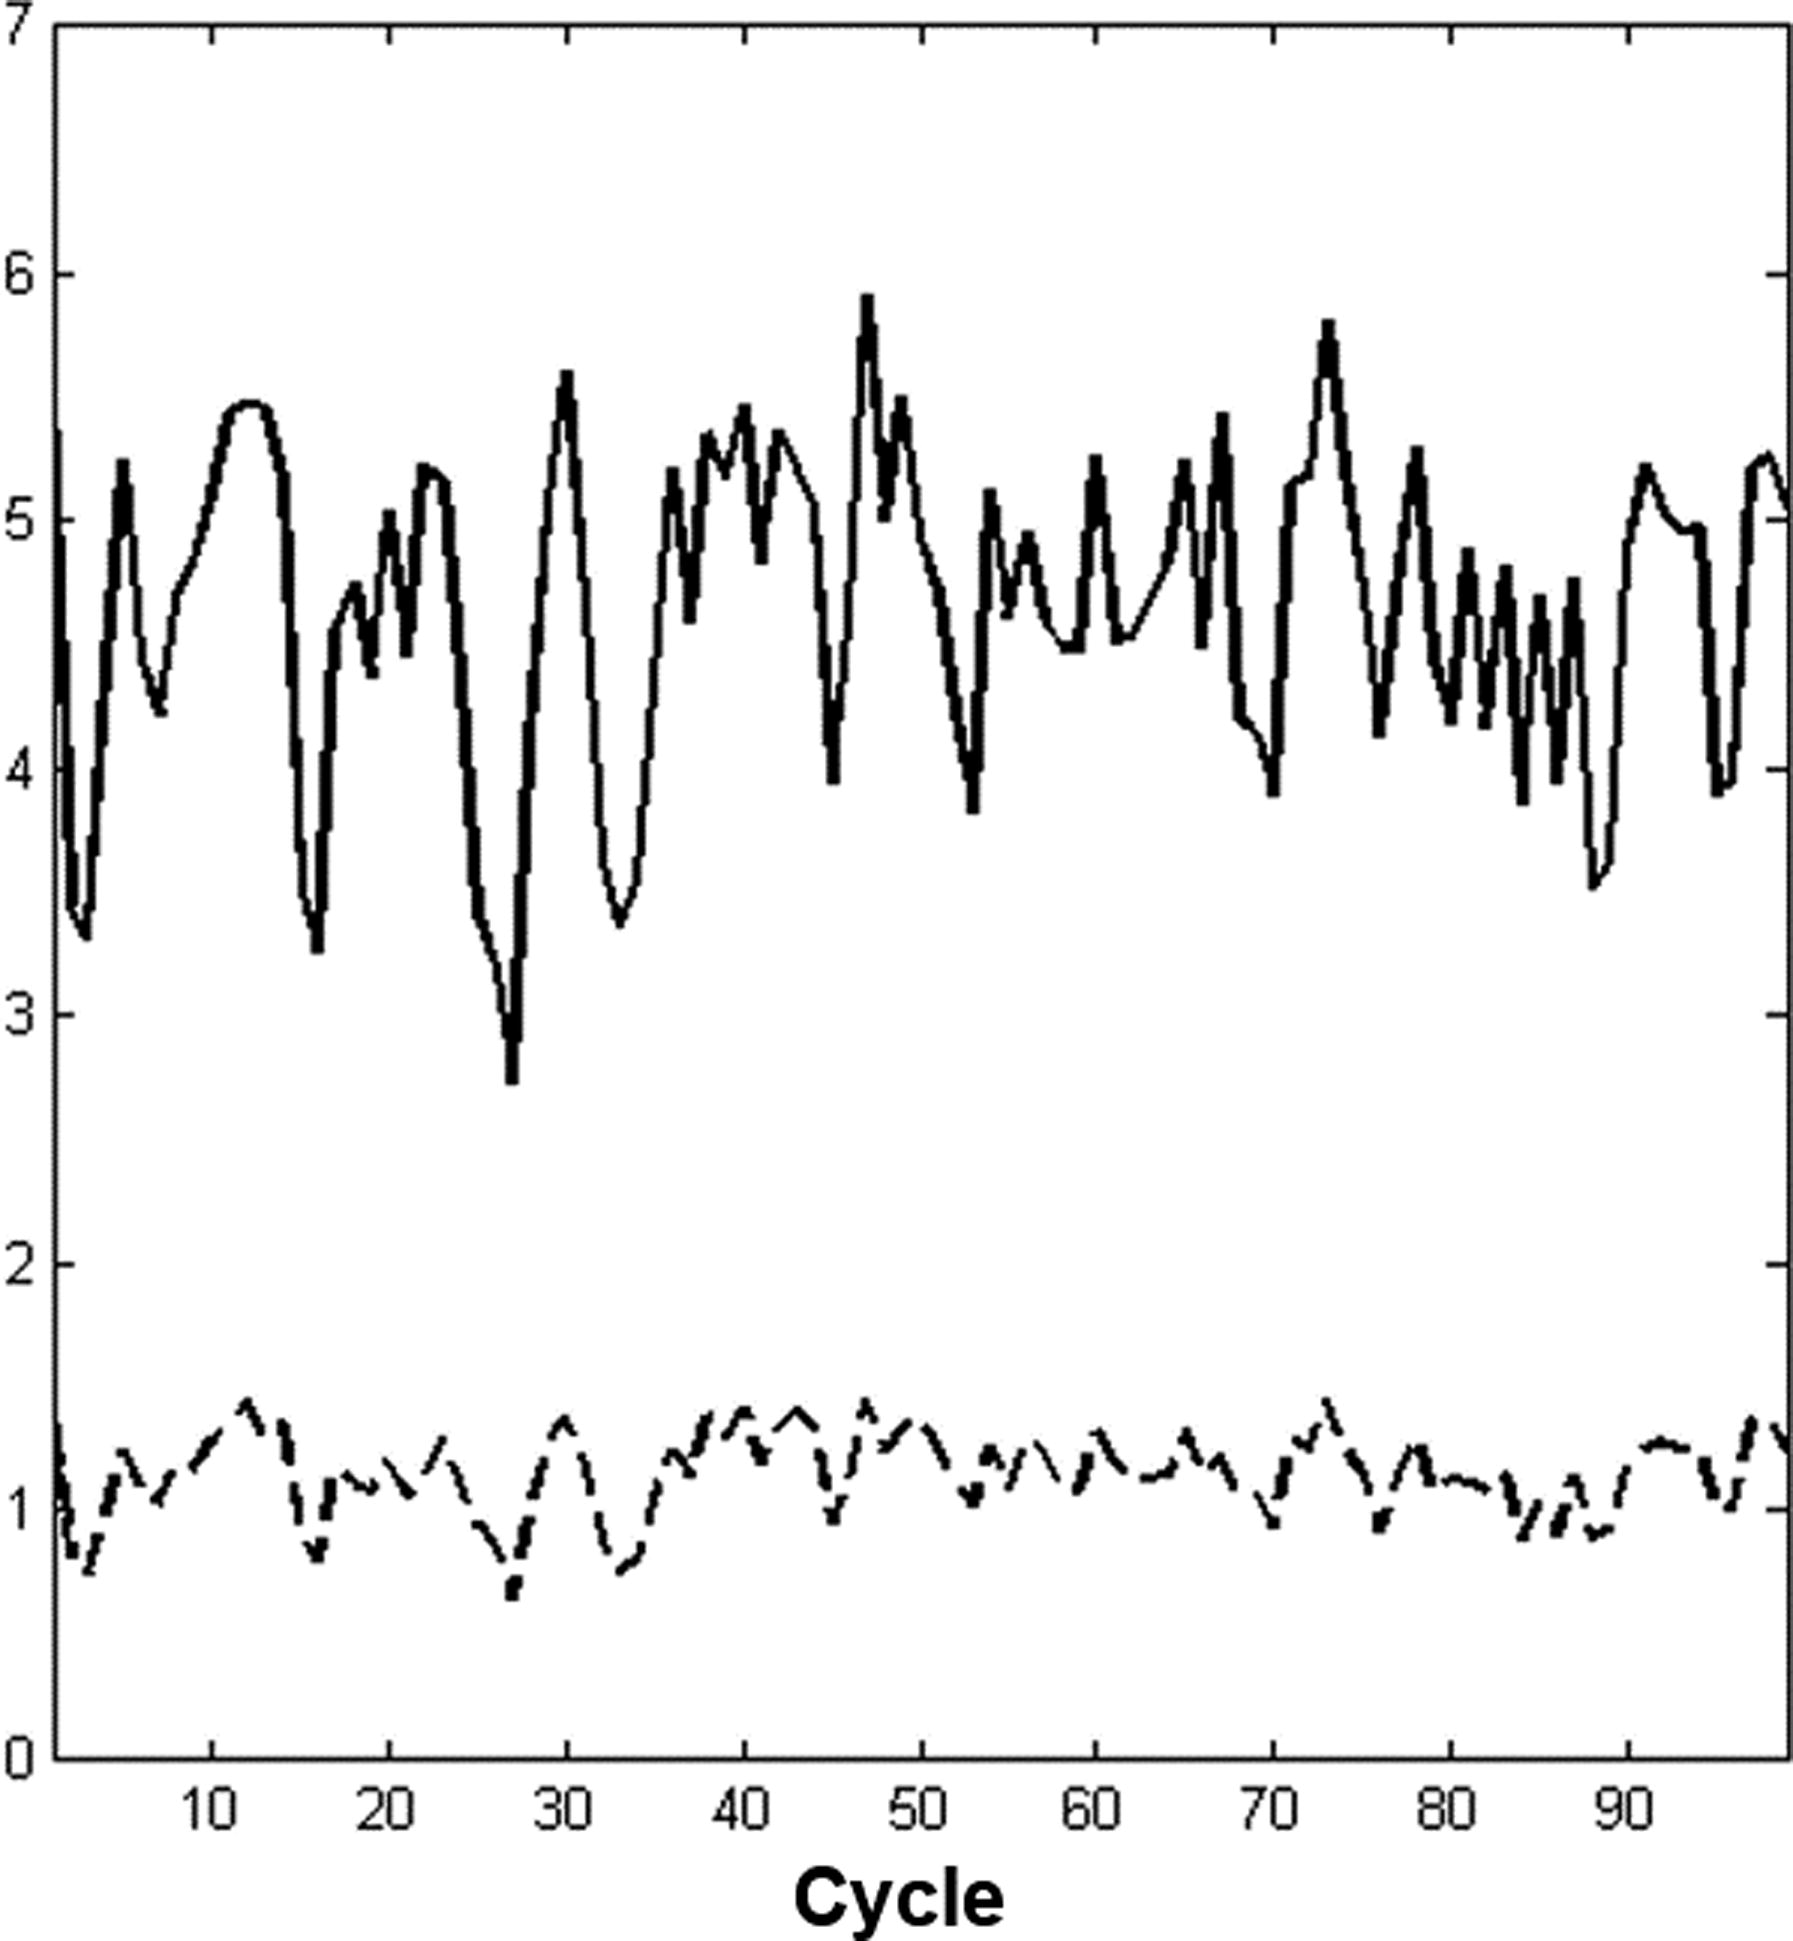
Fig. 1.
MAE of the background (solid line) and analysis (dashed line) errors through all the assimilation cycles.
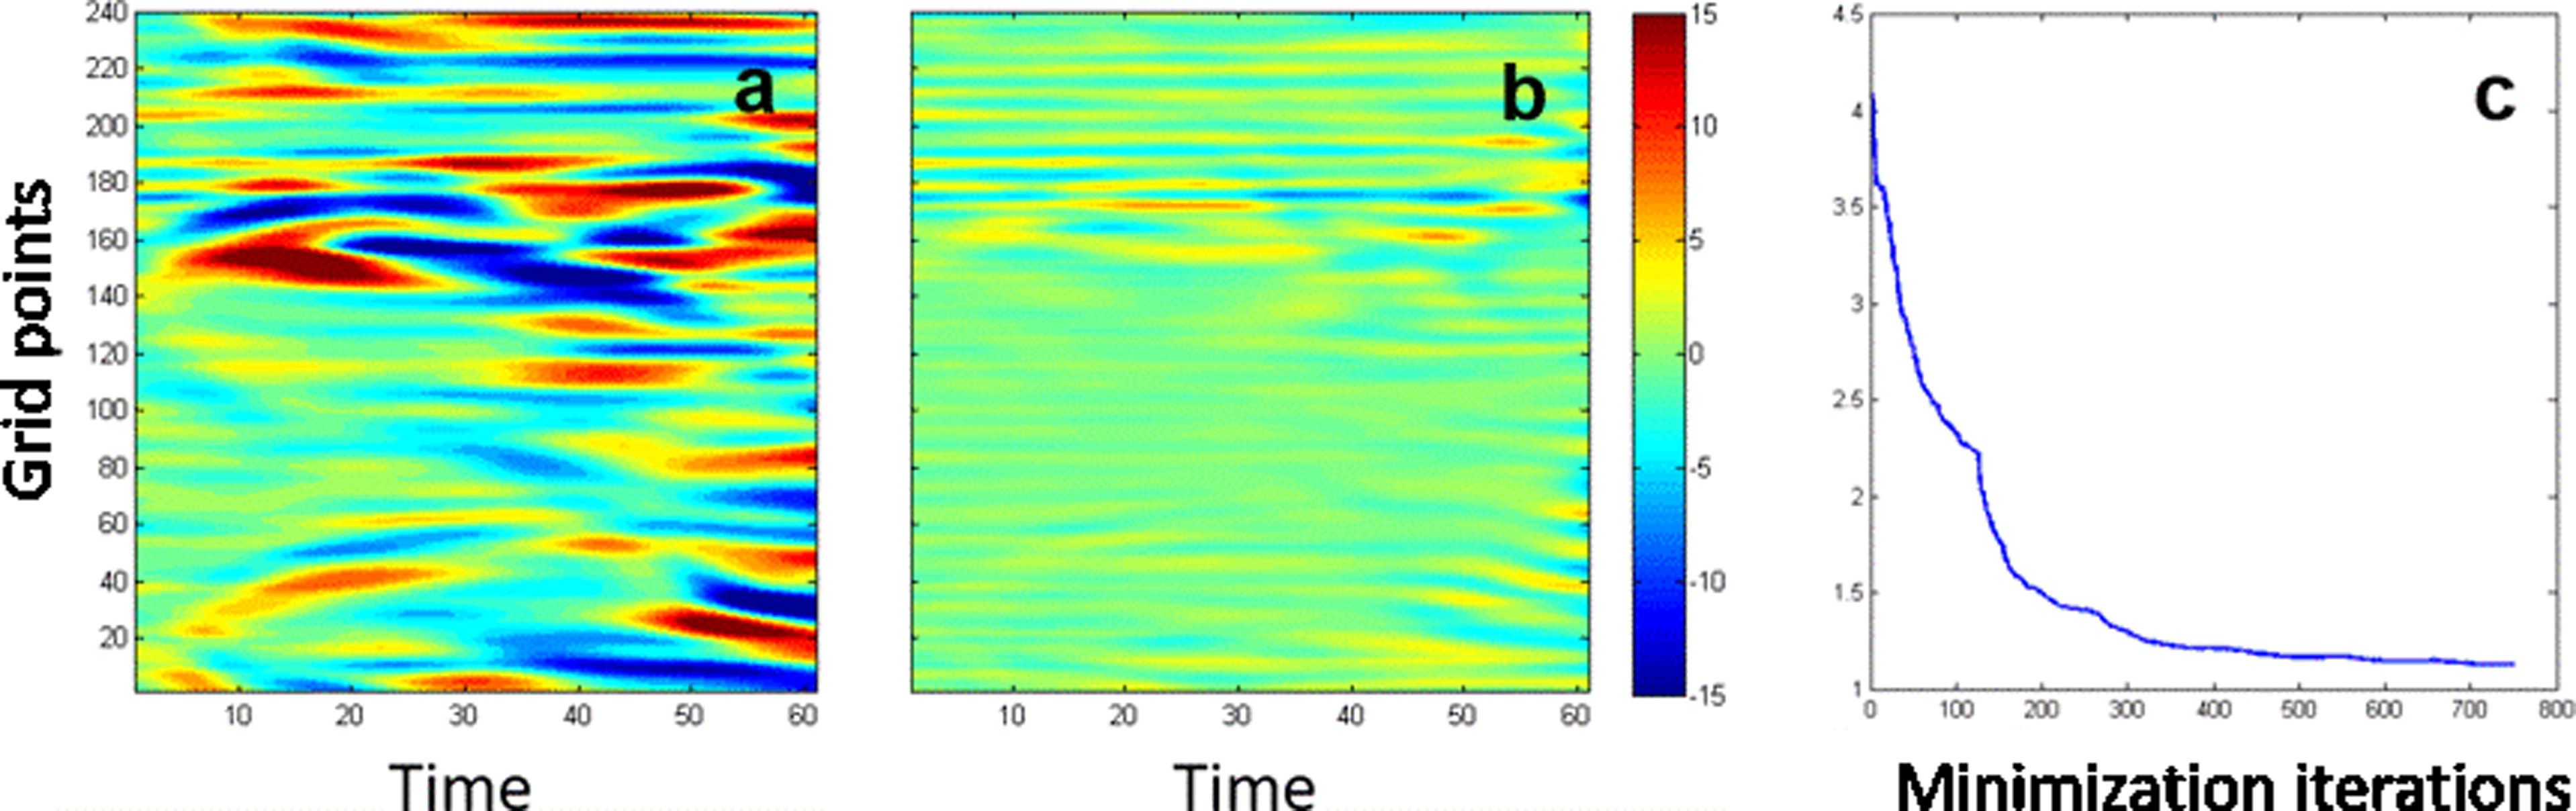
Fig. 2.
Residuals at the beginning (a) and end (b) of the minimization iterations, and MAE of the assimilated solution at every iteration of cycle 80.
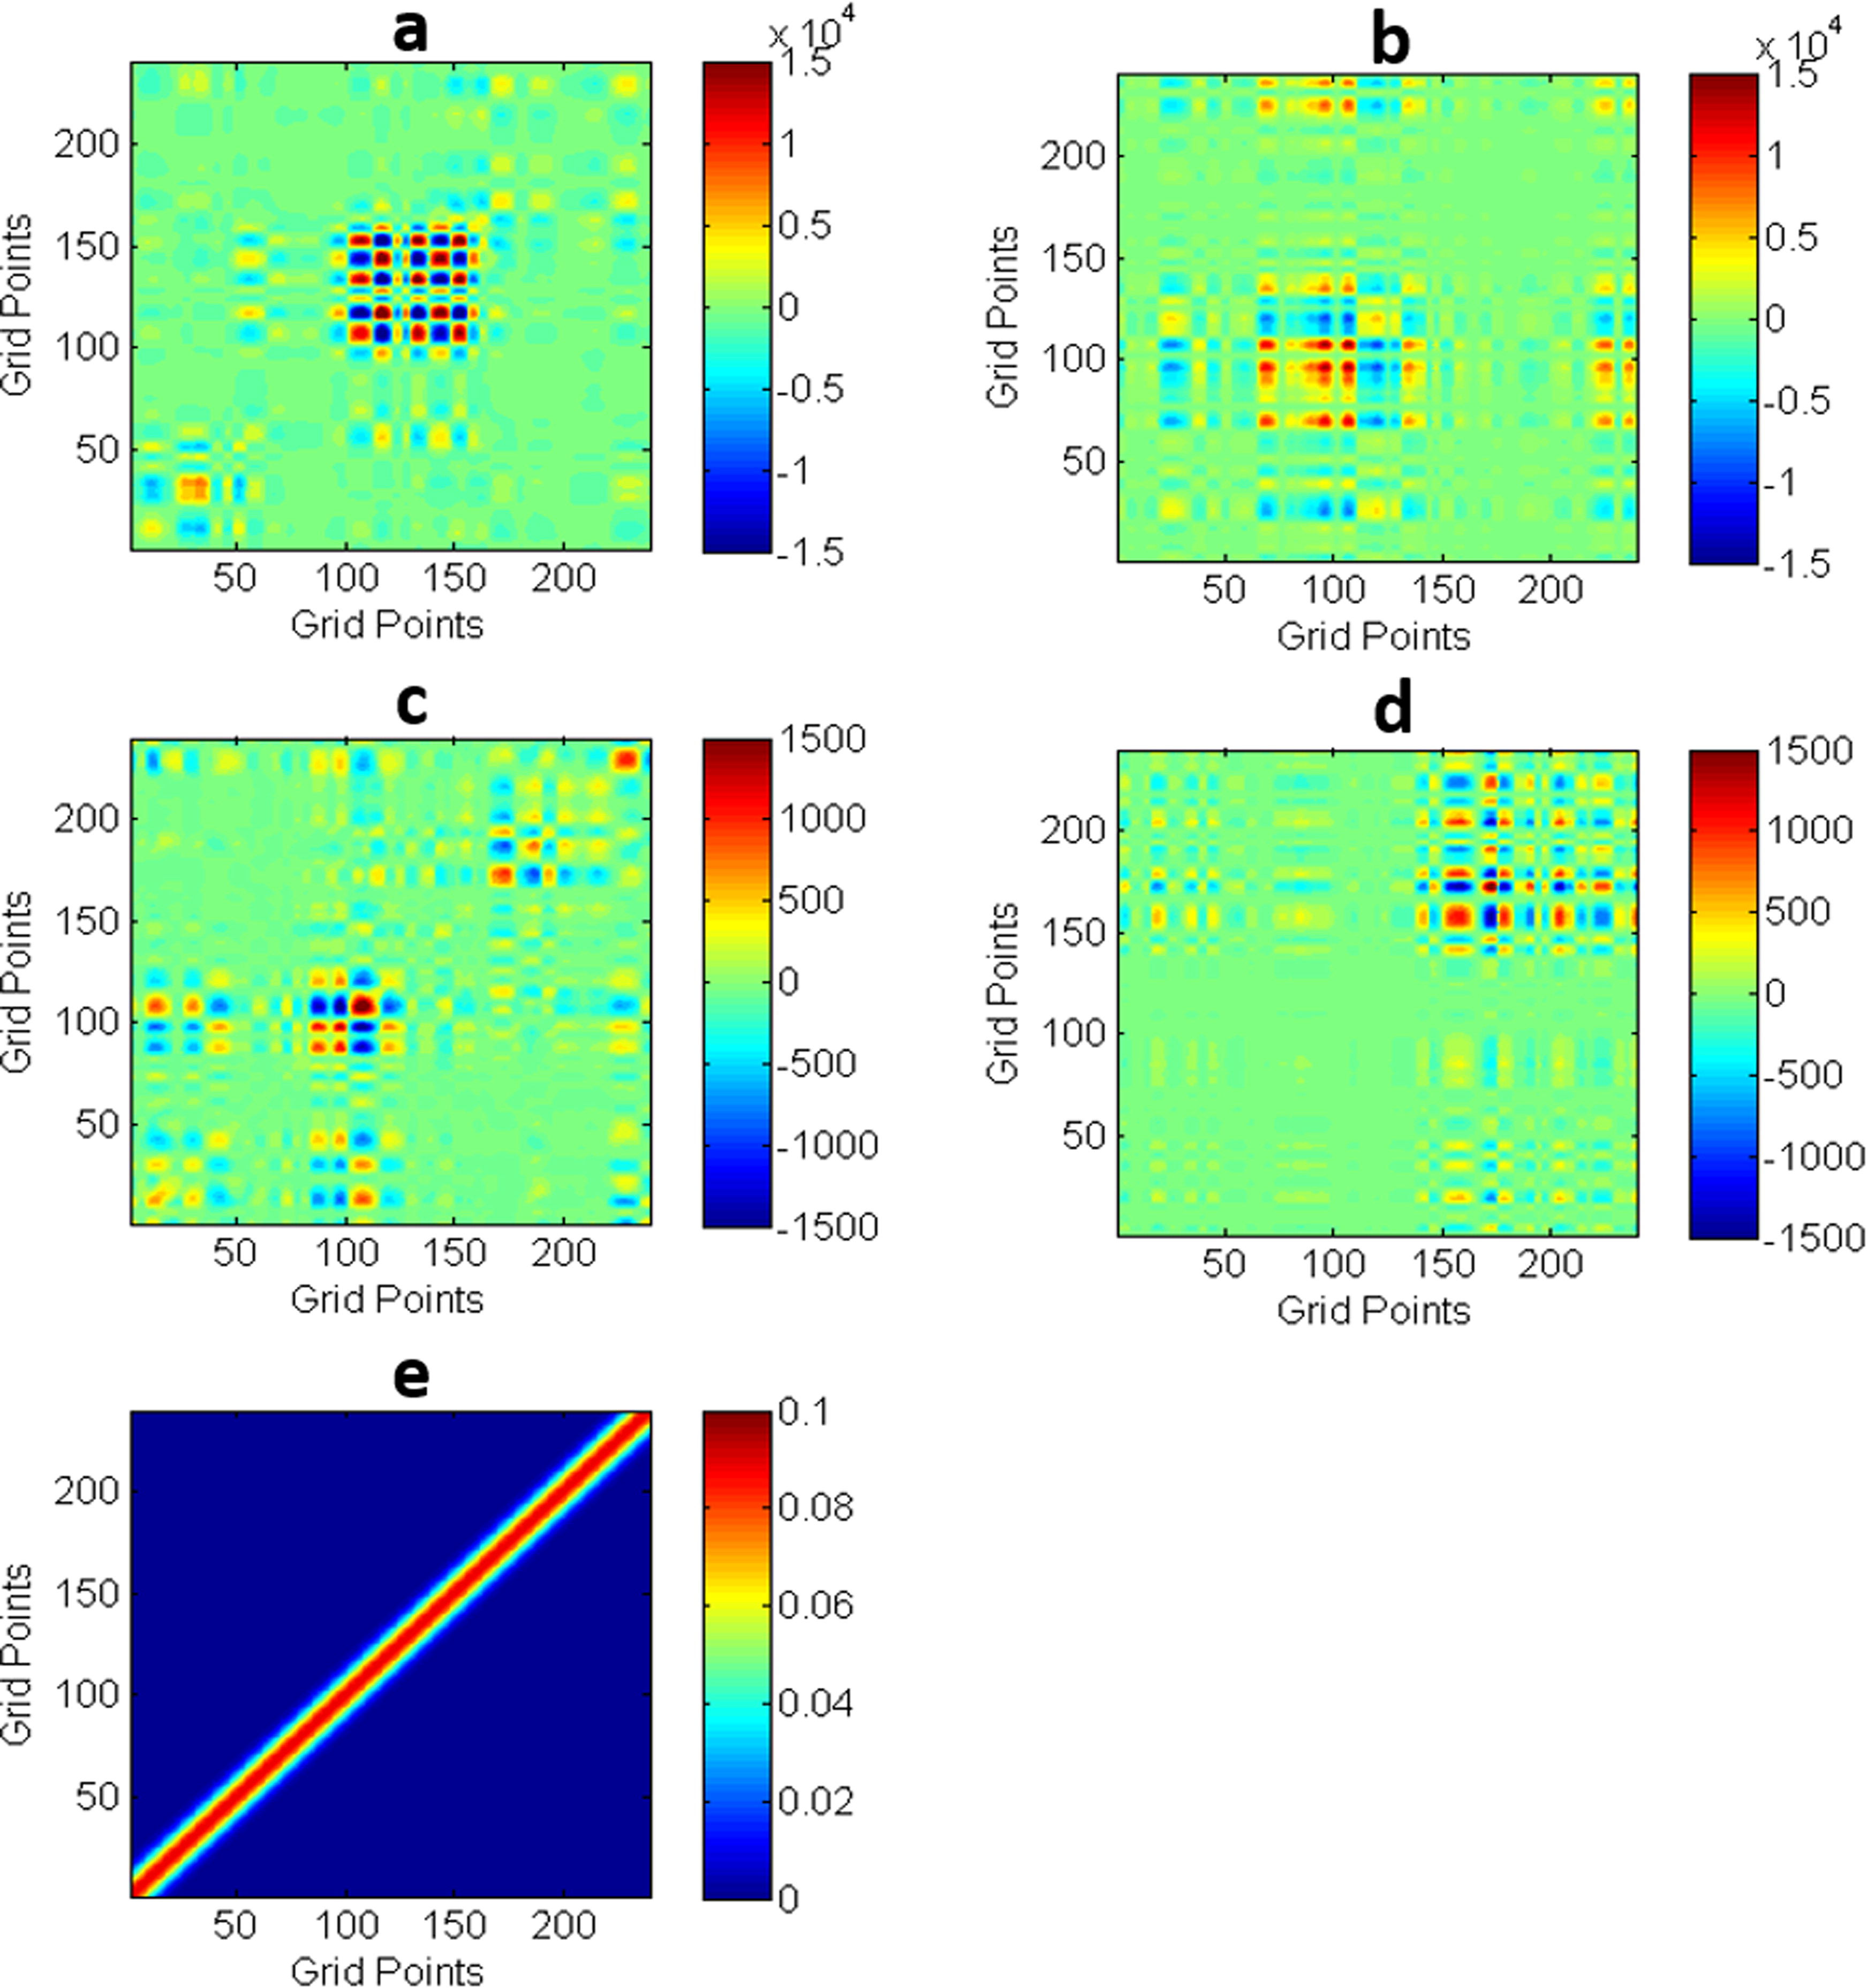
Fig. 3.
A comparison of the analytical and estimated covariances for cycle 70 (a, b) and cycle 80 (c, d) and the prescribed covariance (e). The analytical covariance used 1000 samples for the prior, and the estimated covariance used 300 members.
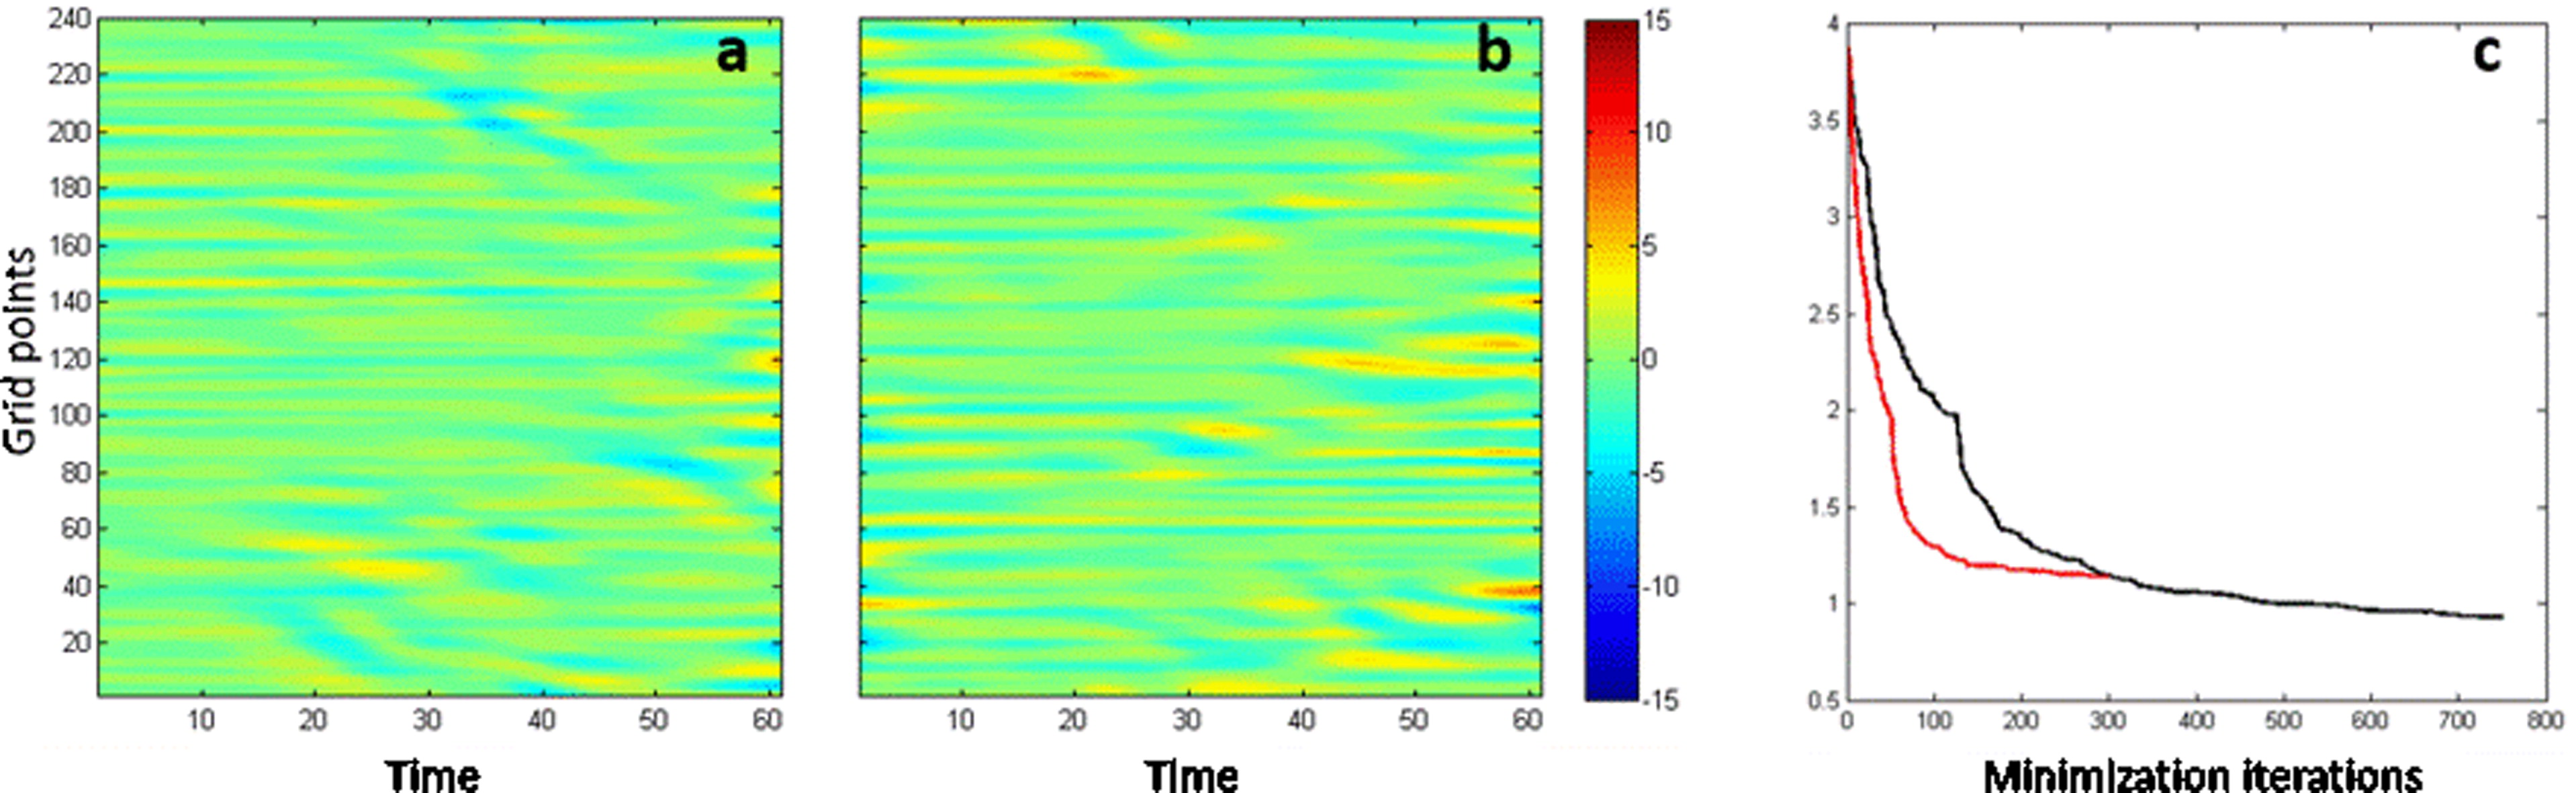
Fig. 4.
A comparison of cycle 70 residuals at the end of the minimization with the prescribed covariance (a), the estimated covariance (b) and the evolution of the residual norm (c) using the prescribed covariance (black) and the estimated covariance (red).
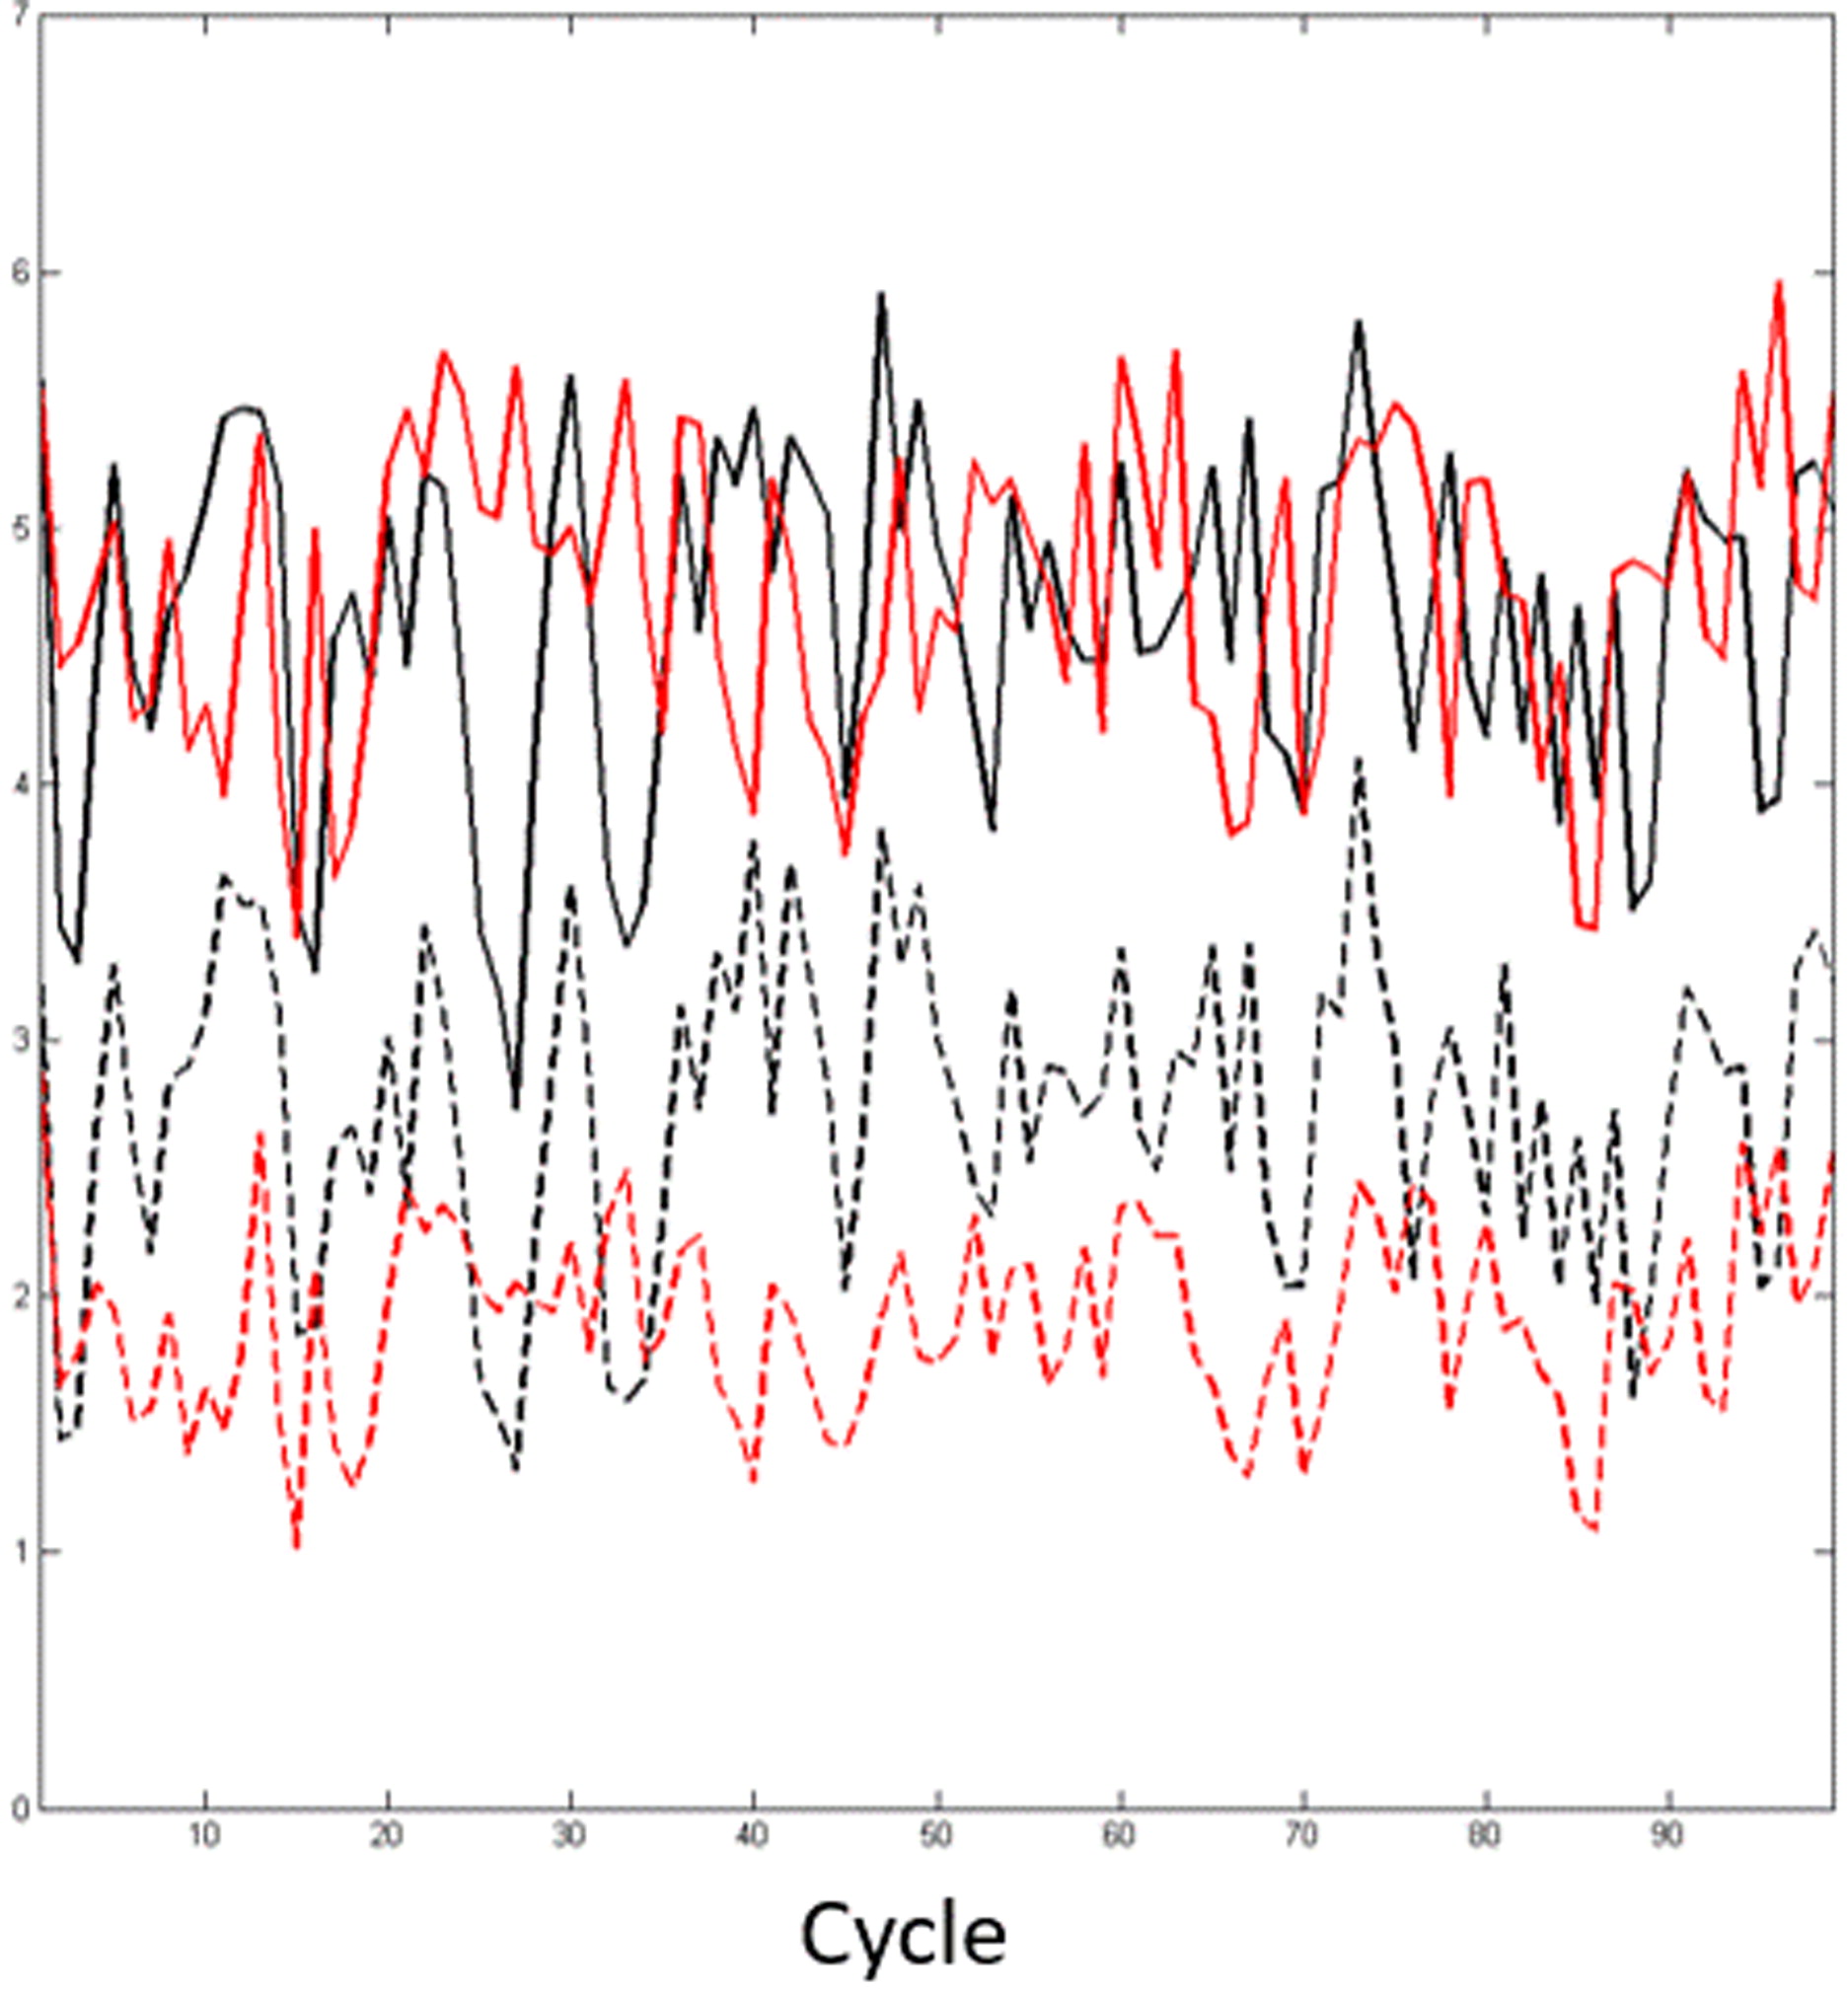
Fig. 5.
Mean absolute error of the background (solid lines) and analysis (dashed lines) from EXP1 (black) and EXP2 (red). The analyses are computed after 100 minimization iterations.