
Fig. 1.
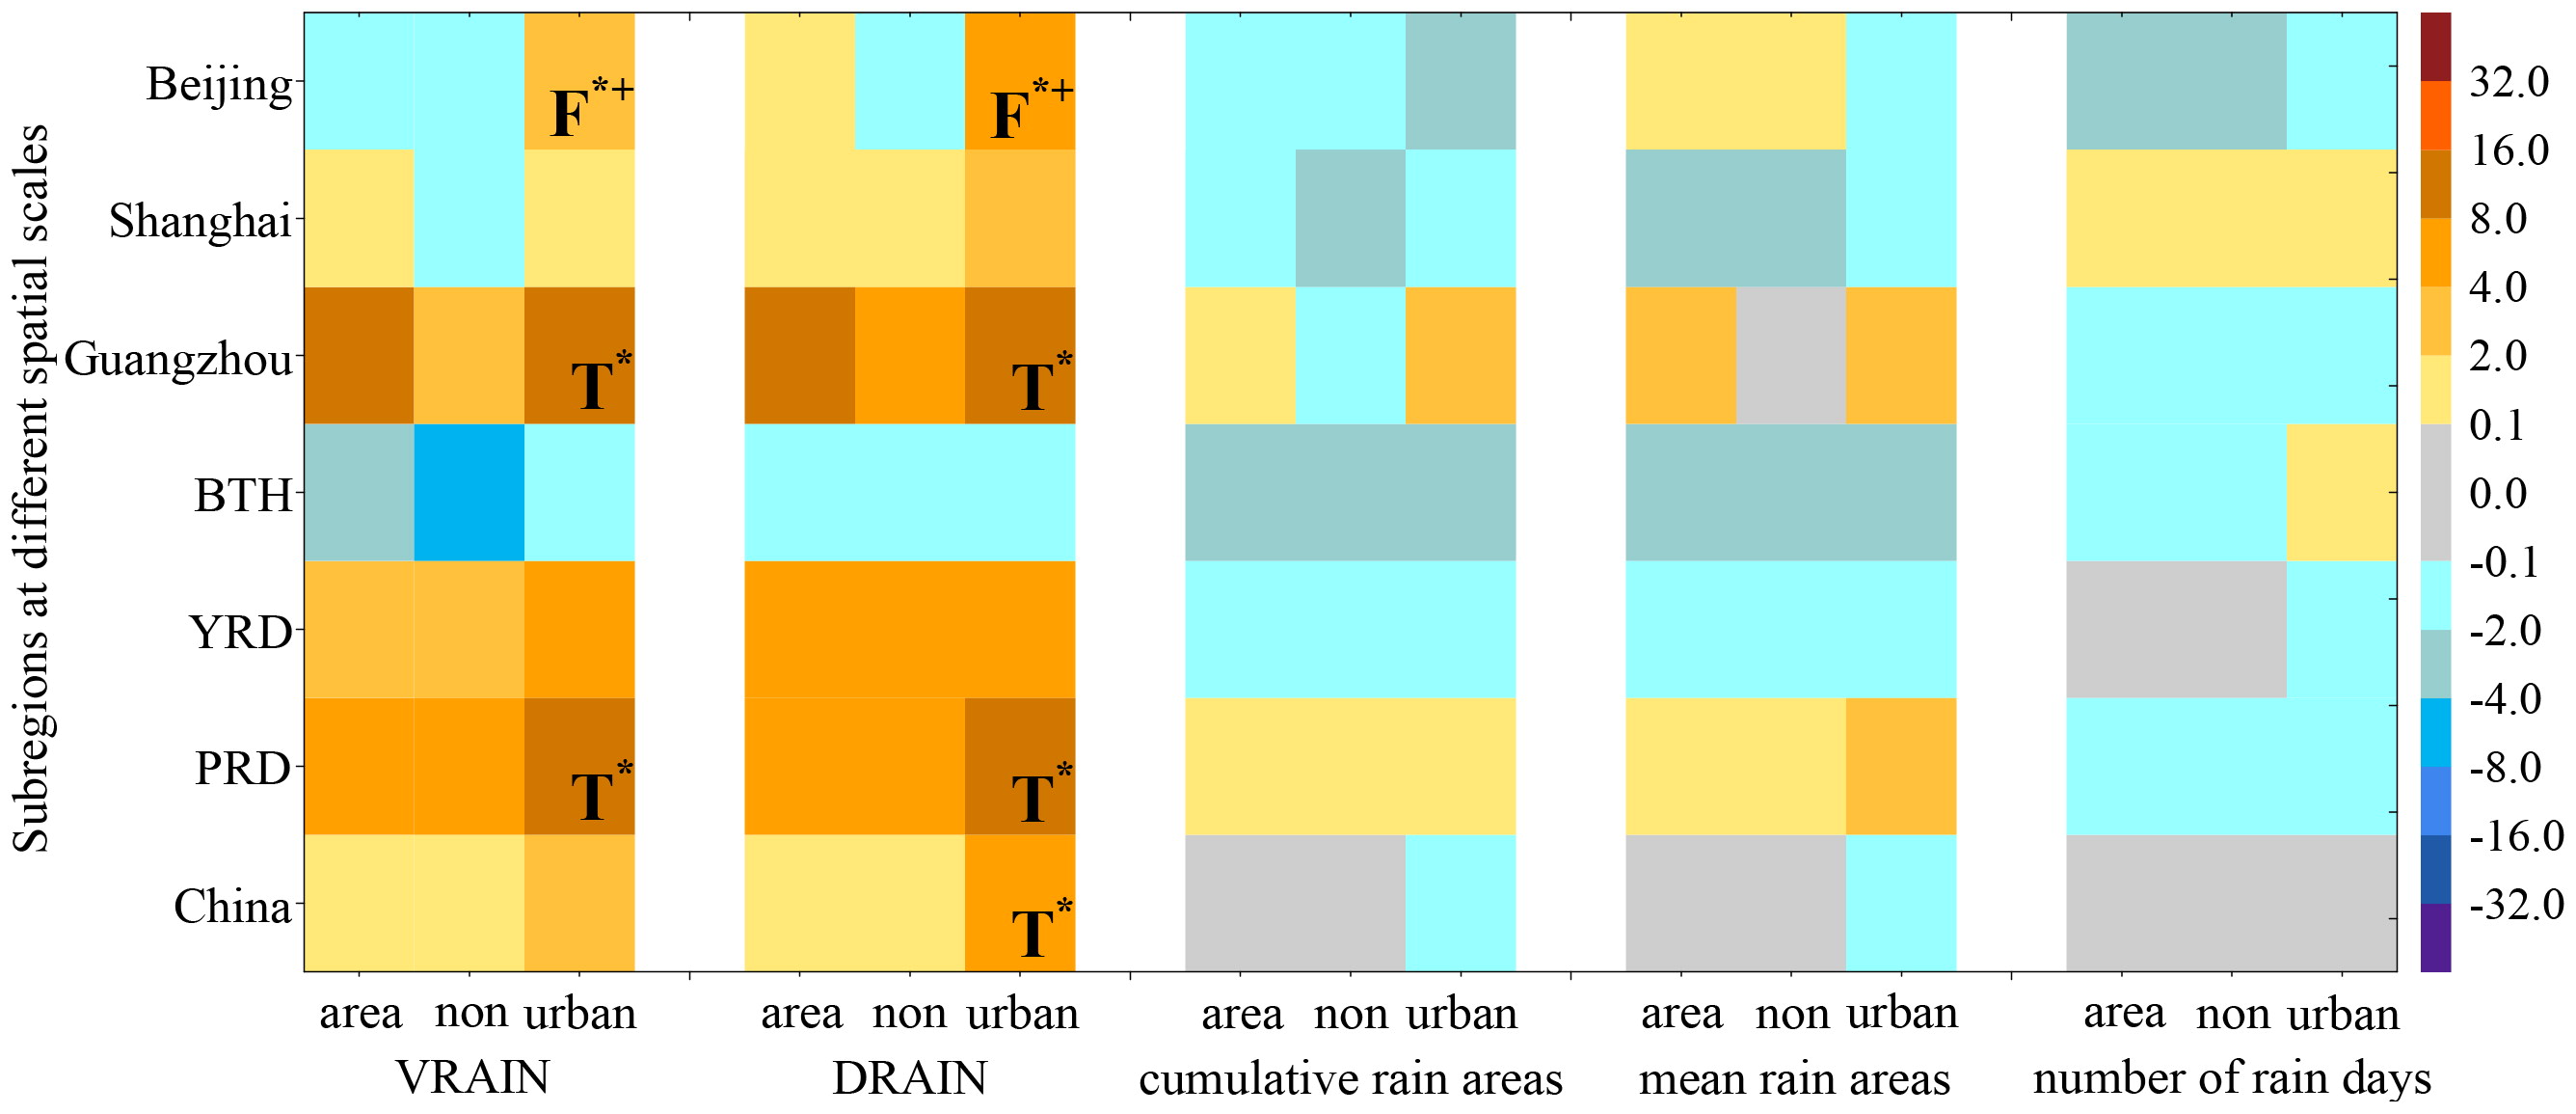
The urban-induced relative changes in total rainfall at different scales. Changes in VRAIN, DRAIN, cumulative rain areas, mean rain areas, and numbers of rain days for total rainfall due to urban surface expansion over nonurban areas (non), urban areas, and subregions as a whole between U80 and U10 (color bar indicates changes. *Indicates passing 95% confidence level significance F tests (F*) or t tests (T*), and F*+ and F*− denote enhanced and weakened variability respectively, units: %). Subregions showing significant changes in the variability (intensity) only are marked using F* (T*), and subregions expressing significant changes in both variability and intensity are marked using F* and T*.
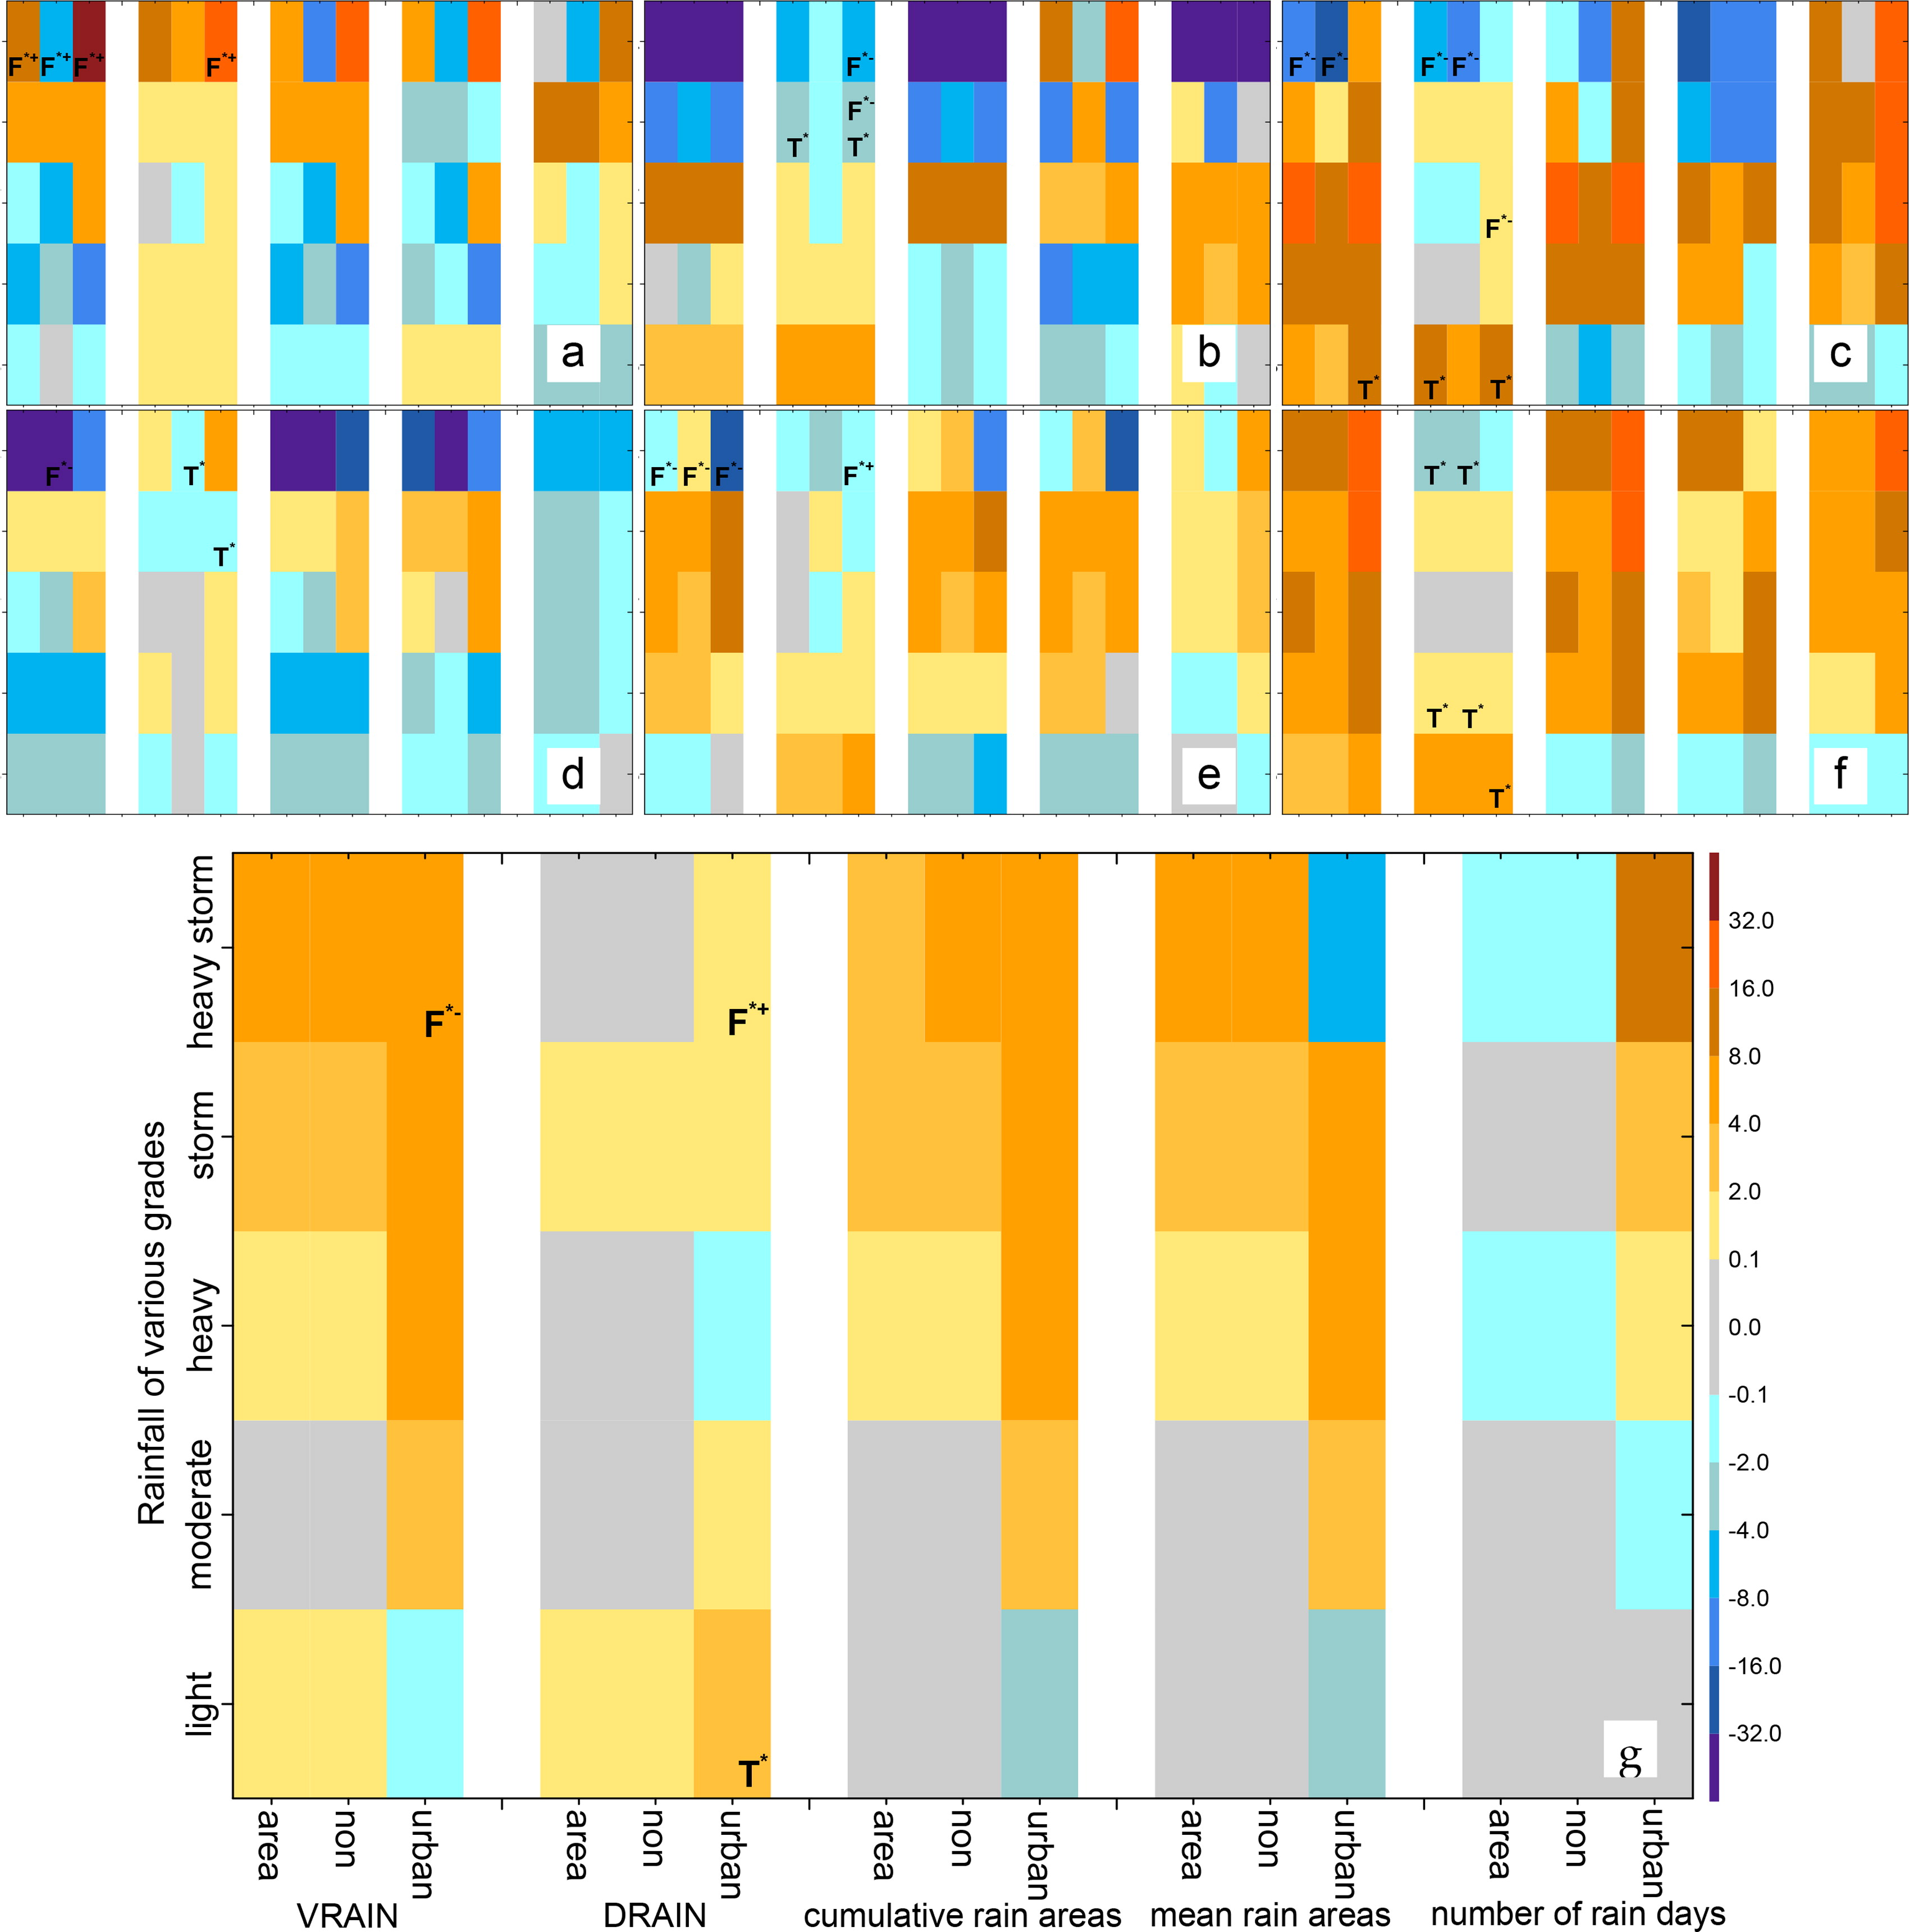
Fig. 2.
The urban-induced relative changes in rainfall of various intensity levels at different spatial scales. Changes in VRAIN, DRAIN, cumulative rain areas, mean rain areas, and numbers of rain days for various intensity levels of rainfall over nonurban areas (non), urban areas, and subregions as a whole (a: Beijing, b: Shanghai, c: Guangzhou, d: BTH, e: YRD, f: PRD, g: China) due to urban surface expansion between 1980 and 2010 (units: %).
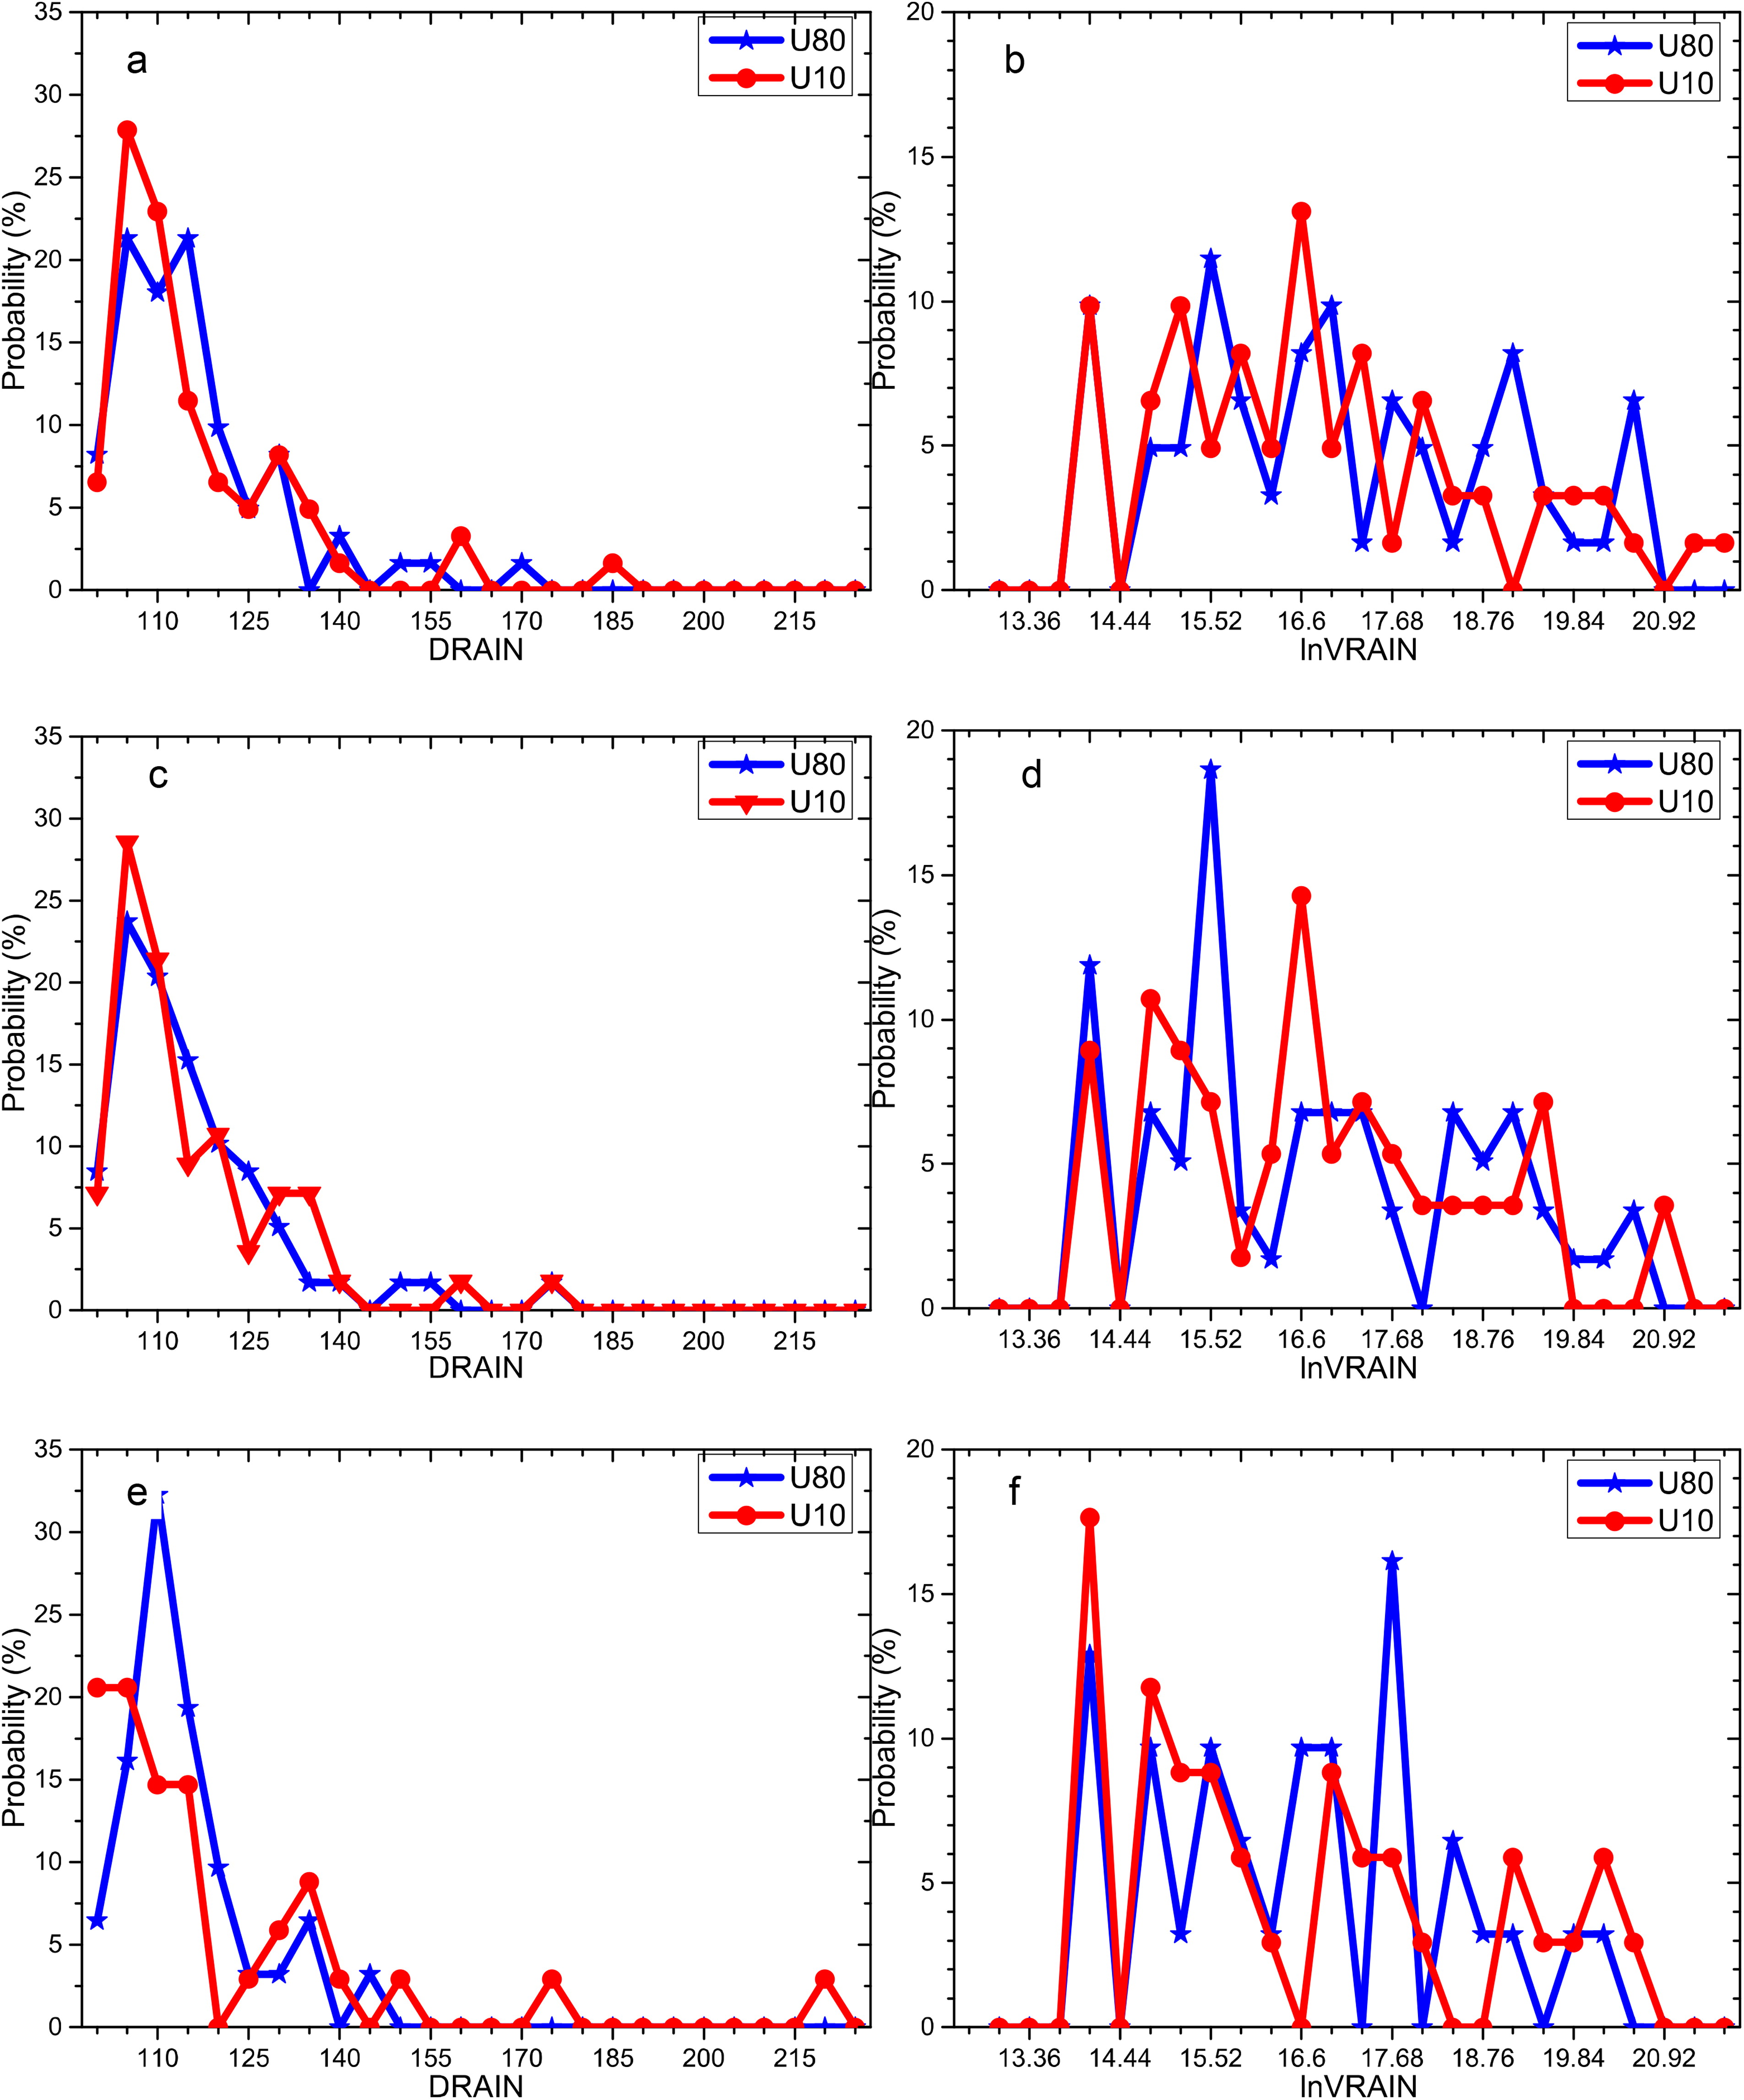
Fig. 3.
Probability distributions of different (a, c, e, units: mm day−1) DRAIN and (b, d, f, units: m3) lnVRAIN for heavy storm rain over (c, d) nonurban areas, (e, f) urban areas, and (a, b) the entirety of Beijing due to urban surface expansion between 1980 and 2010.
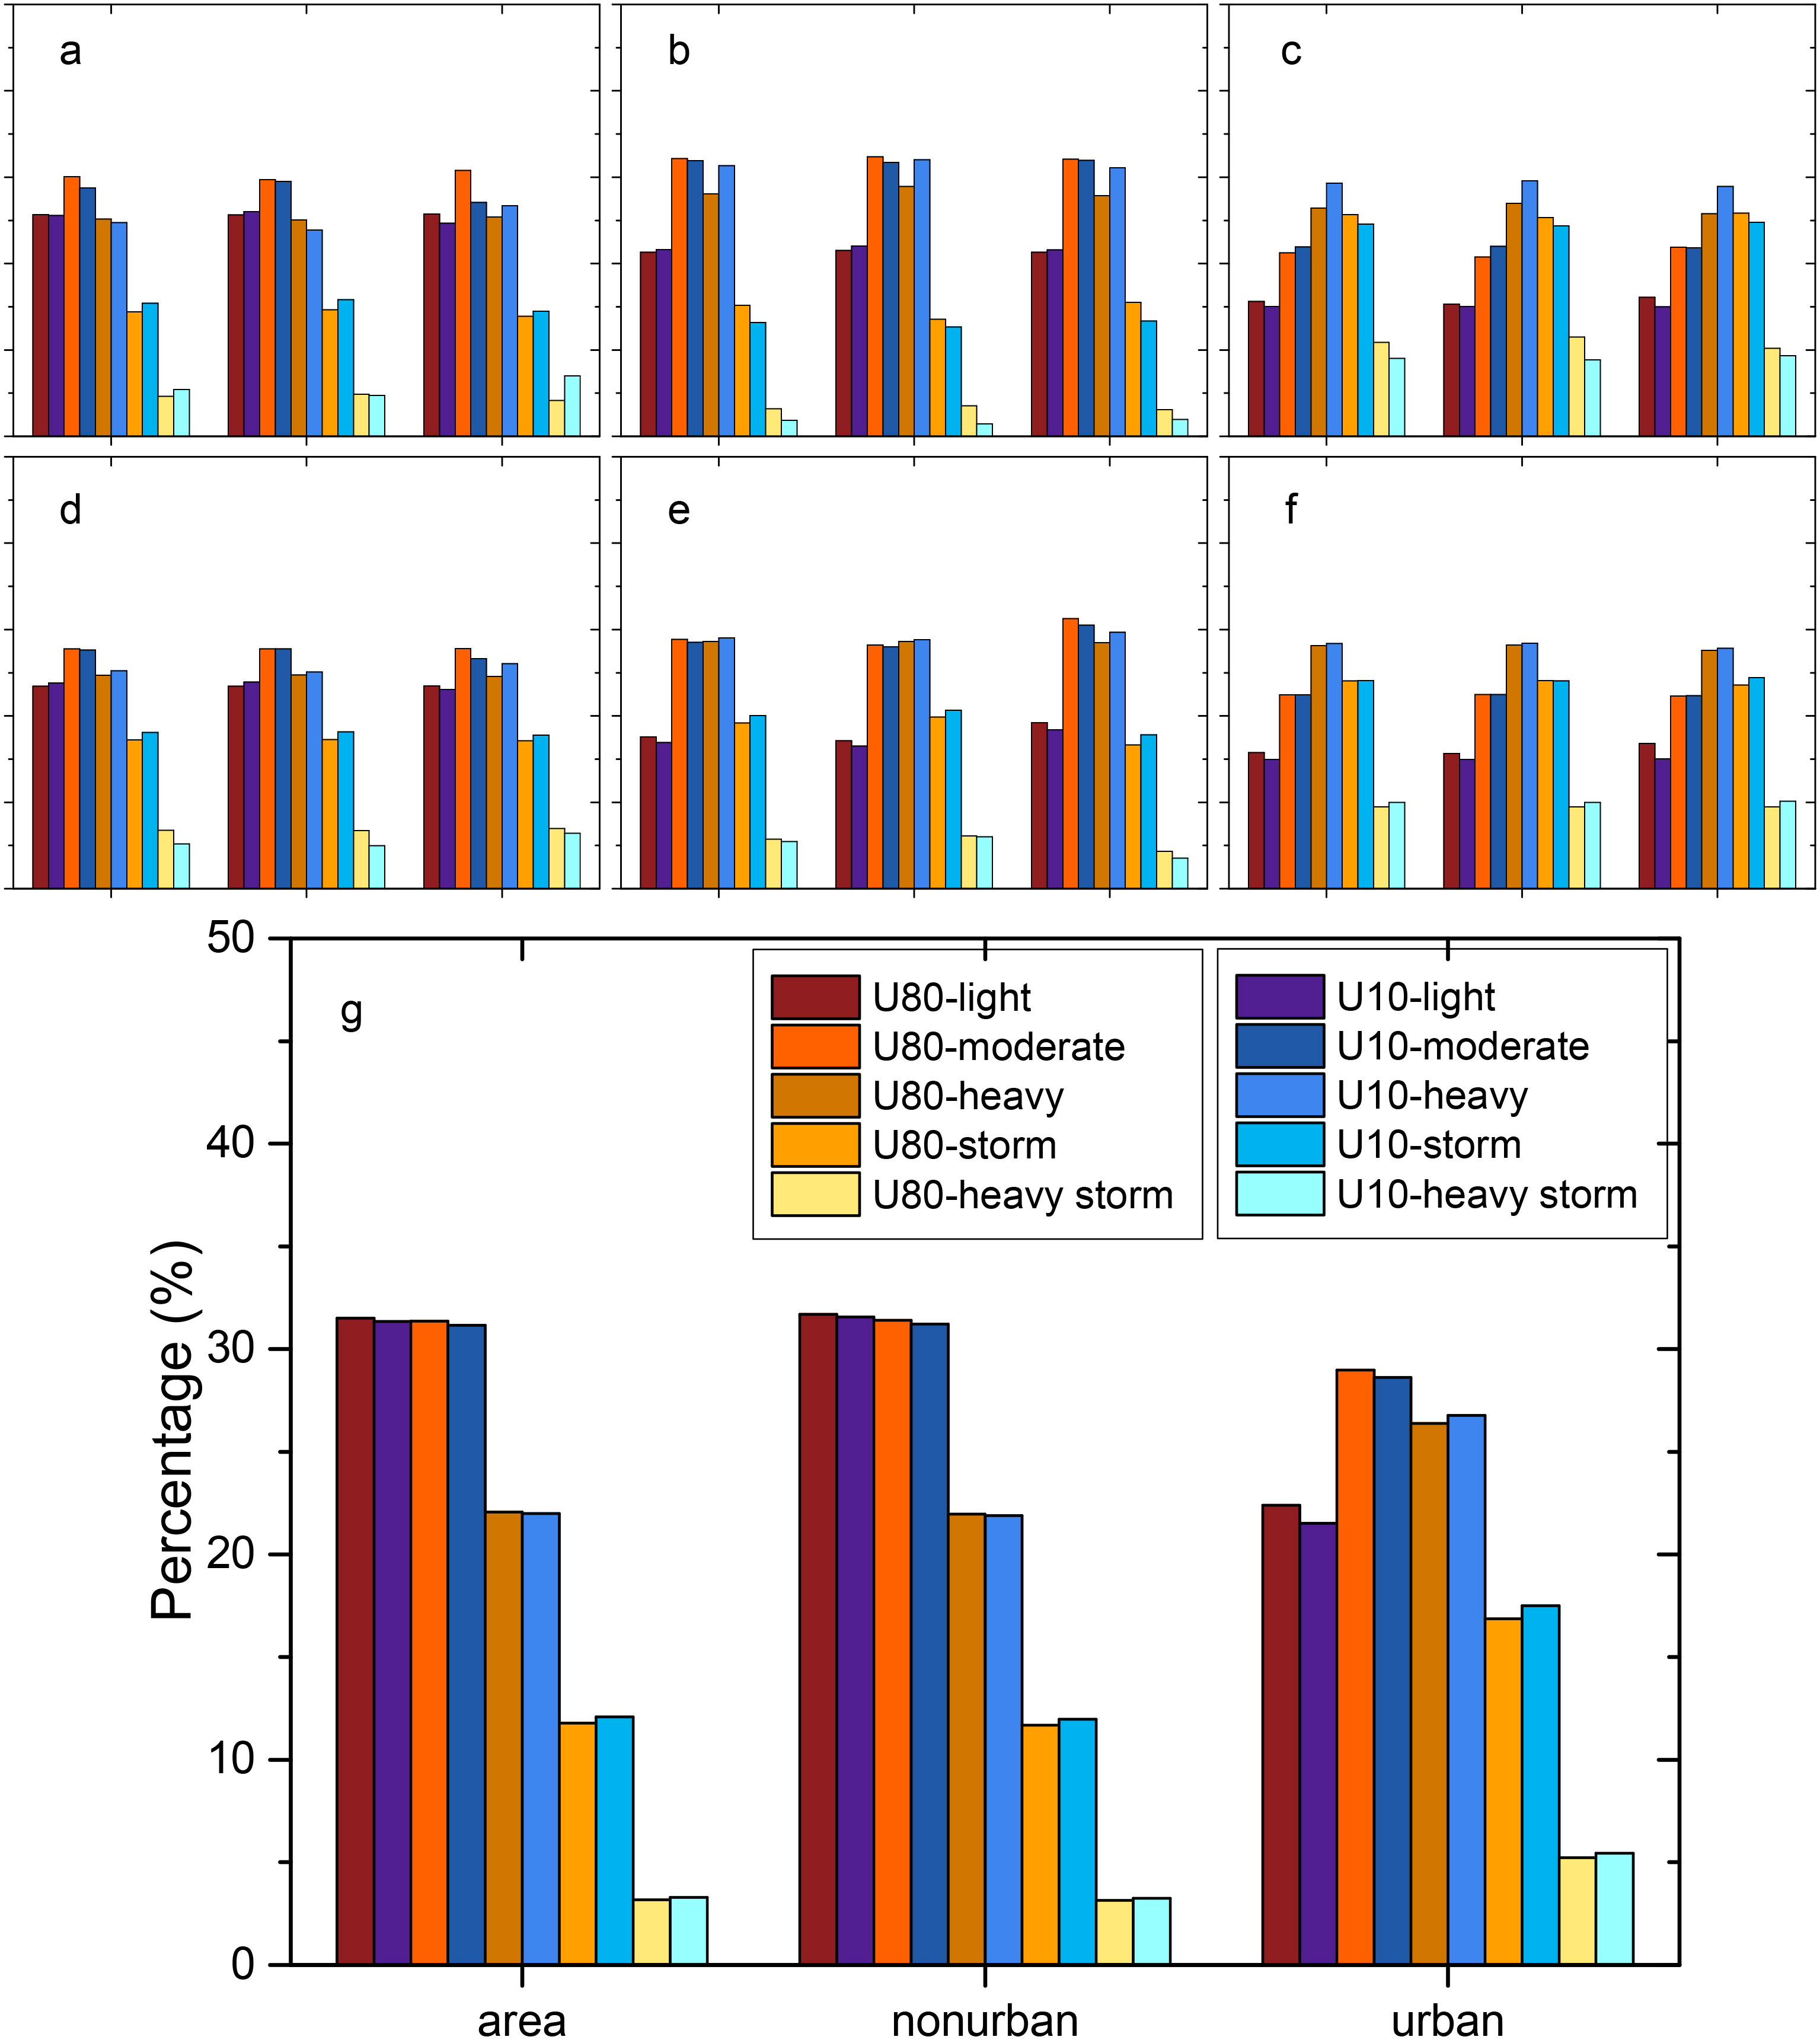
Fig. 4.
Percentages of VRAIN for various intensity levels of rainfall over different subregions (a: Beijing, b: Shanghai, c: Guangzhou, d: BTH, e: YRD, f: PRD, g: China) under U80 and U10.
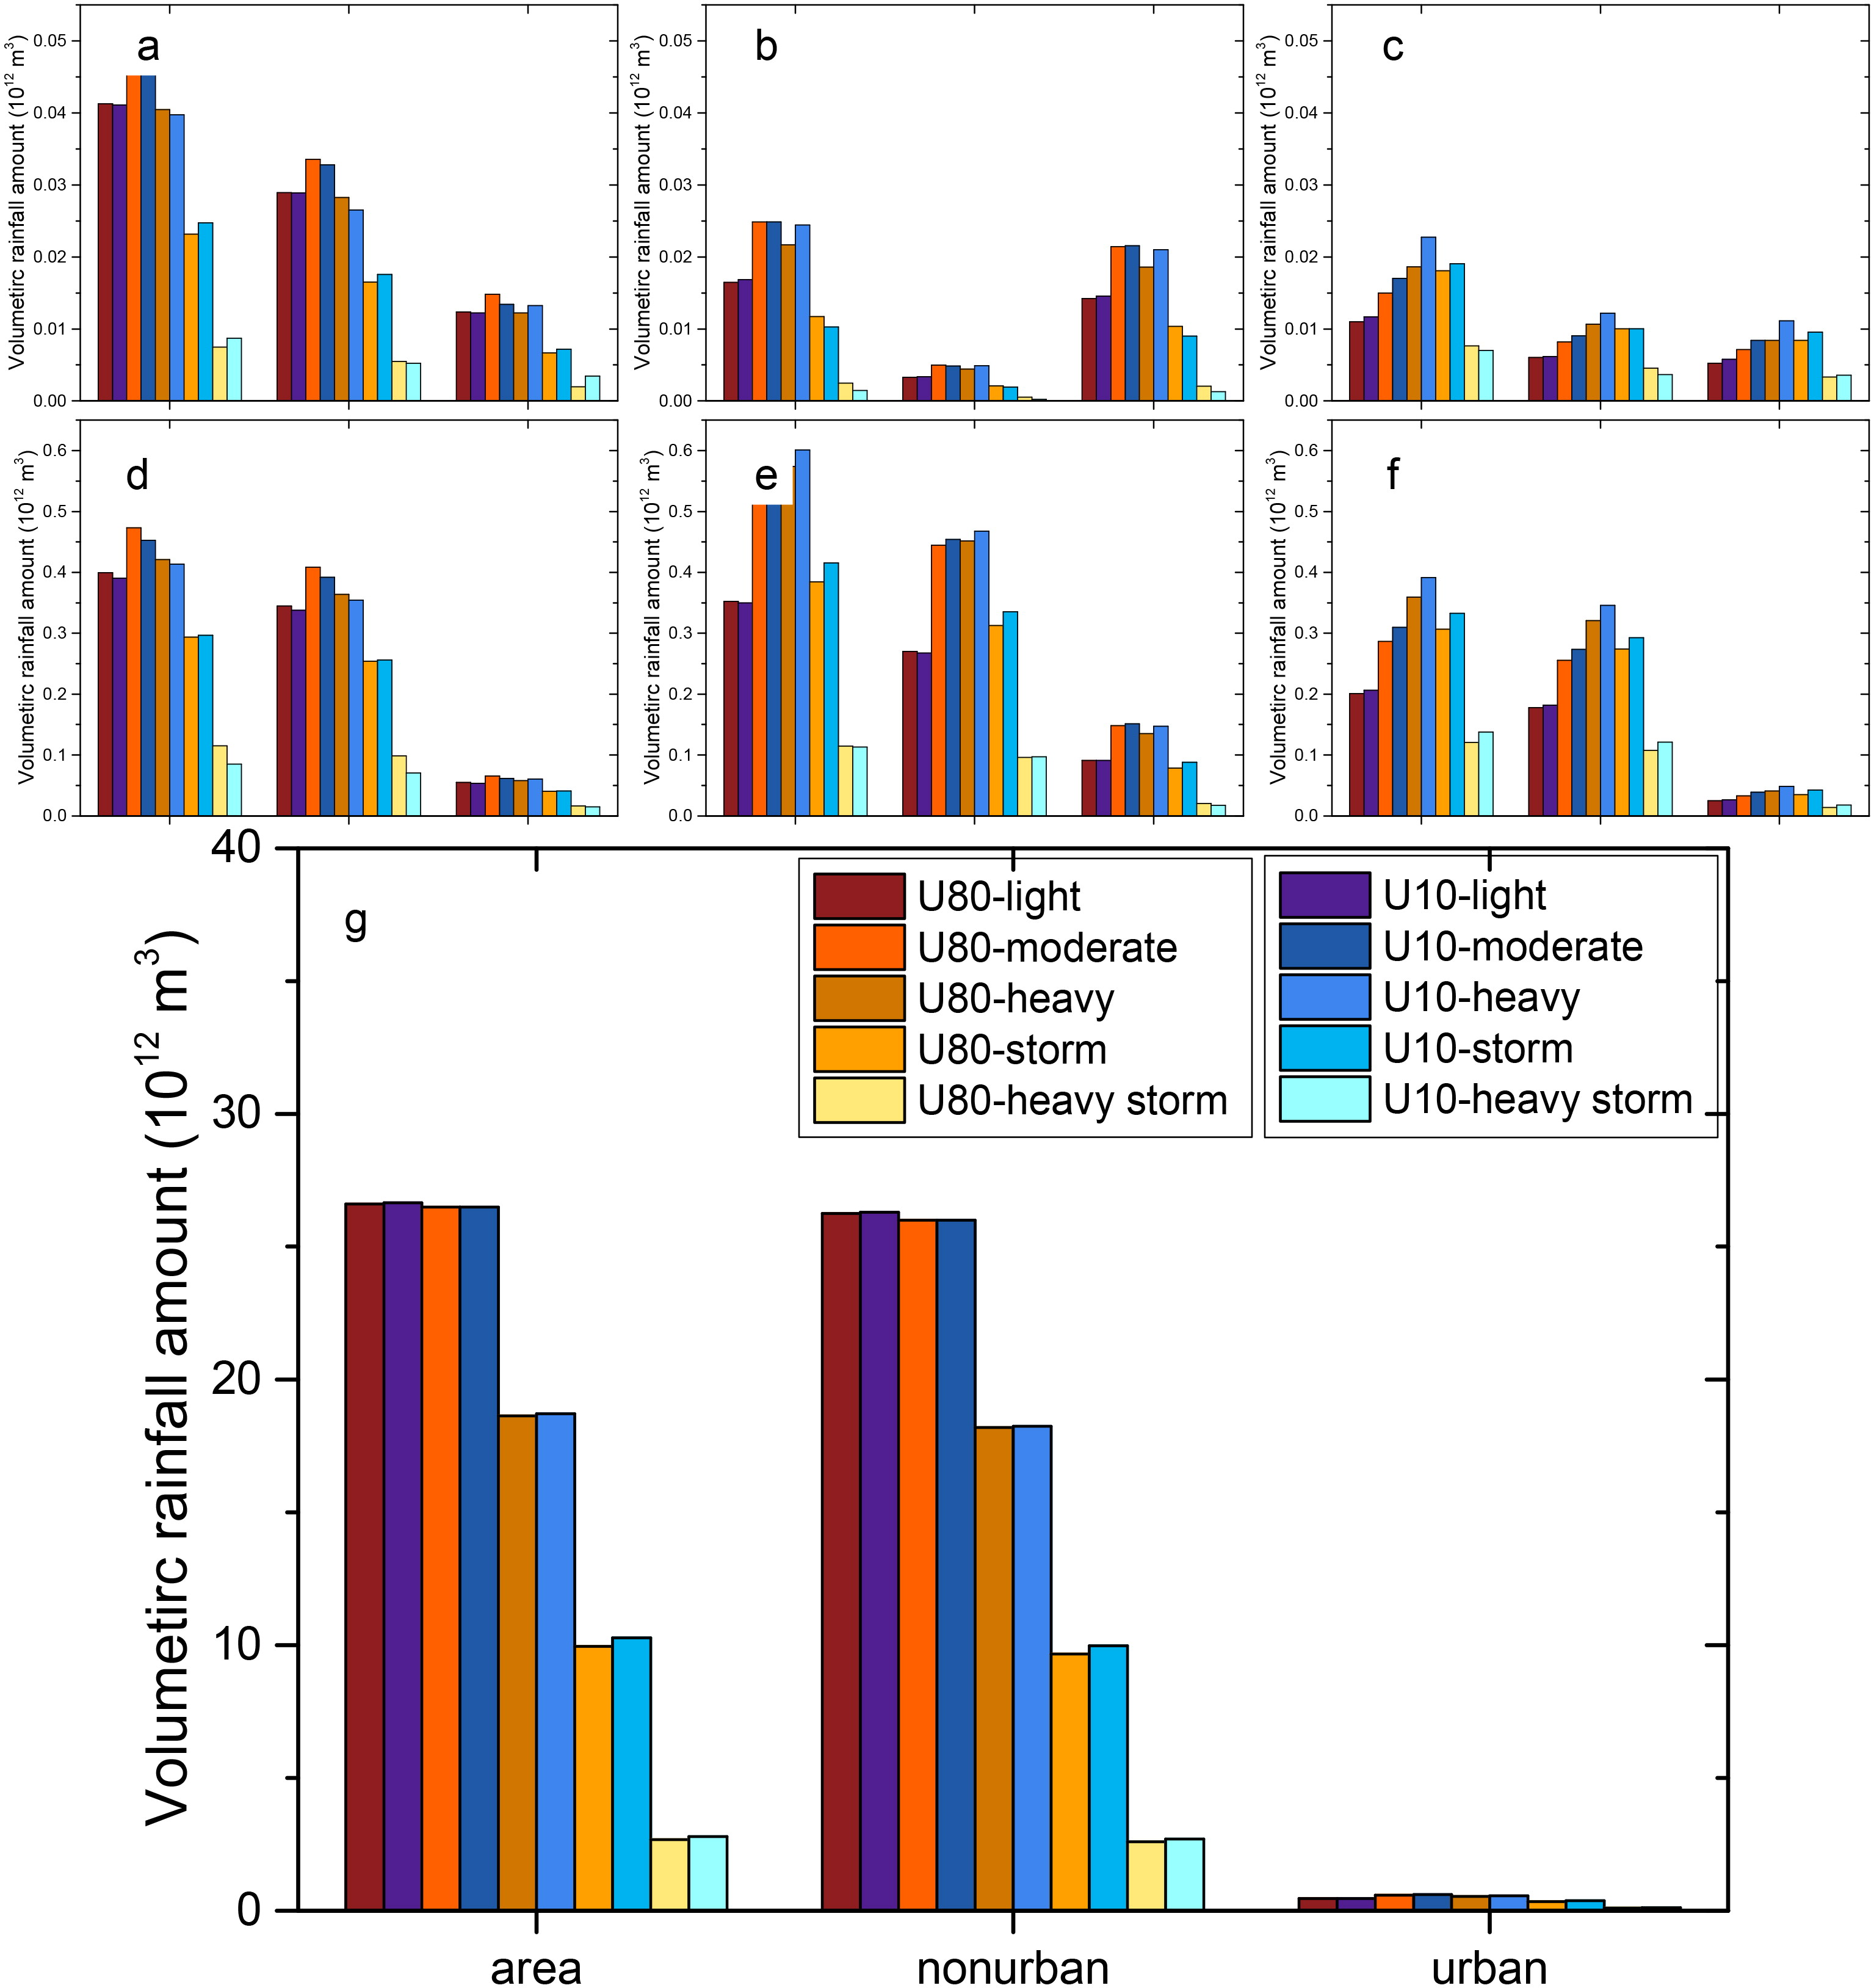
Fig. 5.
VRAIN for various intensity levels of rainfall over different subregions (a: Beijing, b: Shanghai, c: Guangzhou, d: BTH, e: YRD, f: PRD, g: China) under U80 and U10.
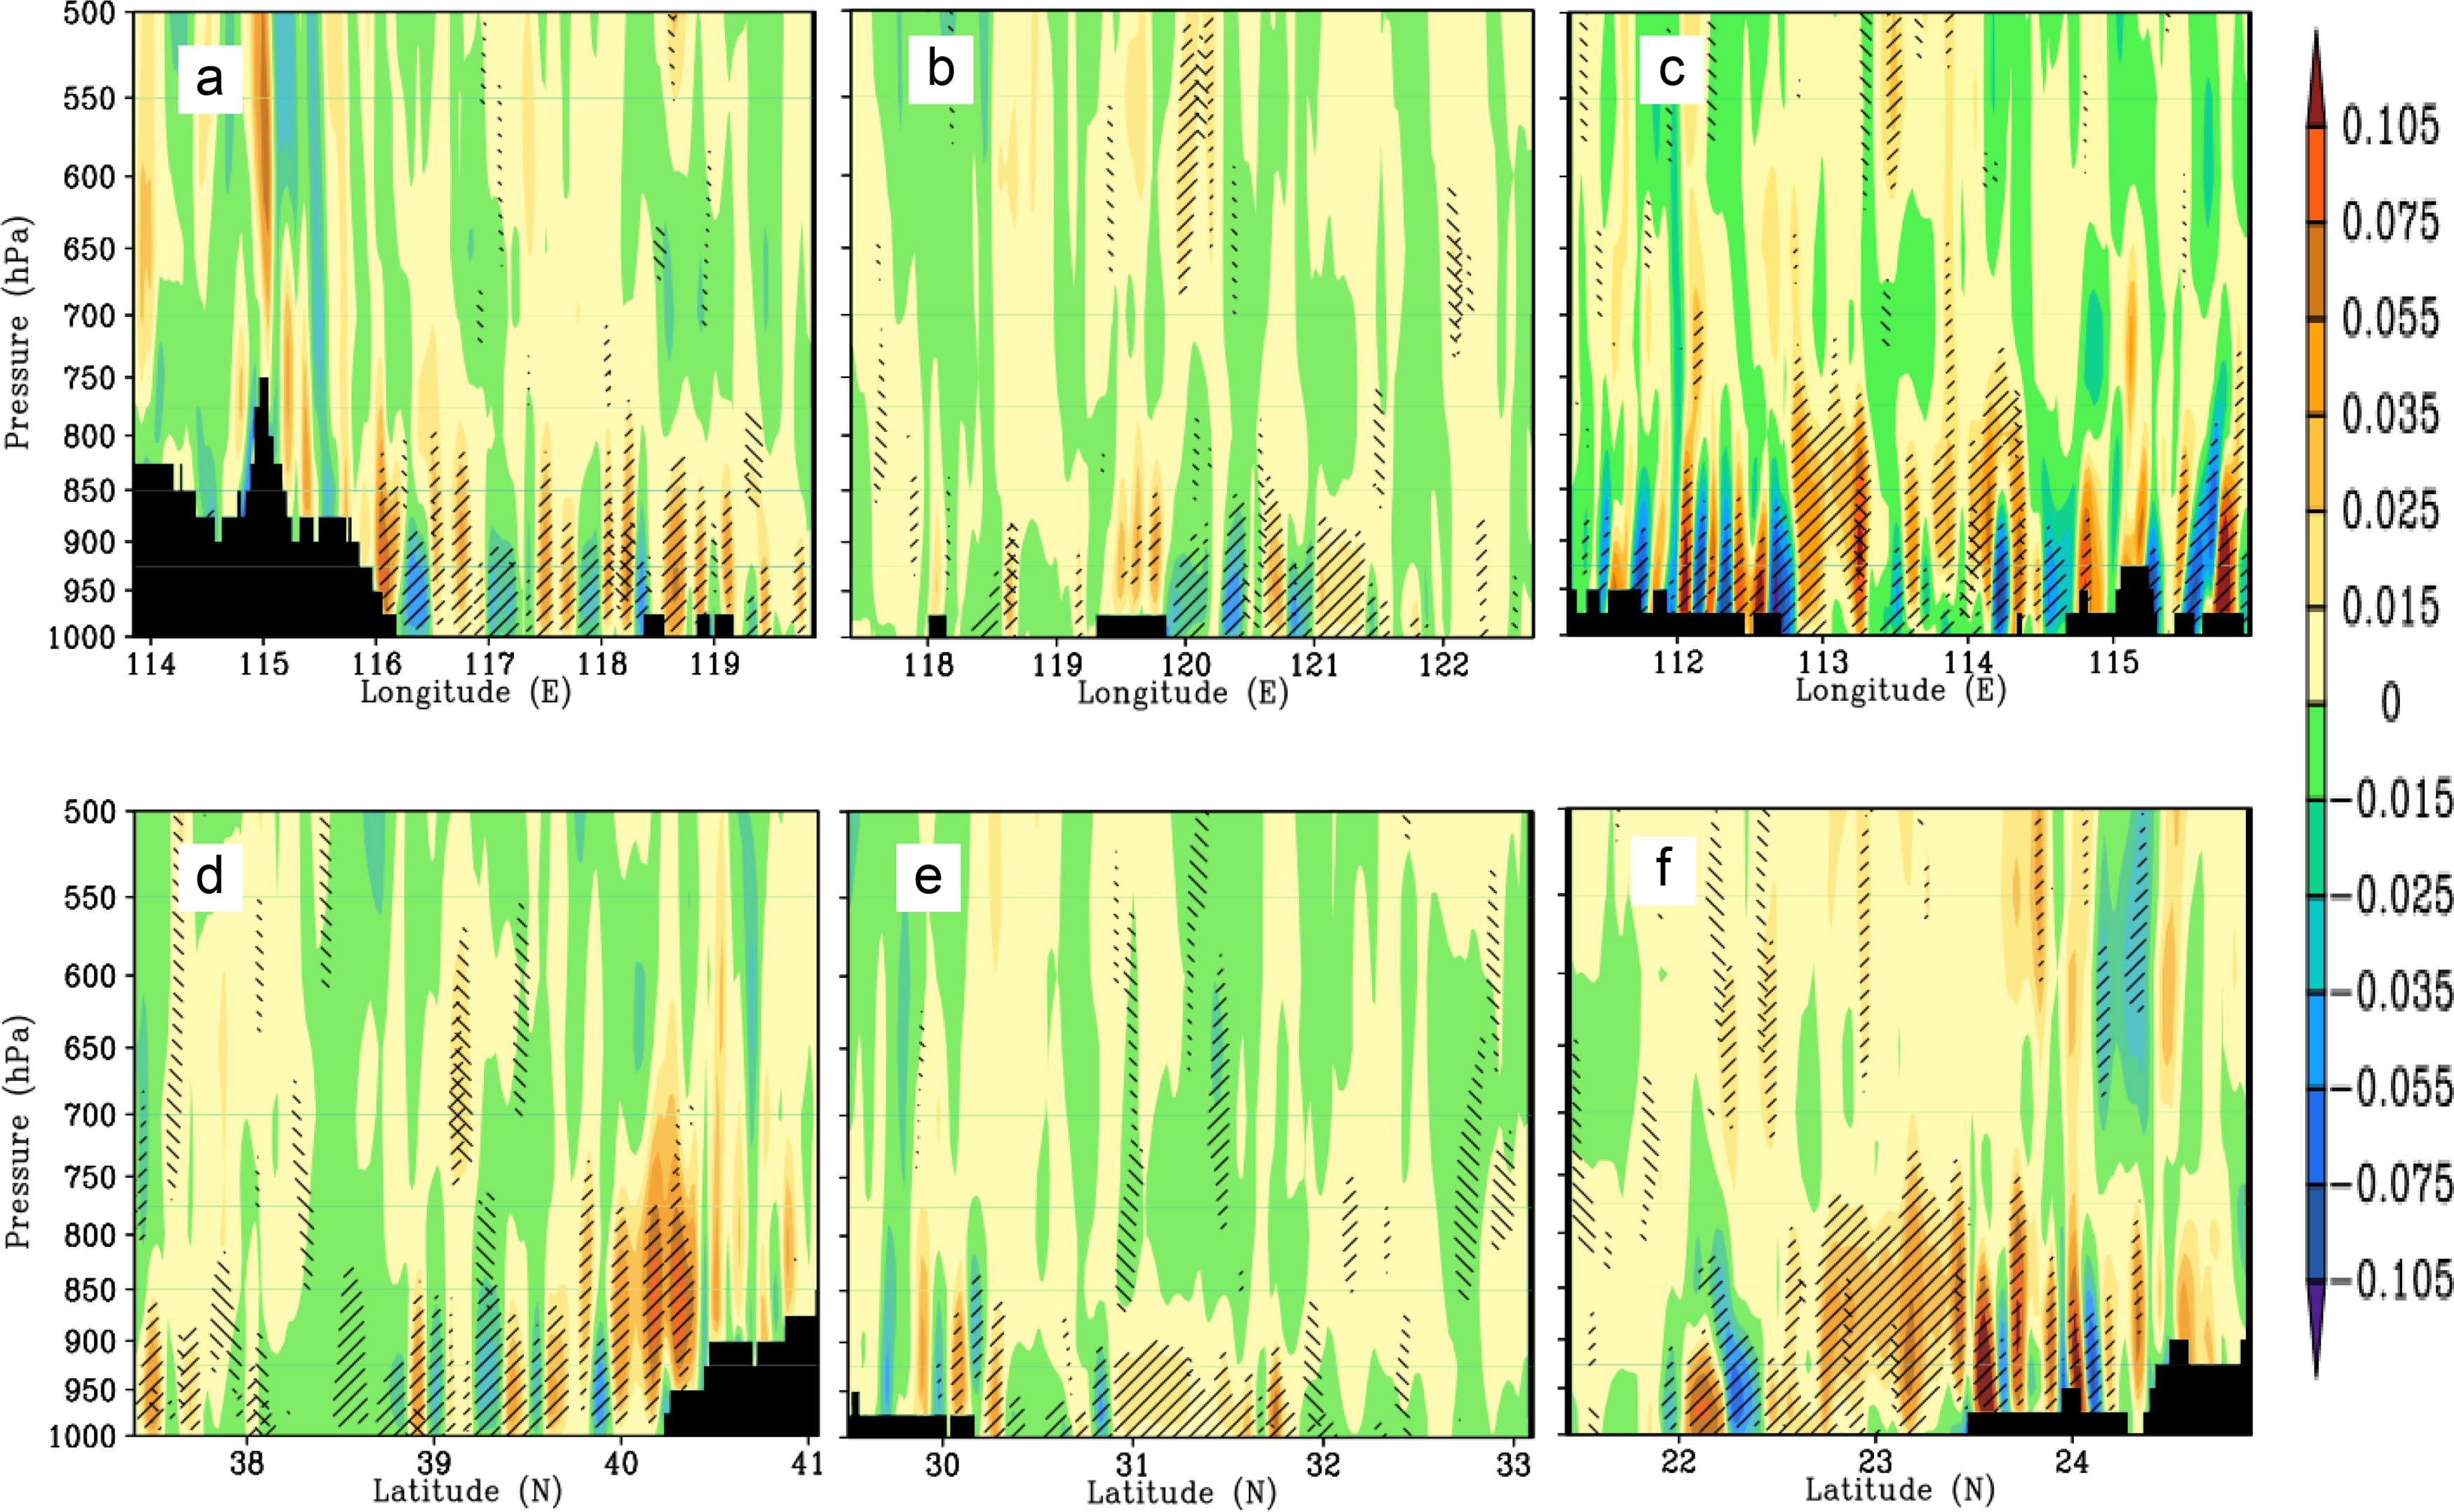
Fig. 6.
Pressure (a–c) longitudinal and (d–f) latitudinal cross-sections along the (a) 39.9°N, (b) 31.14°N, (c) 23.08°N and (d) 116.3°E, (e) 121.29°E, (f) 113.14°E axes (black areas for topography) showing changes in the vertical velocity (shaded) in annual from U10 to U80 over the three city clusters of the (a, d) BTH, (b, e) YRD and (c, f) PRD at 3.3-km resolution [units: 10−1 m s−1, slashes (/) and backslashes (\) denote areas that are significant at the 95% confidence level t tests and F tests].
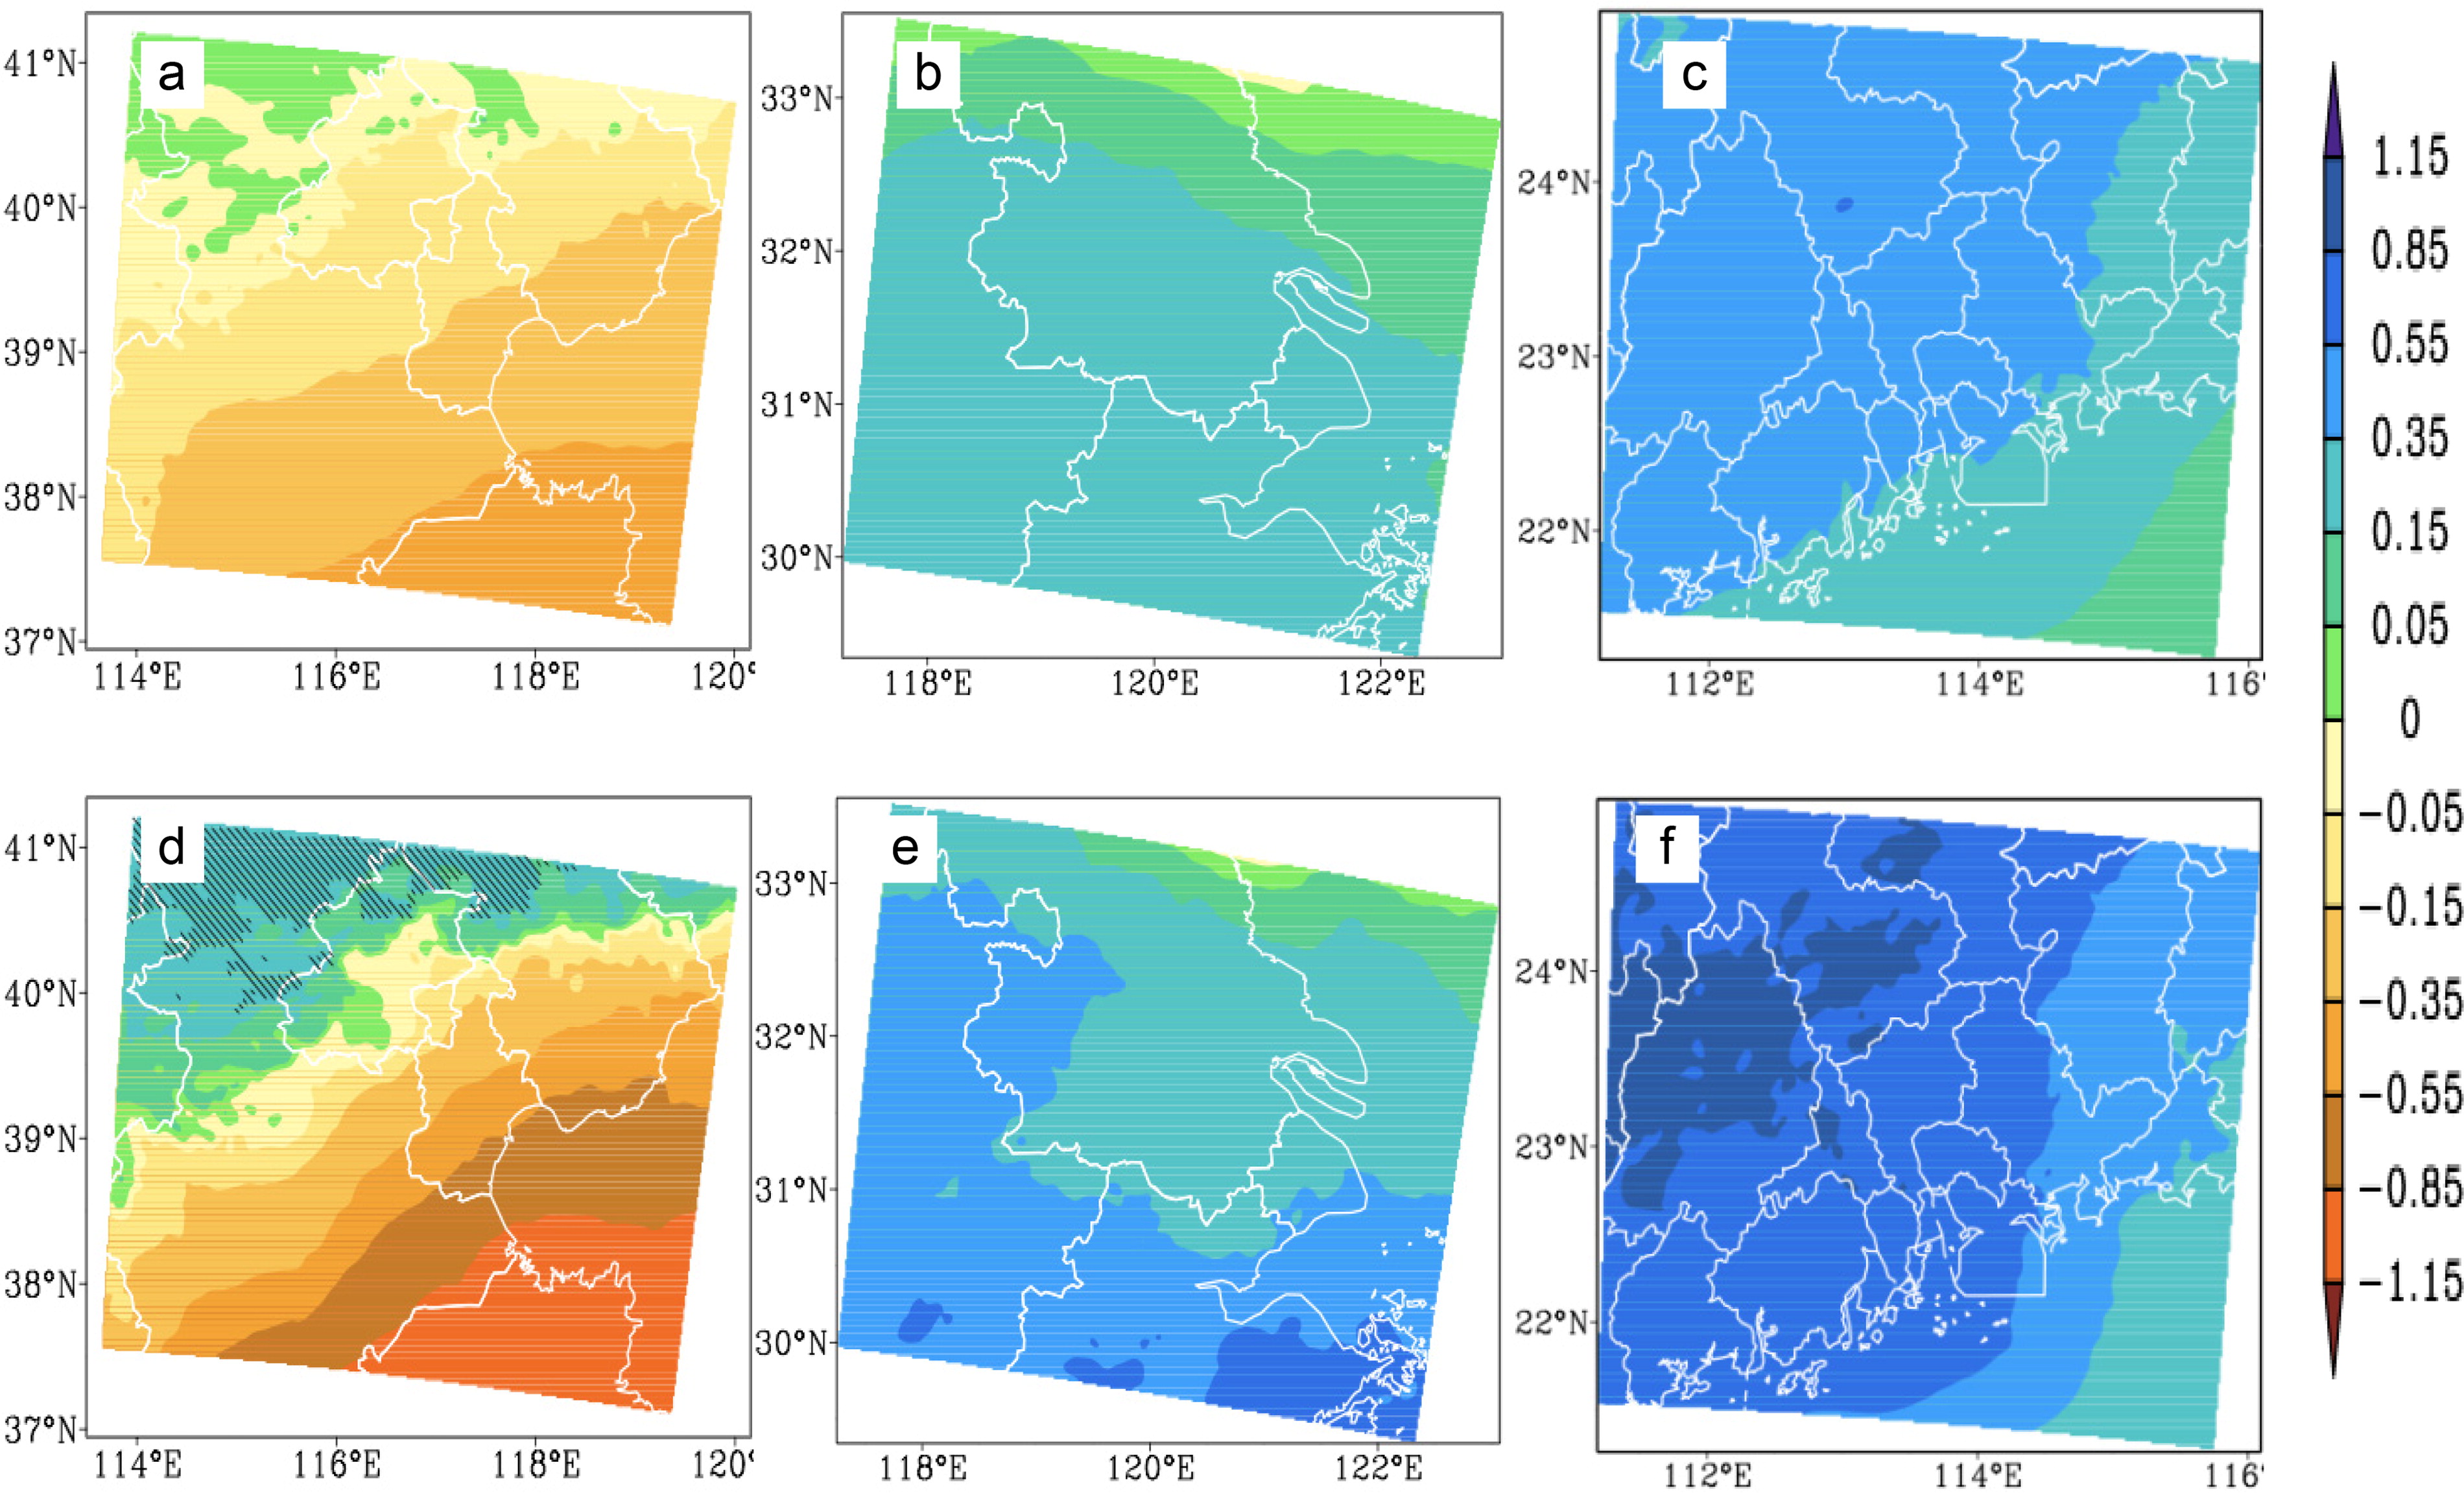
Fig. 7.
Changes in (a–c) annual and (d–f) summer precipitable water from U10 to U80 over the three city clusters of the (a, d) BTH, (b, e) YRD, and (c, f) PRD at a 3.3 km resolution (units: mm, white curves for geographic boundaries).
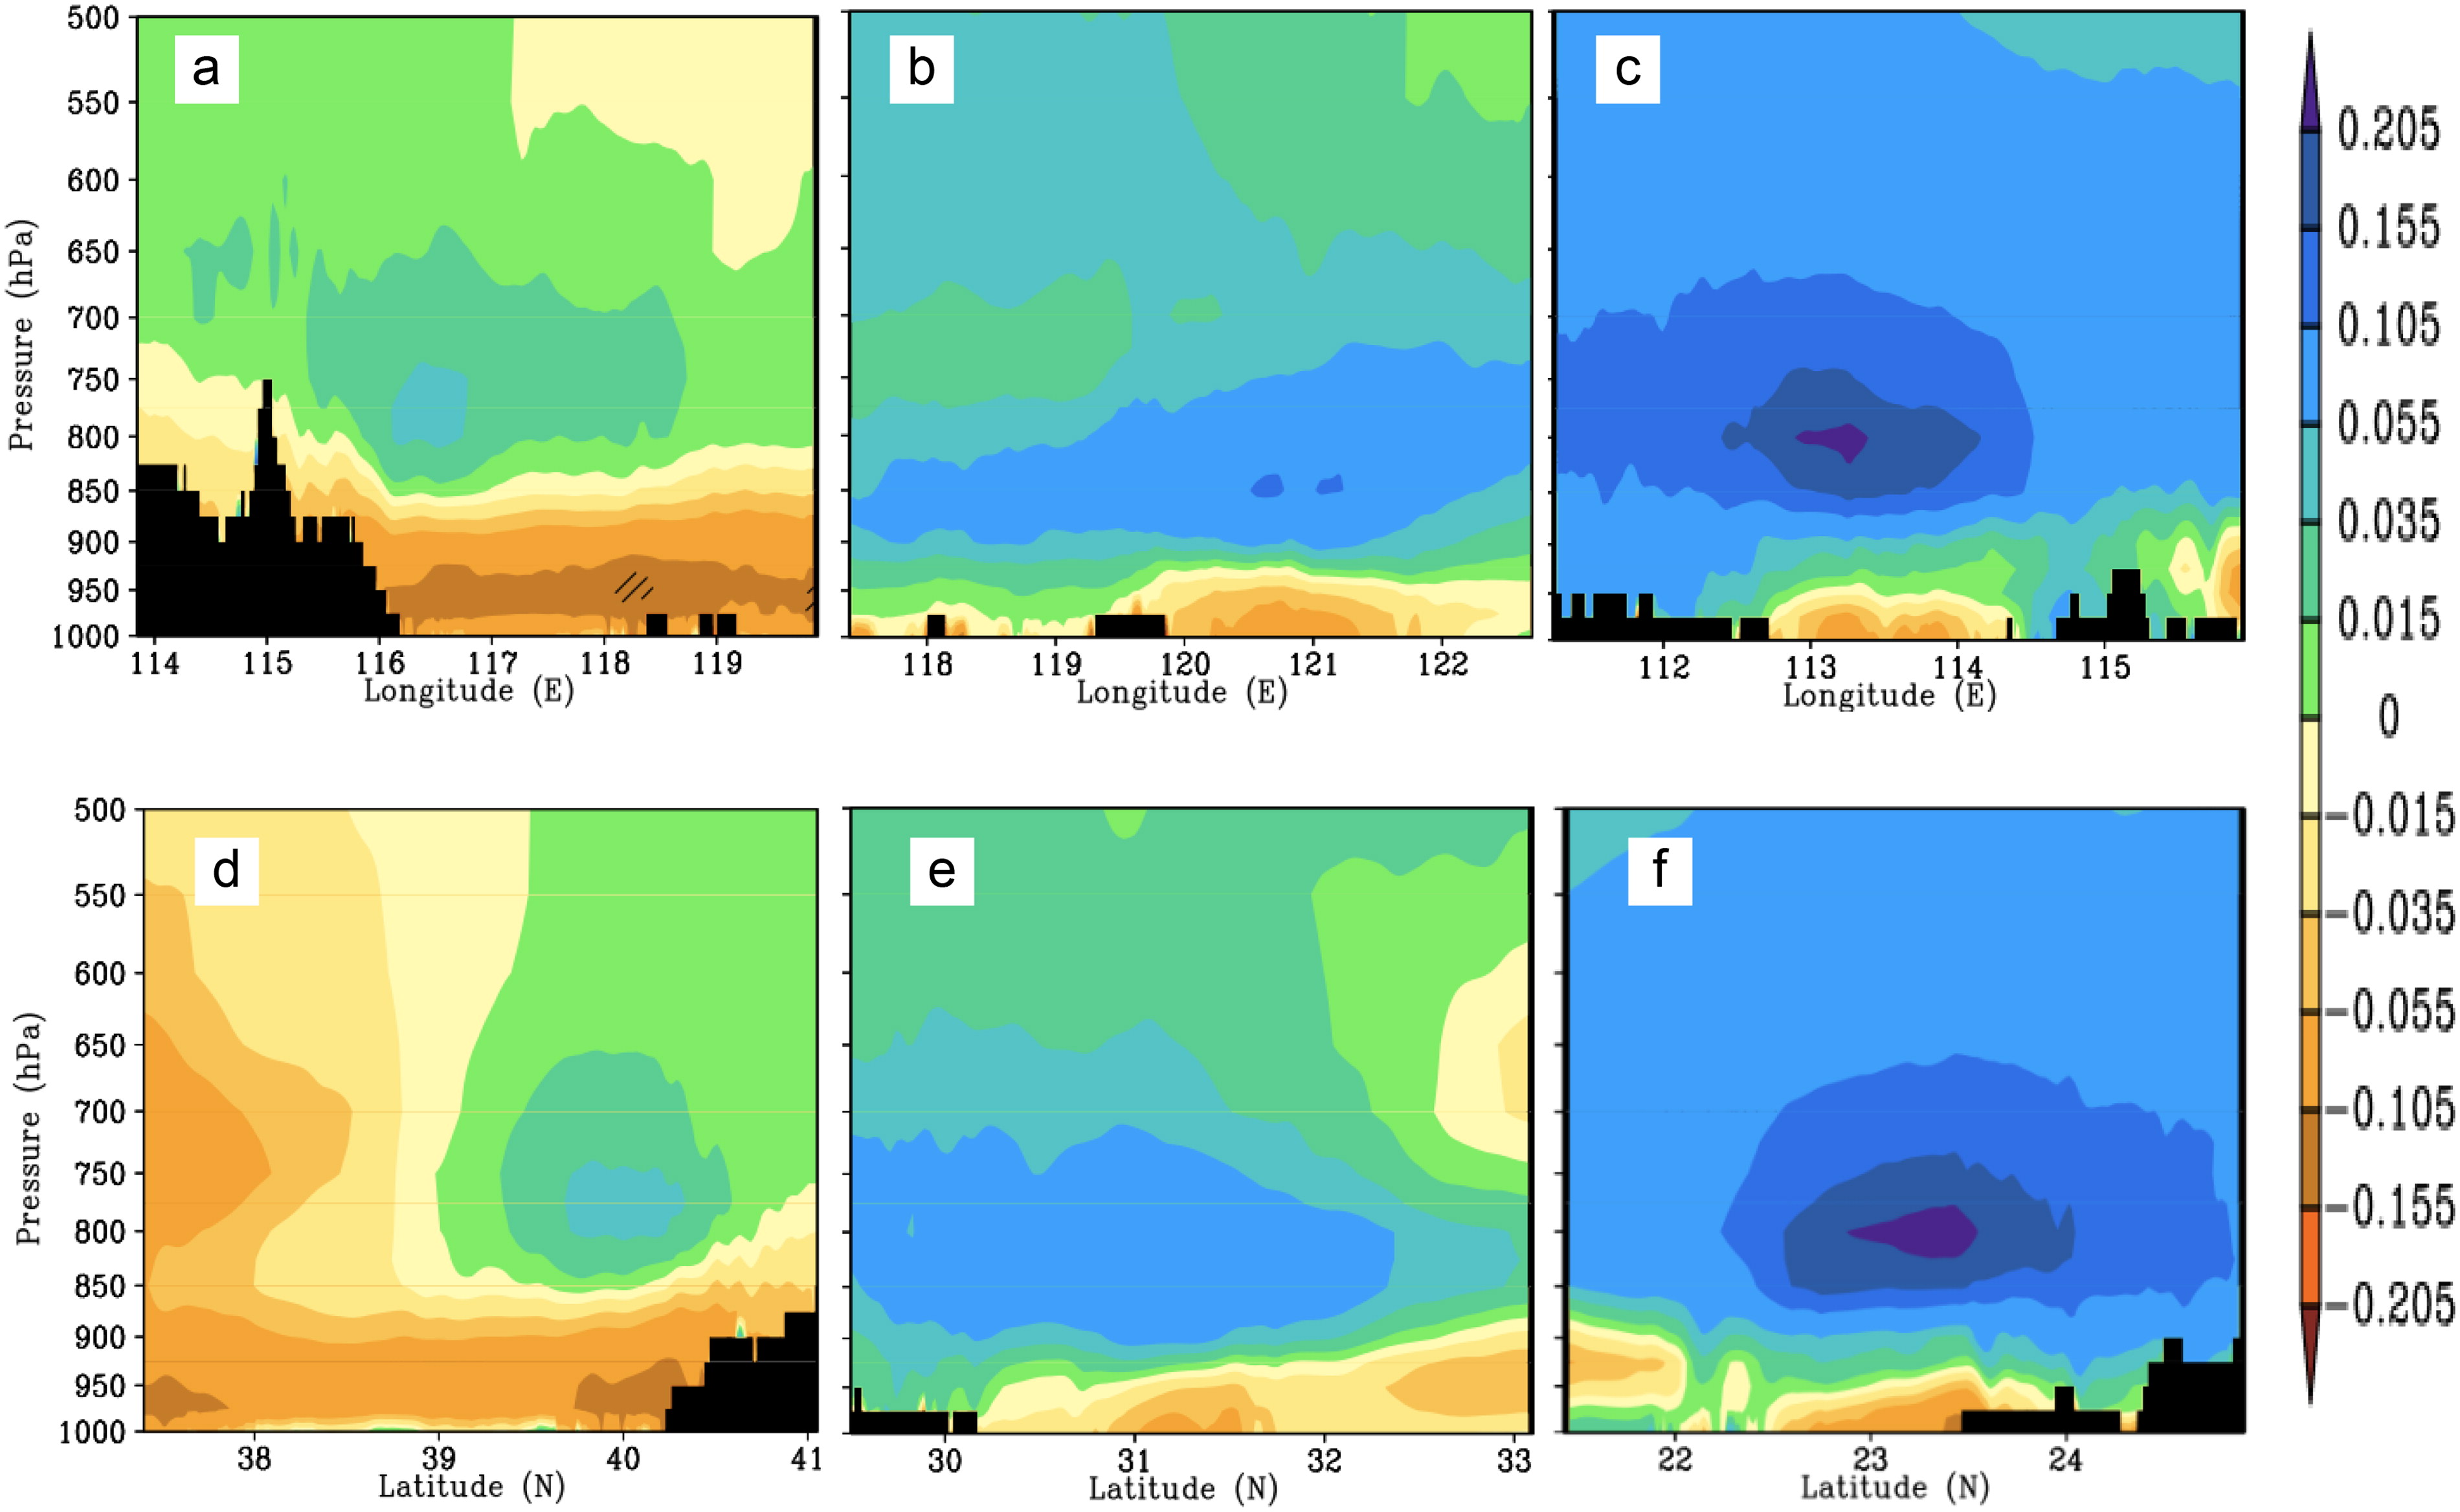
Fig. 8.
Pressure (a–c) longitudinal and (d–f) latitudinal cross-sections along the (a) 39.9°N, (b) 31.14°N, (c) 23.08°N and (d) 116.3°E, (e) 121.29°E, (f) 113.14°E axes (black areas for topography) showing changes in the water vapour mixing ratio (shaded) in annual from U10 to U80 over the three city clusters of the (a, d) BTH, (b, e) YRD, and (c, f) PRD at 3.3-km resolution (units: 10−3 kg kg−1).
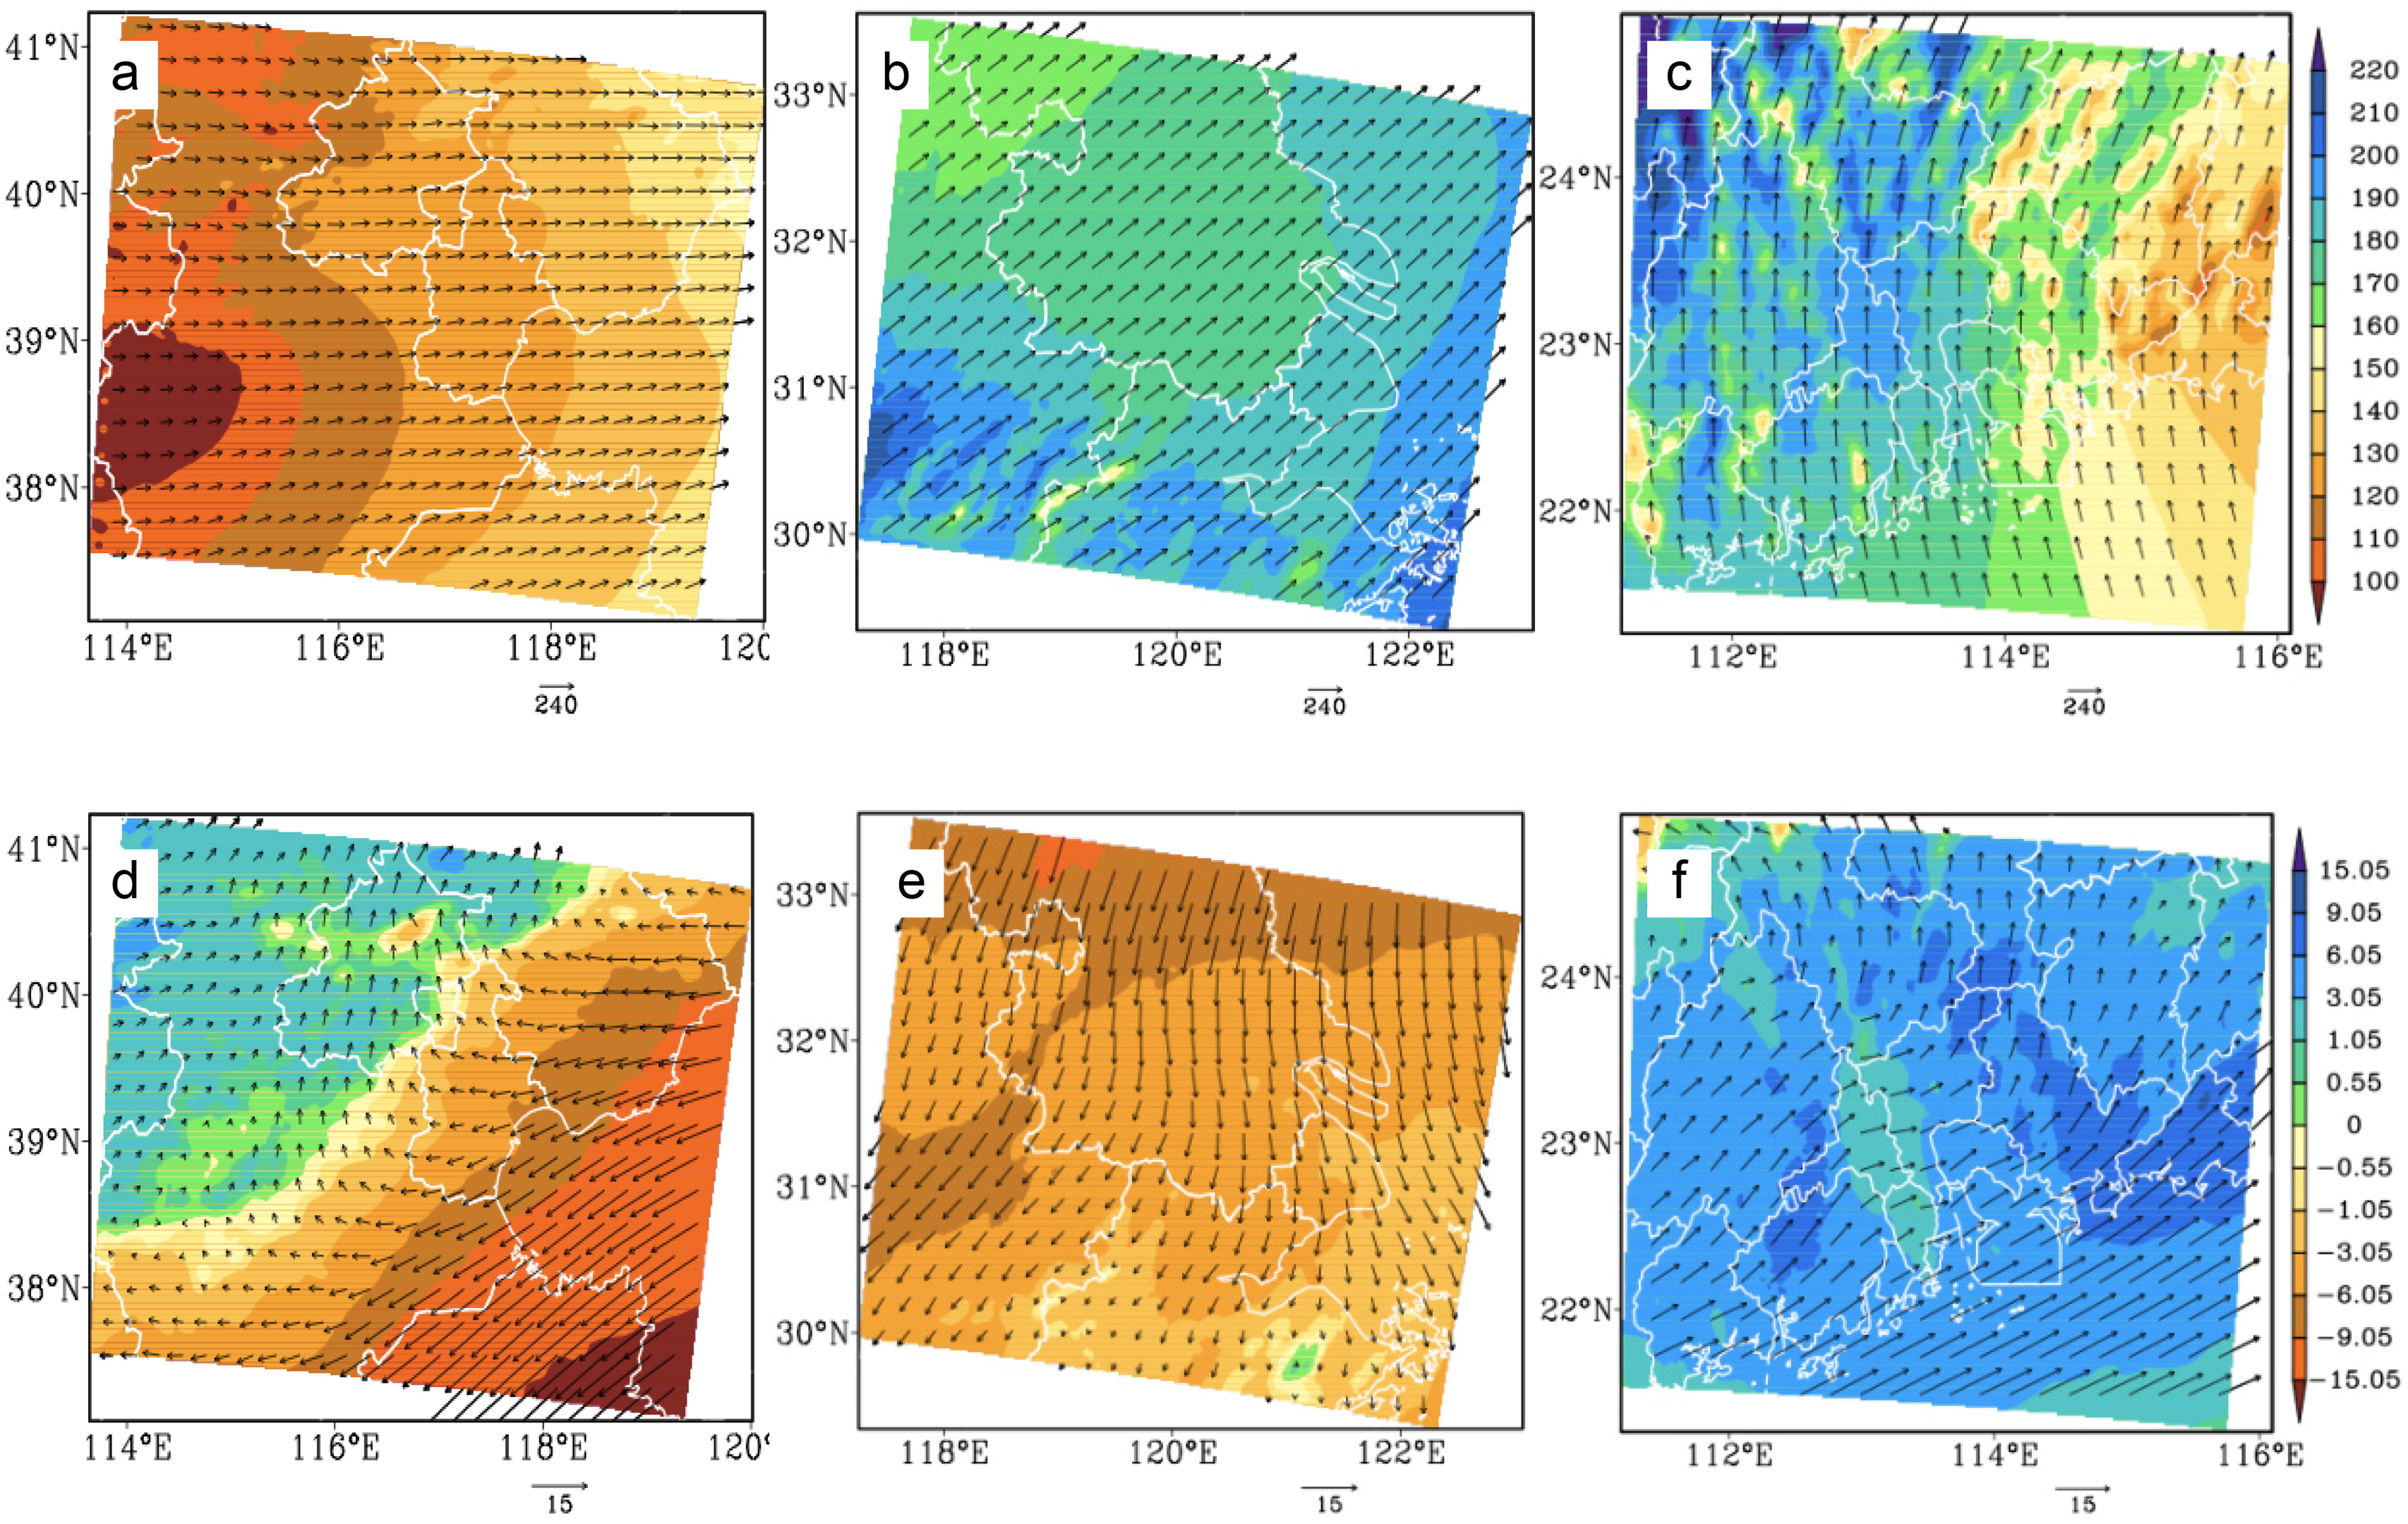
Fig. 9.
Spatial distributions of (a–c) mean moisture flux (shaded) and vectors for U80, and (d–f) the corresponding changes from U10 to U80 across the whole troposphere in the summer over the three city clusters of the (a, d) BTH, (b, e) YRD, and (c, f) PRD at 3.3-km resolution (units: 10−3 kg m−1 s−1, white curves for geographic boundaries].
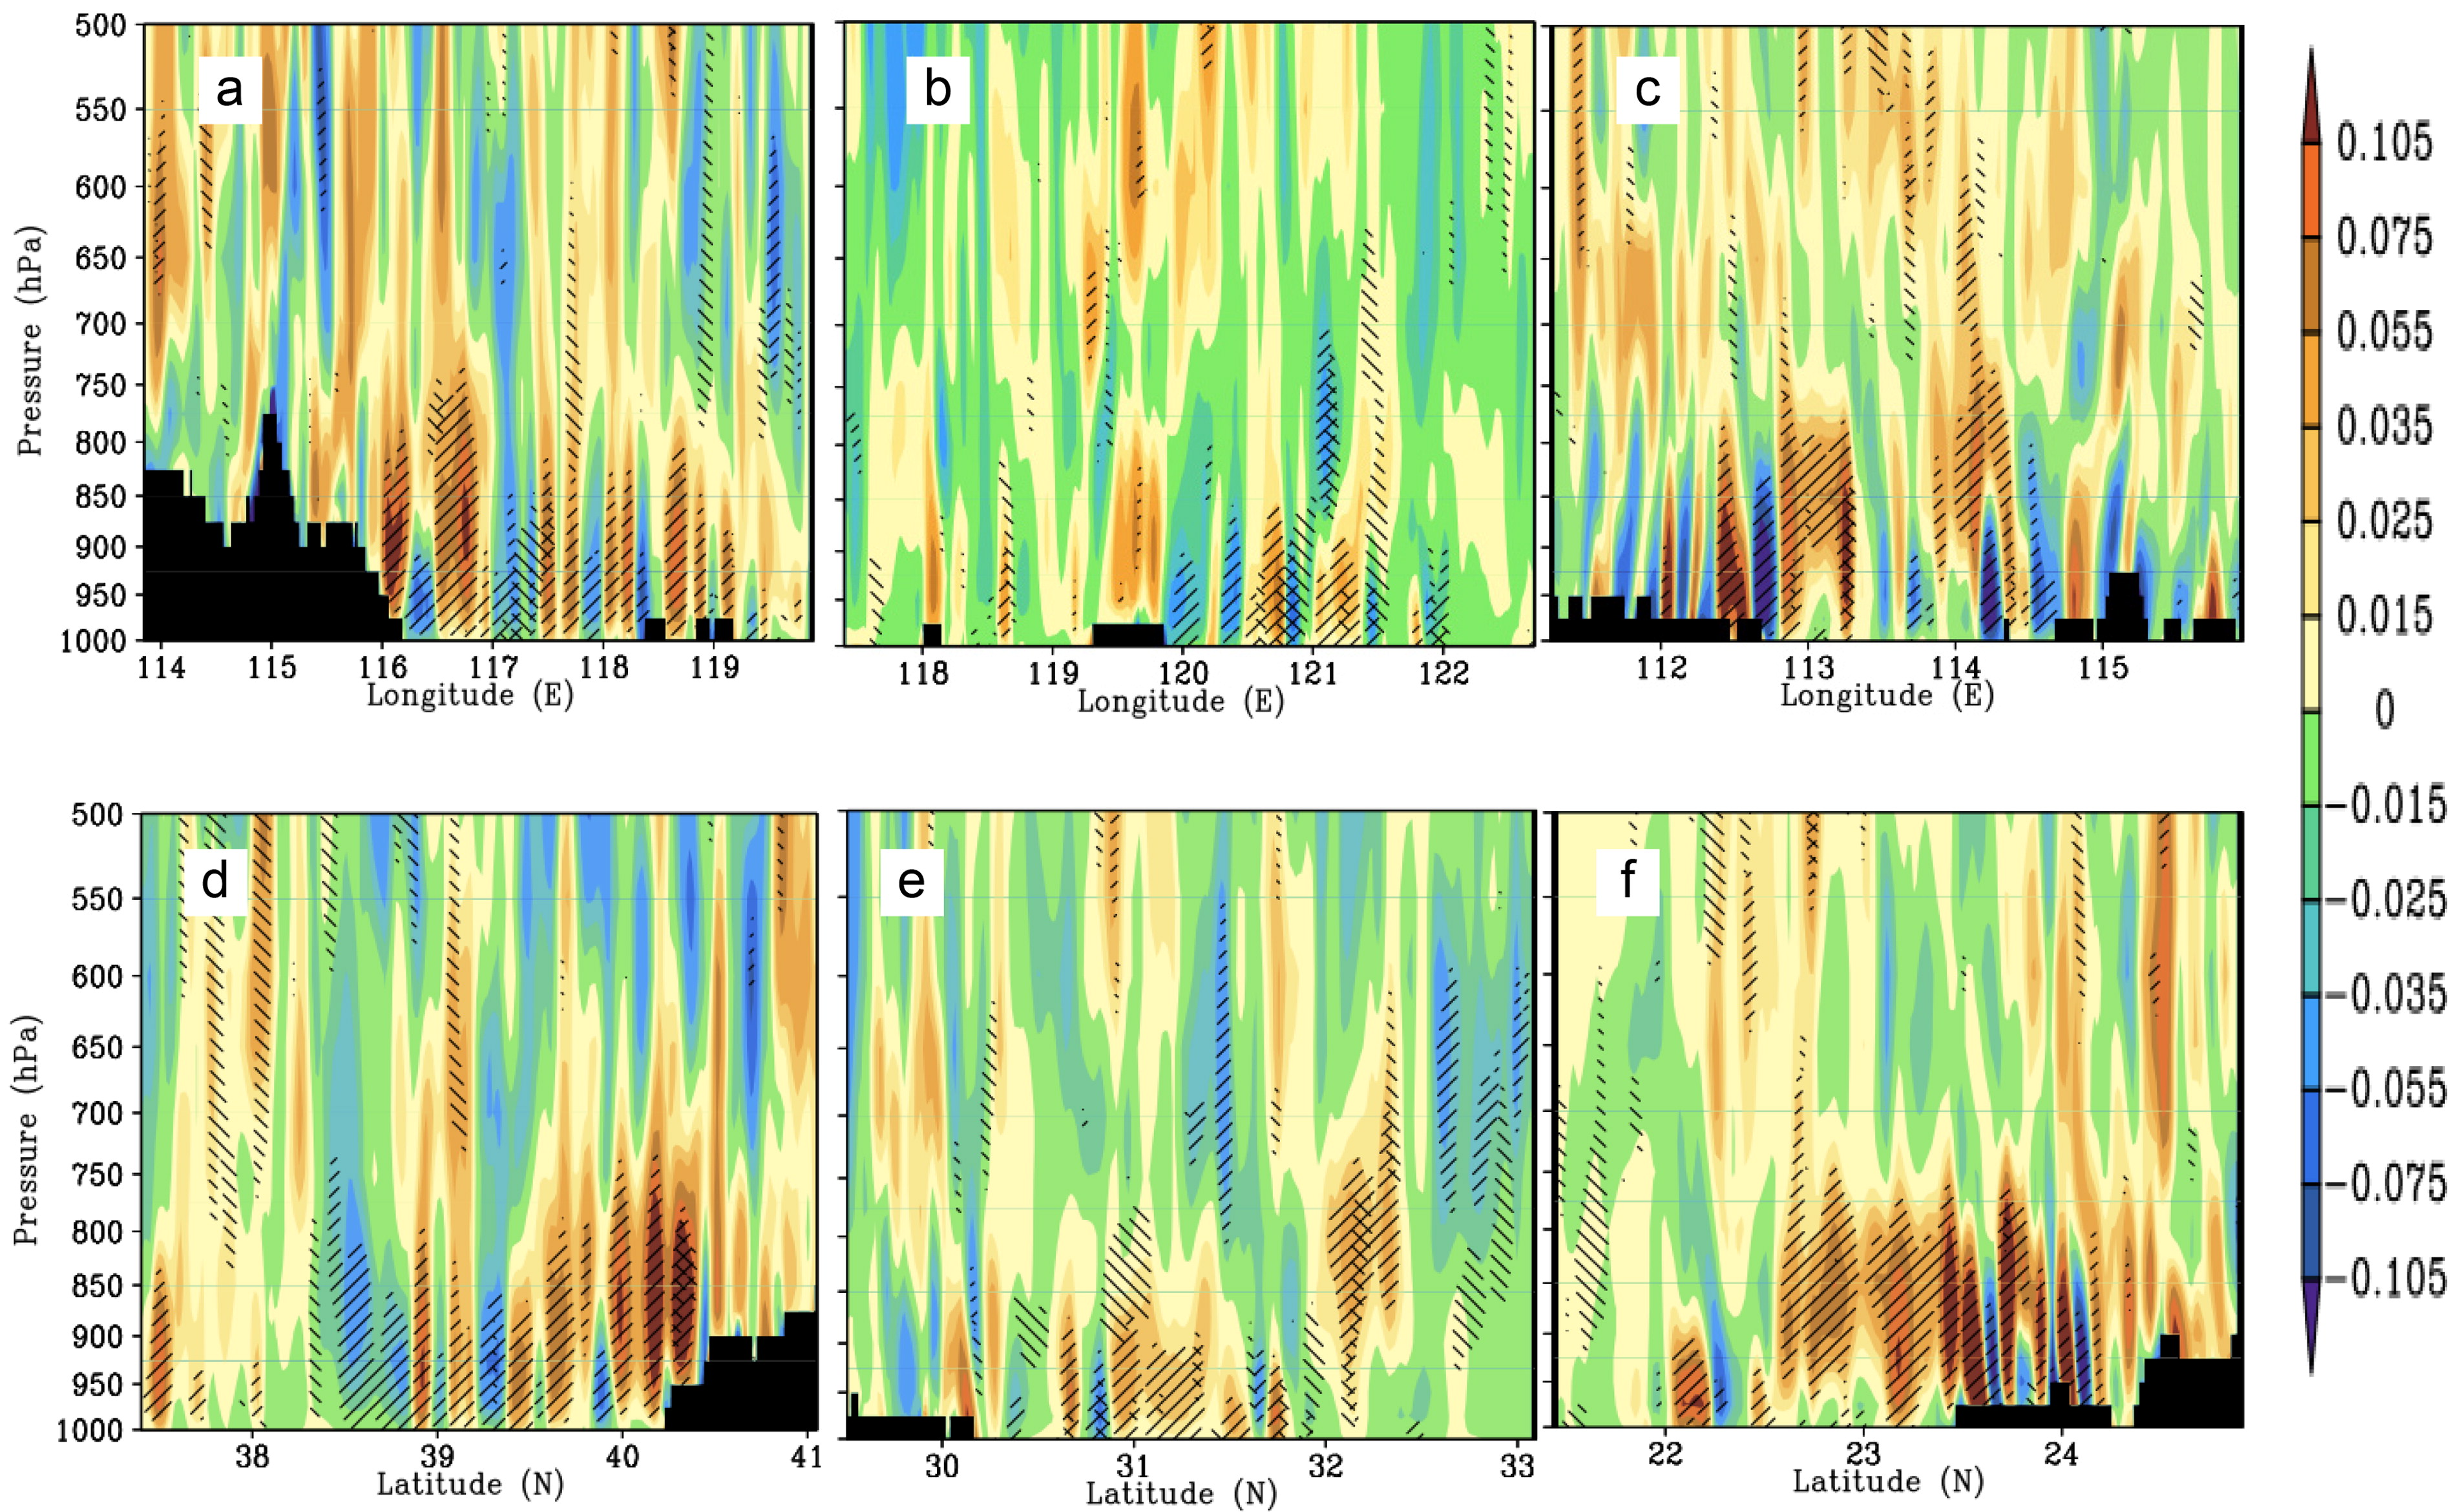
Fig. 10.
Same as Fig. 6, bit for the results in the summer.
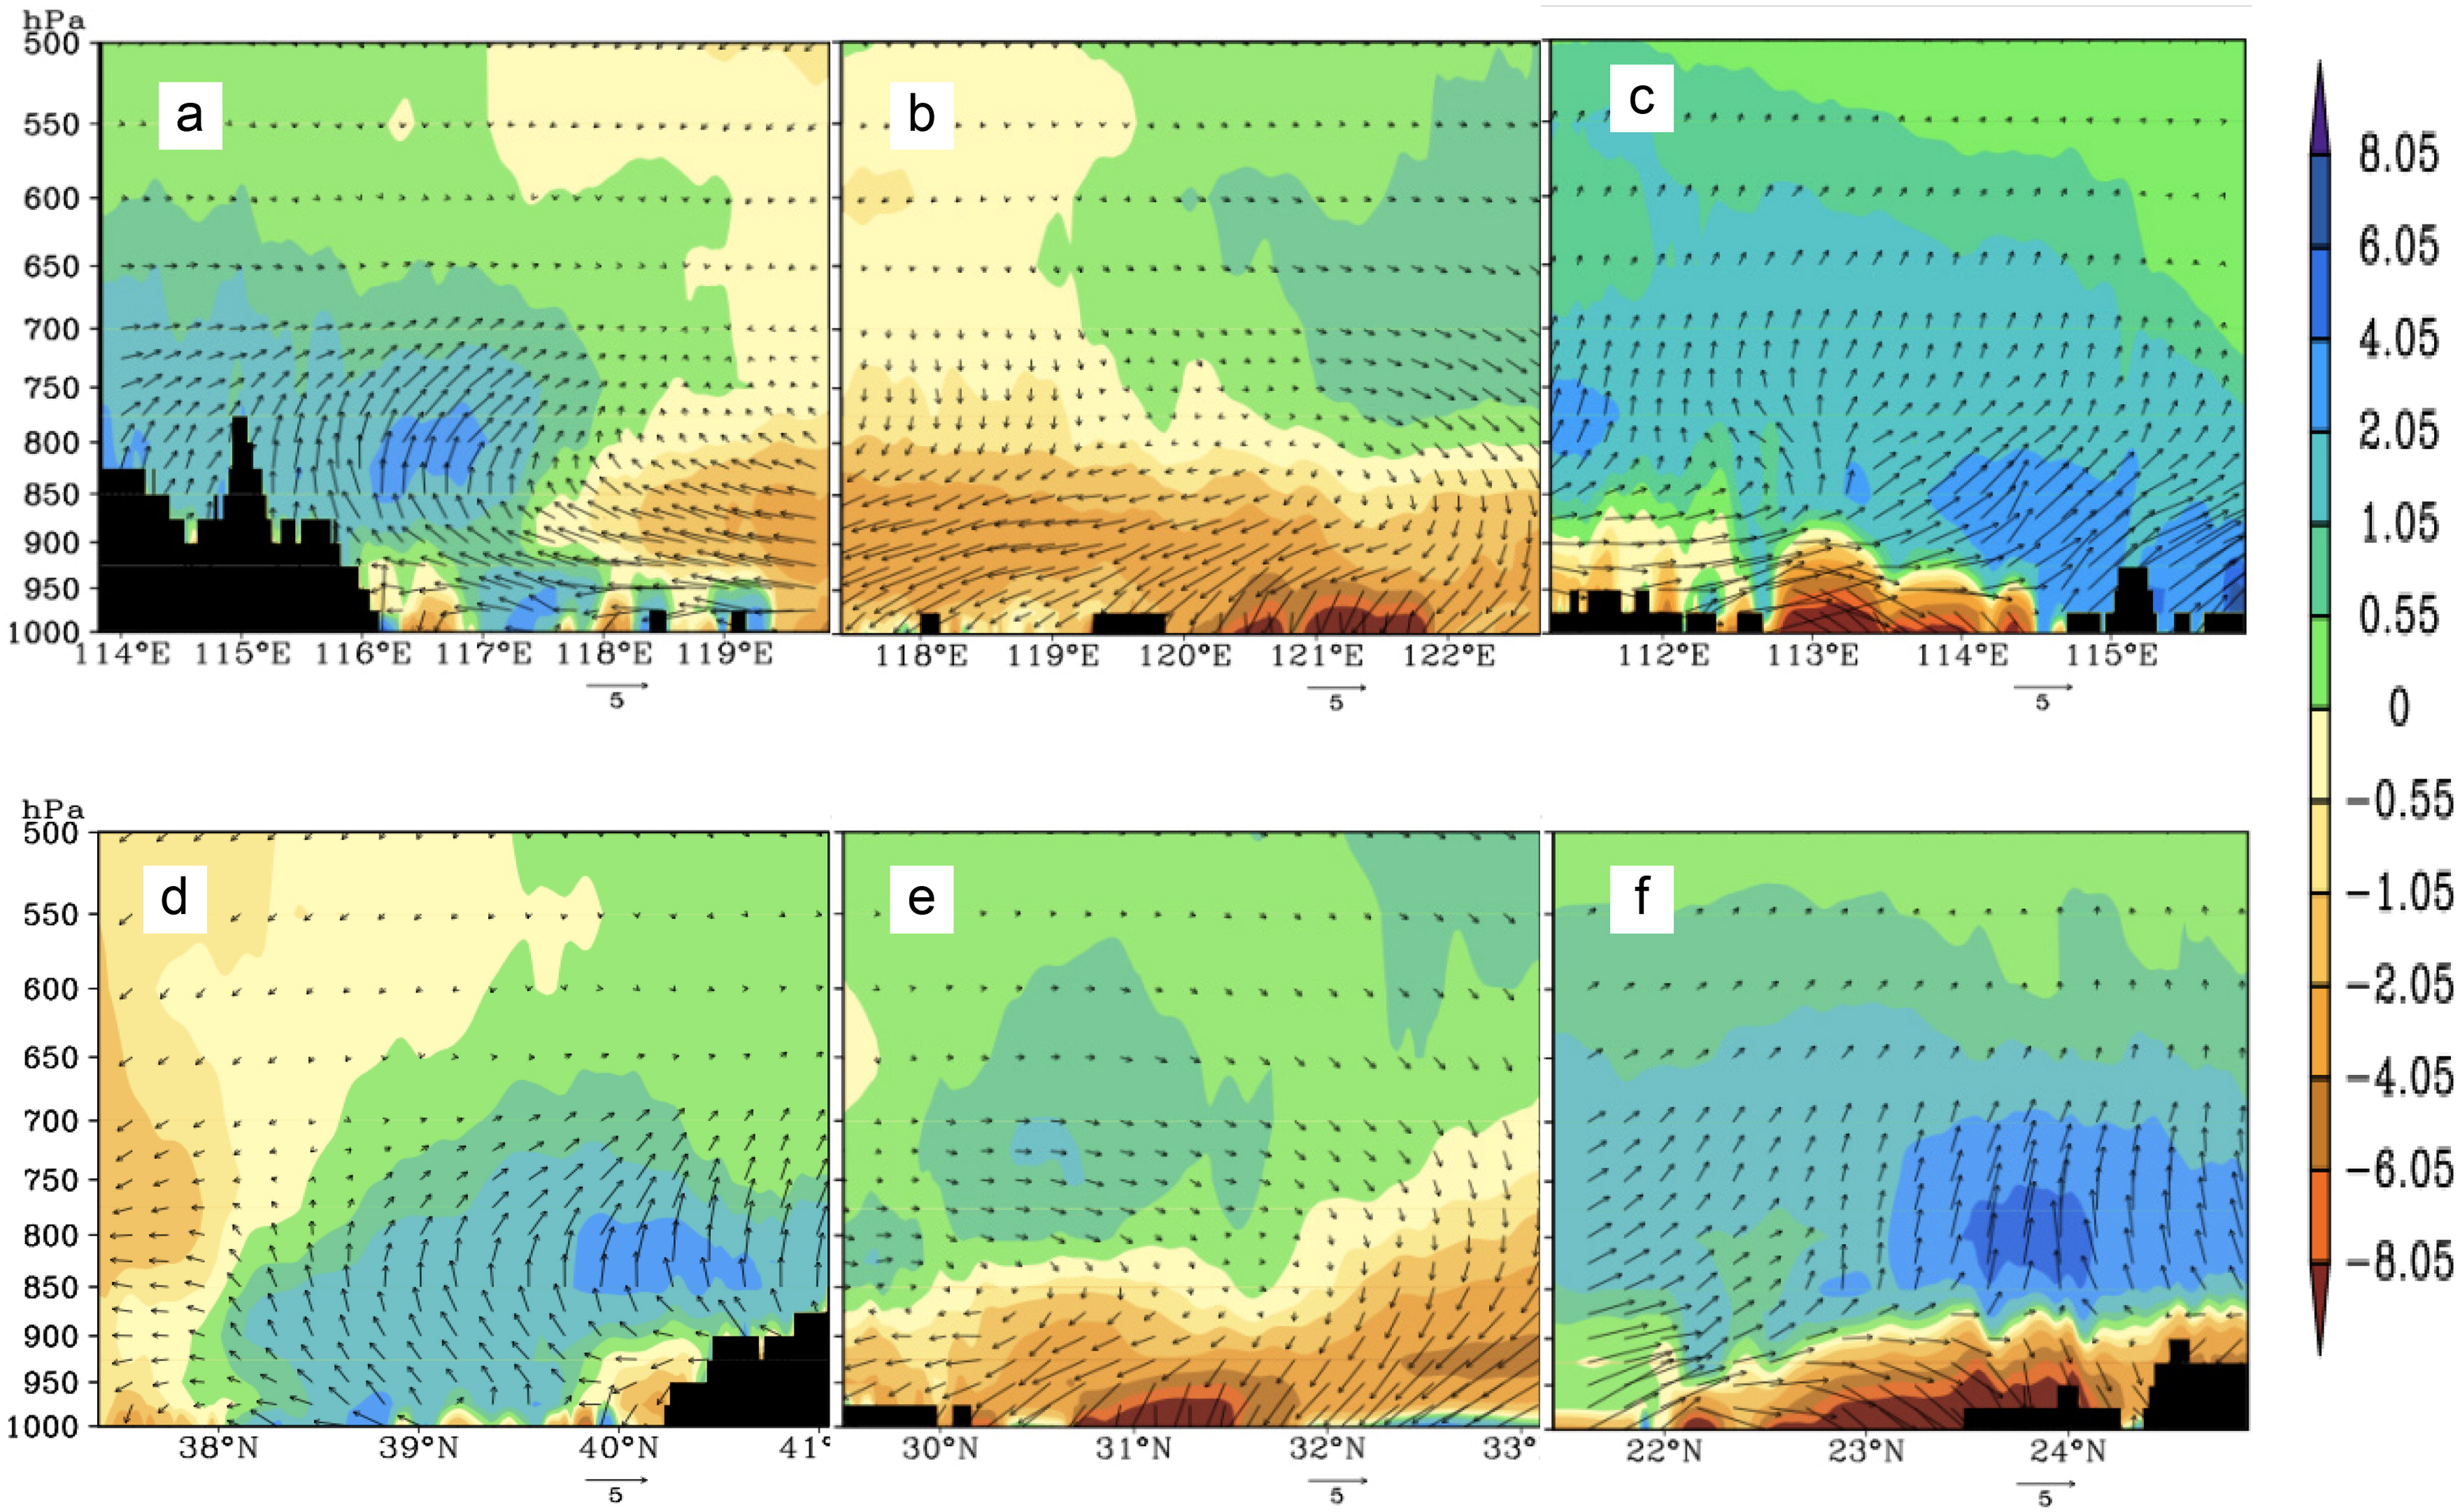
Fig. 11.
Pressure (a–c) longitudinal and (d–f) latitudinal cross-sections along the (a) 39.9°N, (b) 31.14°N, (c) 23.08°N and (d) 116.3°E, (e) 121.29°E, (f) 113.14°E axes (black areas for topography) showing changes in the moisture flux (shaded) and vectors in the summer from U10 to U80 over the three city clusters of the (a, d) BTH, (b, e) YRD, and (c, f) PRD at 3.3-km resolution (units: 10−3 kg hPa−1 m−1 s−1).
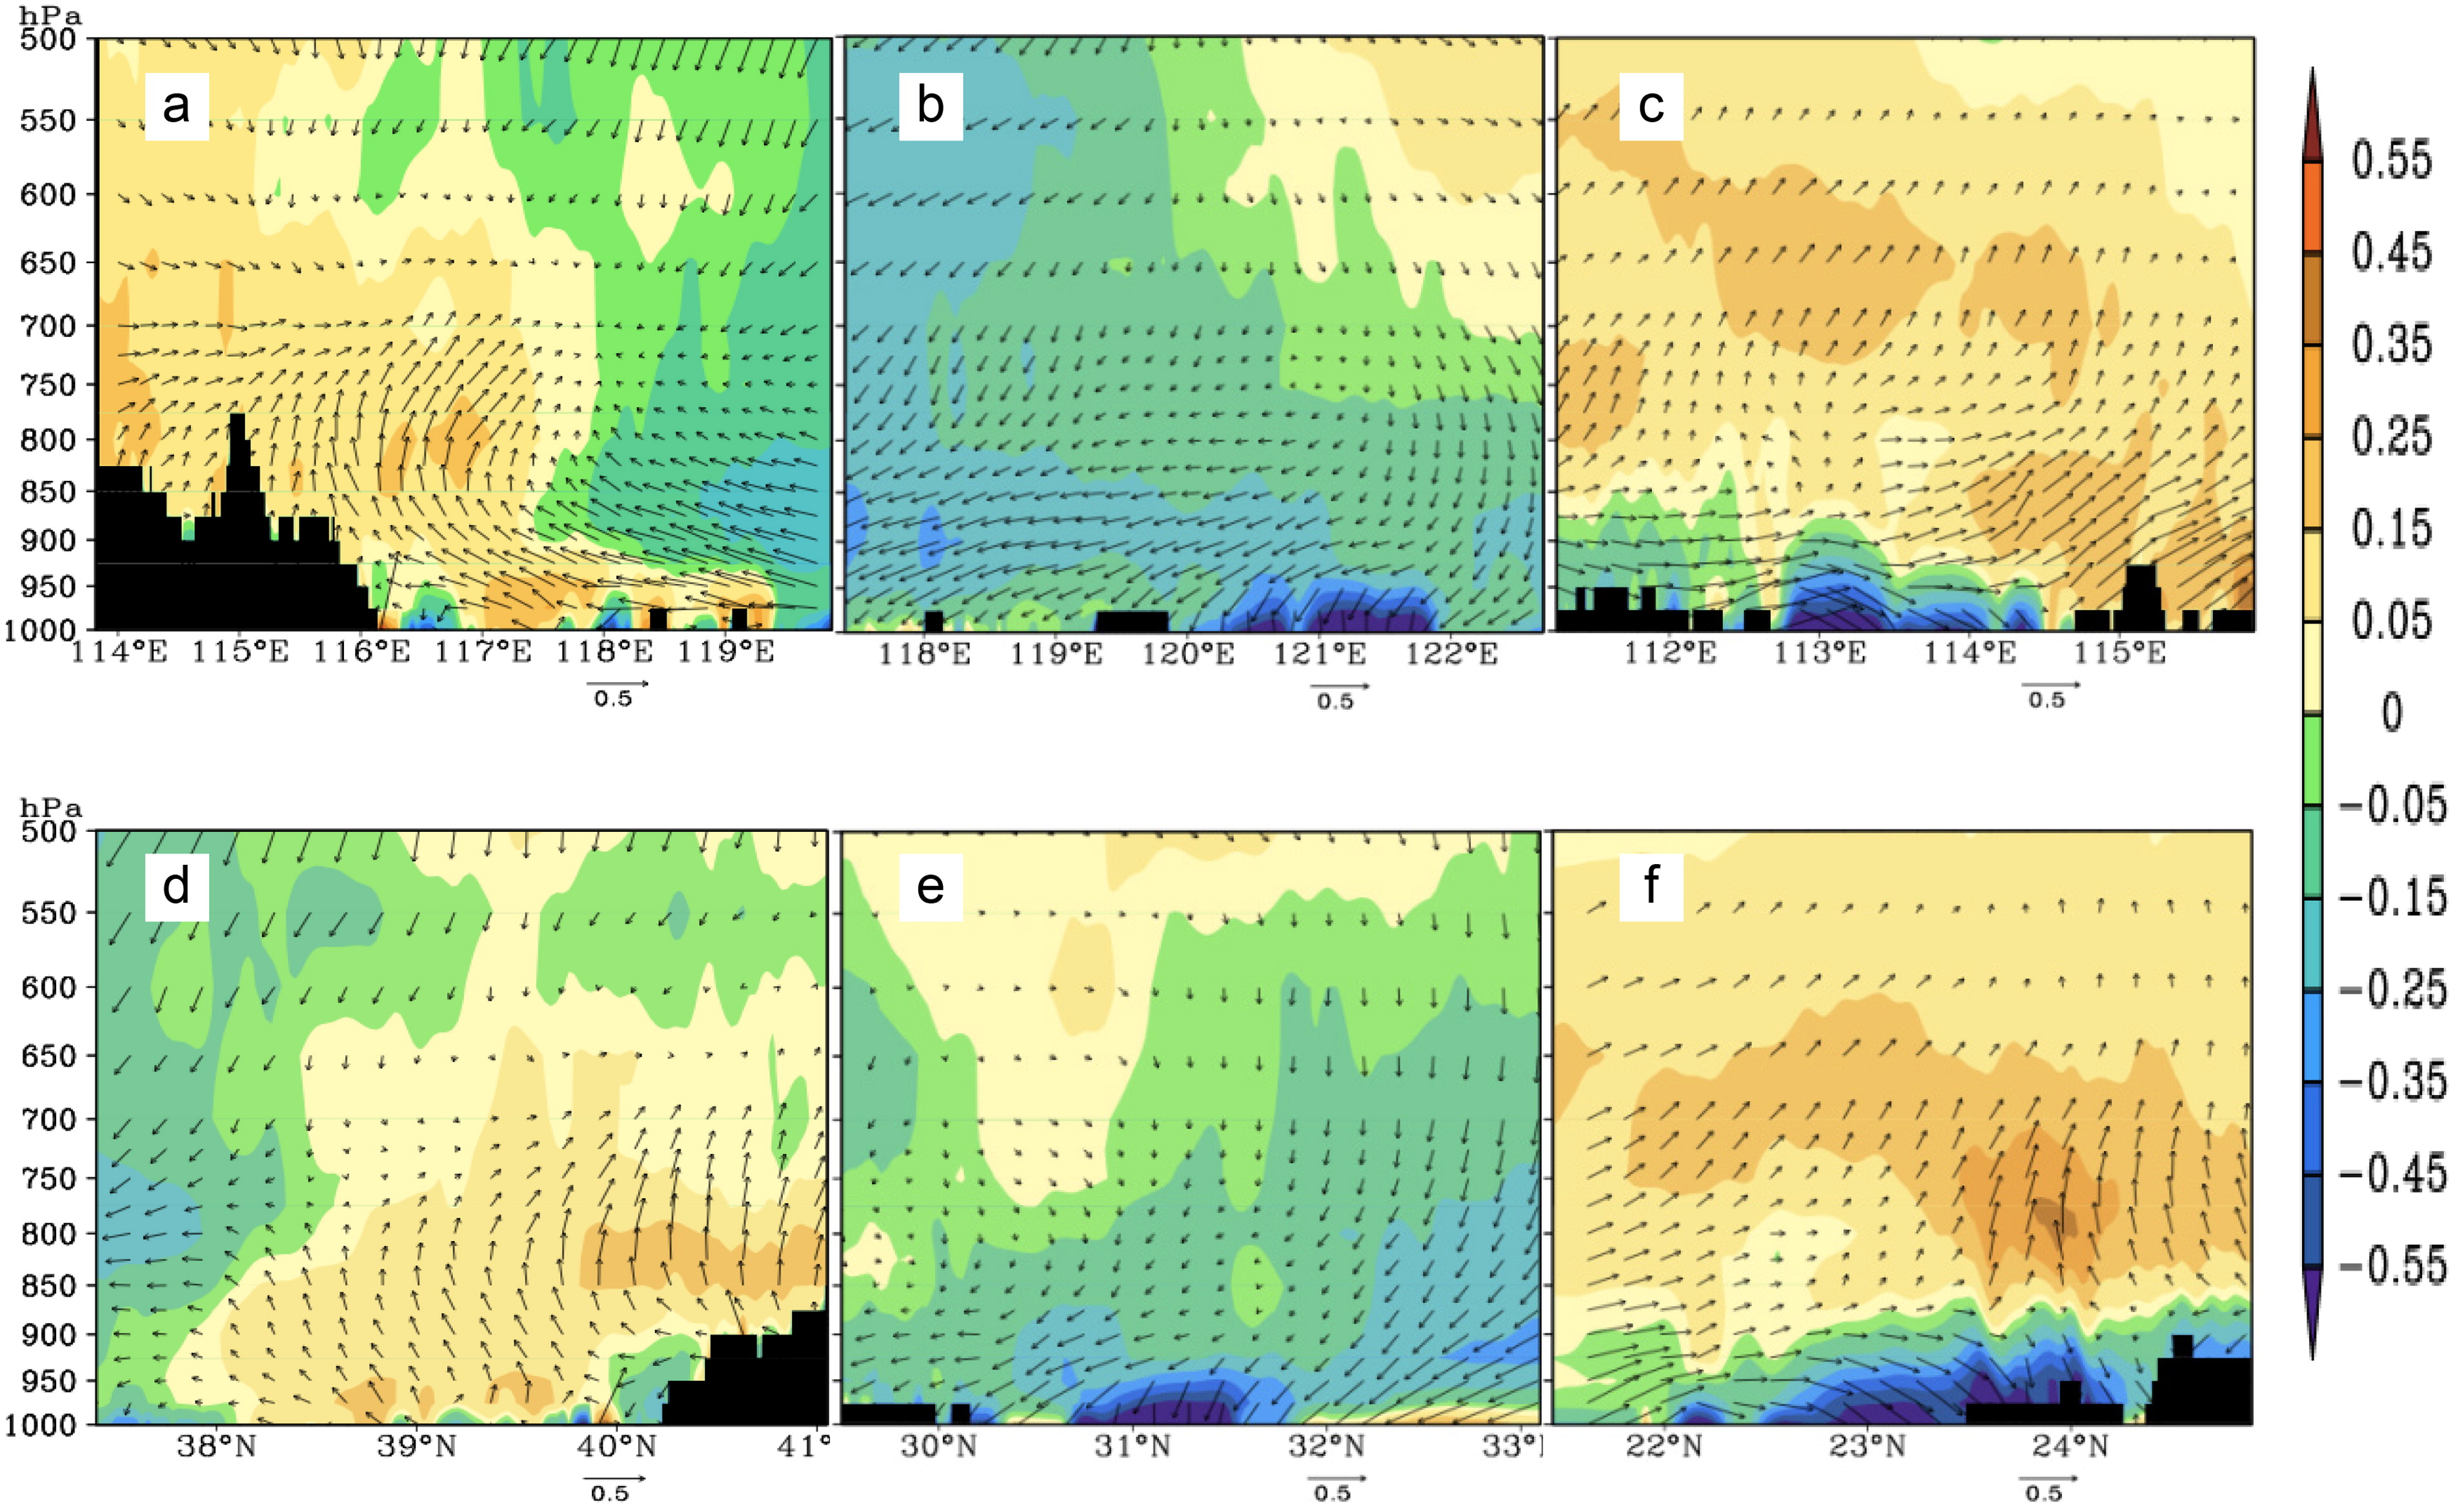
Fig. 12.
Pressure (a–c) longitudinal and (d–f) latitudinal cross-sections along the (a) 39.9°N, (b) 31.14°N, (c) 23.08°N and (d) 116.3°E, (e) 121.29°E, (f) 113.14°E axes (black areas for topography) showing changes in the wind speeds (shaded) and vectors in the summer from U10 to U80 over the three city clusters of the (a, d) BTH, (b, e) YRD, and (c, f) PRD at 3.3-km resolution (units: m s−1).
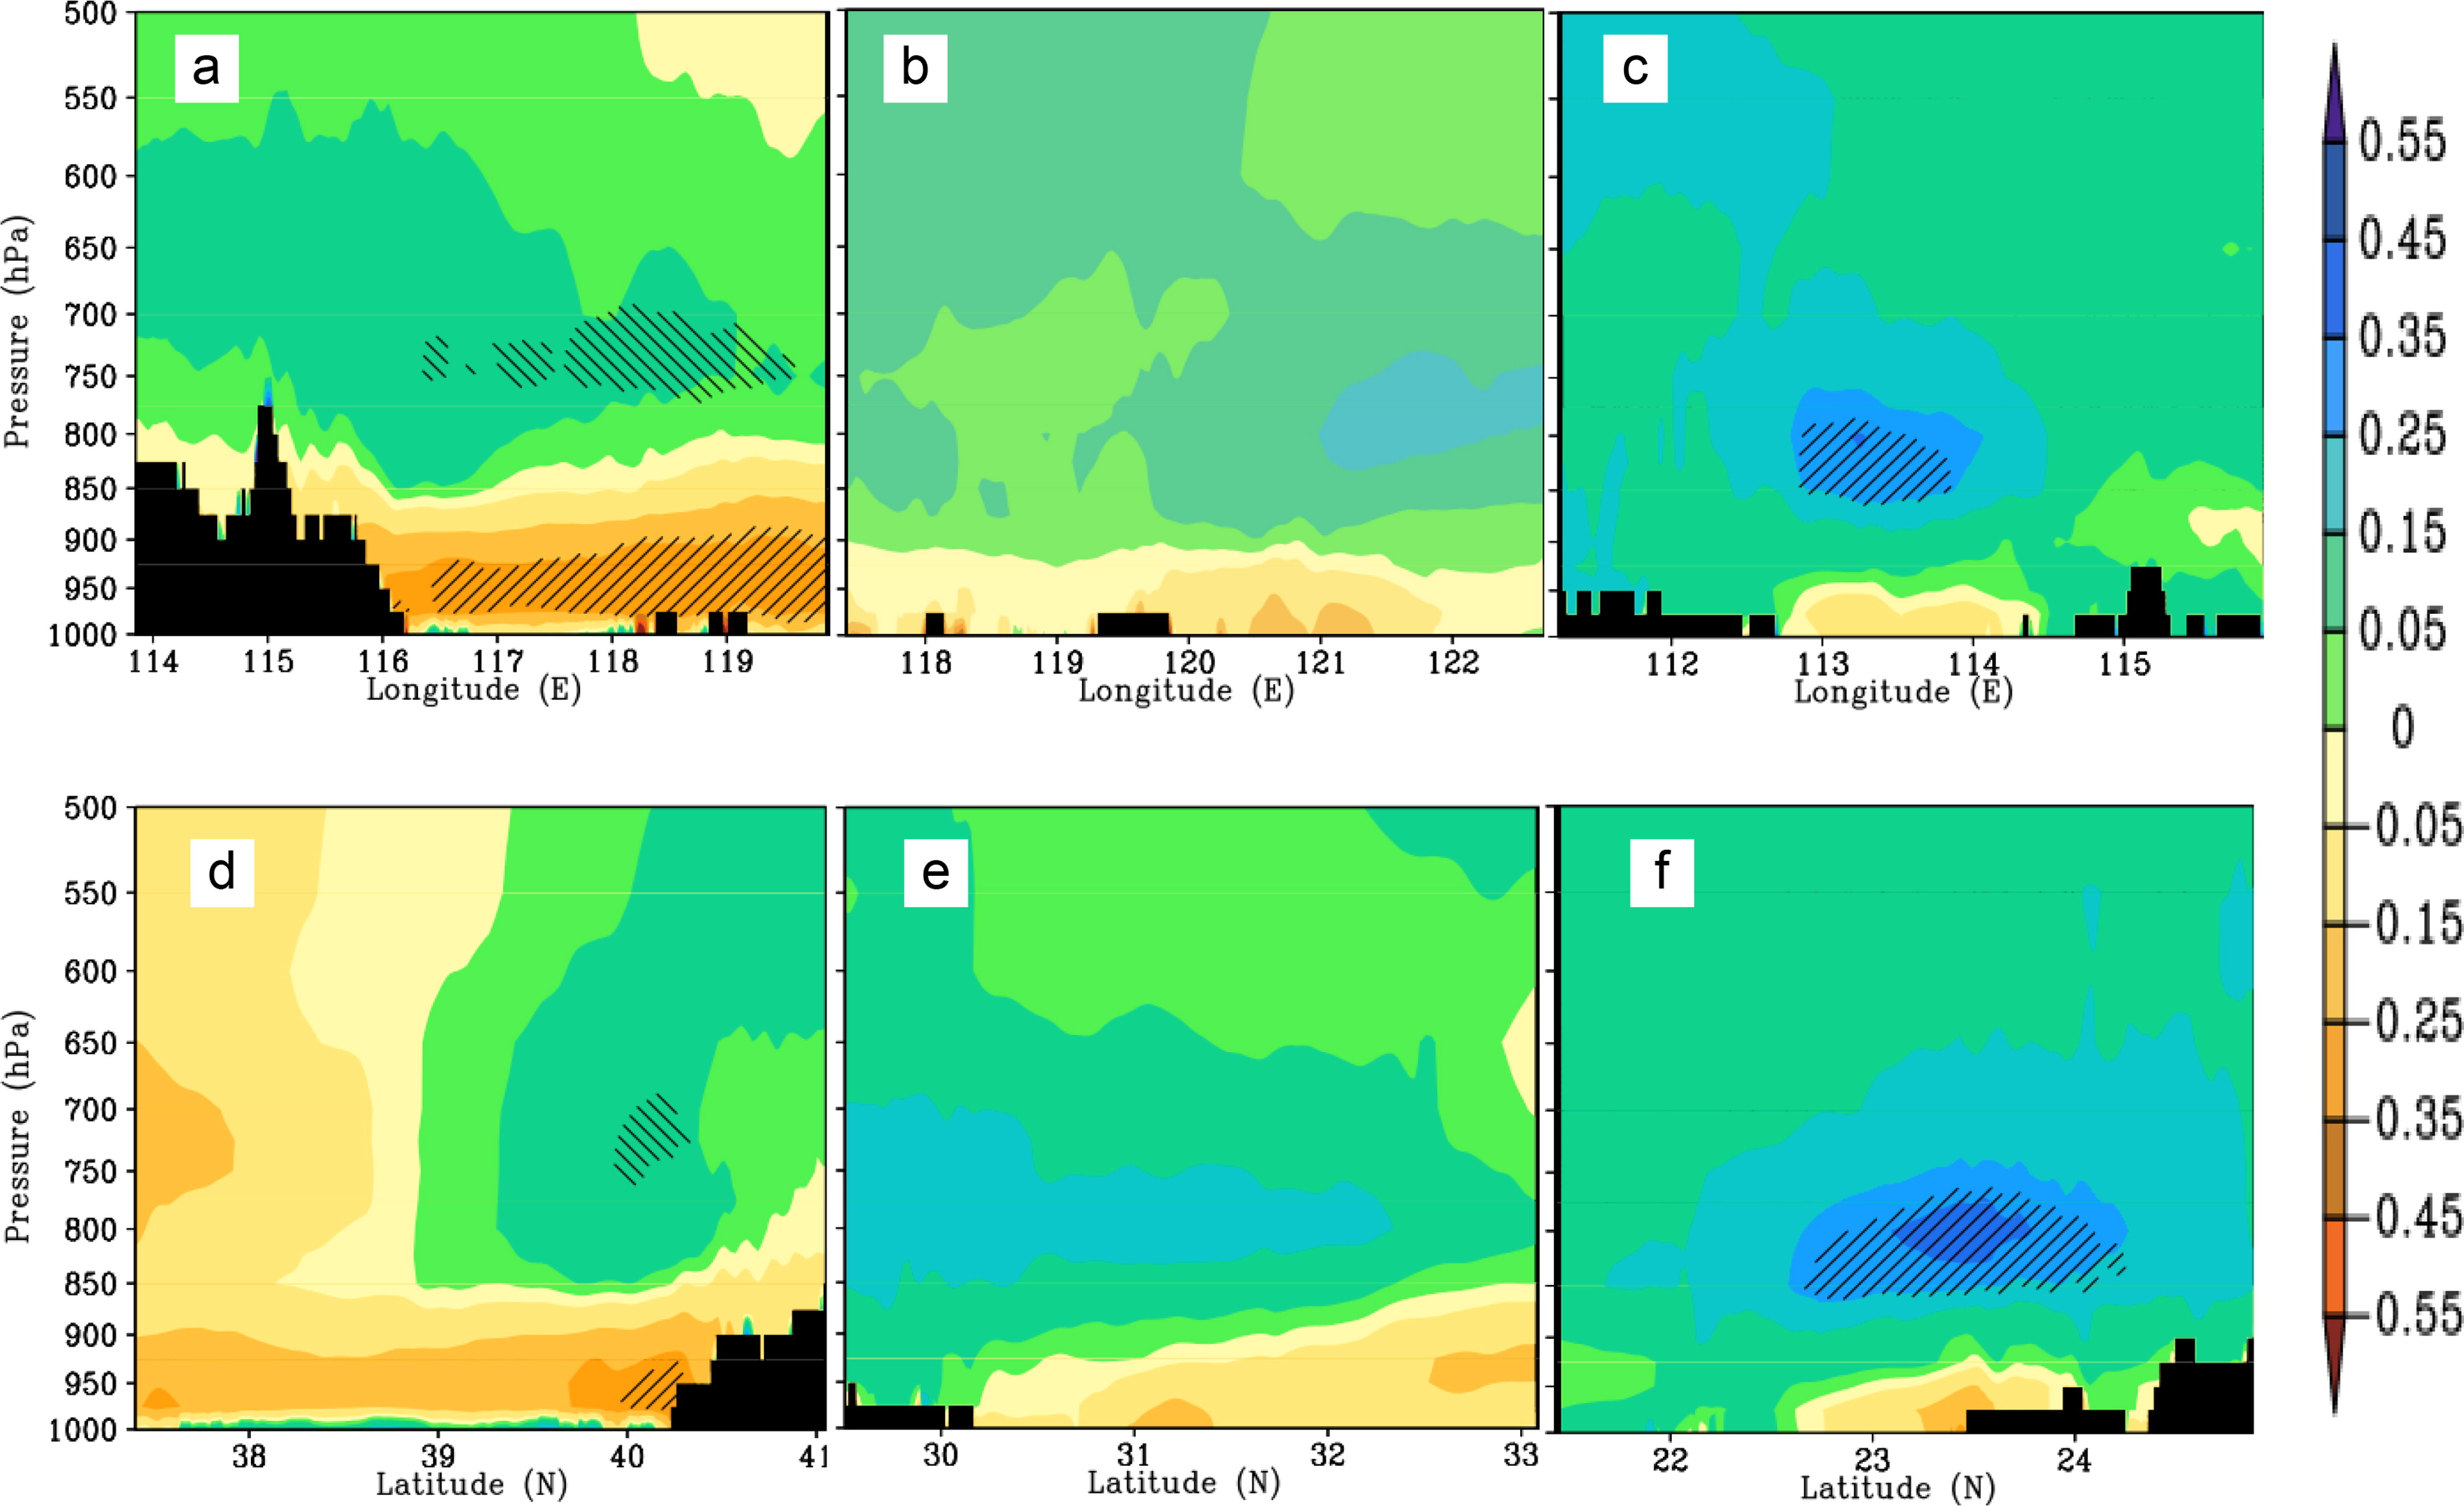
Fig. 13.
Same as Fig. 8, but for the results in the summer.