Have a personal or library account? Click to login
Observational evidence that a feedback control system with proportional-integral-derivative characteristics is operating on atmospheric surface temperature at global scale Cover

Observational evidence that a feedback control system with proportional-integral-derivative characteristics is operating on atmospheric surface temperature at global scale

Open Access
|Jan 2020

Figures & Tables

Table 1.

Terms from climate science matched to control system terms.
Climate science term (IPCC, 2013)Control systems term (Astrom and Murray, 2008)As operationalisedVariable observedVariable transformedComment on transformationTemperatureProcess variableObserved (global surface) temperature (Temp)Z_TempSetpointInitial temperature of seriesZ_Temp_setpointSetpoint is set up to equal zeroDriverDisturbanceLevel of atmospheric CO2 ( CO2)Z_ CO2ErrorError = setpoint - disturbanceZ_Temp_setpoint minus Z_ CO2As setpoint is defined as zero, Z_Temp_ setpoint minus Z_ CO2 reduces simply to minus Z_ CO2Controller outputReverse errorZ_ CO2Proportional Controller outputController outputZ_ CO2Integral Controller outputIntegral Controller outputCumulative sum of Controller outputI_Z_ CO2Derivative Controller outputDerivative Controller outputFirst difference of Controller outputd_Z_ CO2
Fig. 1.

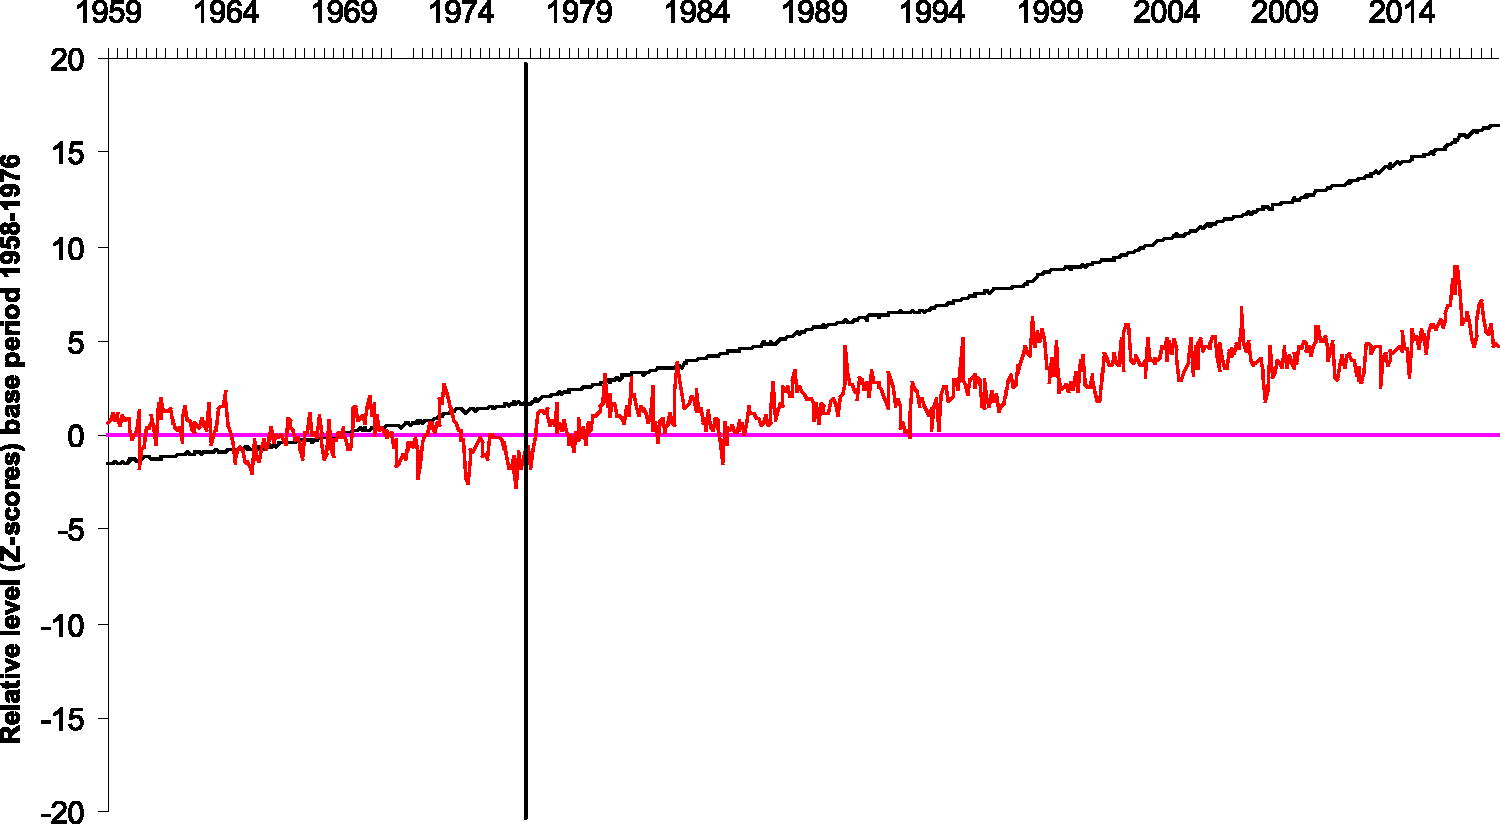
Monthly data, Z-score base period November1958-December 1976 (period to left of vertical black line). Putative control system model for global surface temperature, selected elements: Disturbance (level of atmospheric CO2) (black curve); control system setpoint for temperature (purple line); observed temperature (red curve).
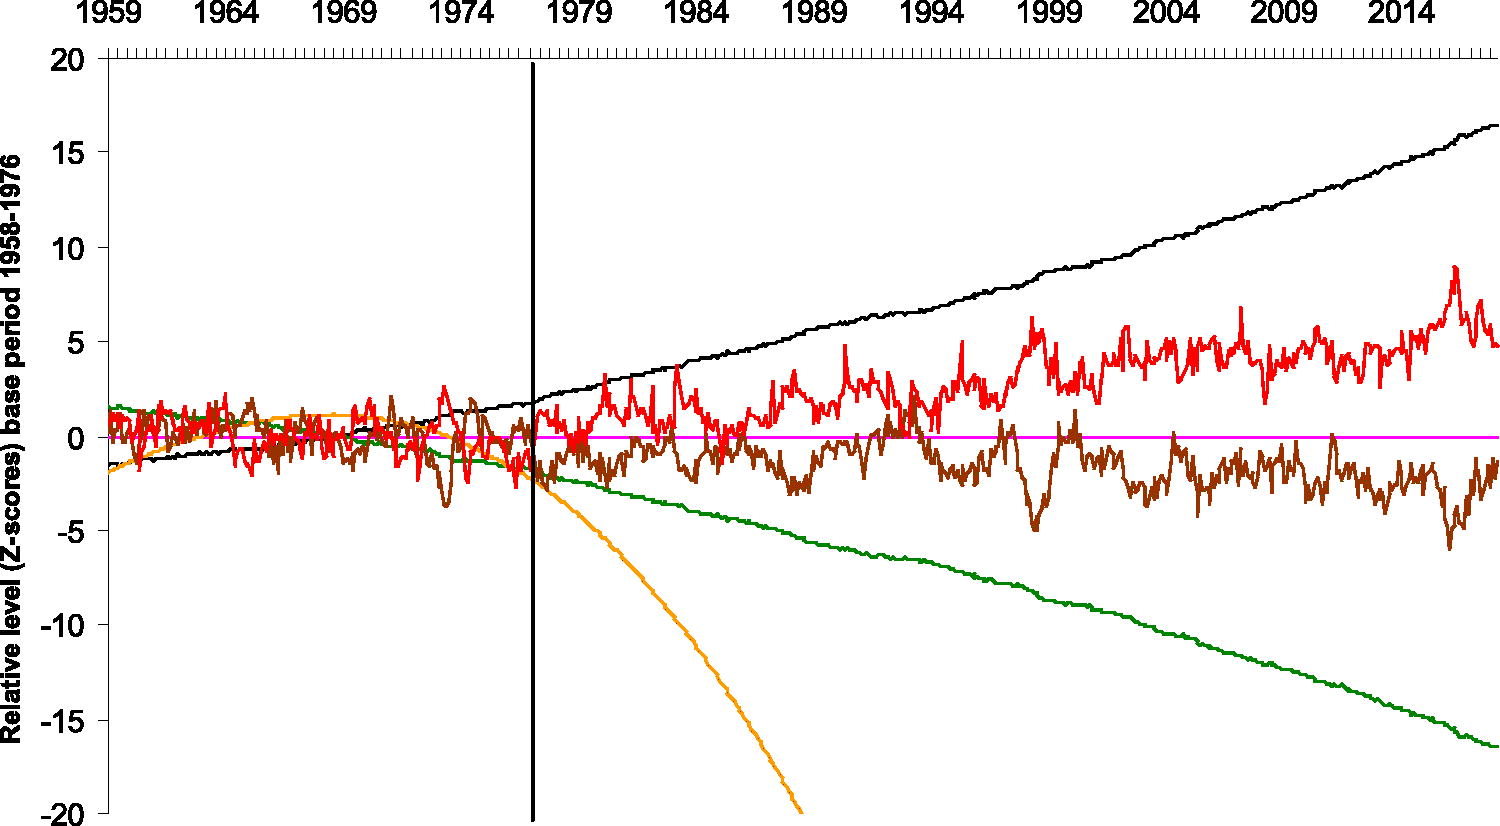
Fig. 2.

Monthly data, Z-score base period November 1958 - December 1976 (period to left of vertical black line). Putative control system model for global surface temperature, full set of elements: Disturbance (level of atmospheric CO2) (black curve); control system setpoint for temperature (purple line); observed temperature (red curve); level of control system error (P_error) (green curve); integral (cumulative sum) of control system error (I_error) (orange curve); derivative (first difference) of control system curve (D_error) (brown curve).

Table 2.

Results of ADF tests for stationarity, allowing for both drift and trend.

Disturbance seriesP_error seriesI_error seriesD_error seriesTemp seriesOrder of polynomial trend determined for use in constructing the testSame as P-error series4th-order3rd-orderLinearLinearTest indicated for use by order of polynomial trend of seriesSchmidt-Phillips test (τ test)Schmidt-Phillips test (τ test)Augmented Dickey-Fuller testAugmented Dickey-Fuller testValue of test-statistic−7.6313−9.1785−5.716−0.17473Critical value of test statistic for a significance level of 0.01−4.85−4.5−3.9713−7.03966Conclusion: series is –StationaryStationaryStationaryStationary
Table 3.

Putative PID control system: ridge regression results.

coefficientstd. errorzp-valueDisturbance_Z58180.26300.020213.037.87E-39P_Error_reZ5818−0.26300.0202−13.037.87E-39I_Error_reZ5818−0.21740.0369−5.8973.69E-09L1m_13mma_D_Error_reZ5818−0.23770.0218−10.91.15E-27const0NANANA

[i] Penalty = 0.57.

[ii] Resid SD = 0.44516.

Table 4.

Eviews ARDL estimation output for period November 1958 to February 2018 for temperature as a function of putative control system P_error, I_error and D_error: short-run model dynamic relationship.

Model dependent variableNumber of models evaluatedSelected modelNo autocorrelation out to 36 lagsAdjusted R-squaredF-statisticp-valueH46_Z58762ARDL (2,0,0.0)Nil0.8969111234.712< 10-100
Table 5.

Eviews ARDL estimation output for period November 1958 to February 2018 for temperature as a function of putative control system P_error, I_error and D_error: short-run model independent variables.
Model independent variablesCoefficientStd. Errort-StatisticProb.* H46_Z5818(-1)0.5230.036814.2221.57E-40H46_Z5818(-2)0.2260.03676.1621.21E-09P_ERROR_REZ5818−0.1390.0334−4.1583.60E-05I_ERROR_REZ5818−0.0460.0277−1.6750.0944L1M_13MMA_D_ERROR_REZ581−0.0620.0173−3.5960.0003C0.0020.01210.1740.8621
Fig. 3.

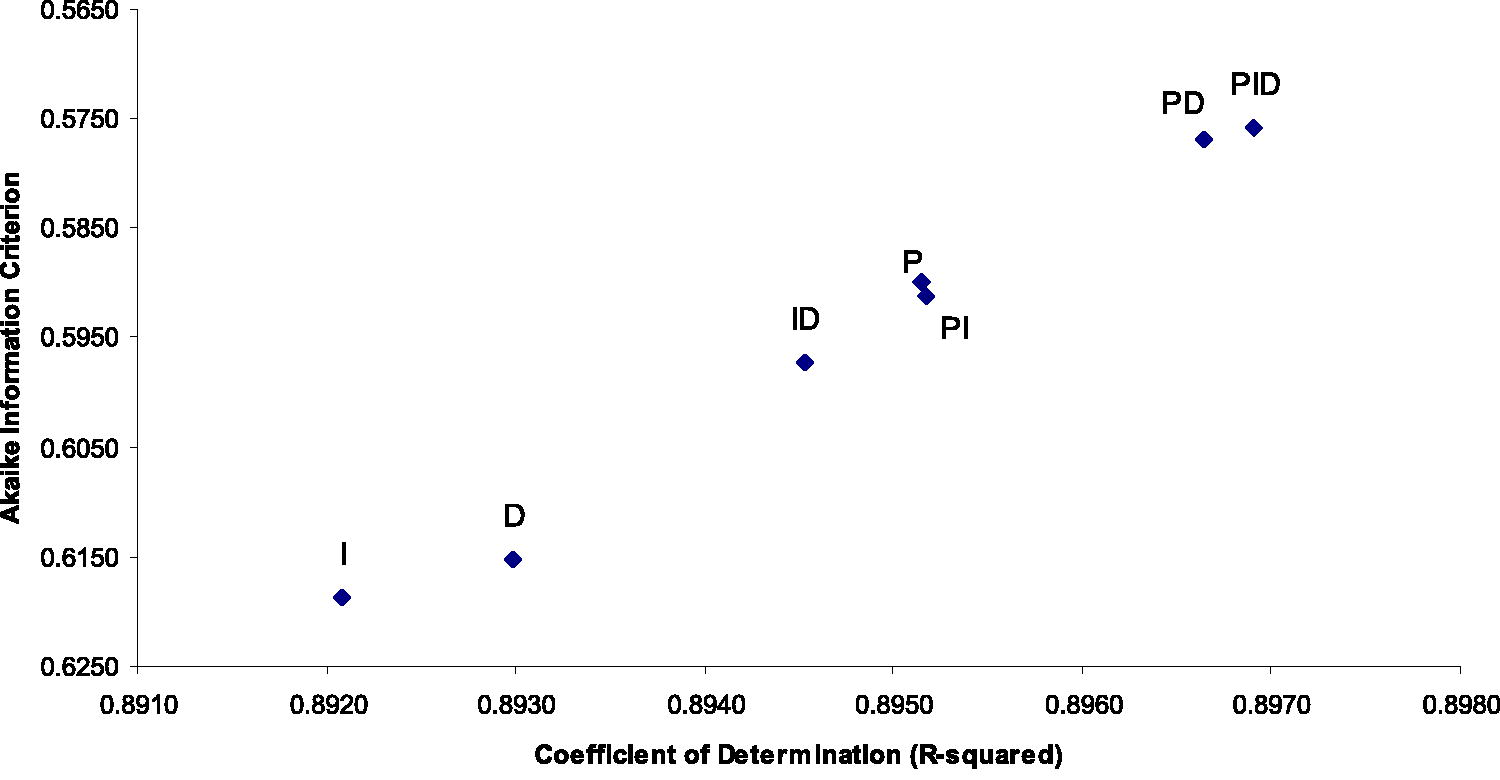
Fit with observed temperature of global surface temperature predicted from dynamic regression models involving various combinations of control system error terms. The PID model shows the best fit (highest Coefficient of Determination (R-squared) and lowest Akaike Information Criterion).

Table 6.

Fit with observed temperature of global surface temperature predicted from dynamic regression models involving various combinations of control system error terms.
Error terms in modelSelected modelNo autocorrelation out to:Adjusted R-squaredAkaike information criterionI(2,0)36 lags0.89210.6188D(4,0)37 lags0.89300.6152P(2,0)36 lags0.89510.5900ID(2,0,0)24 lags0.89450.5972PI(2,0,0)36 lags0.89520.5912PD(2,0,0)36 lags0.89660.5769PID(2,0,0,0)36 lags0.89690.5758
Fig. 4.

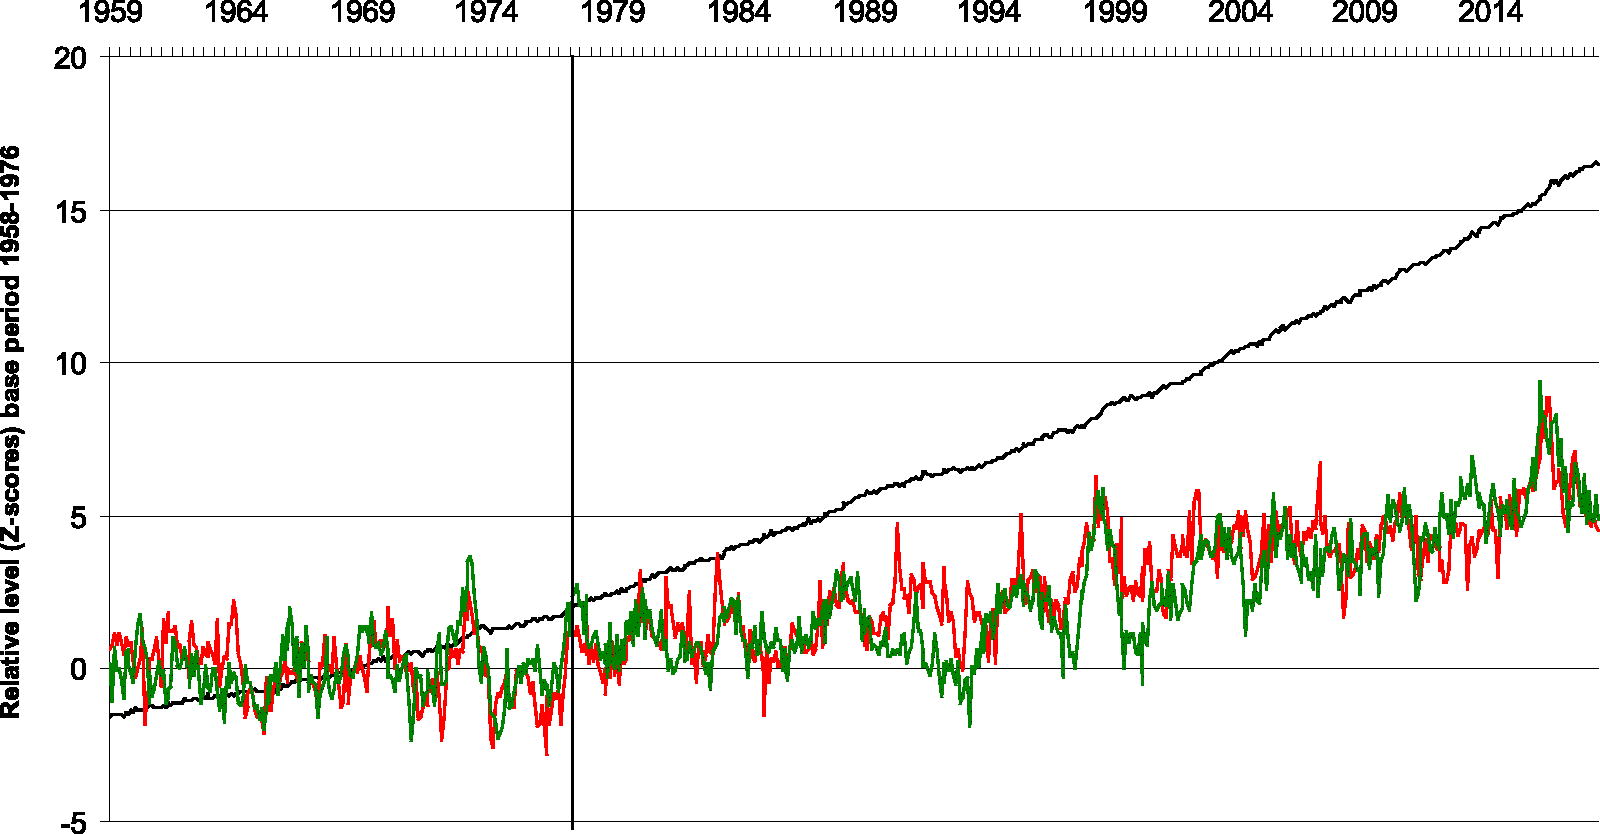
Monthly data, Z-score base period November 1958 - December 1976 (period to left of vertical black line). Predicted temperature from dynamic regression model of a control system for global surface temperature using P, I and D error terms (green curve); Disturbance to temperature (level of atmospheric CO2) (black curve); observed temperature (red curve).

Language: English
Page range: 1717268 - 1717268
Published on: Jan 1, 2020
Published by: Stockholm University Press
In partnership with: Paradigm Publishing Services

© 2020 L. Mark W. Leggett, David A. Ball, published by Stockholm University Press
This work is licensed under the Creative Commons Attribution 4.0 License.