
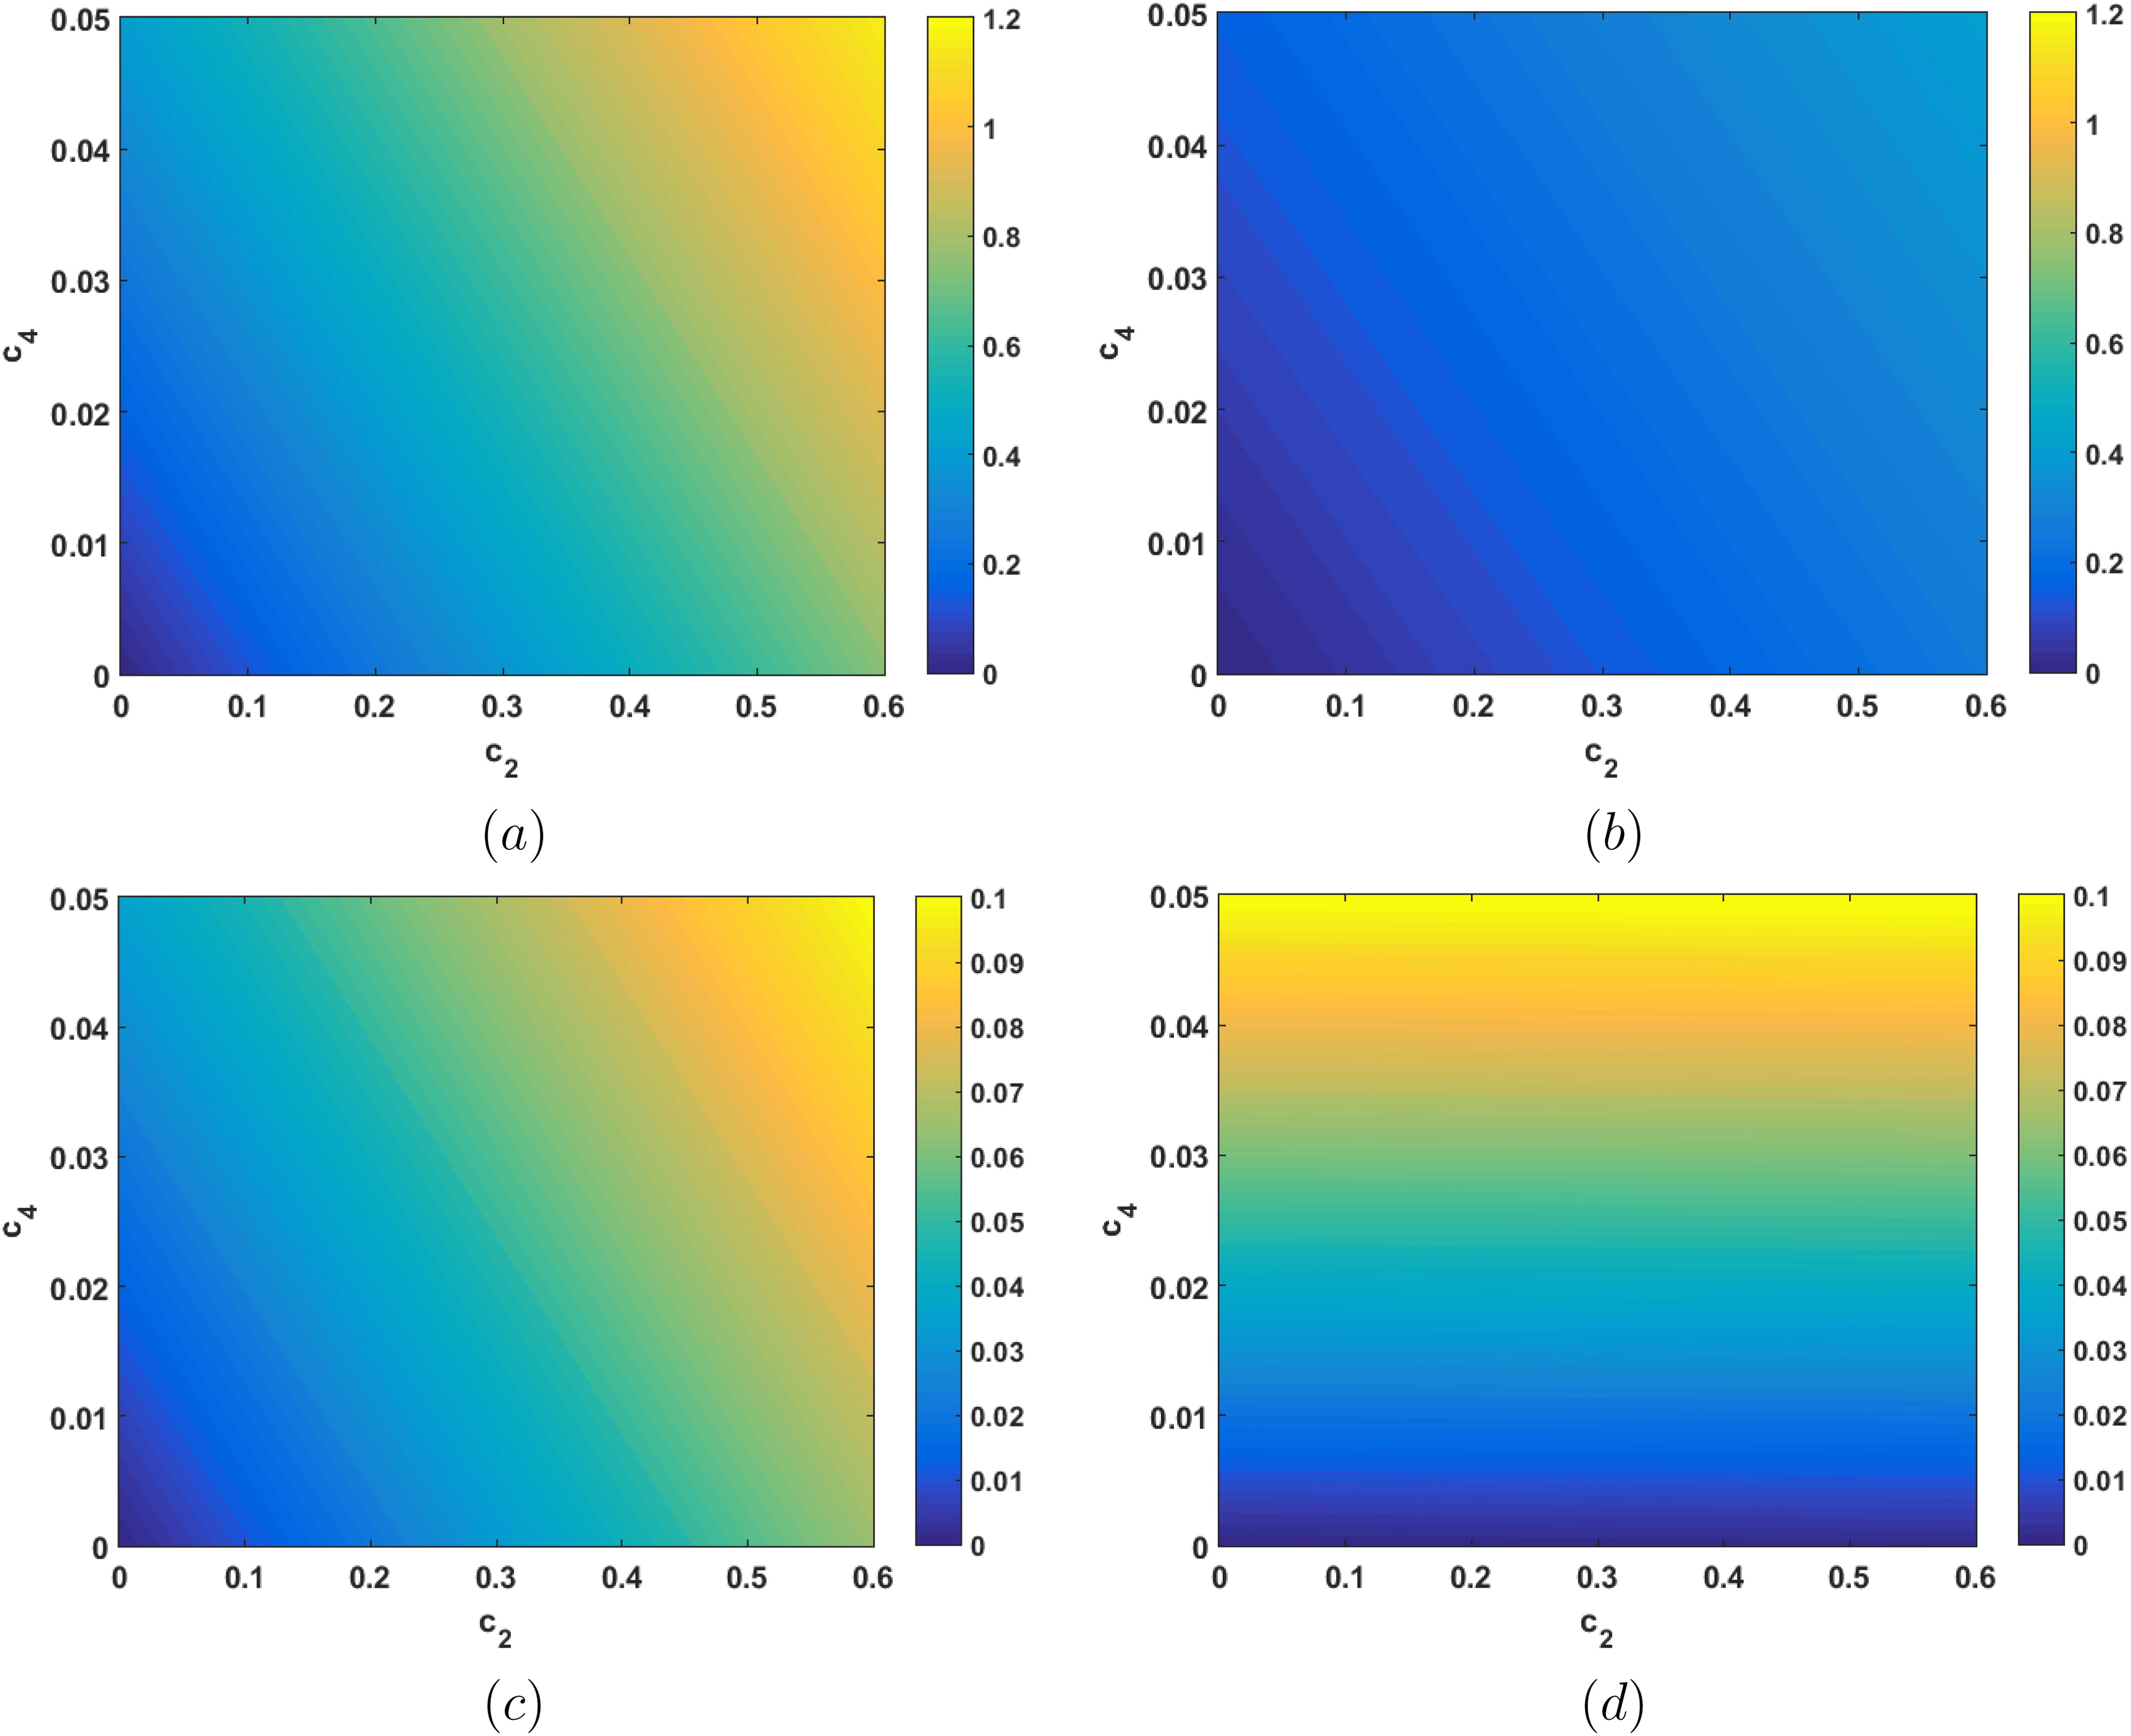
Fig. 1.
The L2 error in the estimated (a) EnKF mean (3.15) for k = 5, (b) EnKF mean for k = 10, (c) EnKF mean for k = 100, and (d) AGR filter mean (3.6) for increasing values of c2 (horizontal axis) and c4 (vertical axis). Note that the color scales are different between the first two plots (a) & (b) and the second two (c) & (d).
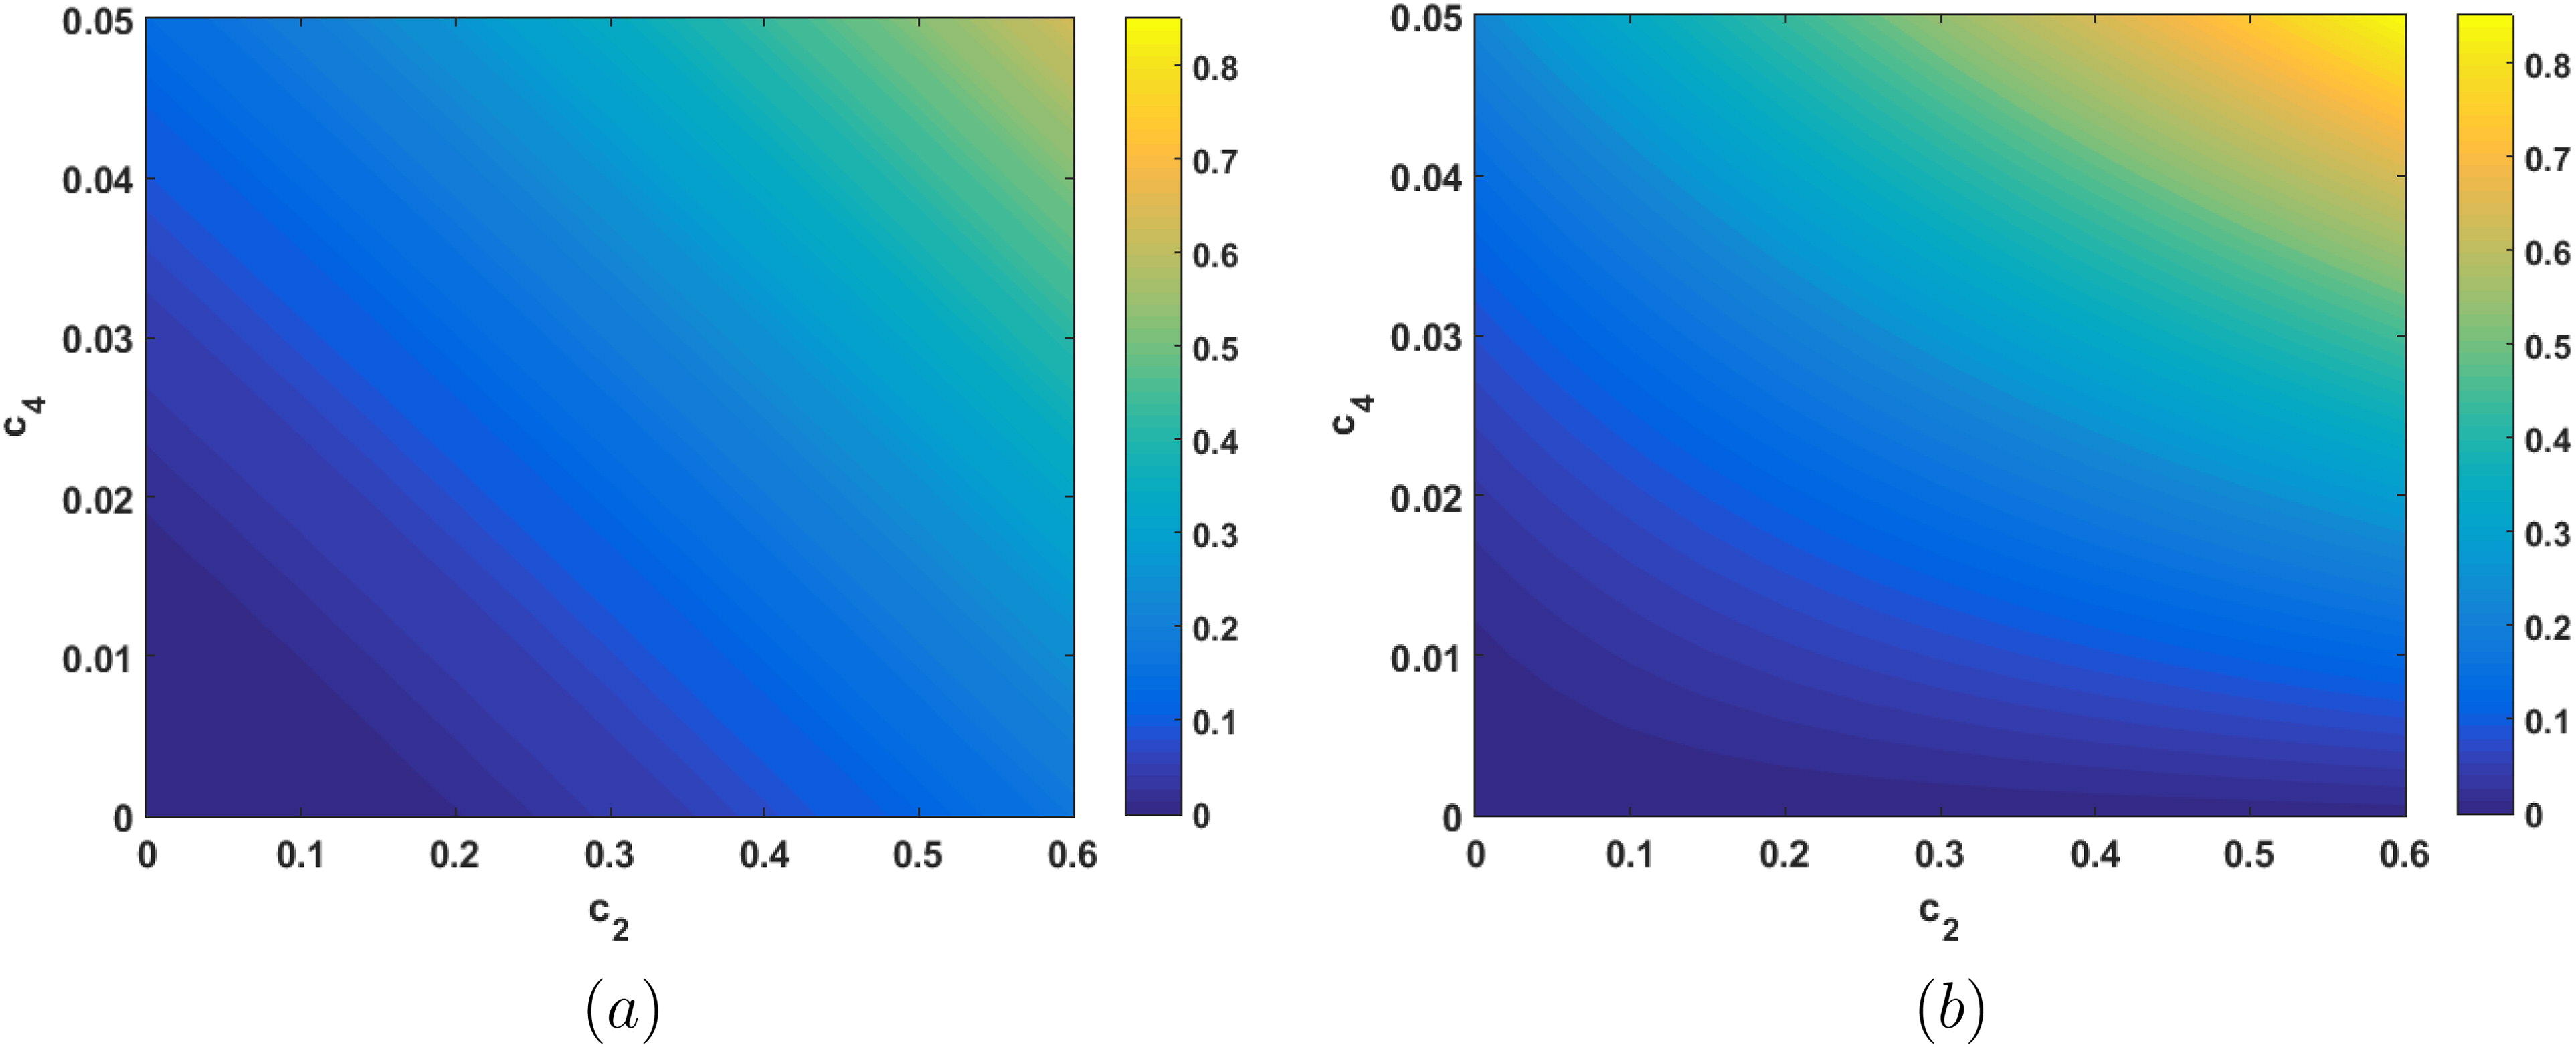
Fig. 2.
The L2 error in (a) EnKF prior covariance estimate for k = 100 and (b) the error in the AGR filter prior covariance estimate for increasing values of c2 (horizontal axis) and c4 (vertical axis).
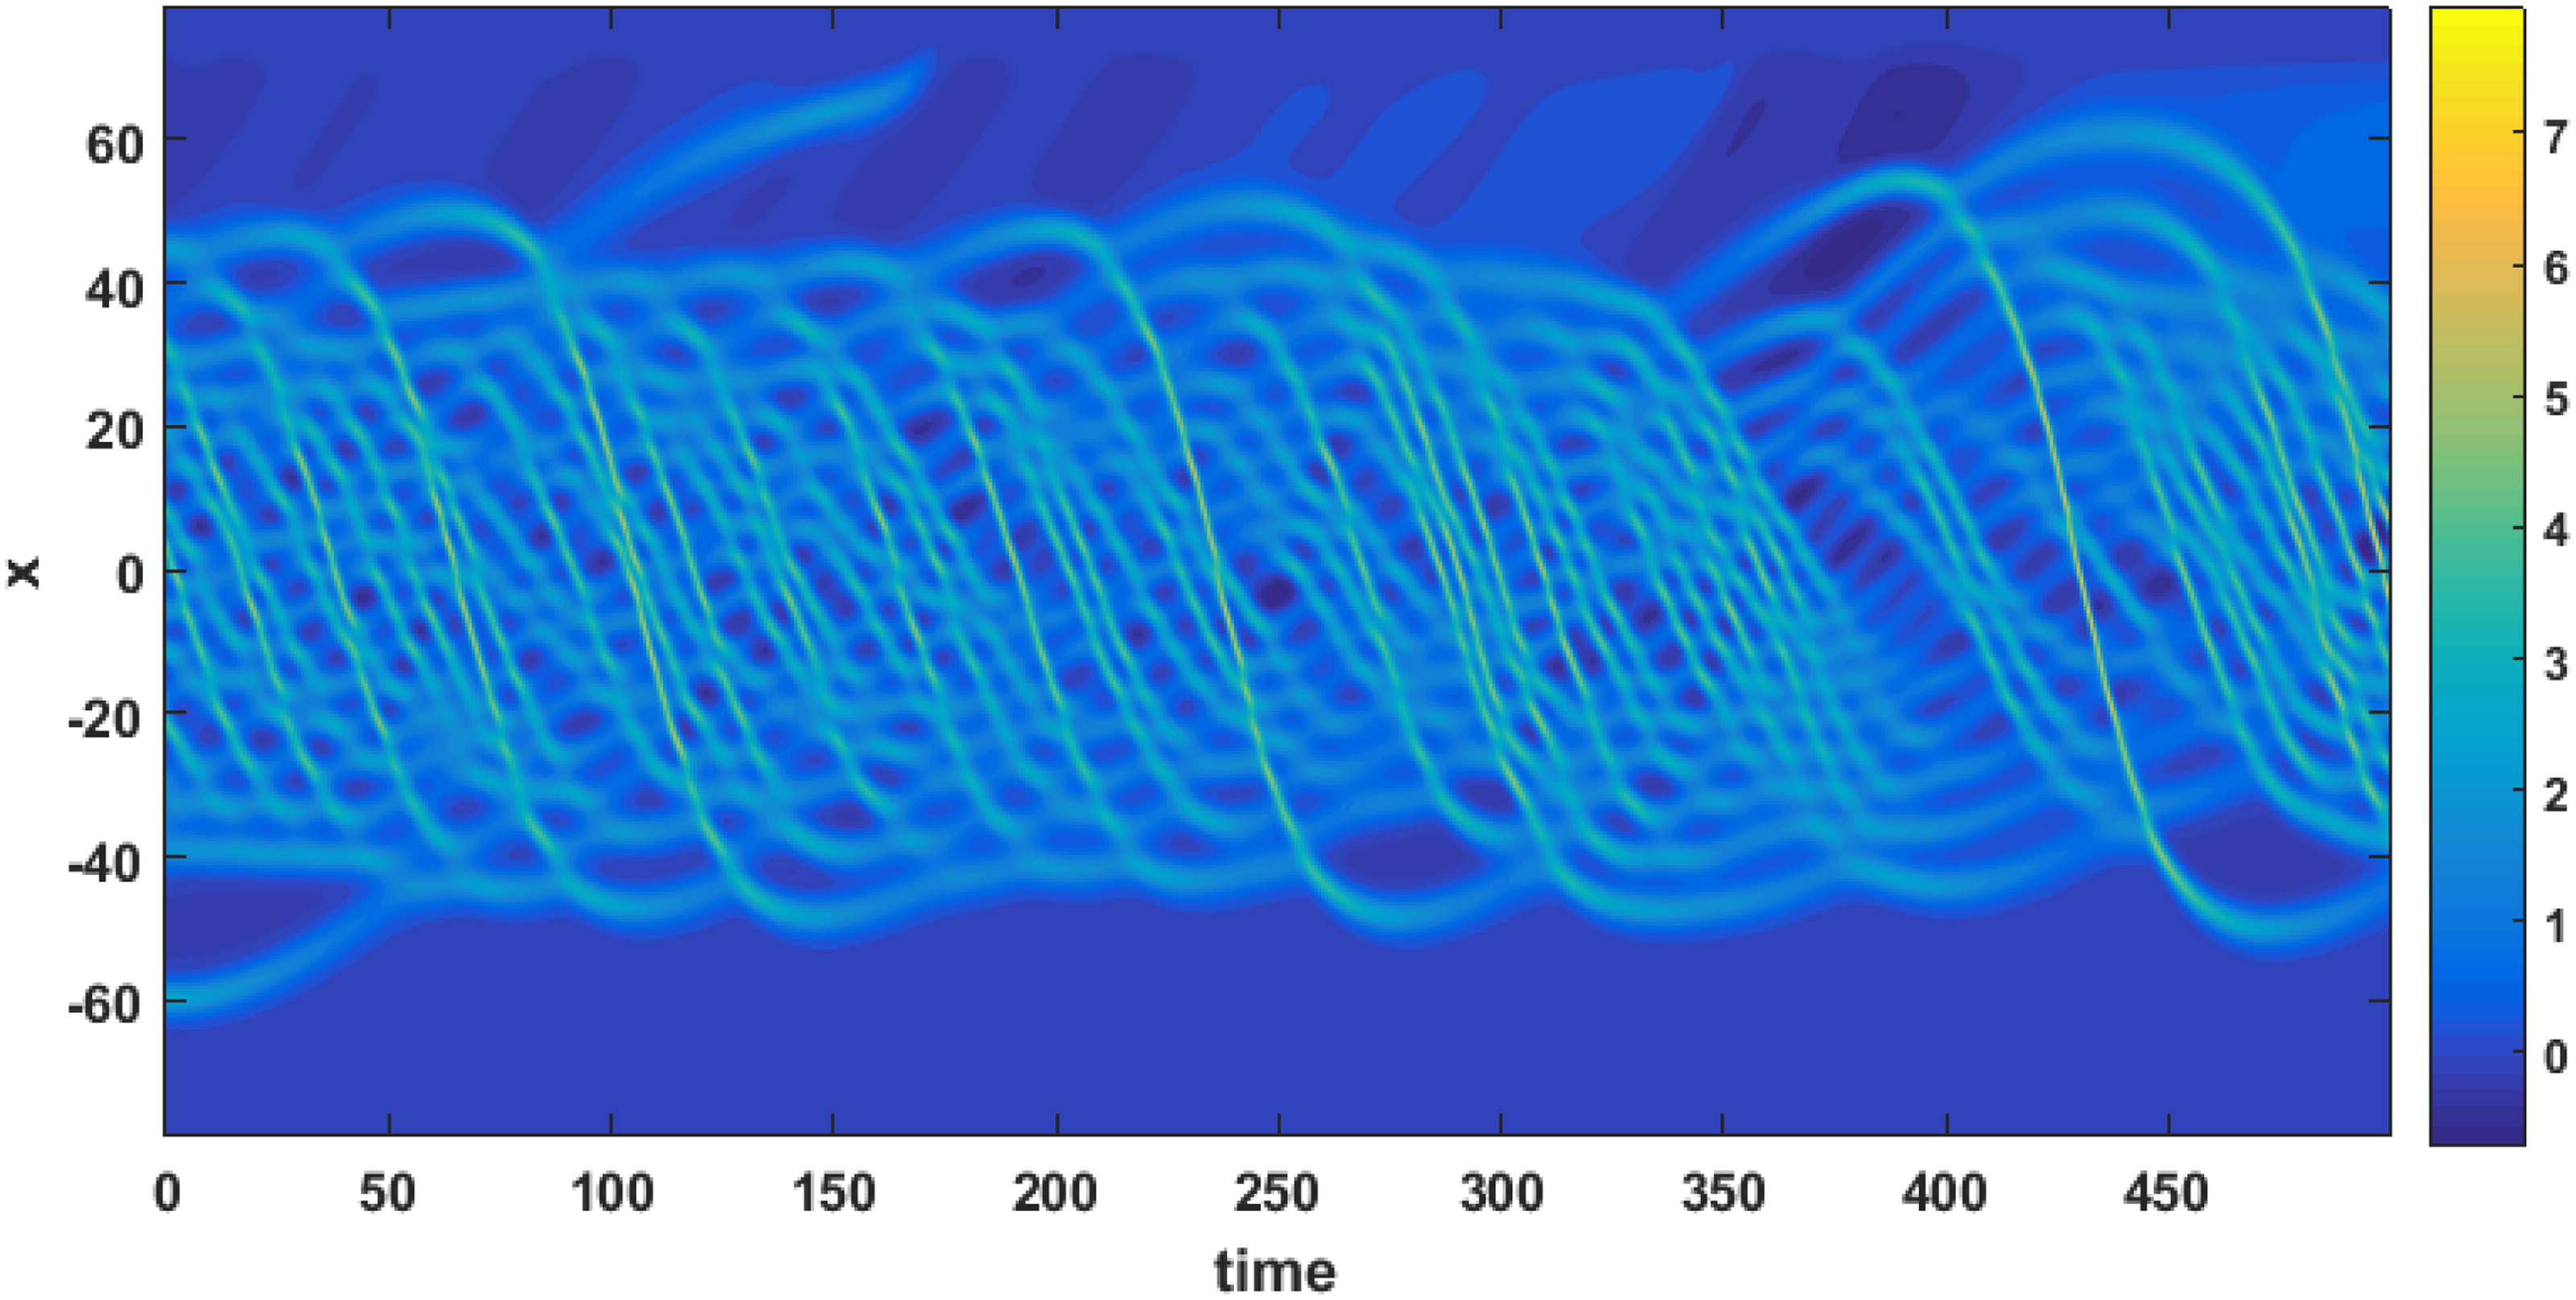
Fig. 3.
Contour plot of the wave amplitude over the domain (vertical axis) of the KdV equation over time (horizontal axis).
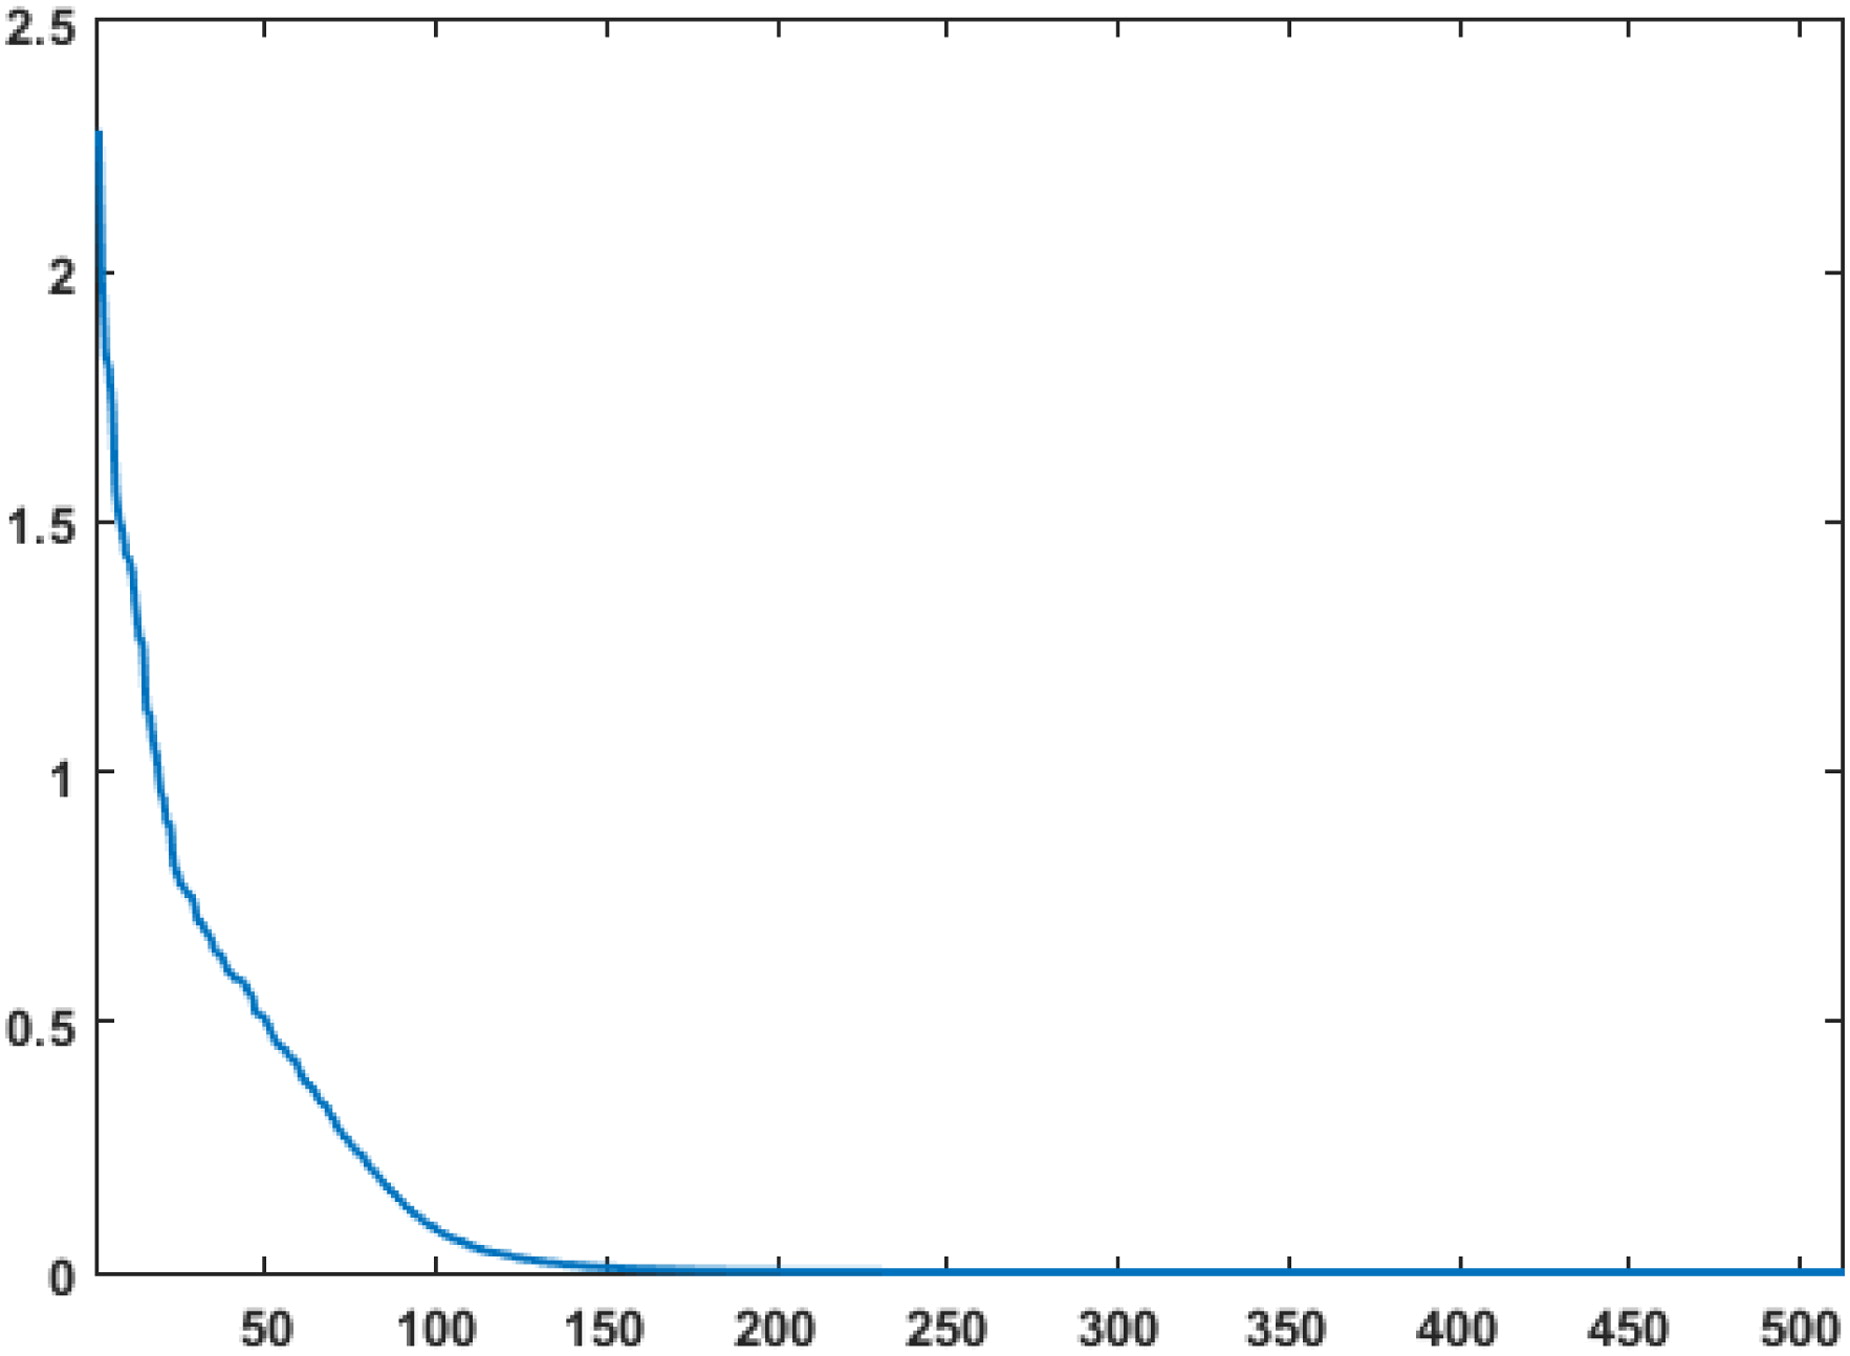
Fig. 4.
The 512 sorted eigenvalues of the initial background error covariance created from a 35000 member climatological ensemble. The horizontal axis is the eigenvalue number and the vertical axis is the magnitude of each eigenvalue.
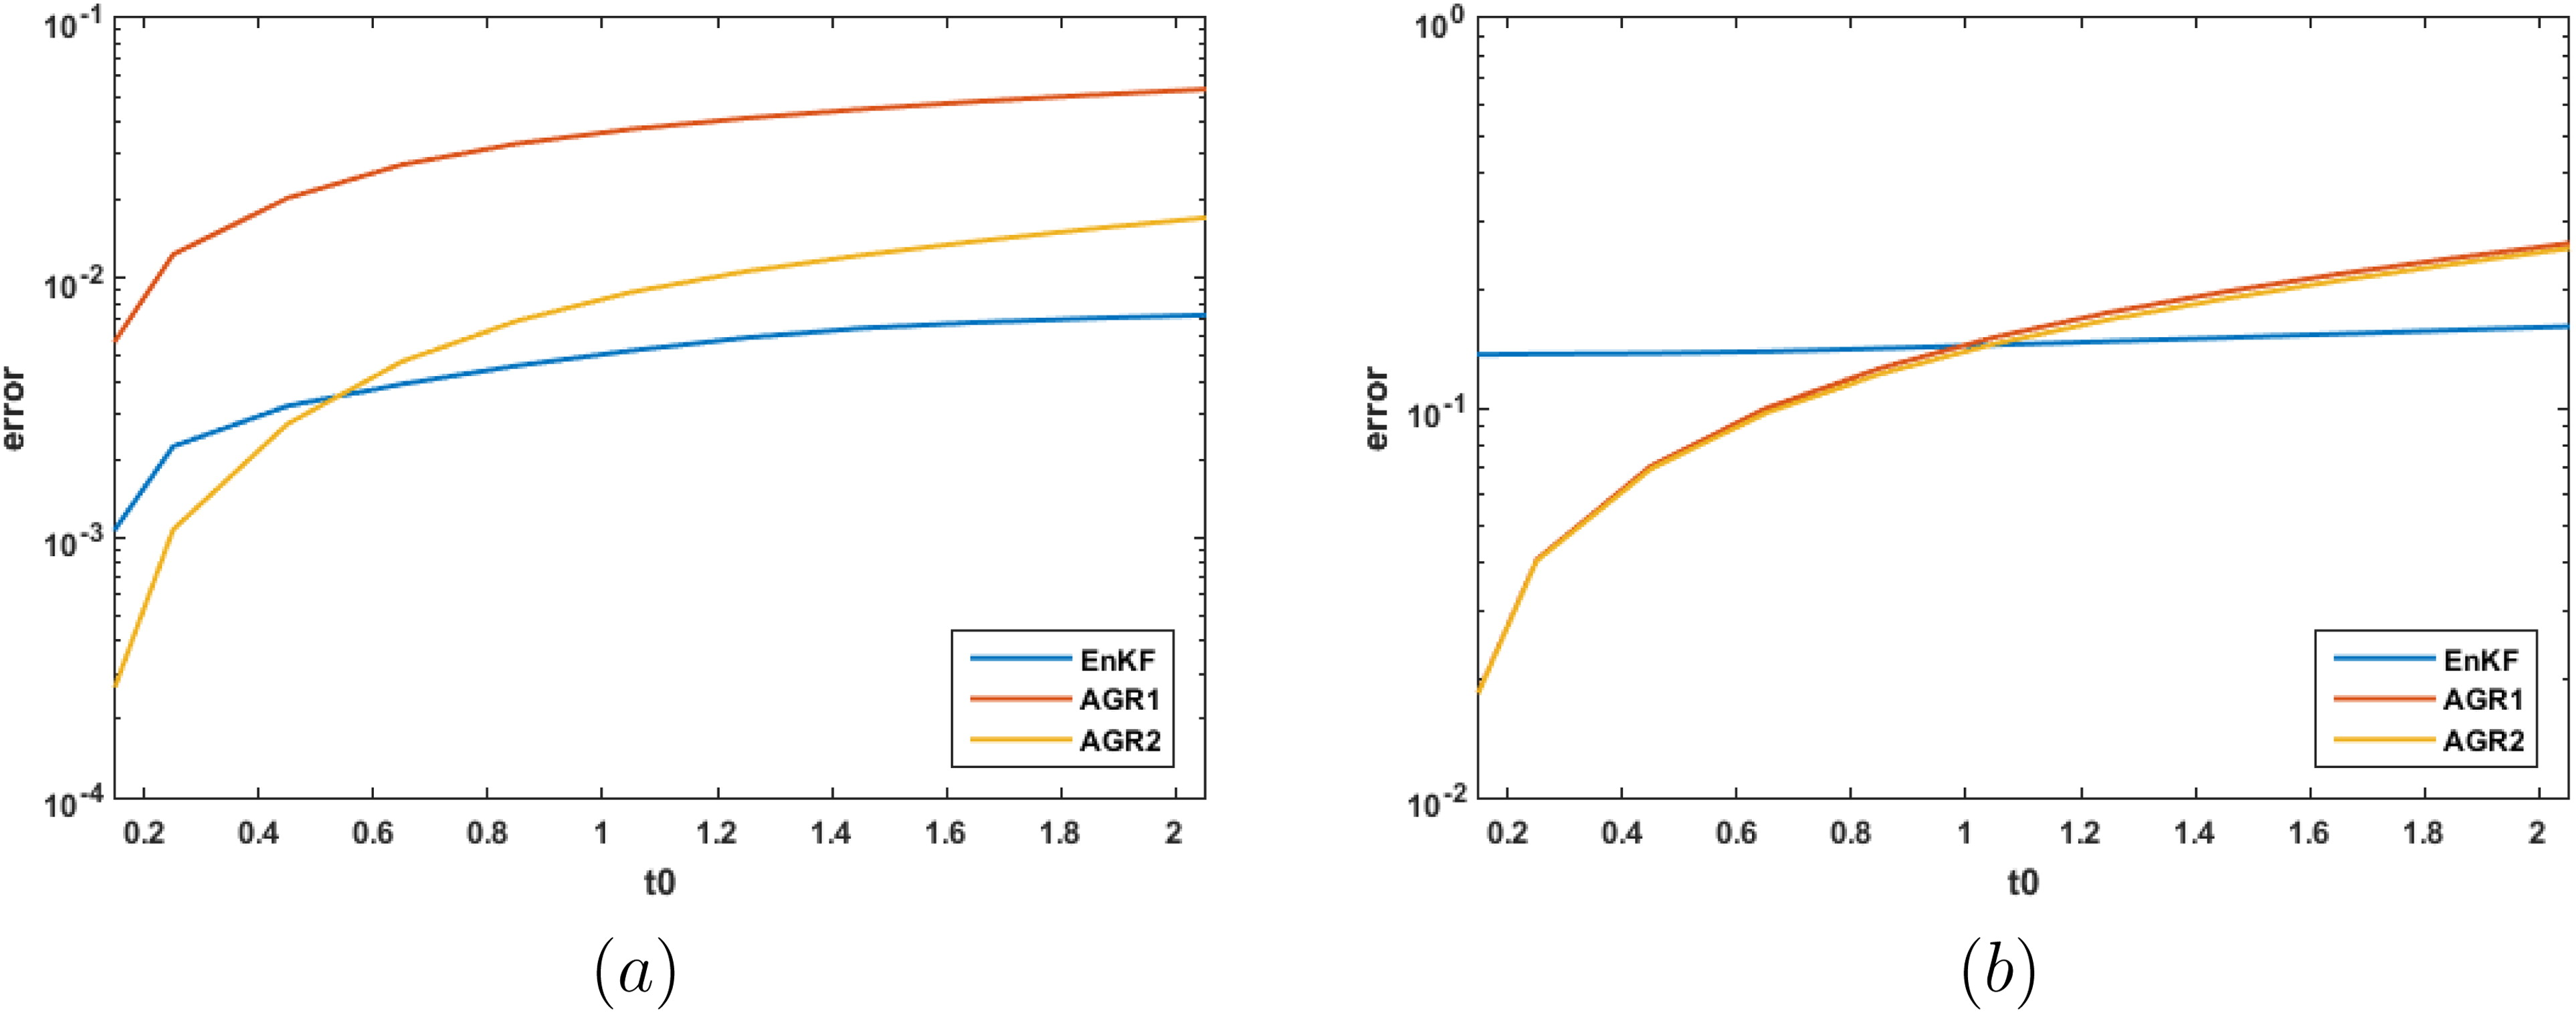
Fig. 5.
(a) The L2 error (vertical axis) in the estimate of the prior mean for the EnKF with k = 500, the AGR1 with m = 250, and AGR2 with m = 250 for time step length t0 (horizontal axis). (b)The error in the Frobenius norm of the corresponding covariance estimates.
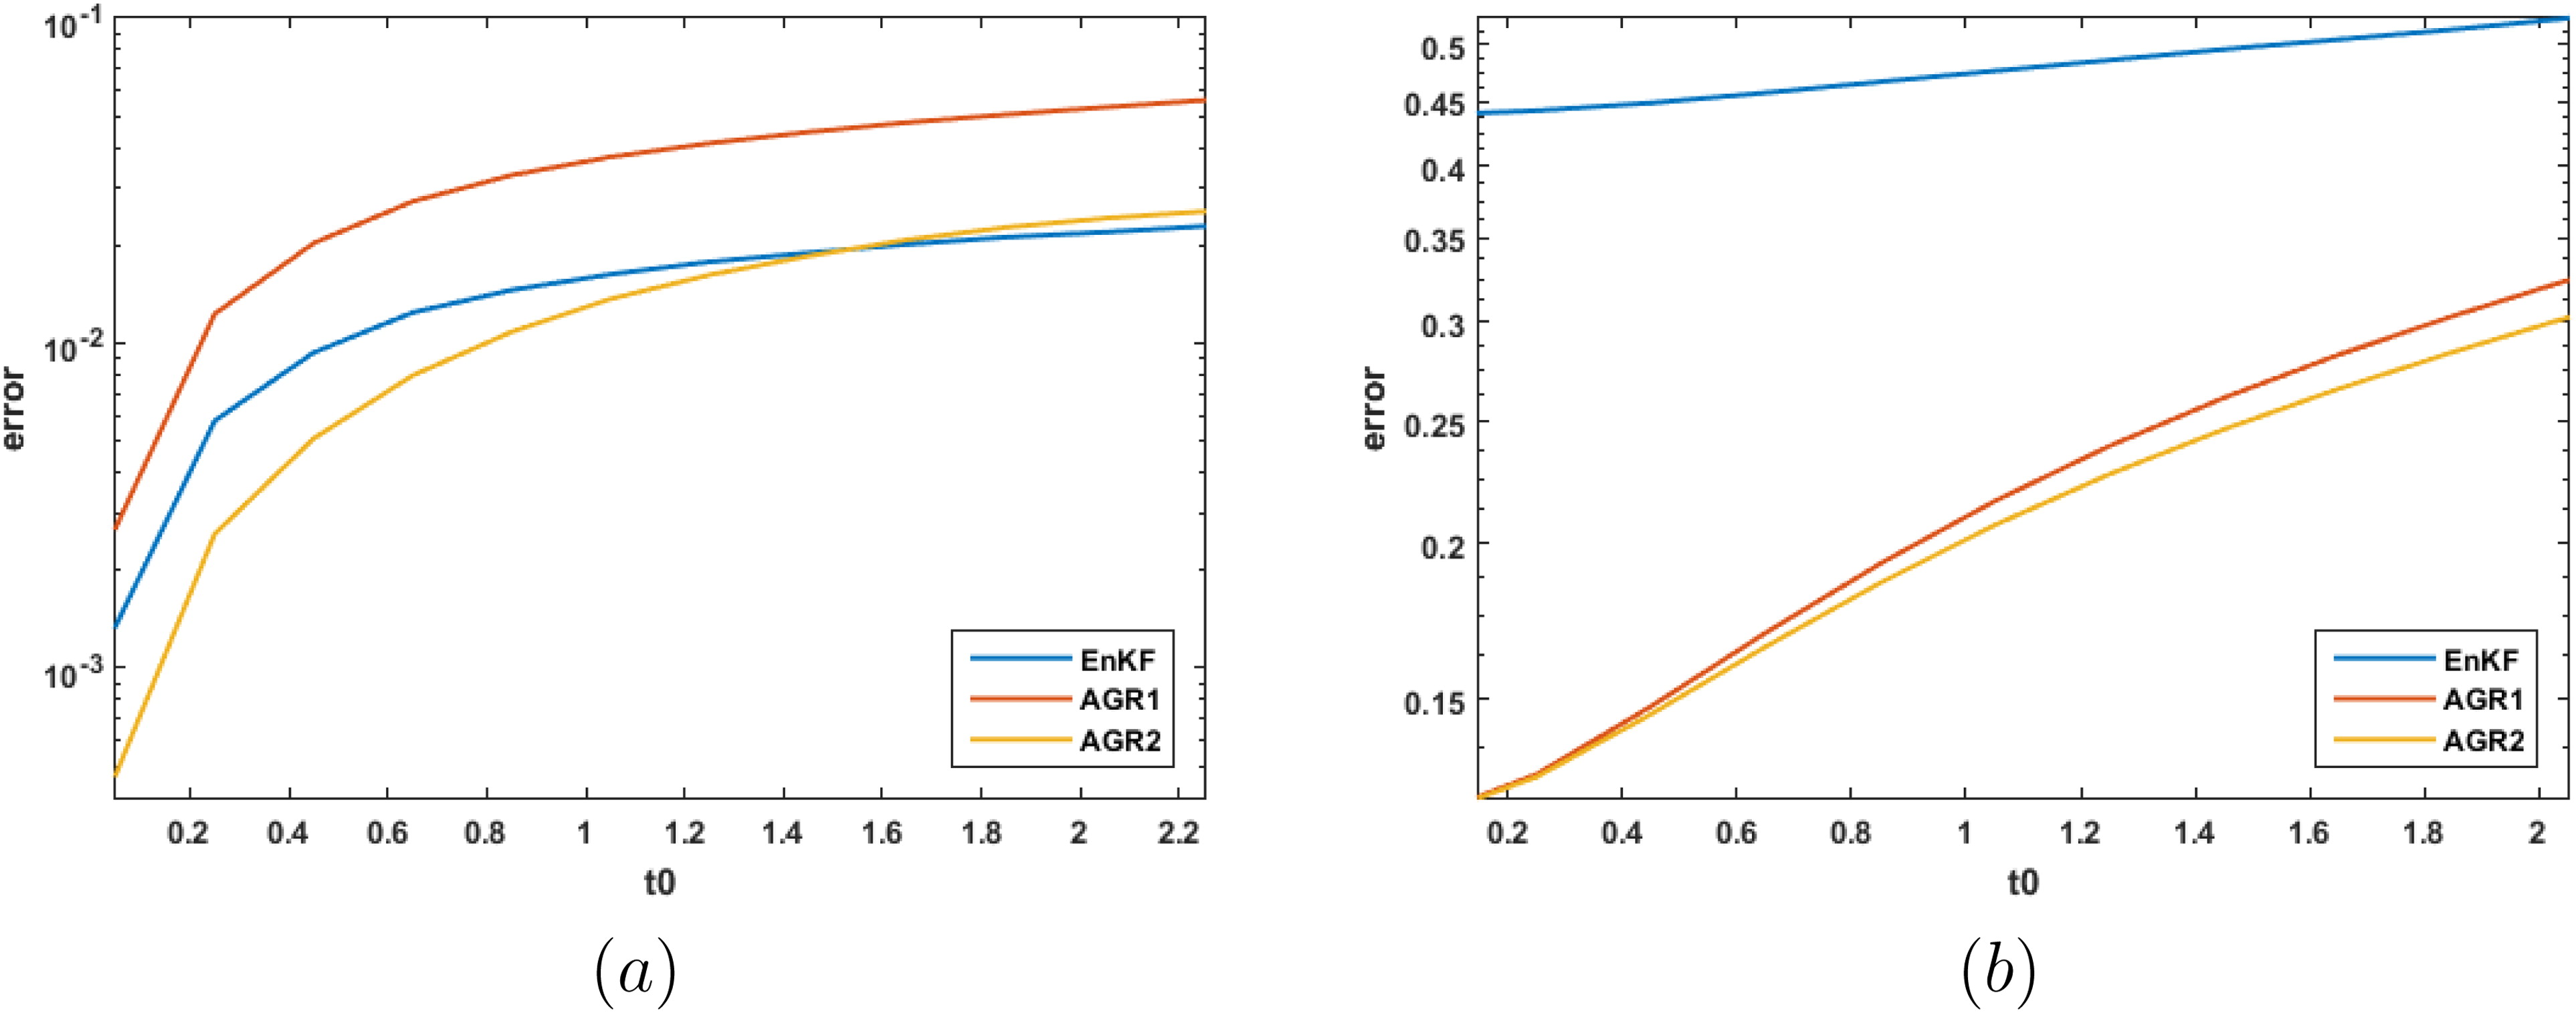
Fig. 6.
(a) The L2 error (vertical axis) in the estimate of the prior mean for the EnKF with k = 40, the AGR1 with m = 20, and AGR2 with m = 20 for time step length t0 (horizontal axis). (b) The corresponding error in the Forbenius norm for the prior covariance estimates.
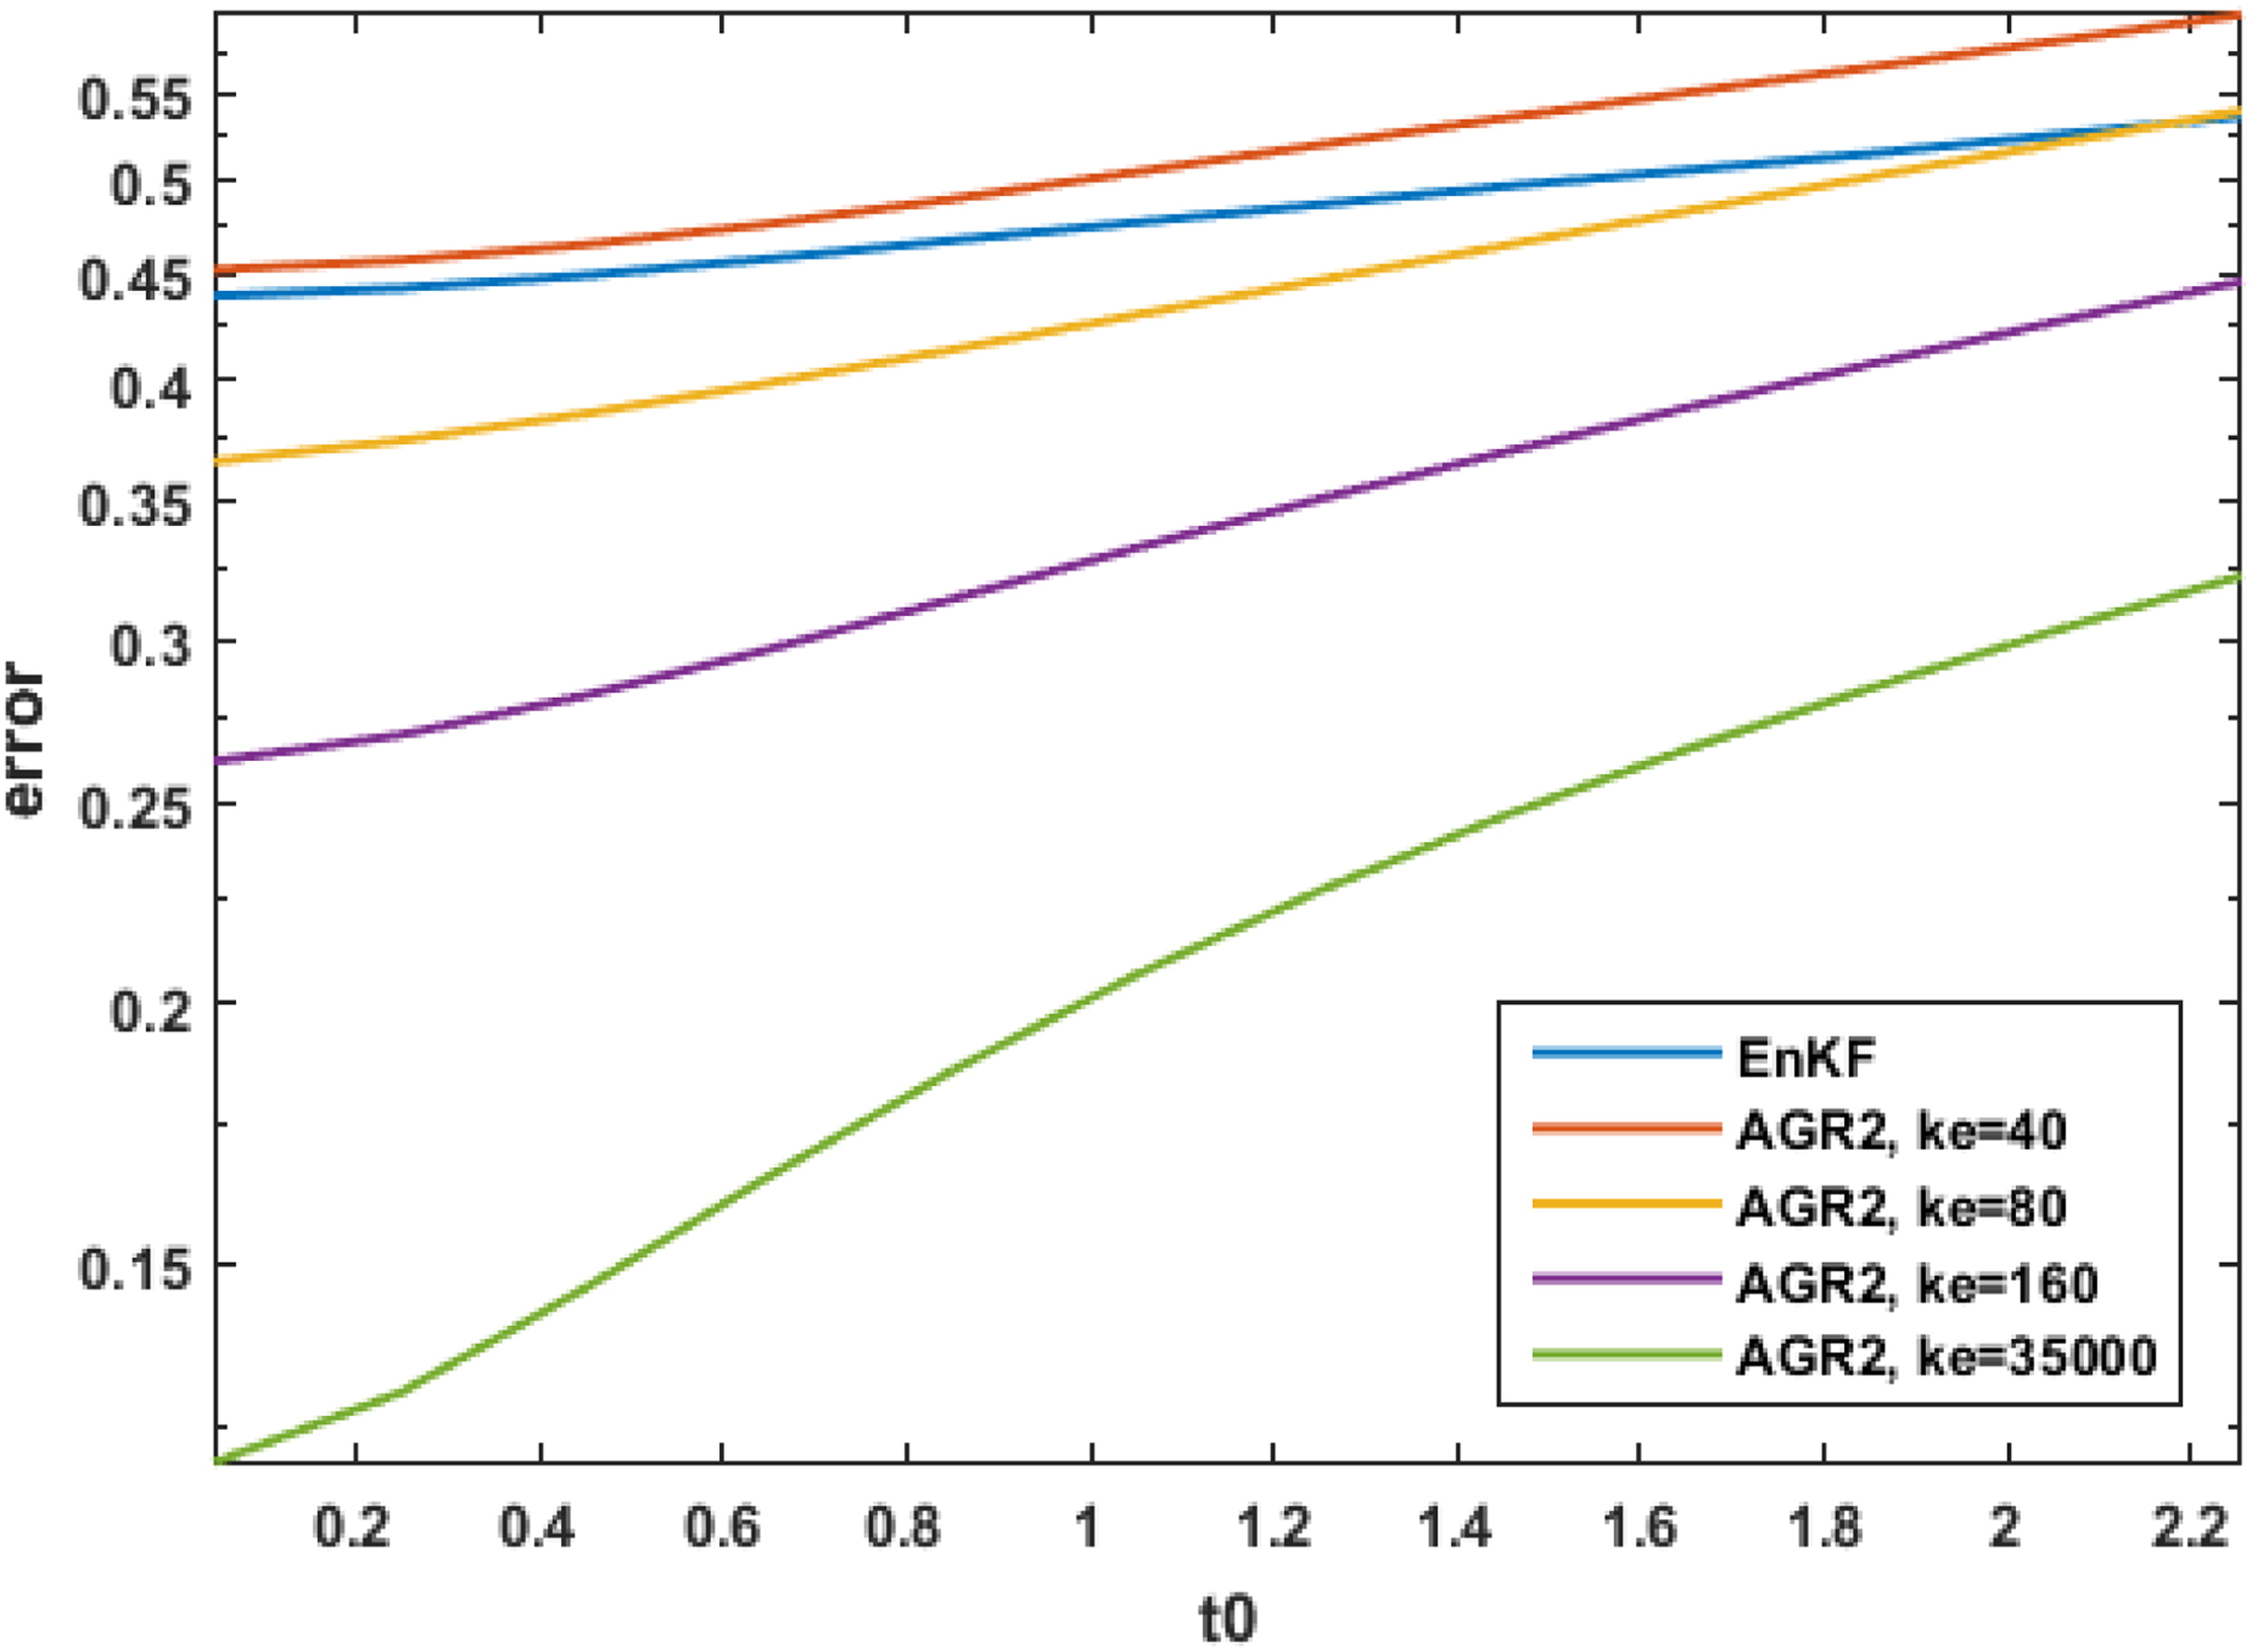
Fig. 7.
The error in the Frobenius norm (vertical axis) of the prior covariance estimates in the AGR2 filter for m = 20 with computed using ensemble members for time step length t0 (horizontal axis).
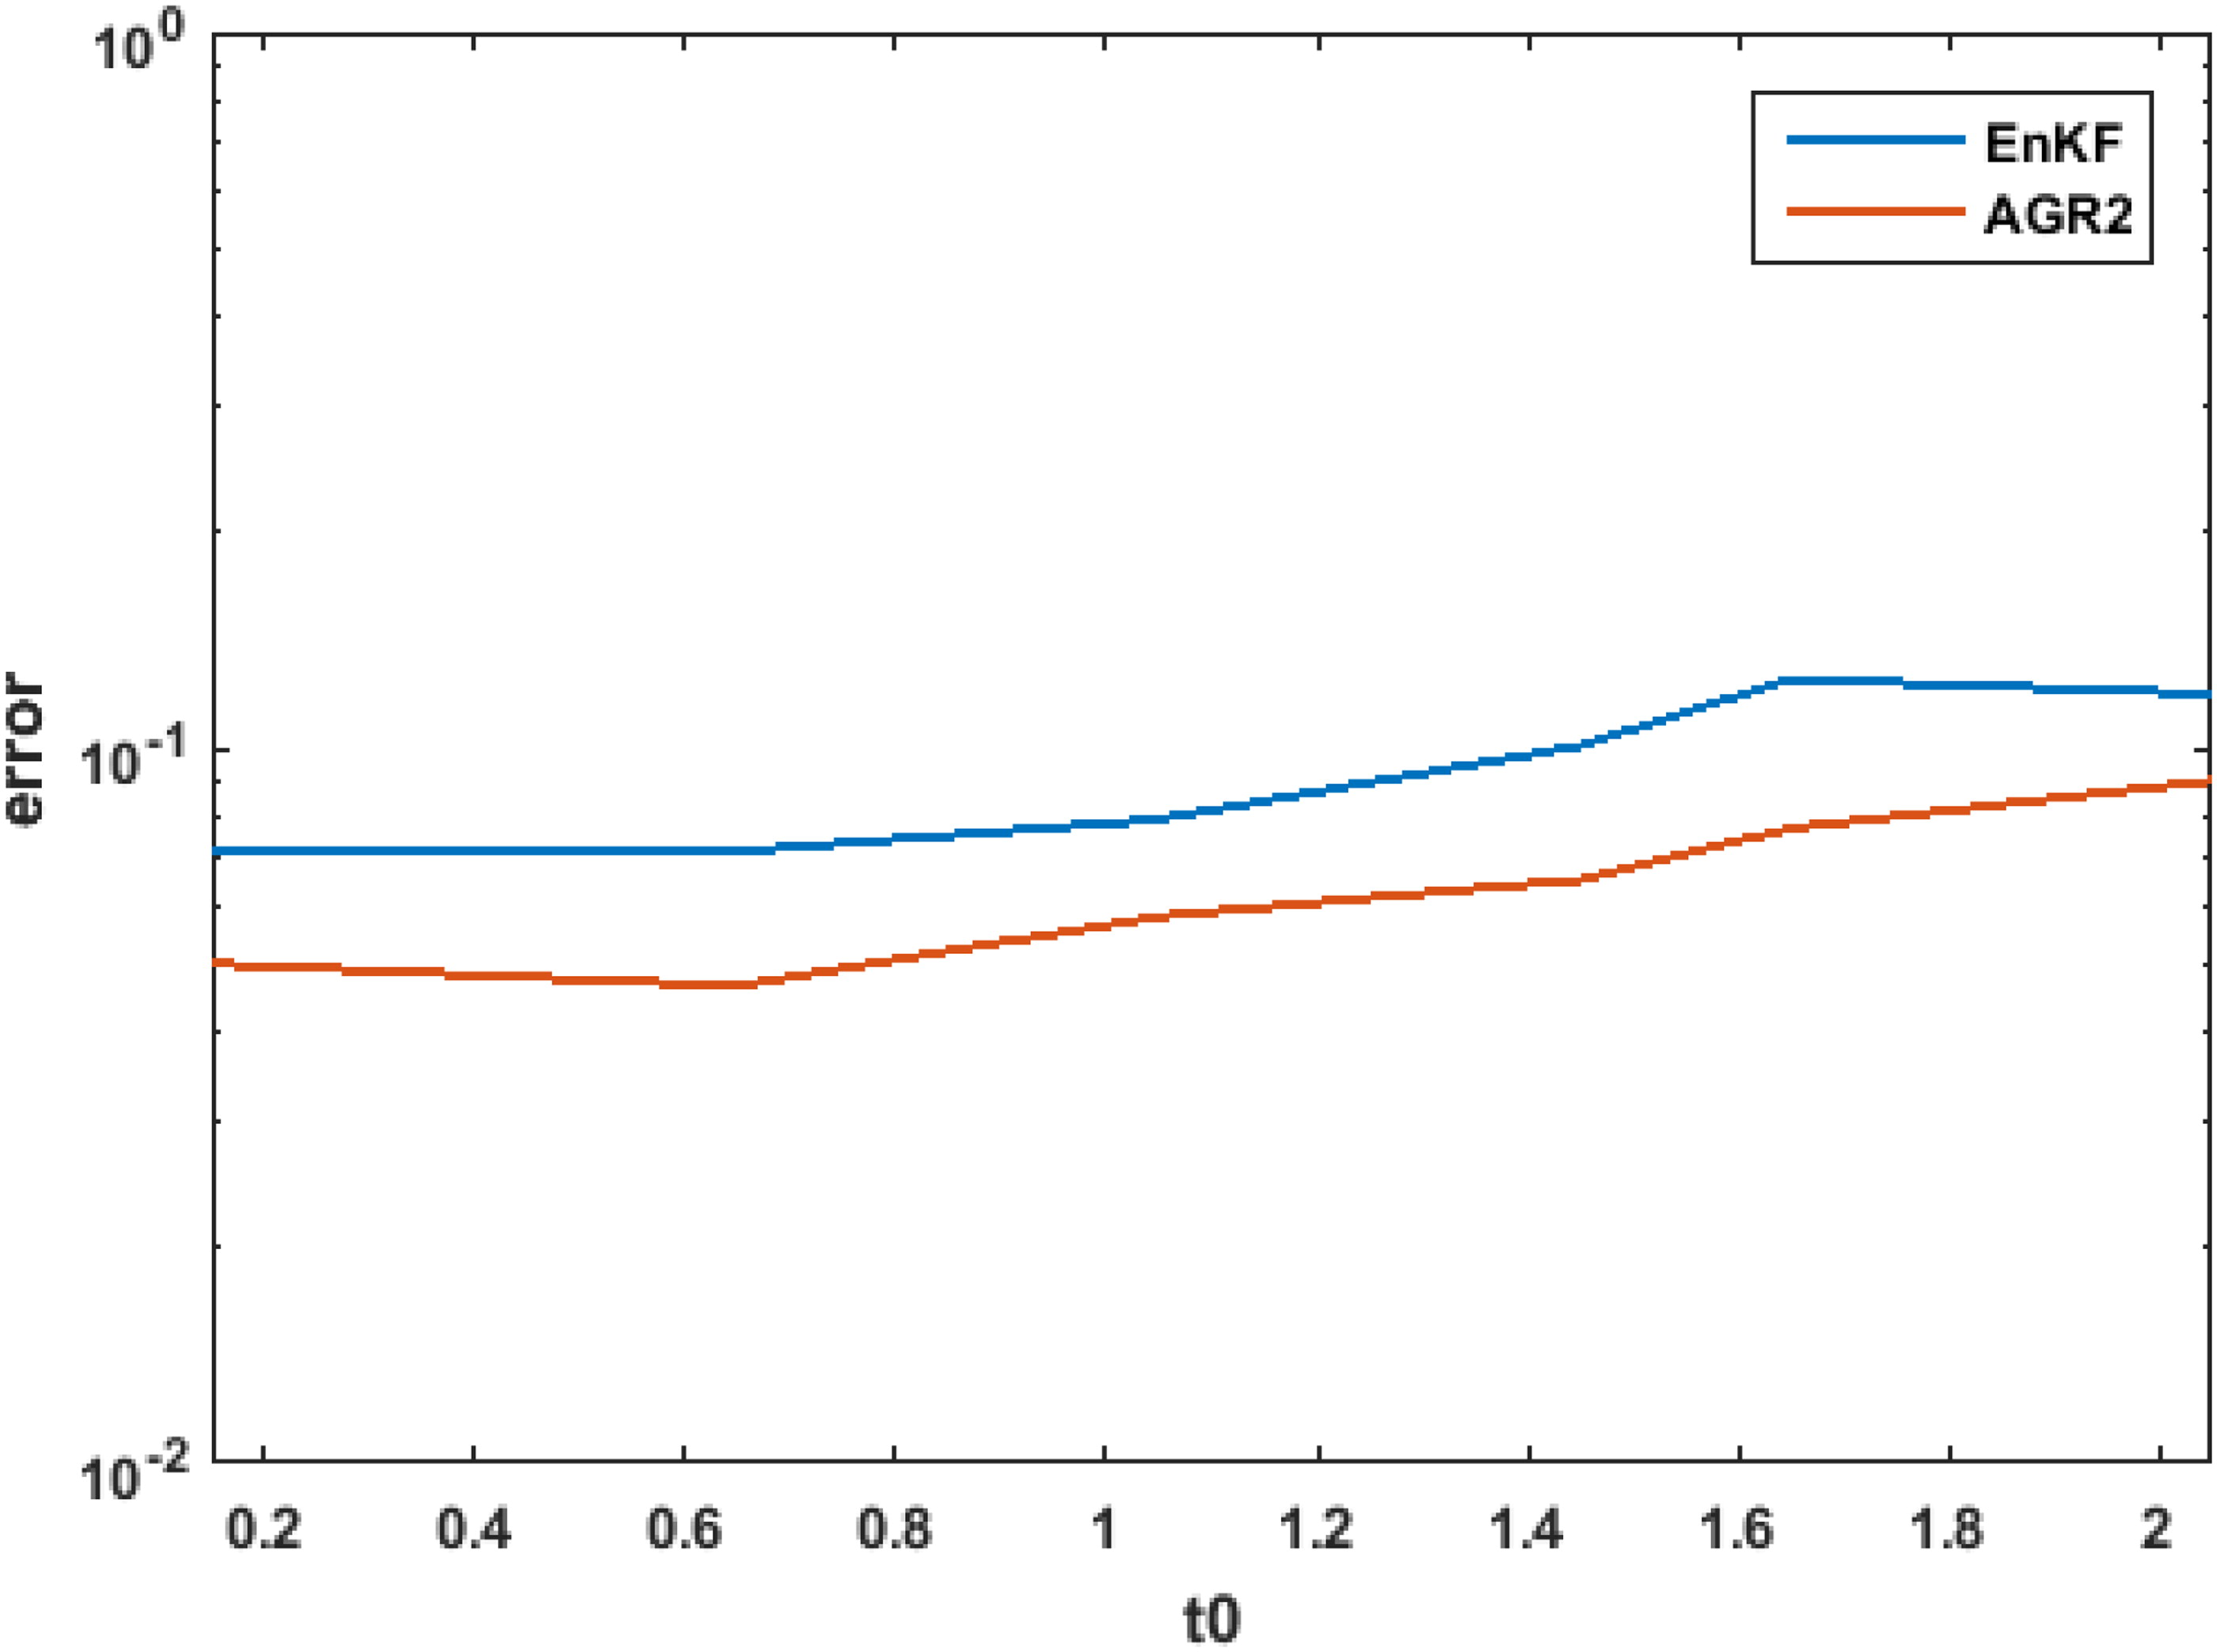
Fig. 8.
The L2 error (vertical axis) averaged over the assimilation window for increasing t0 (horizontal axis), the time between cycles, for the EnKF and the AGR2 filter.
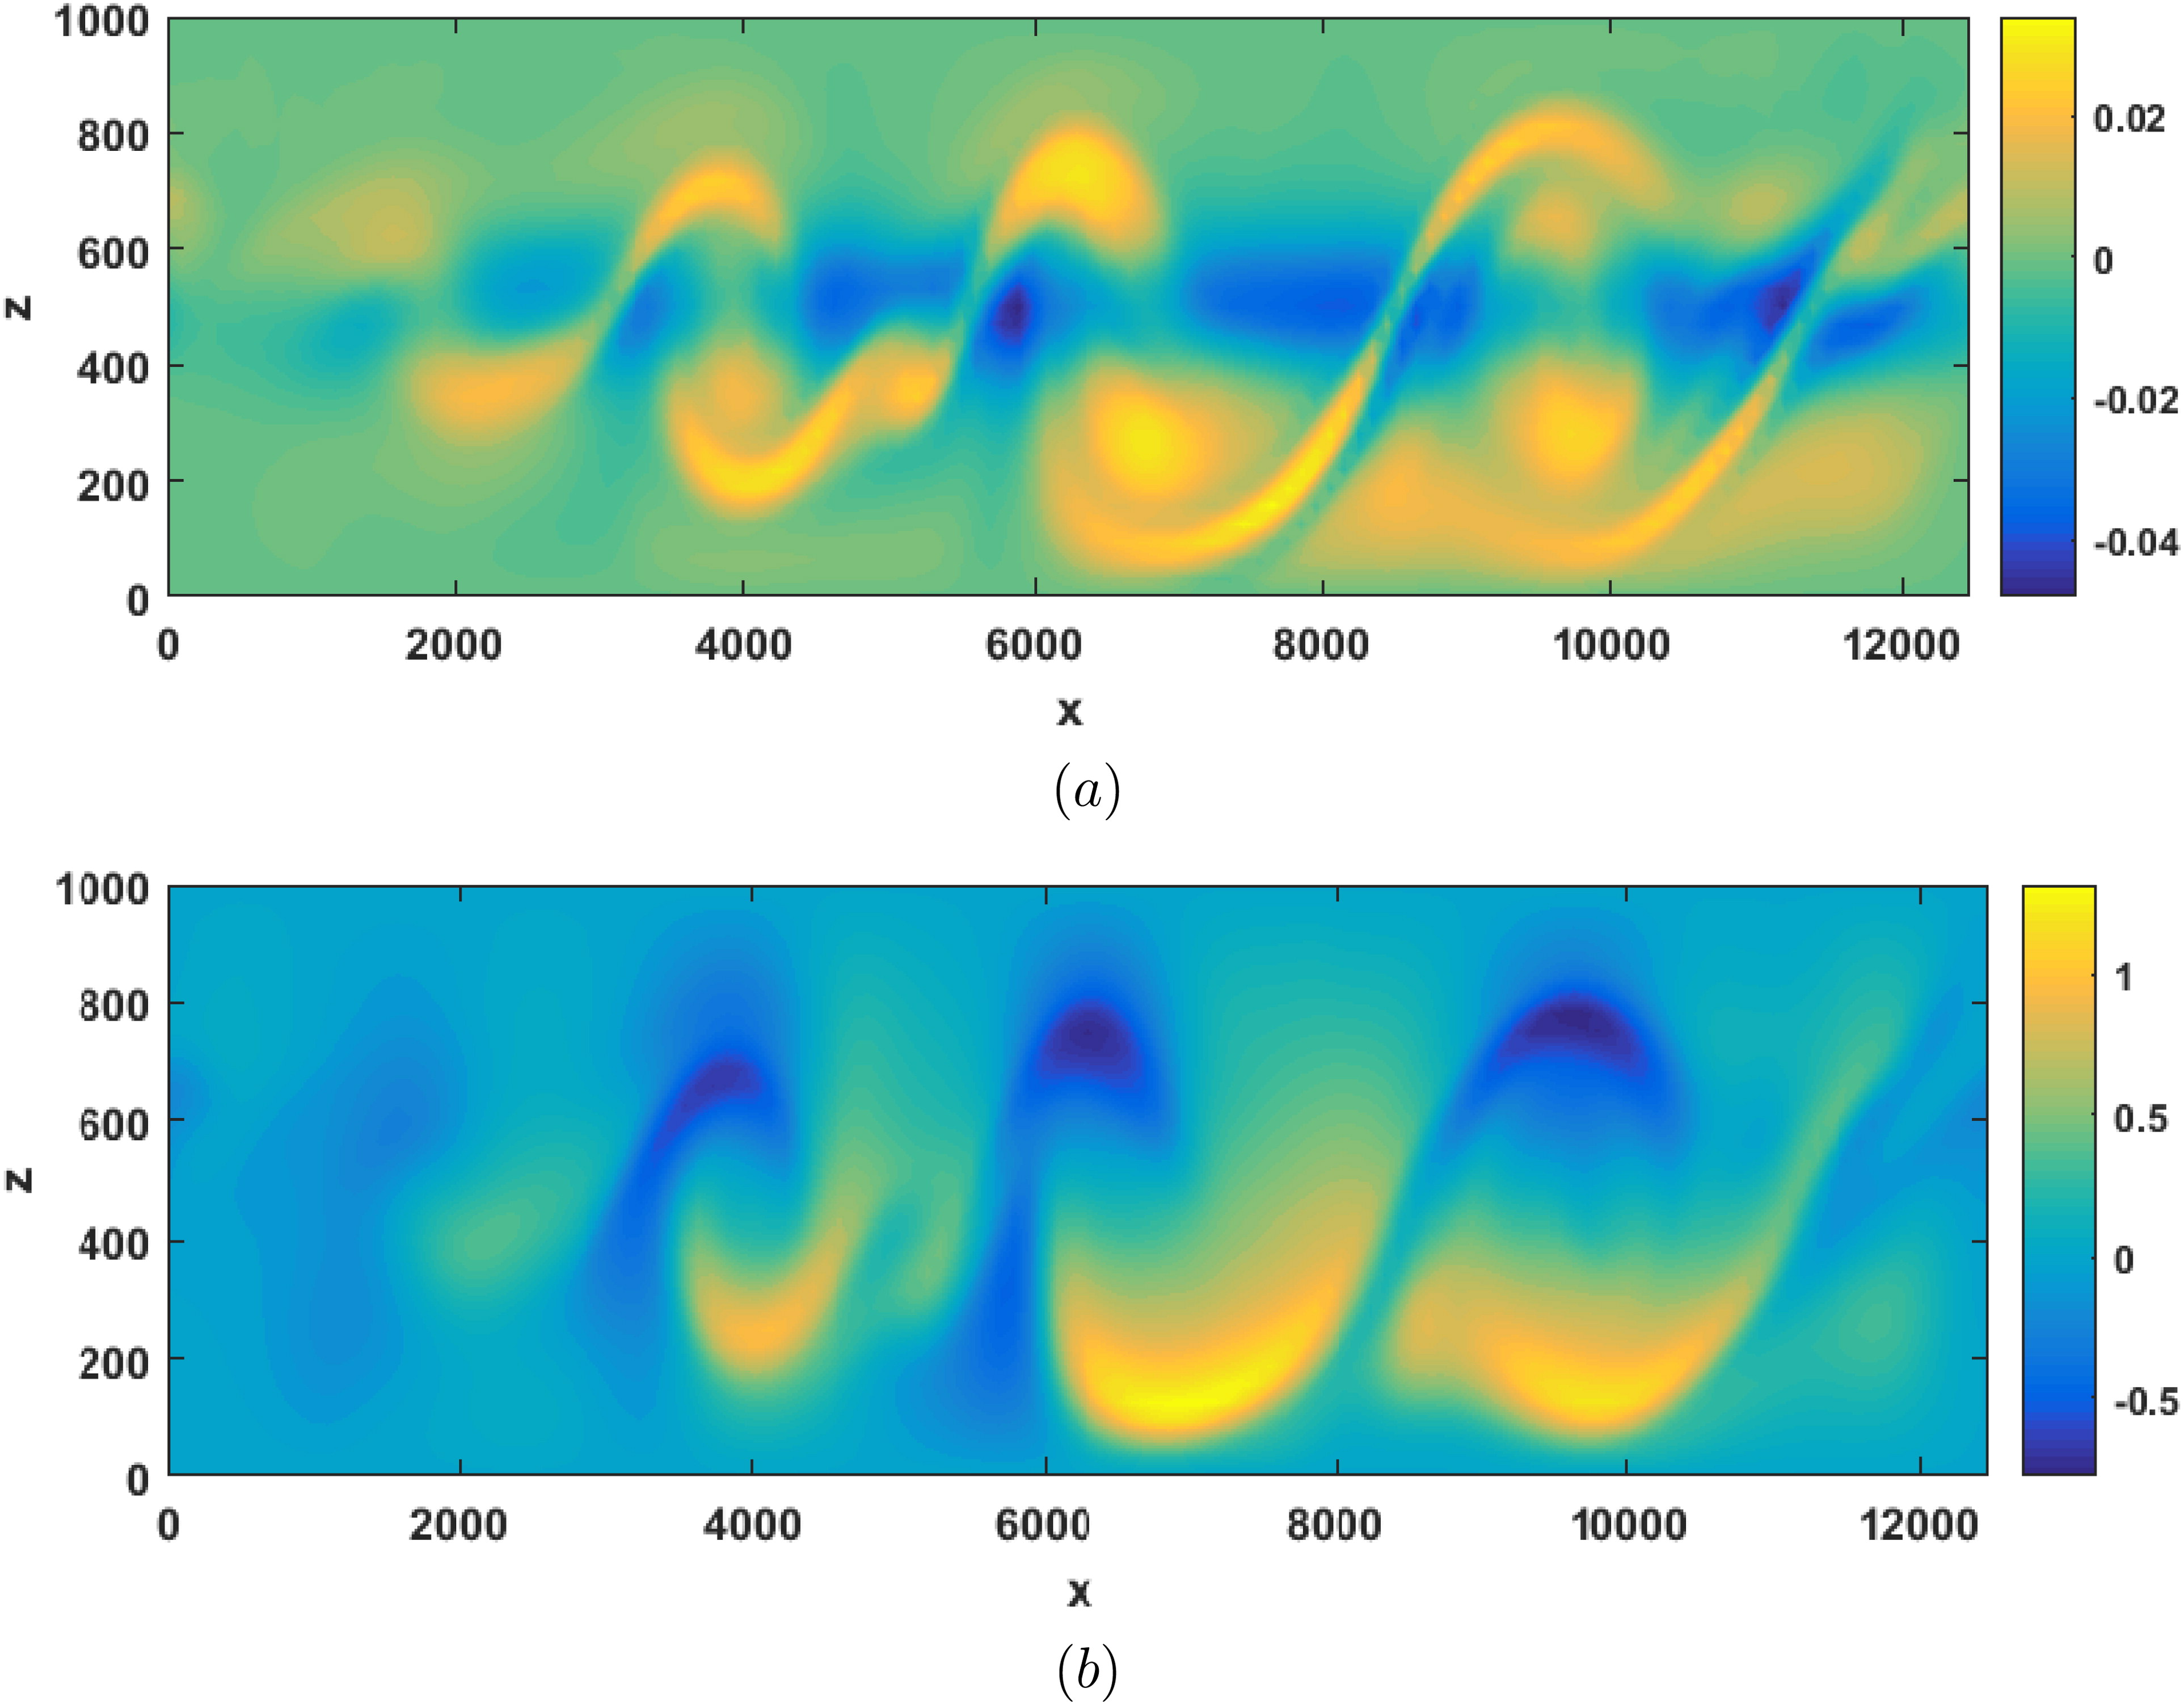
Fig. 9.
The true solution of (5.1) at time t = 15000, or 200 cycles of 75 seconds, for (a) vorticity and (b) temperature. The vertical axis is the height and the horizontal axis is the distance.
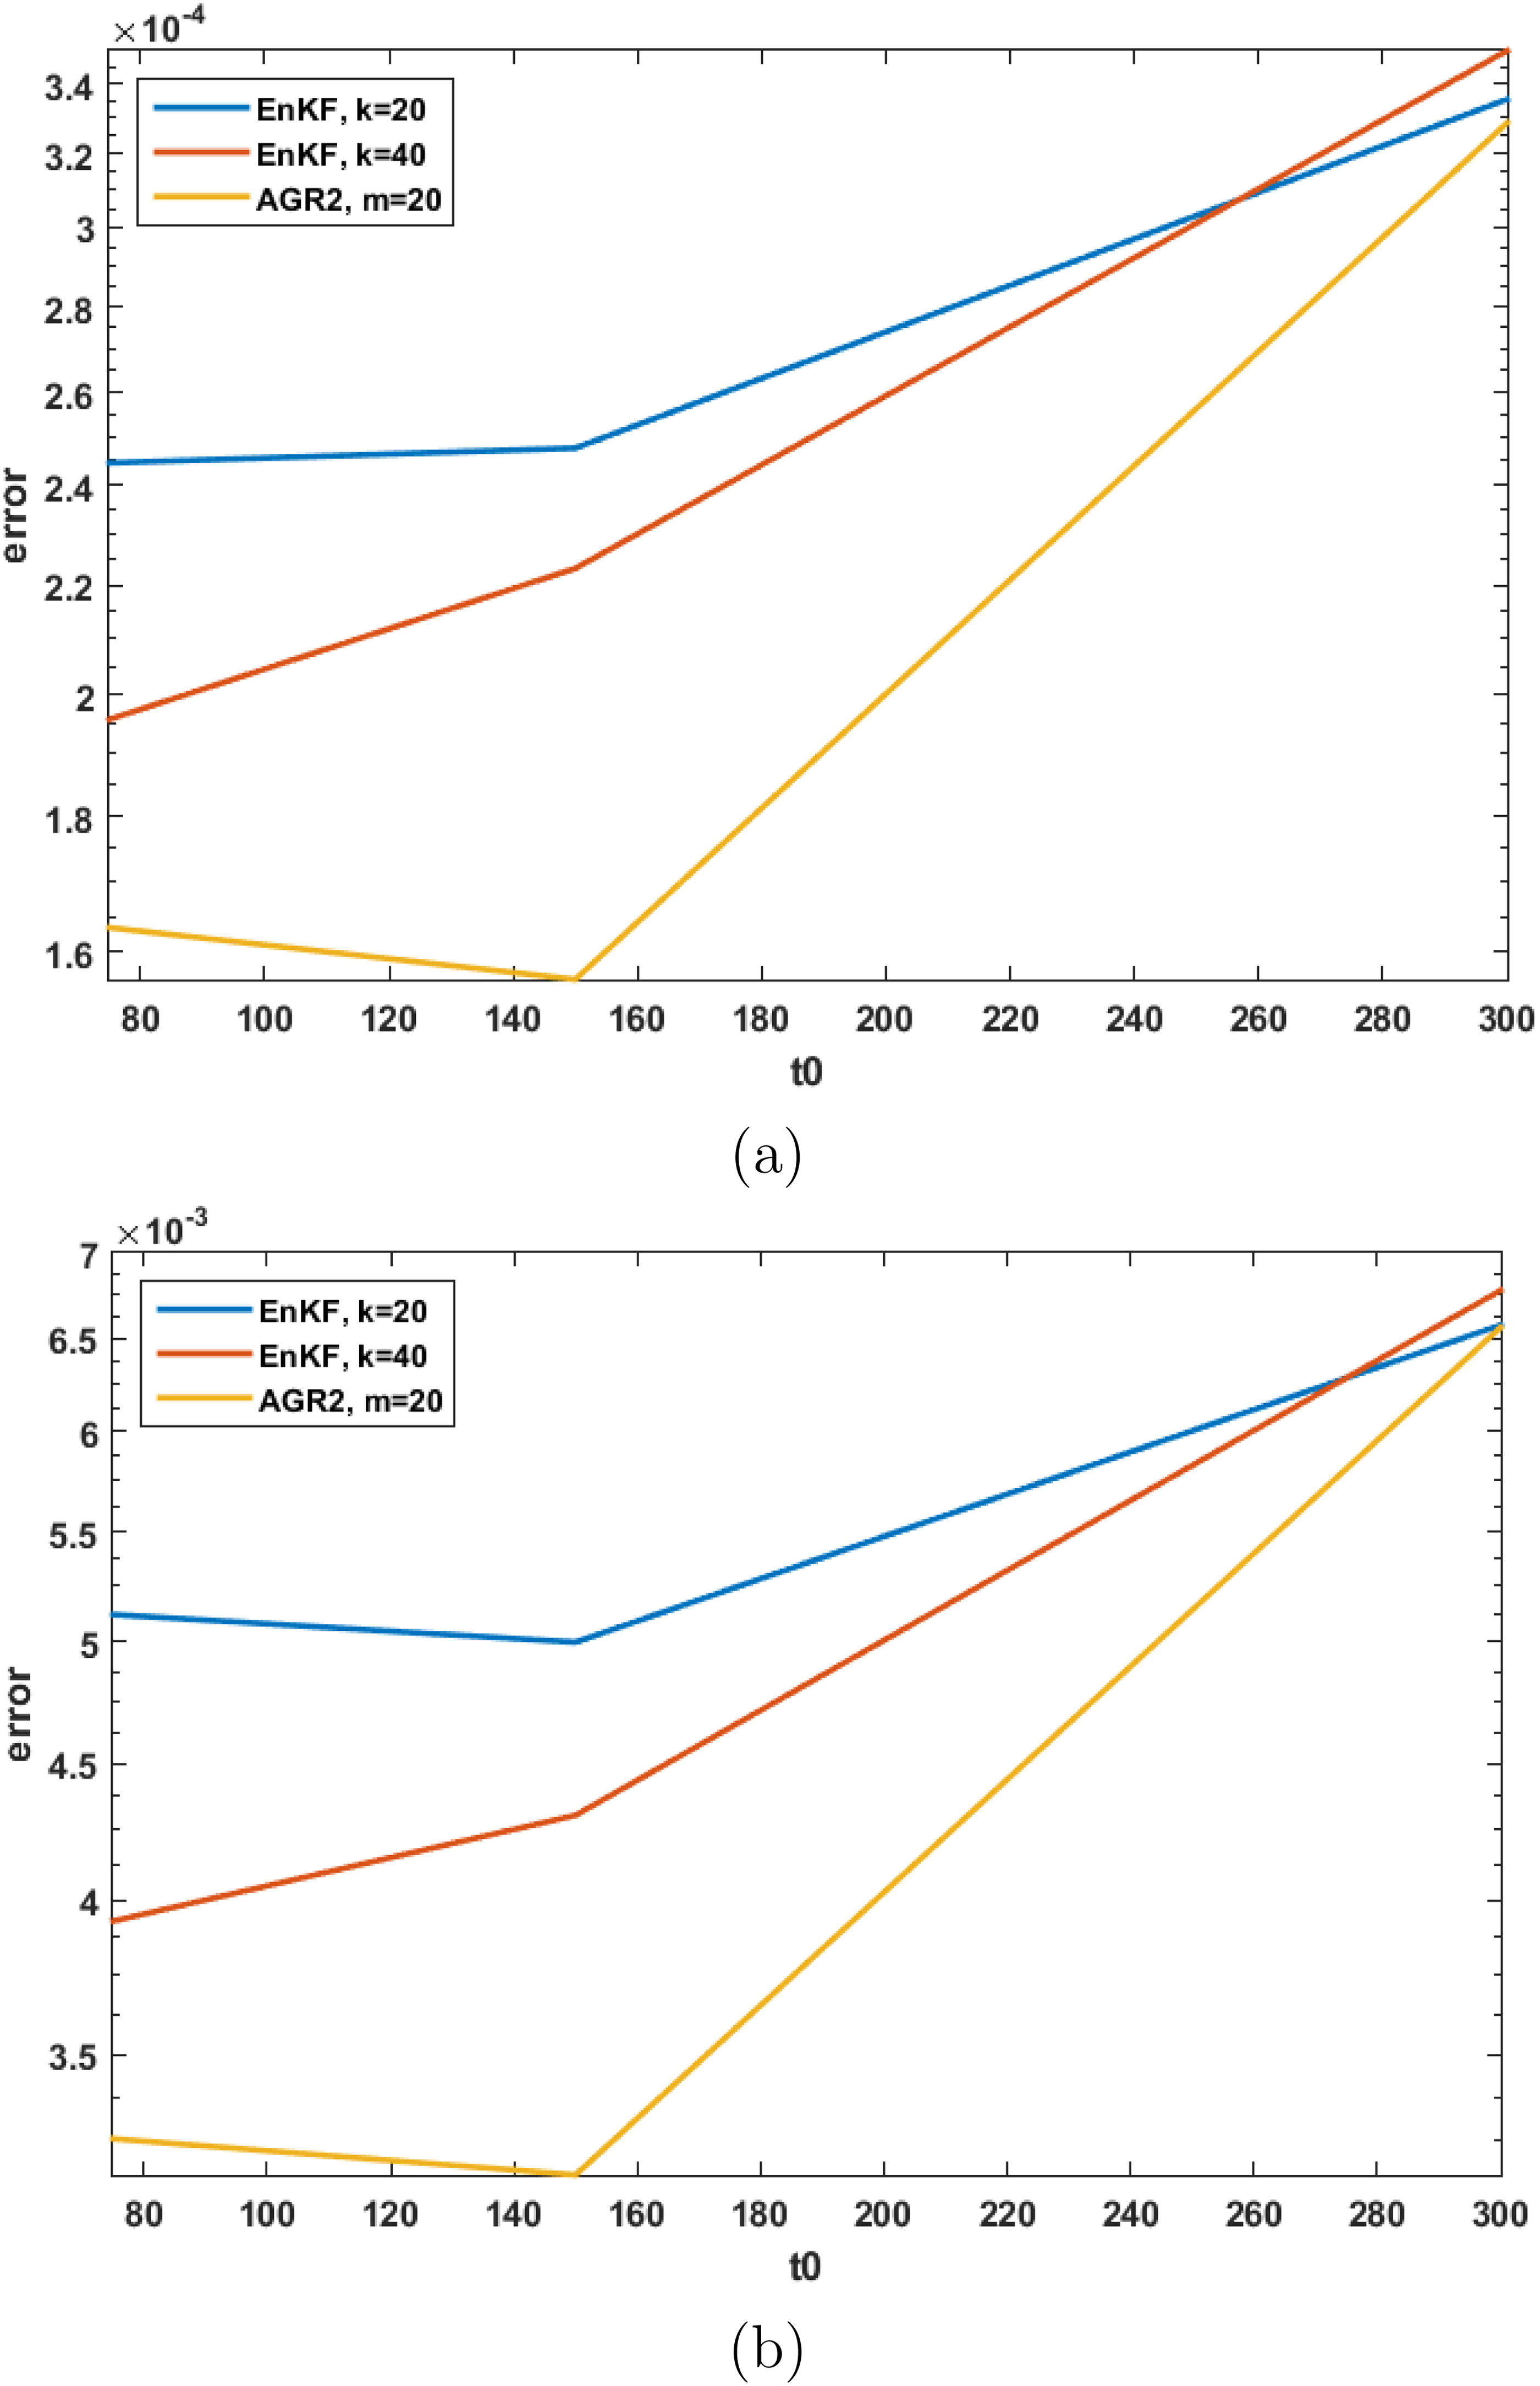
Fig. 10.
The averaged L2 error (vertical axis) across the data assimilation window in the mean estimates for particular t0 (horizontal axis) for (a) vorticity and (b) temperature.