
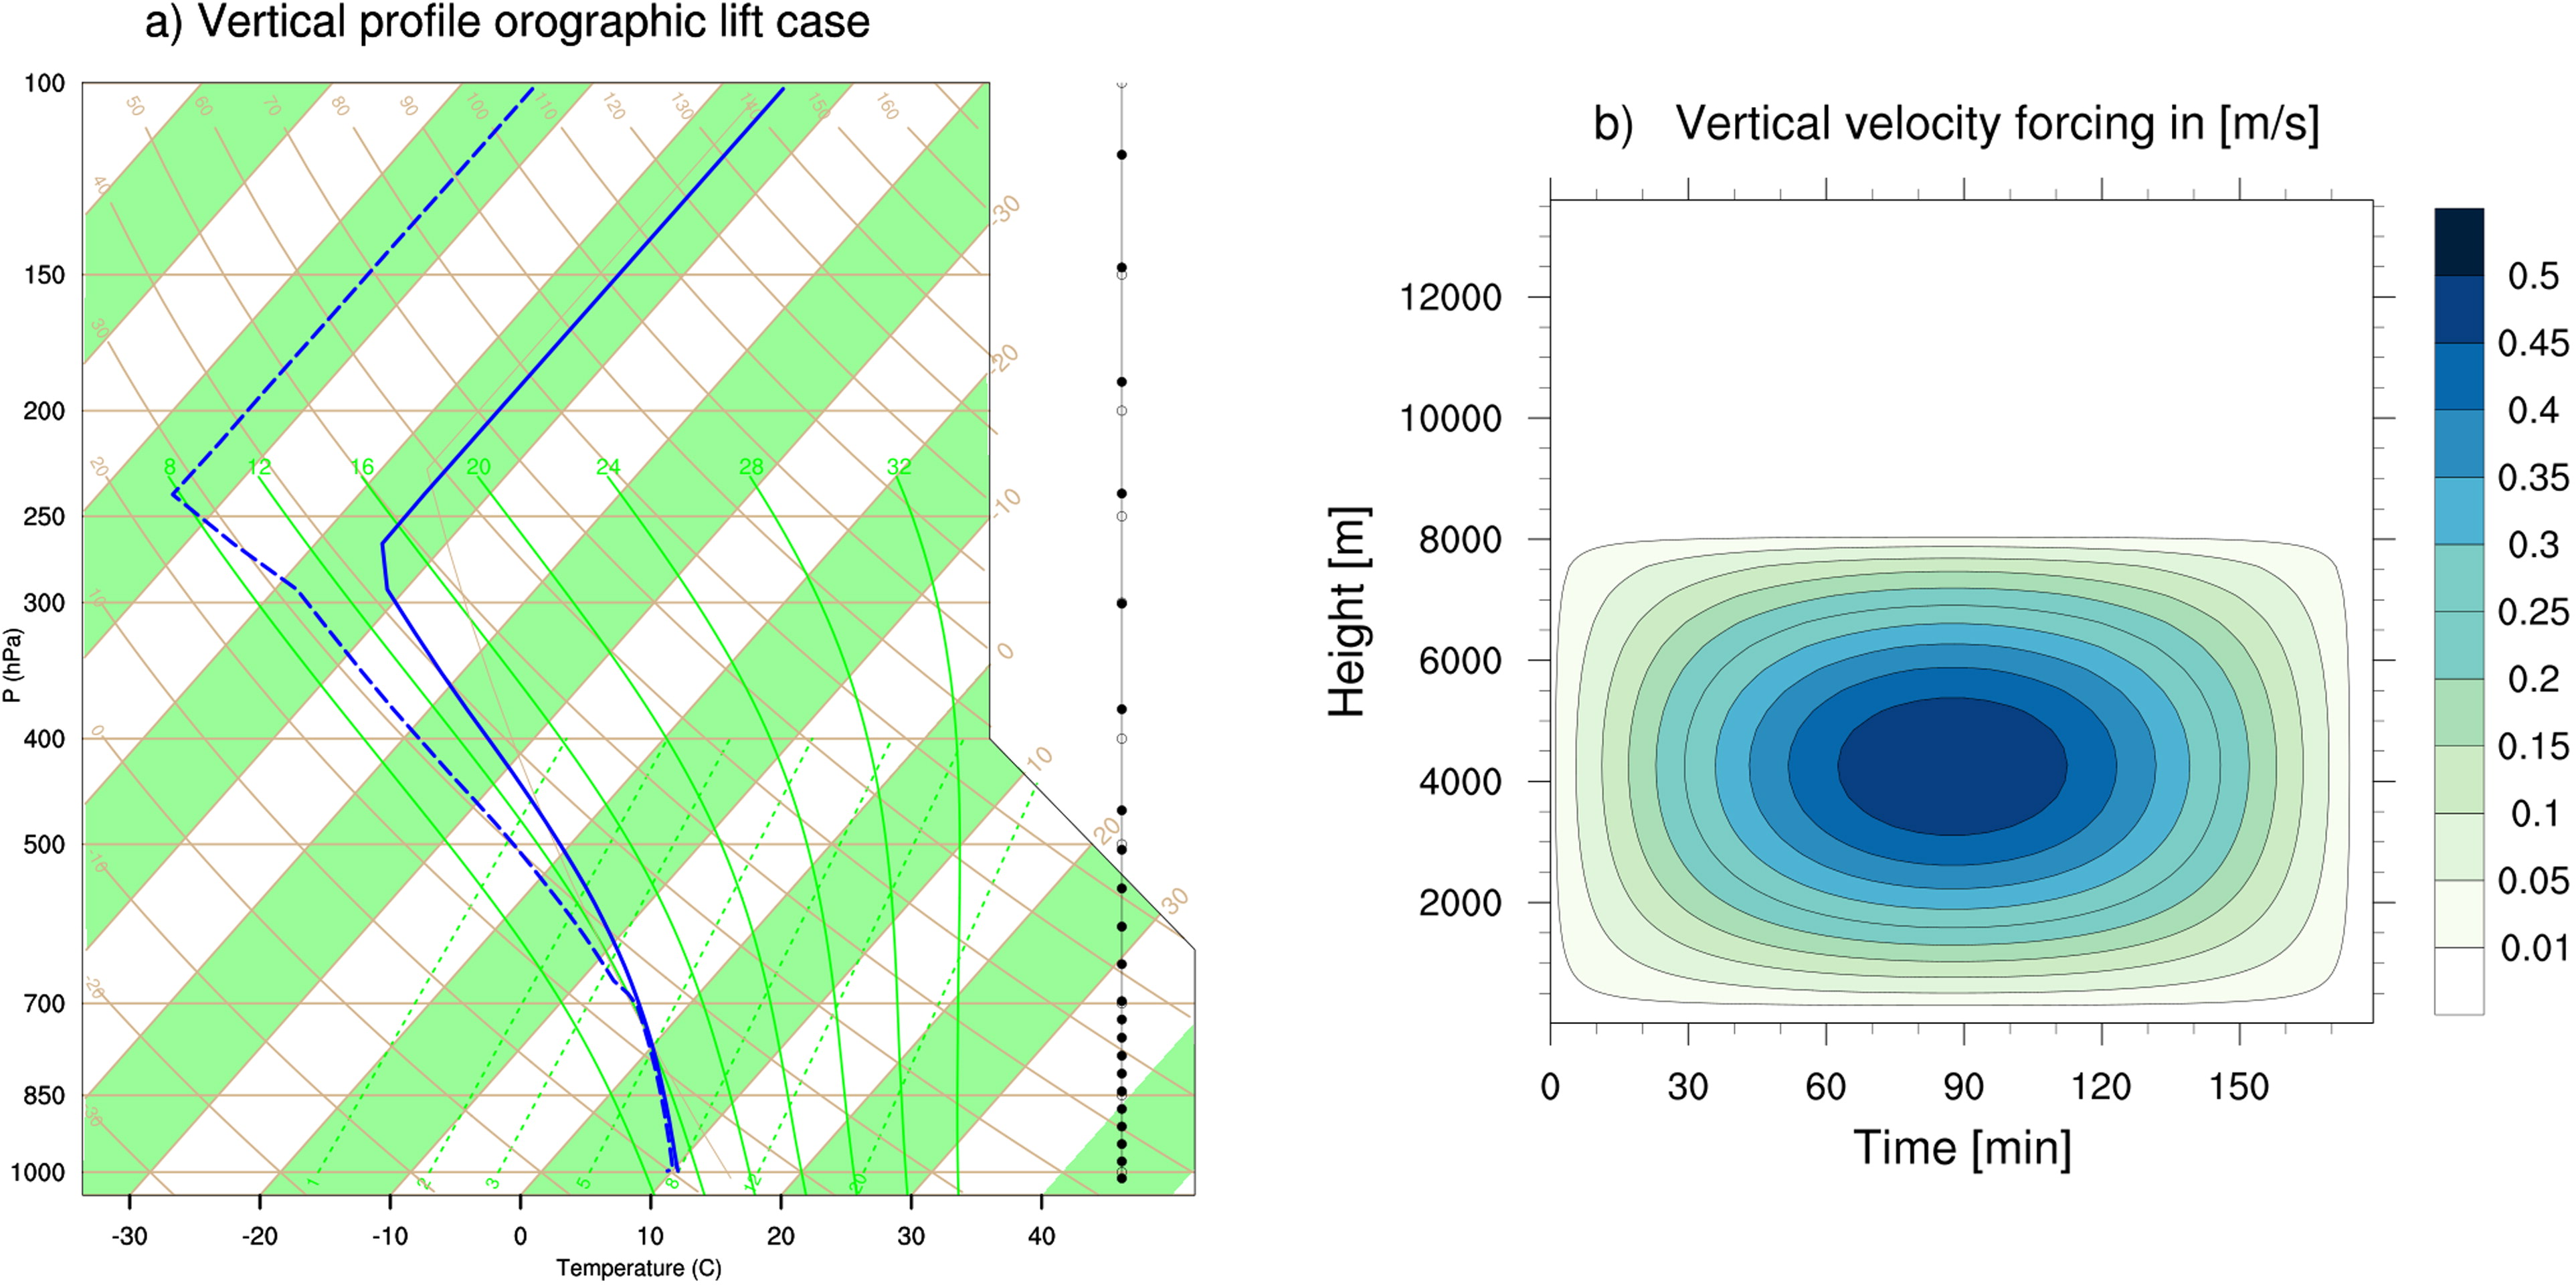
Fig. 1.
(a) Skew-T plot of the initial profile and (b) time-height cross-section of the vertical velocity forcing used for the orographic lifting case in MUSC.
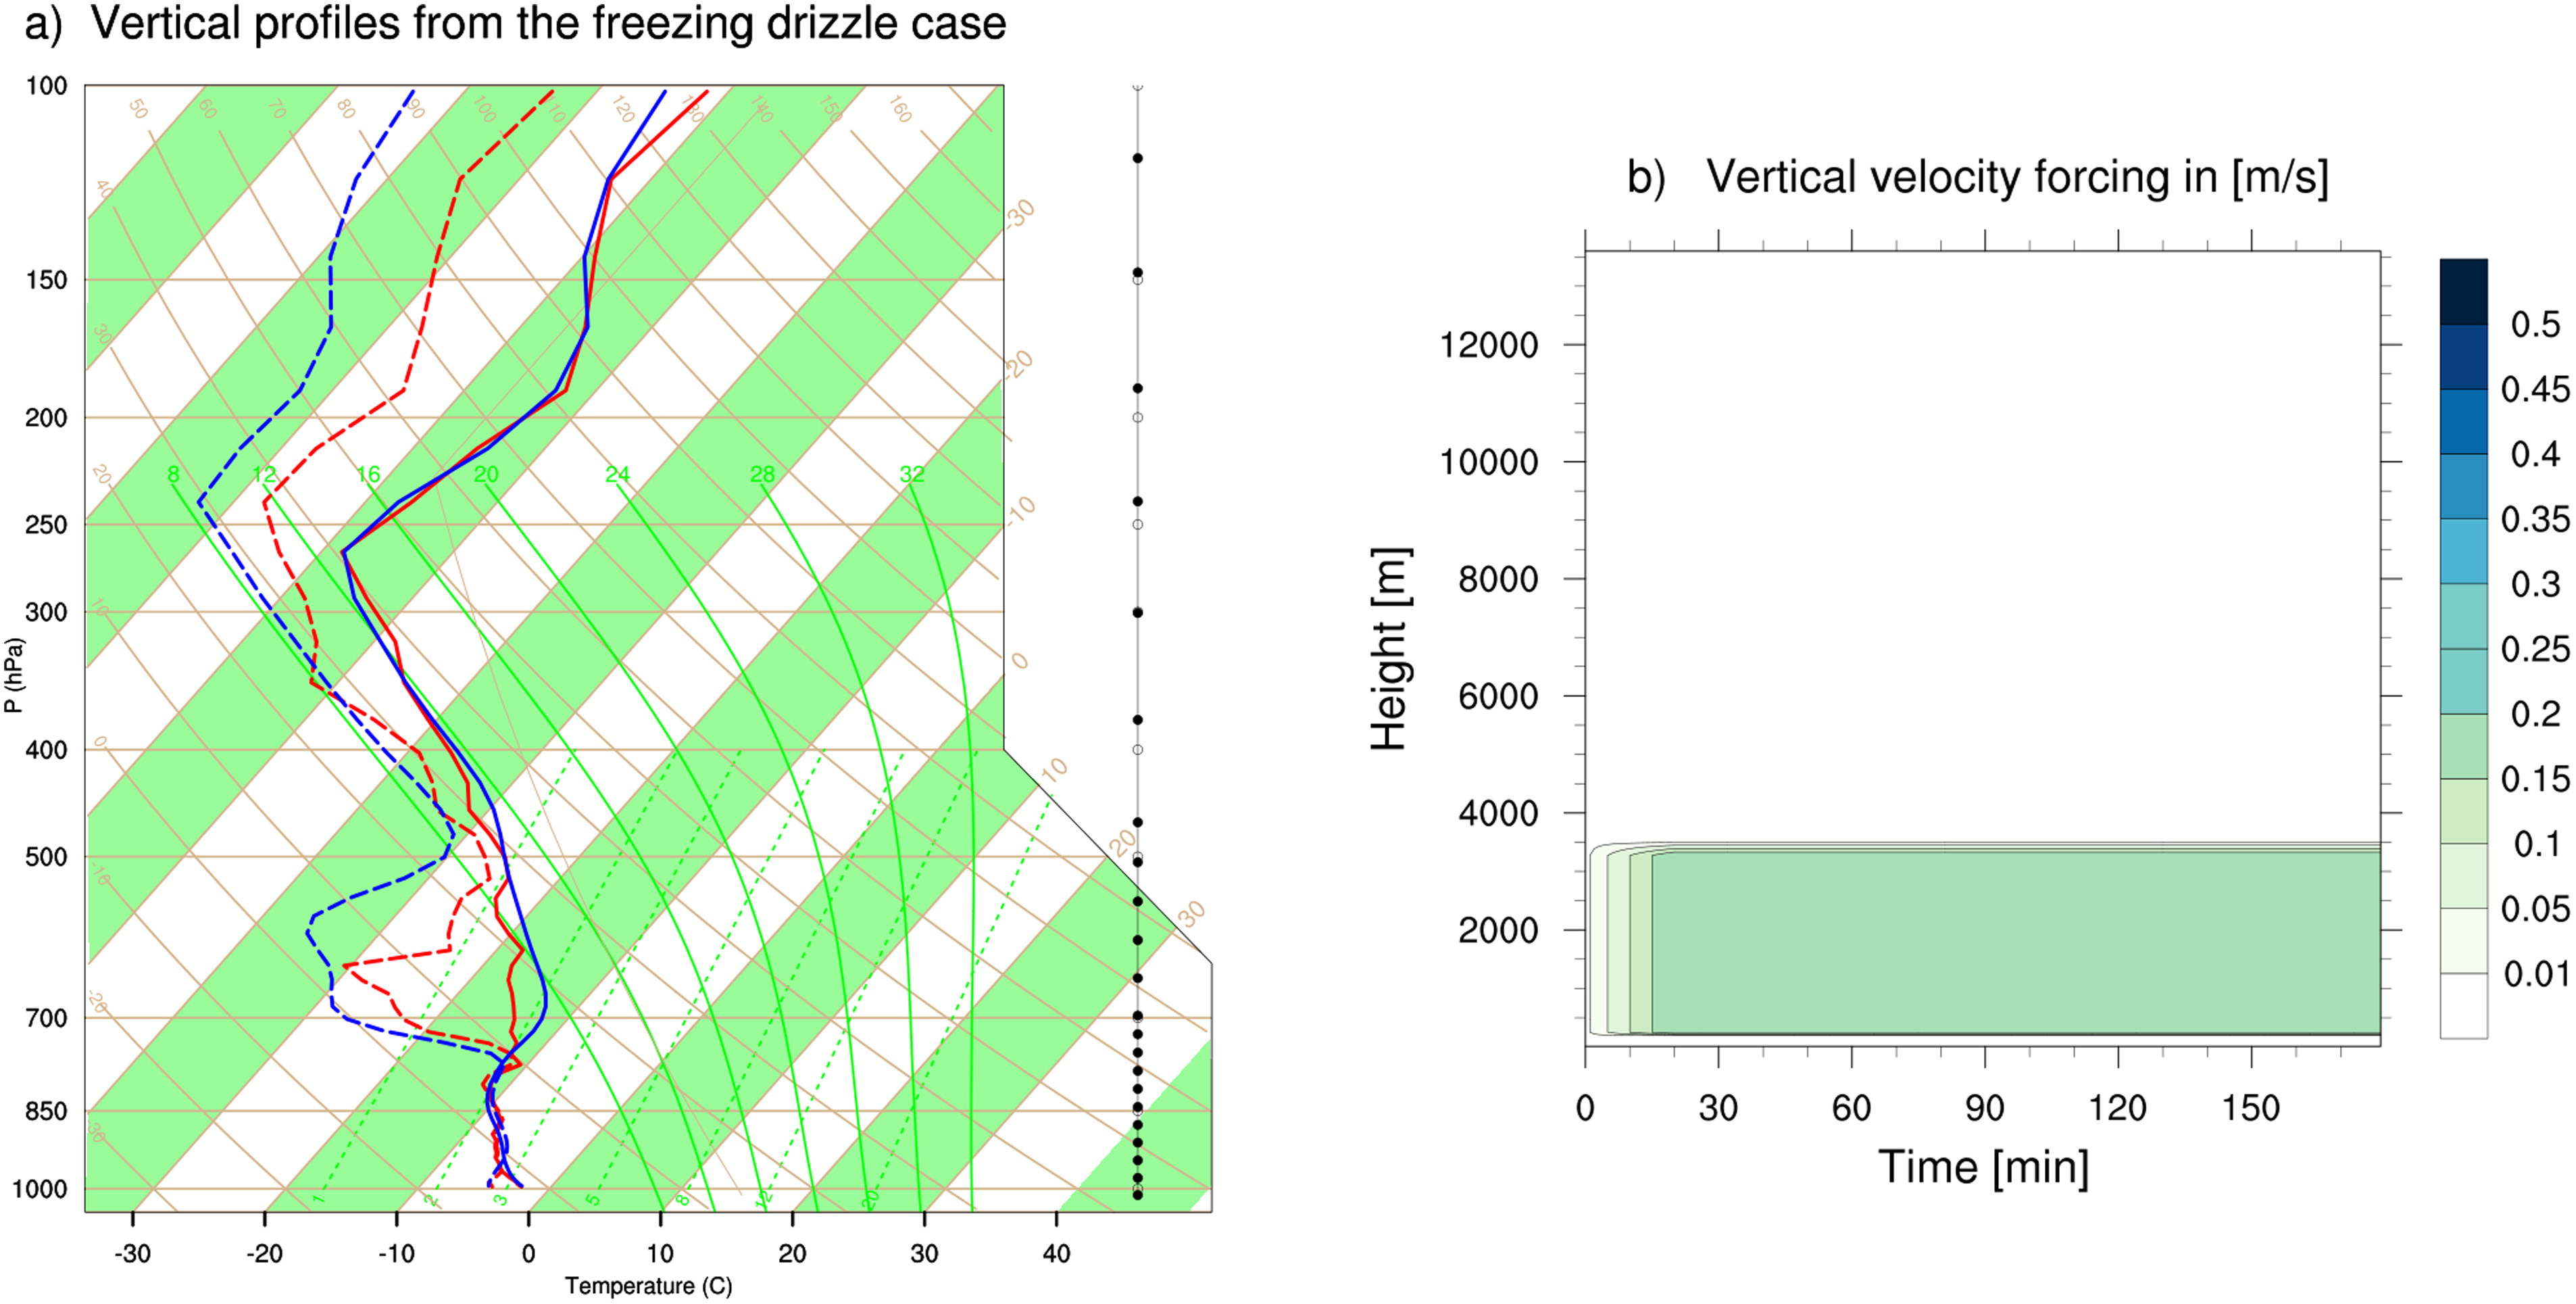
Fig. 2.
(a) Skew-T plot of the freezing drizzle case, blue lines represent the operational forecast from HARMONIE-AROME and initial profile used in MUSC, while red lines represent the radiosonde profile taken from MET-Norway’s site at Blindern, Oslo at 1150 UTC. (b) time-height cross-section of the vertical velocity forcing applied to the MUSC experiments for the freezing drizzle case.
Table 1.
List of MUSC 1 D experiments and the microphysical processes studied.
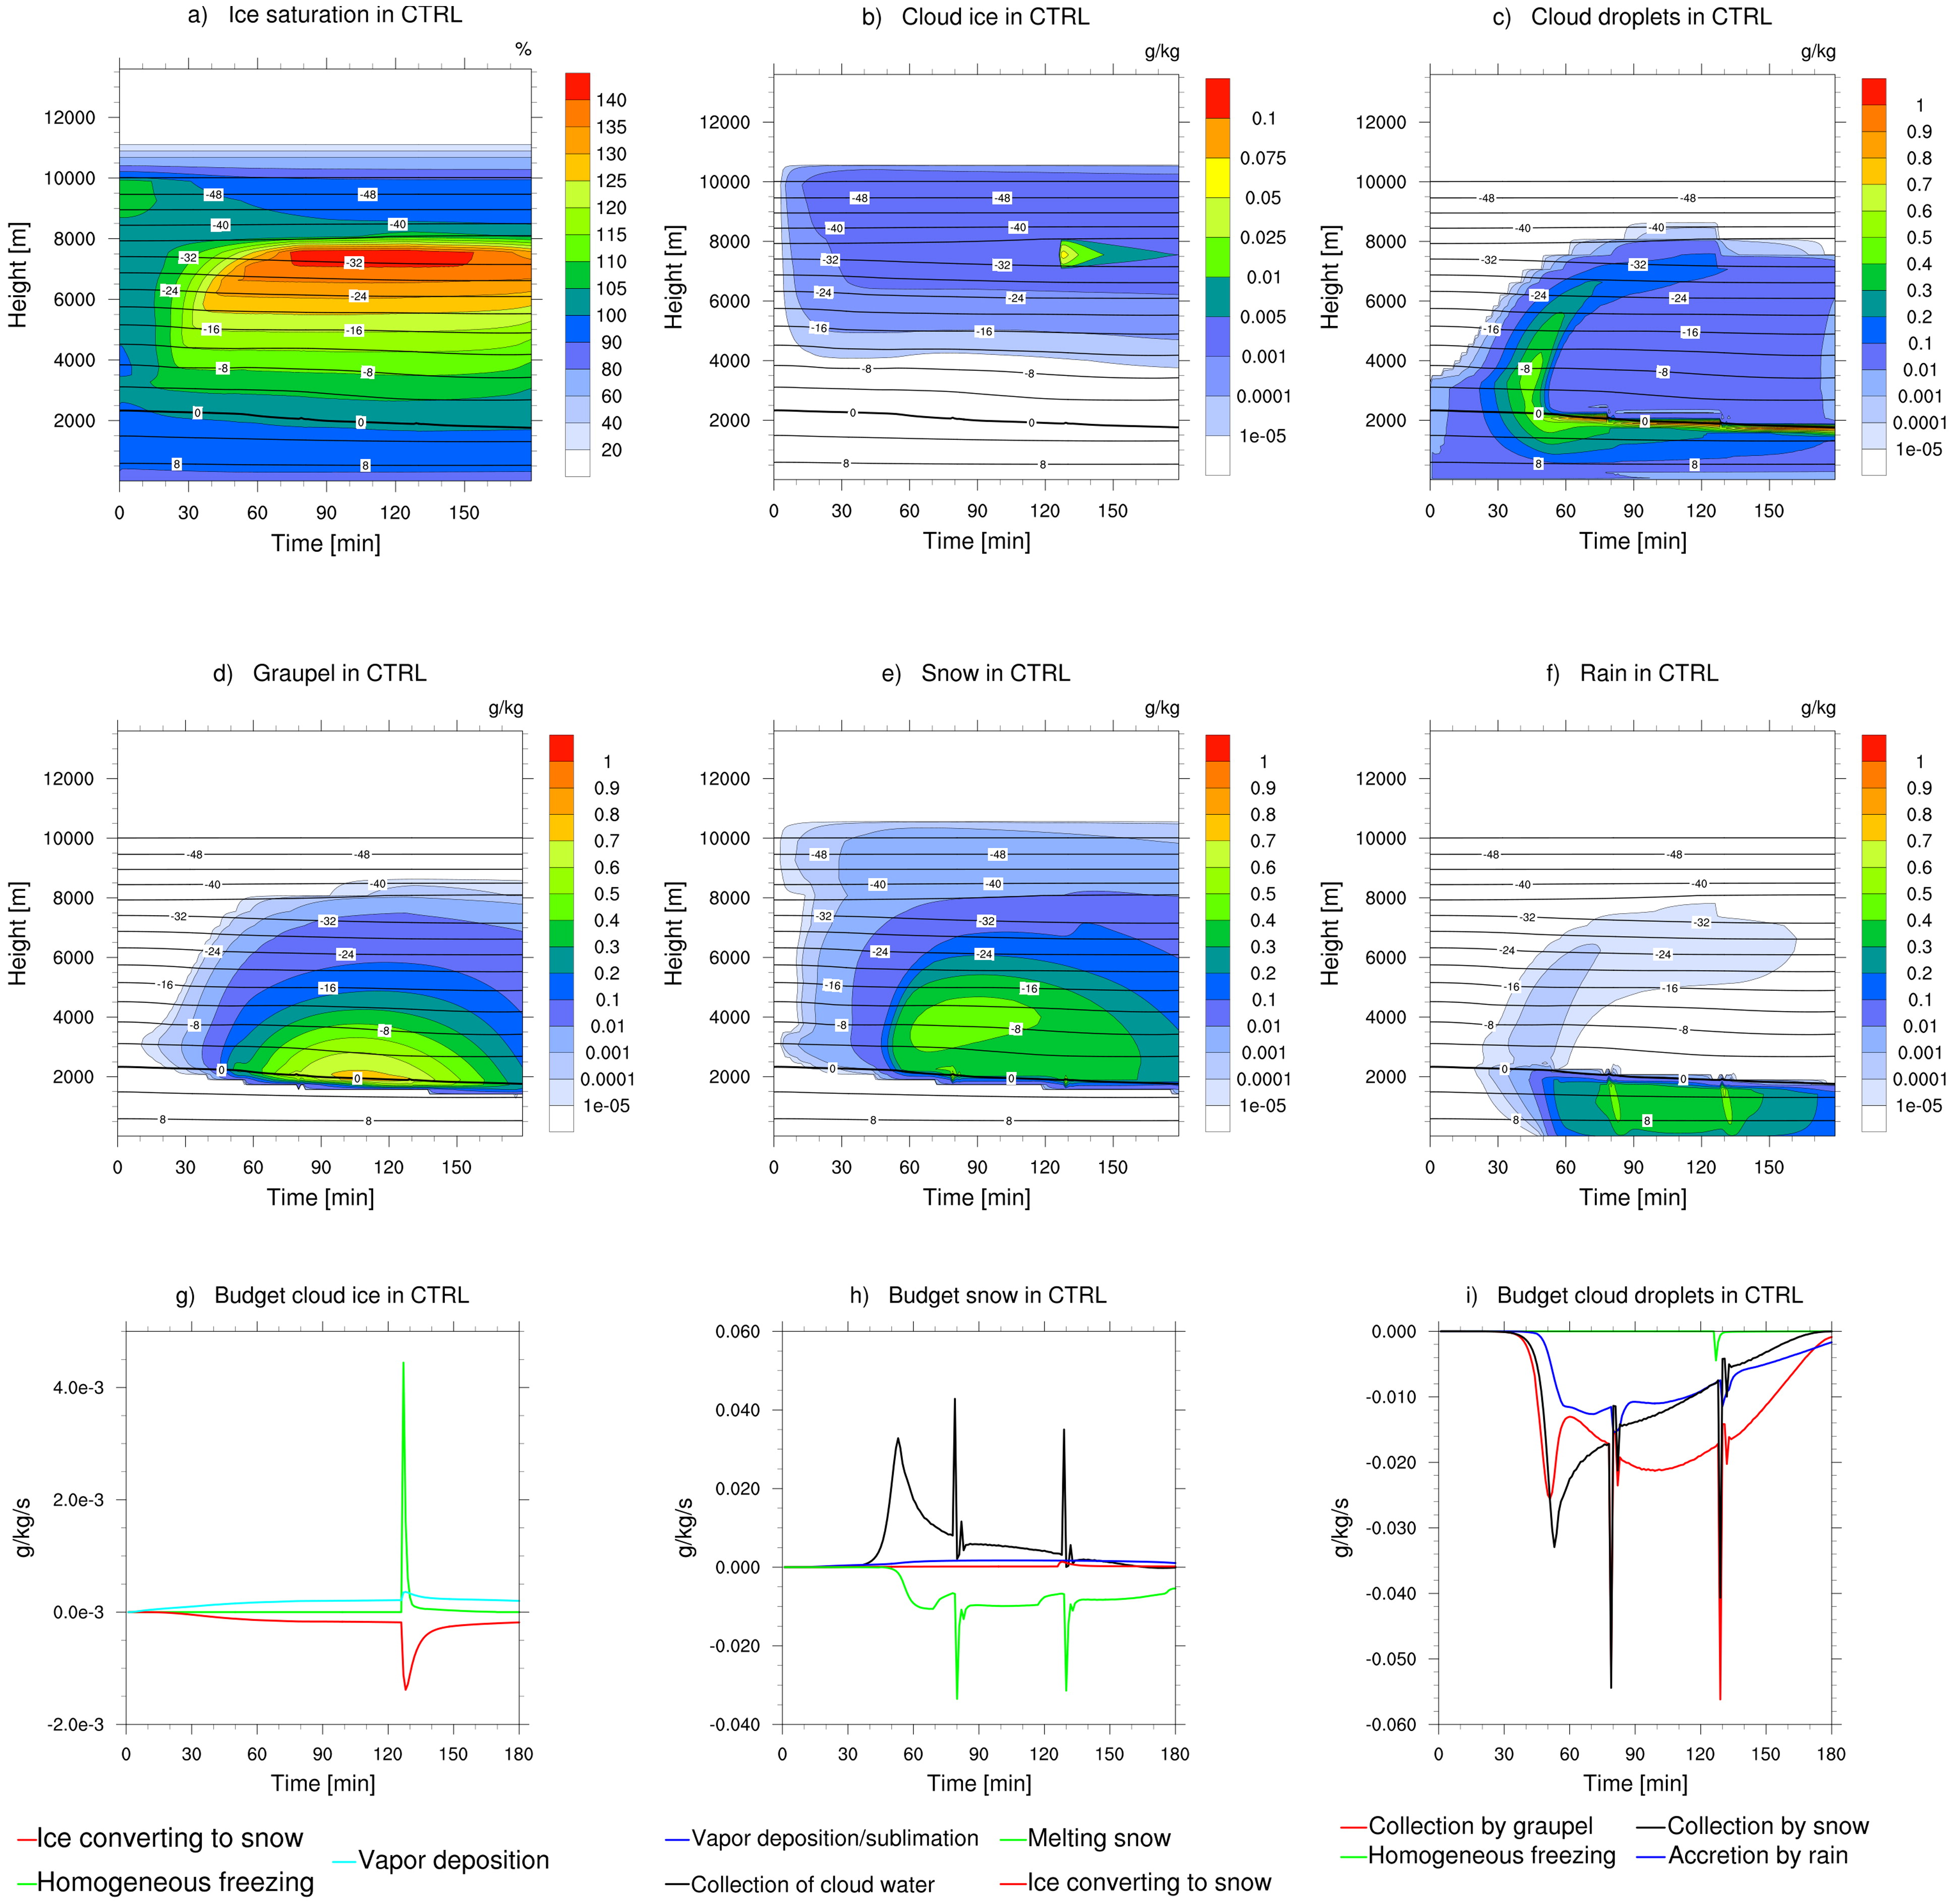
Fig. 3.
Results from the control run (CTRL) for the orographic lift case. Time-height cross-sections of (a) relative humidity with respect to ice saturation, mixing ratios of (b) cloud ice, (c) cloud droplets, (d) graupel, (e) snow, and (f) rain. Budget plots with time-evolutions of the sum of sources and sinks for (g) cloud ice, (h) snow, and (i) cloud droplets.
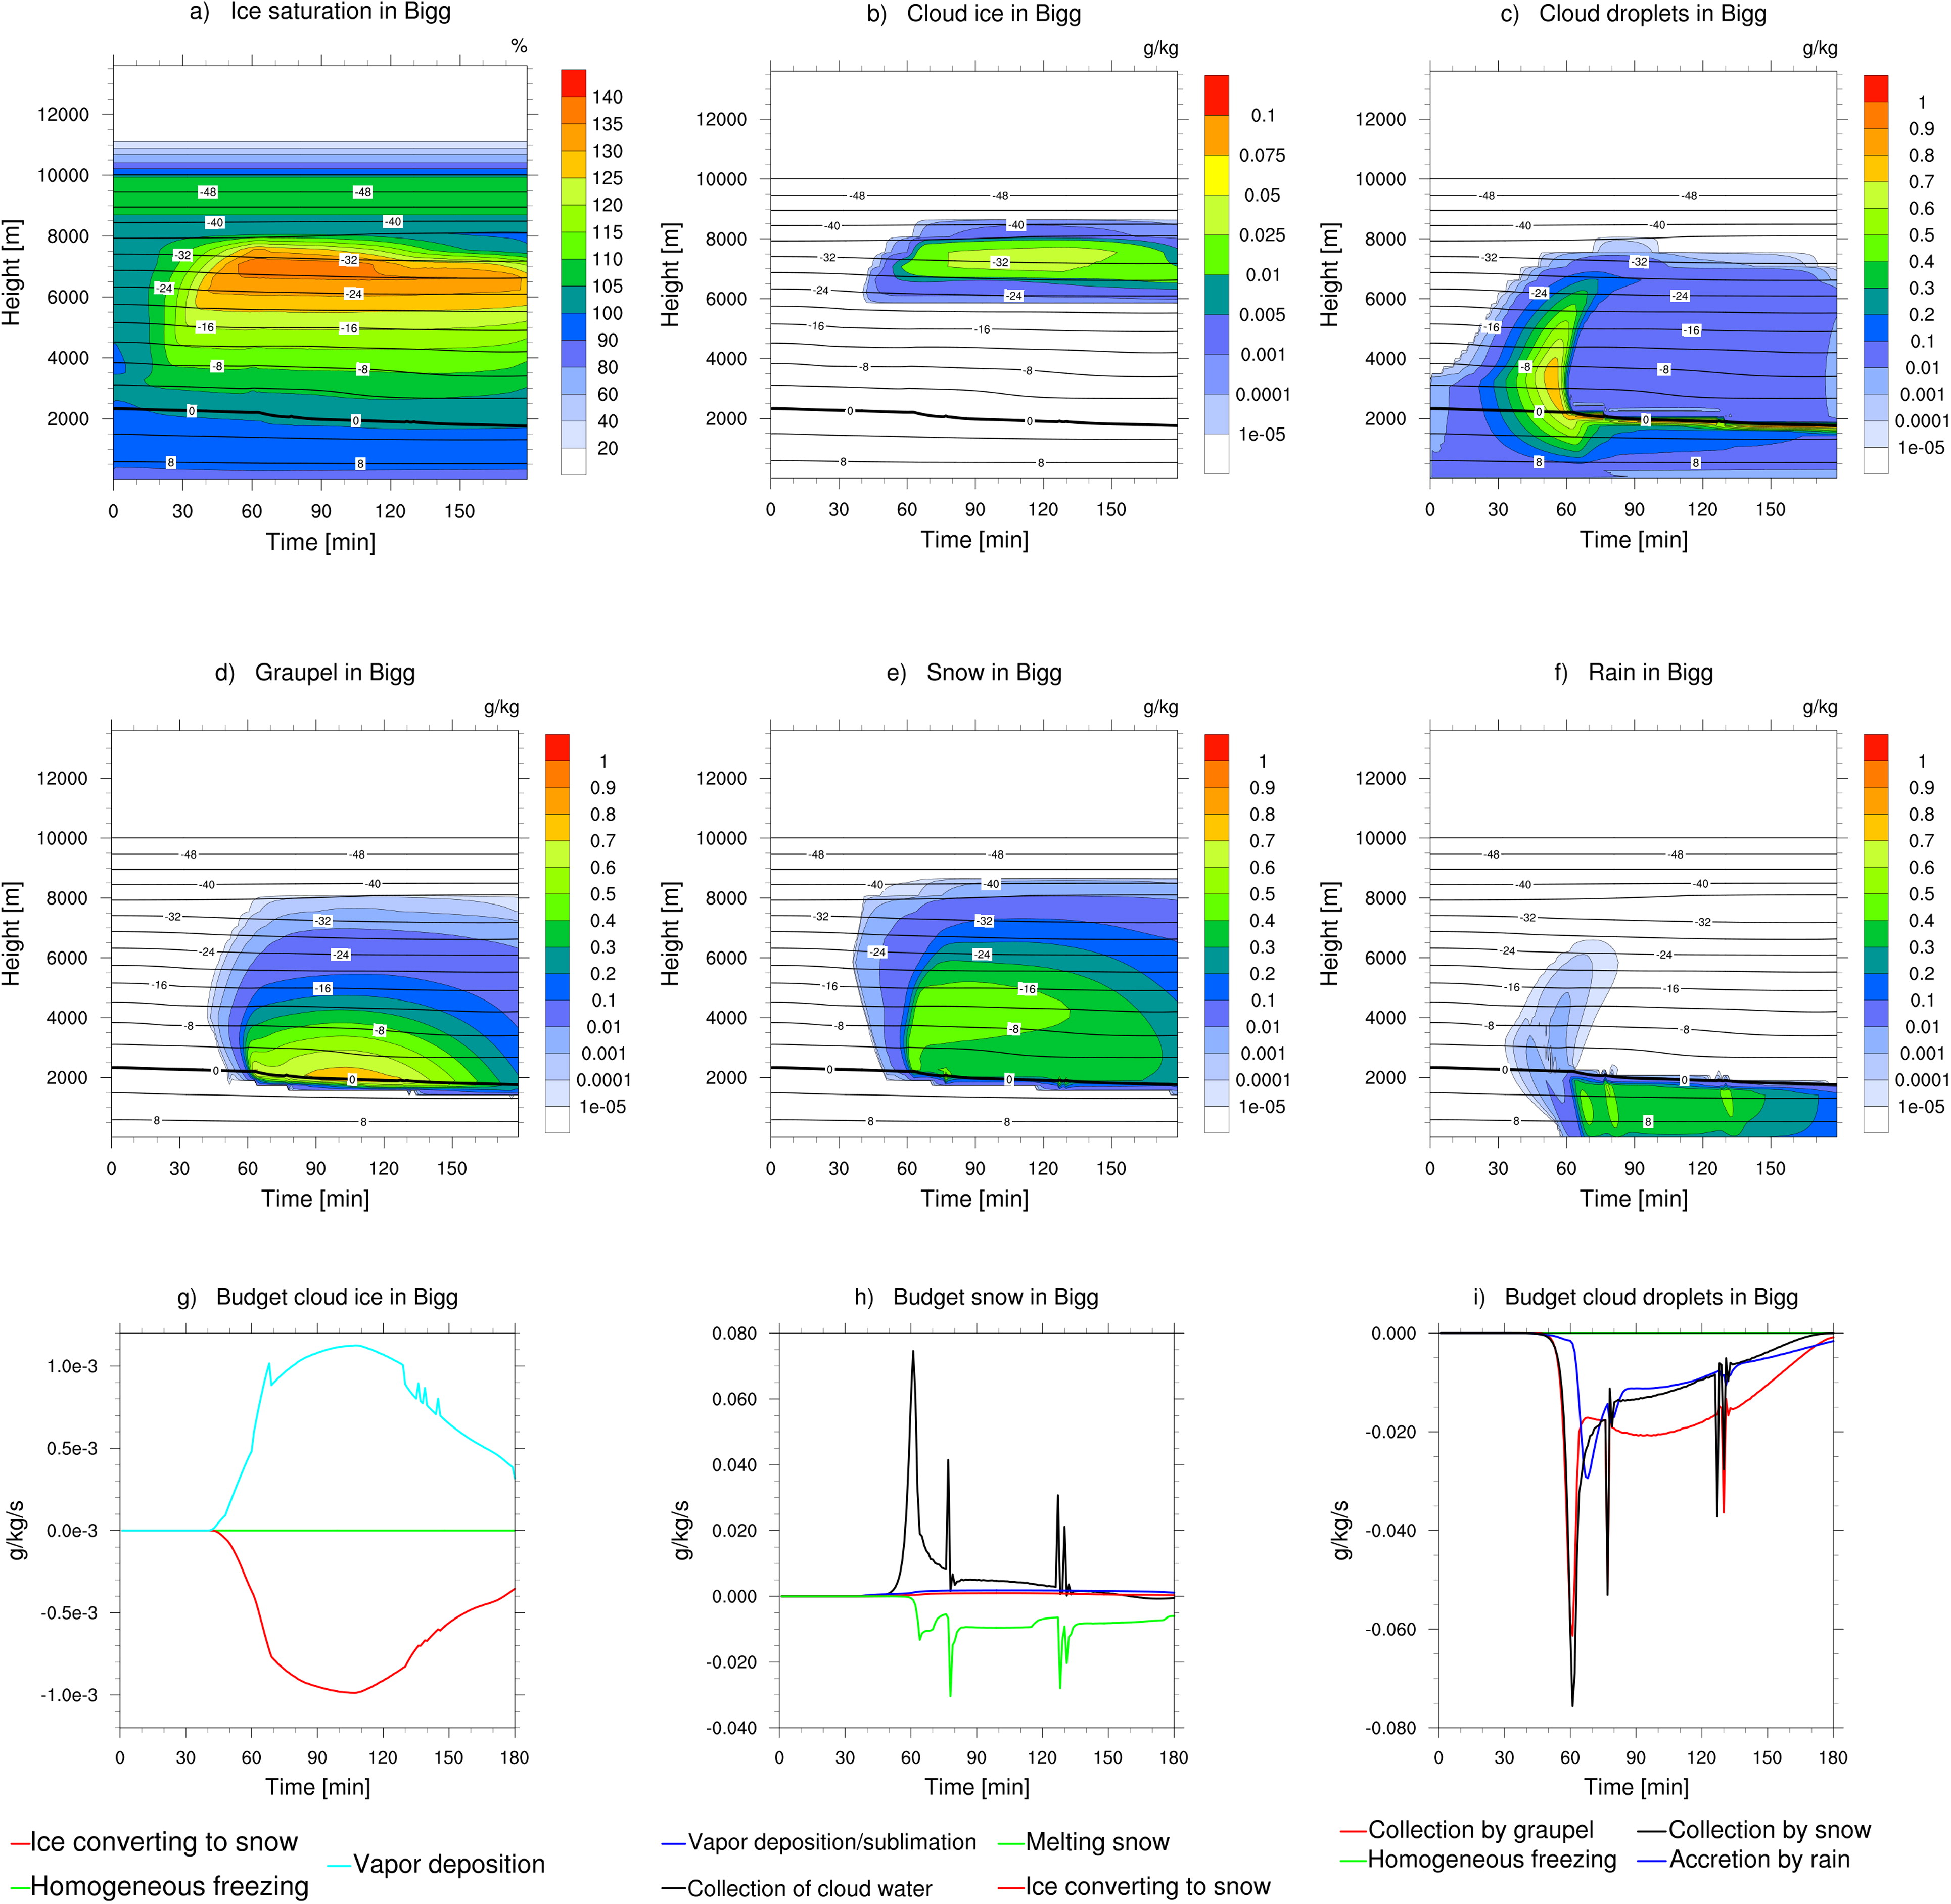
Fig. 4.
Results from the Bigg experiment for the orographic lift case. Time-height cross-sections of (a) relative humidity with respect to ice saturation, mixing ratios of (b) cloud ice, (c) cloud droplets, (d) graupel, (e) snow, and (f) rain. Budget plots with time-evolutions of the sum of sources and sinks for (g) cloud ice, (h) snow, and (i) cloud droplets.
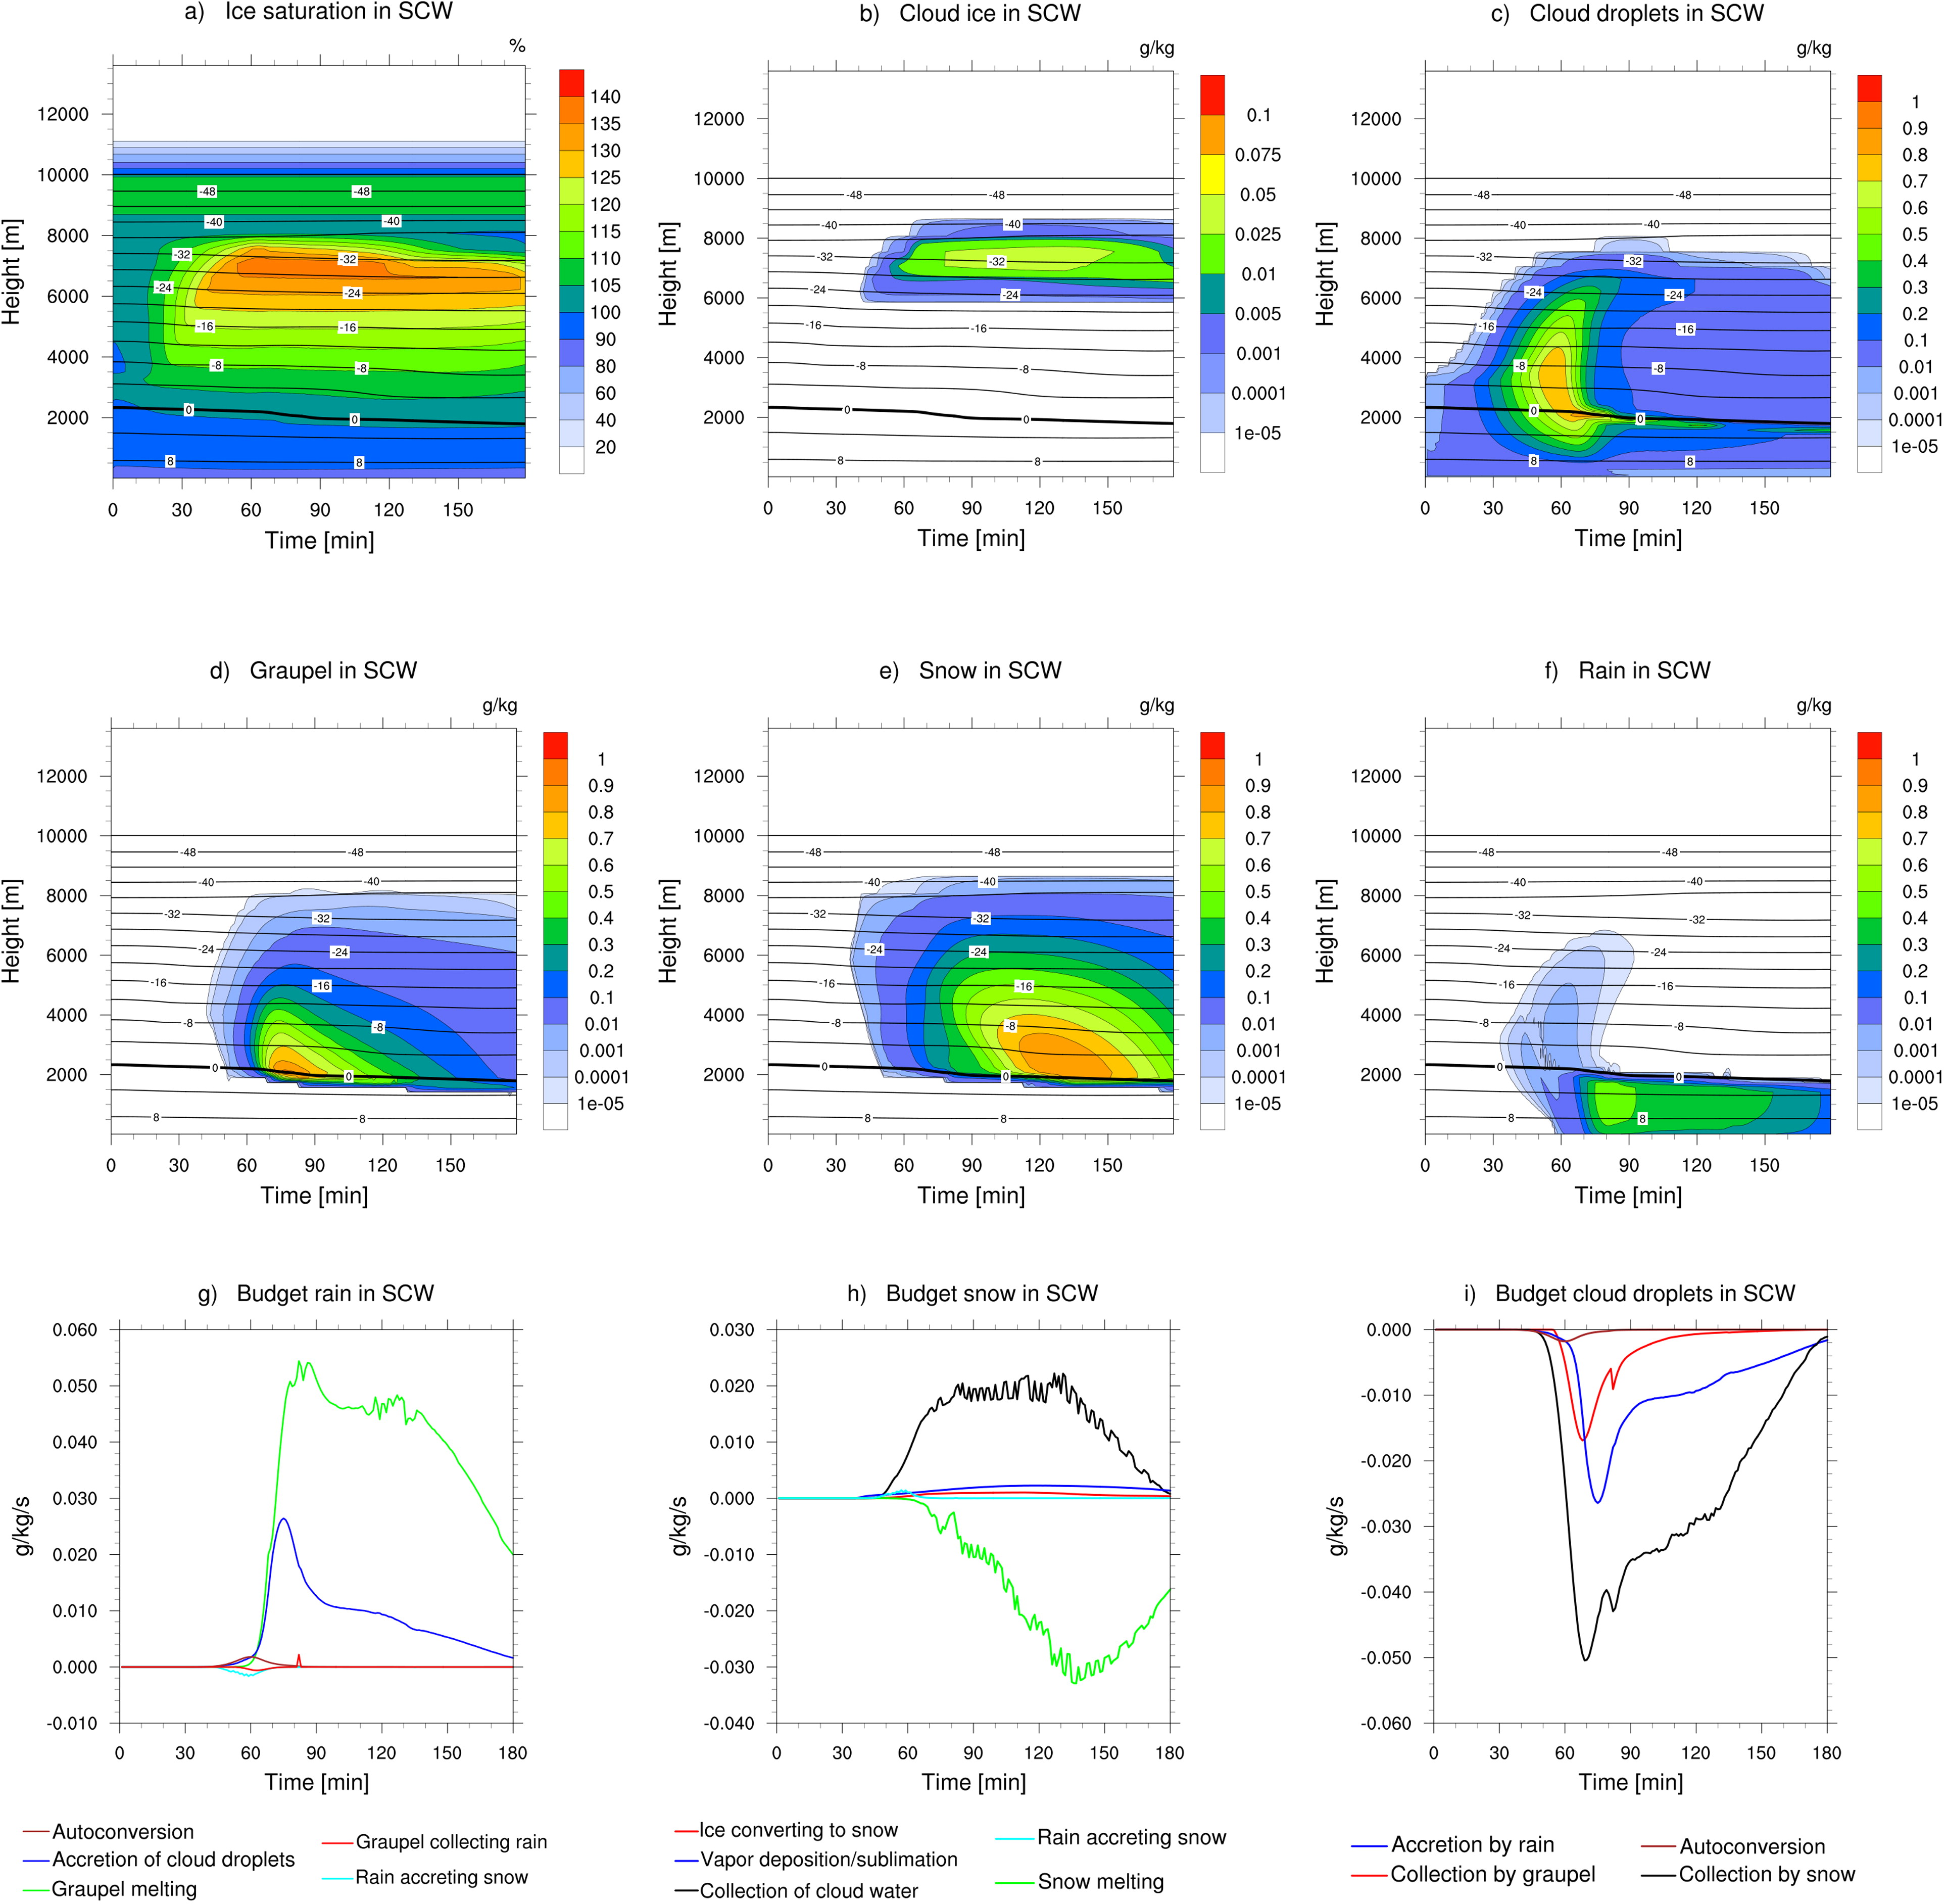
Fig. 5.
Results from experiment SCW for the orographic lift case. Time-height cross-sections of mixing ratios of (a) relative humidity with respect to ice saturation, mixing ratios of (b) cloud ice, (c) cloud droplets, (d) graupel, (e) snow, and (f) rain. Budget plots with time-evolutions of the sum of sources and sinks for (g) rain, (h) snow, and (i) cloud droplets.
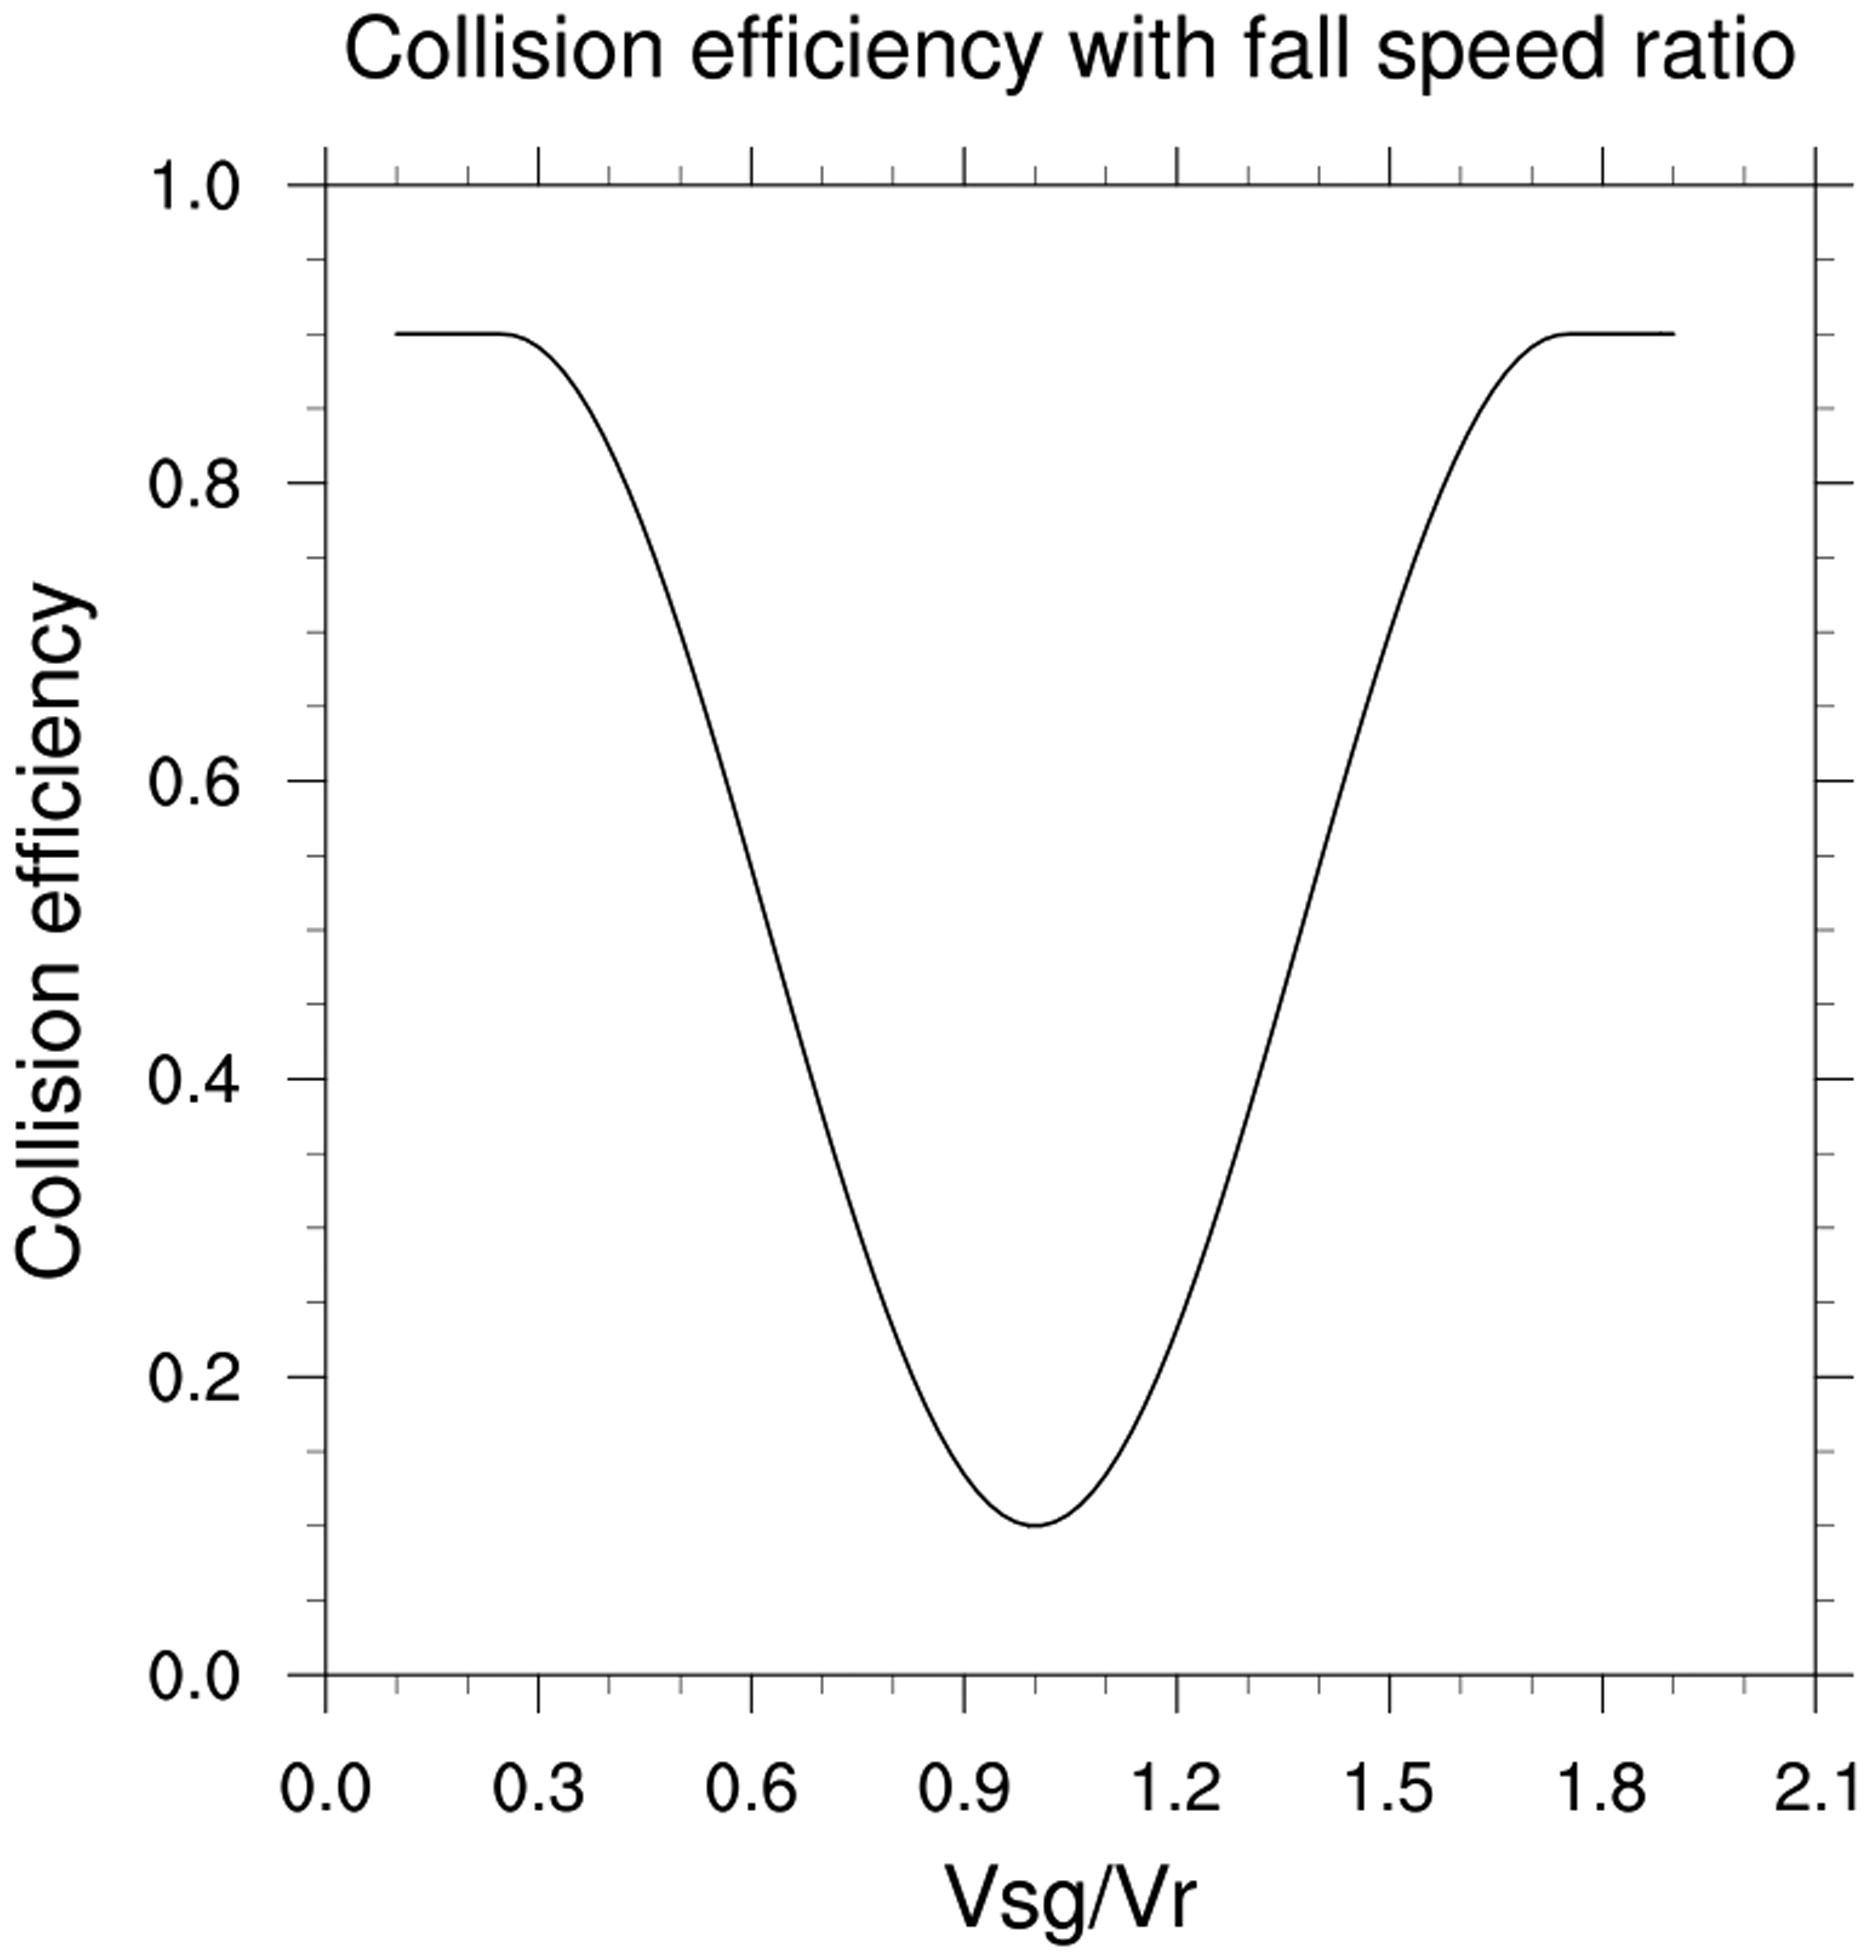
Fig. 6. Plot of the collection efficiency for rain collecting snow/graupel with terminal velocity ratio (snow/graupel to rain).
Table 2.
List of coefficients for mass and velocity-diameter relations for CTRL and HP experiments.
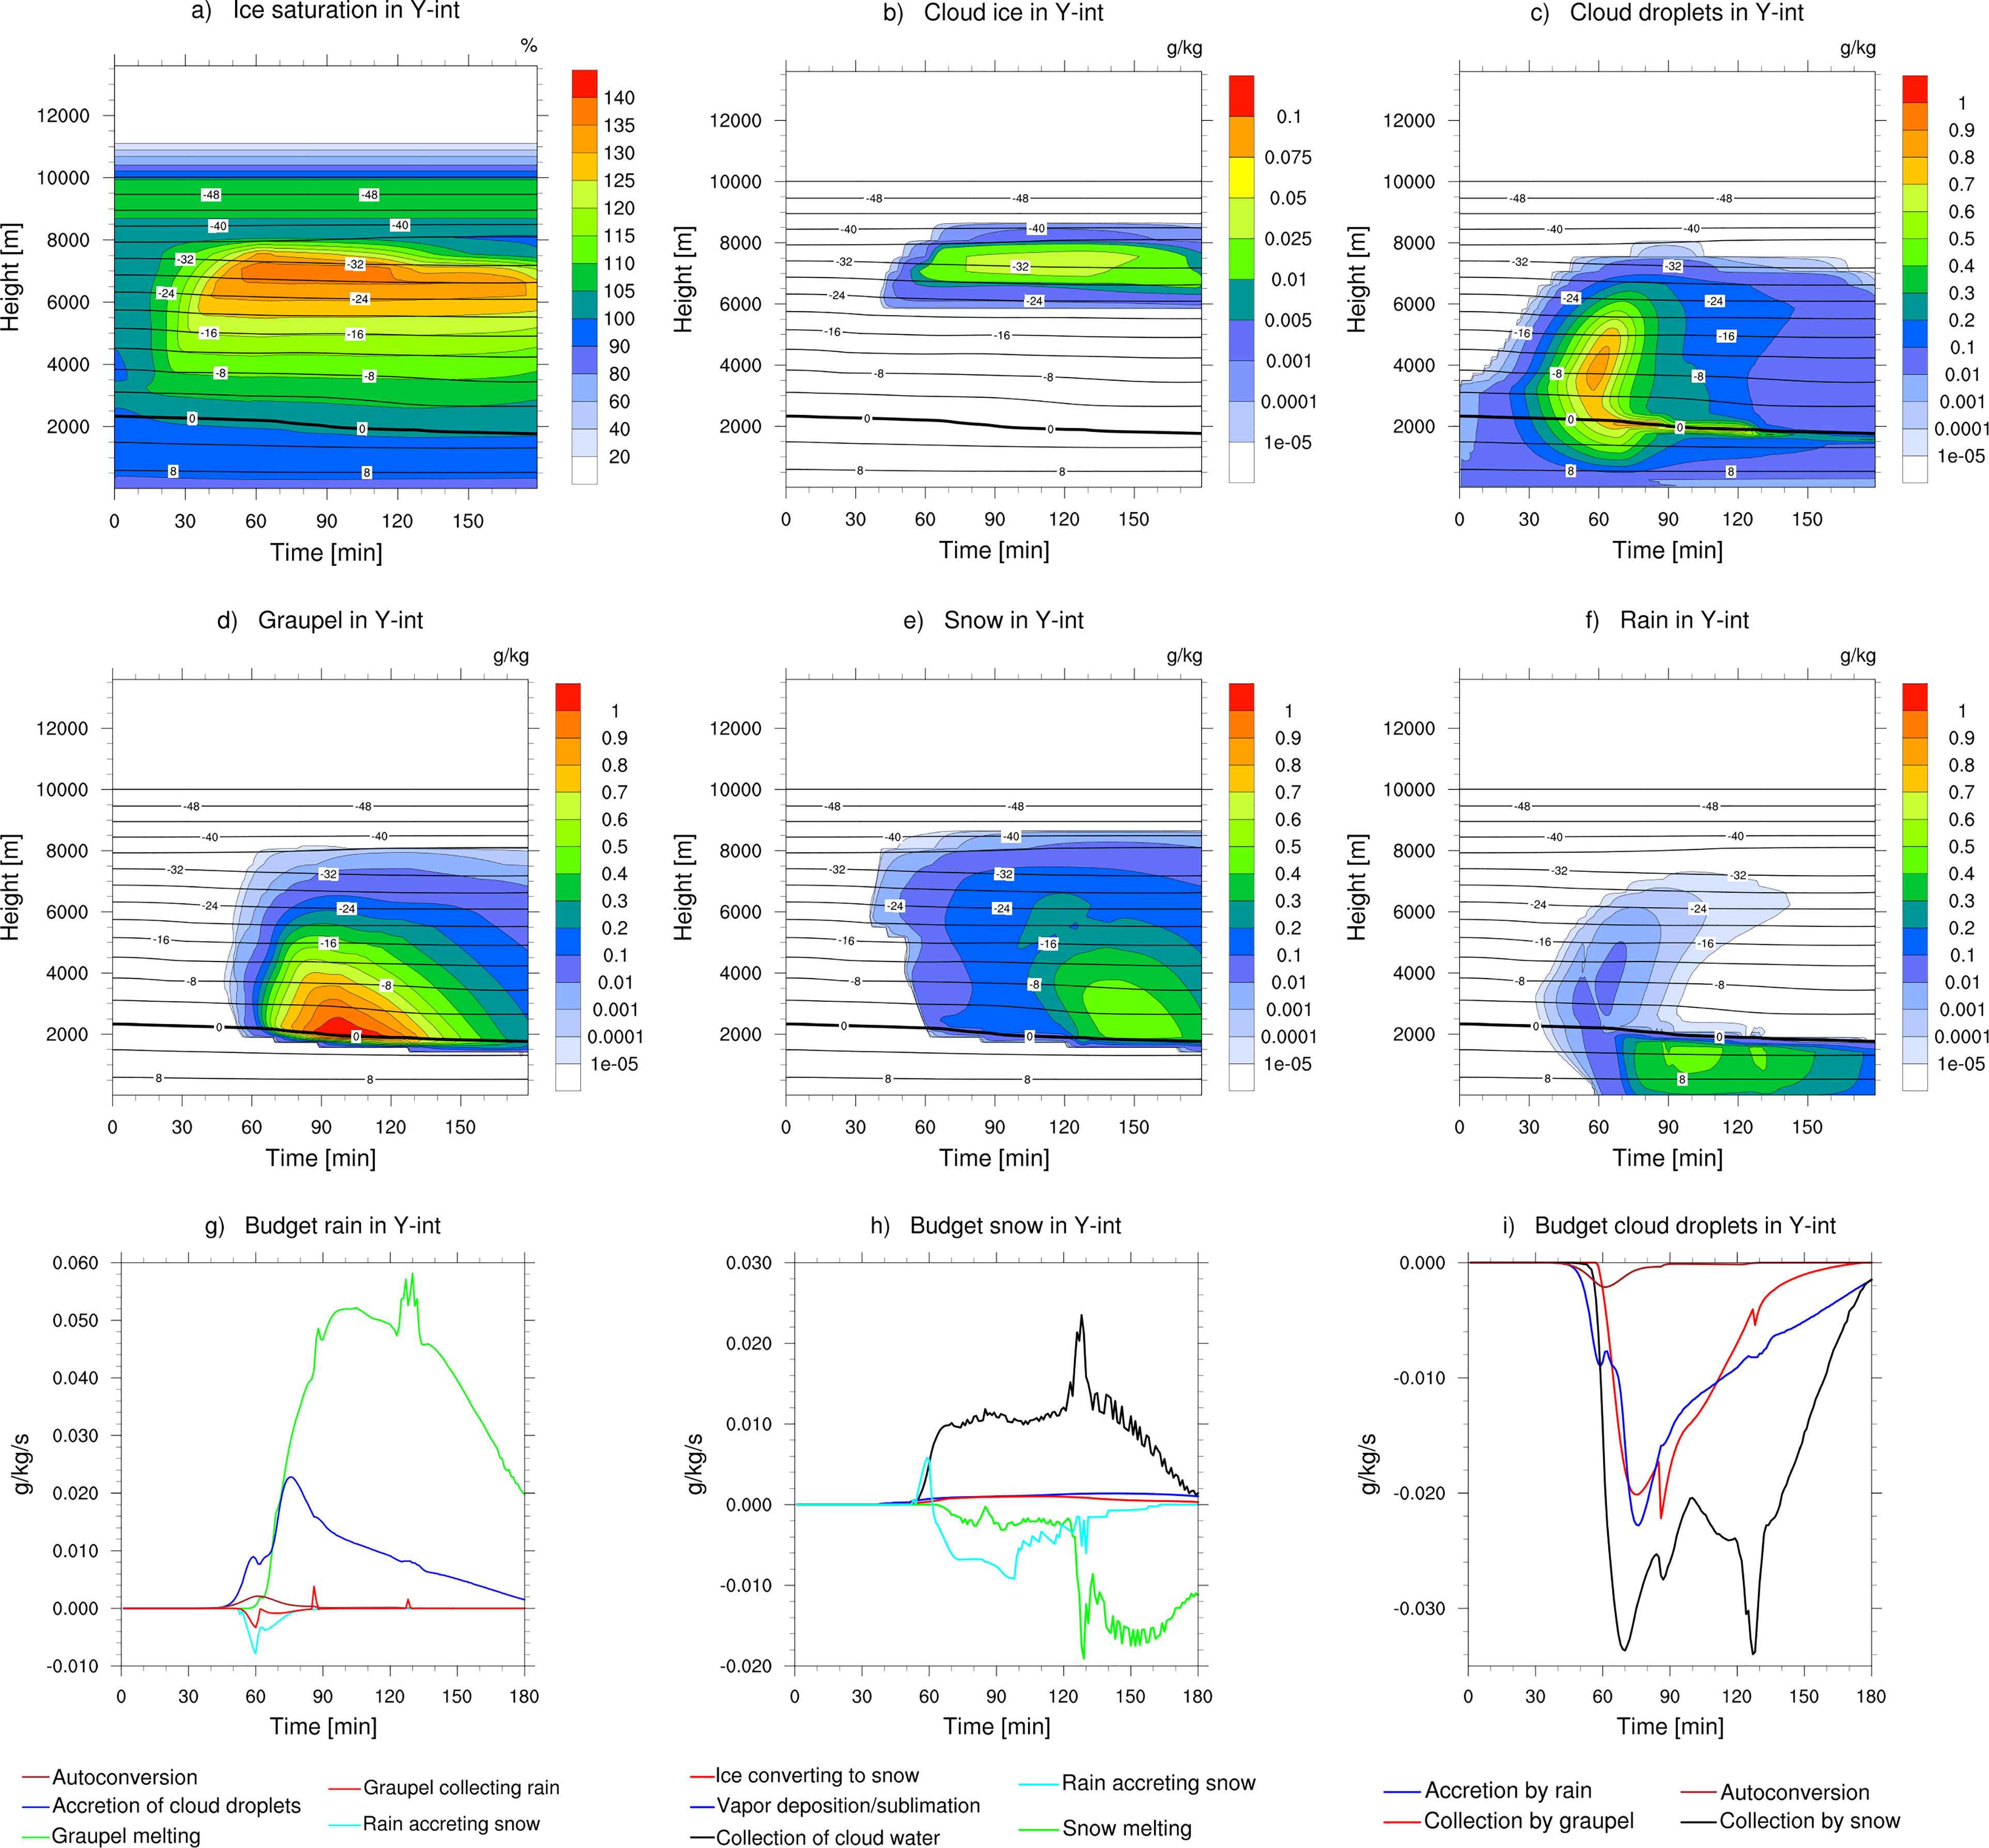
Fig. 7.
Results from the Y-INT experiment for the orographic lift case. Time-height cross-sections of (a) relative humidity with respect to ice saturation, mixing ratios of (b) cloud ice, (c) cloud droplets, (d) graupel, (e) snow, and (f) rain. Budget plots with time-evolutions of the sum of sources and sinks for (g) rain, (h) snow, and (i) cloud droplets.
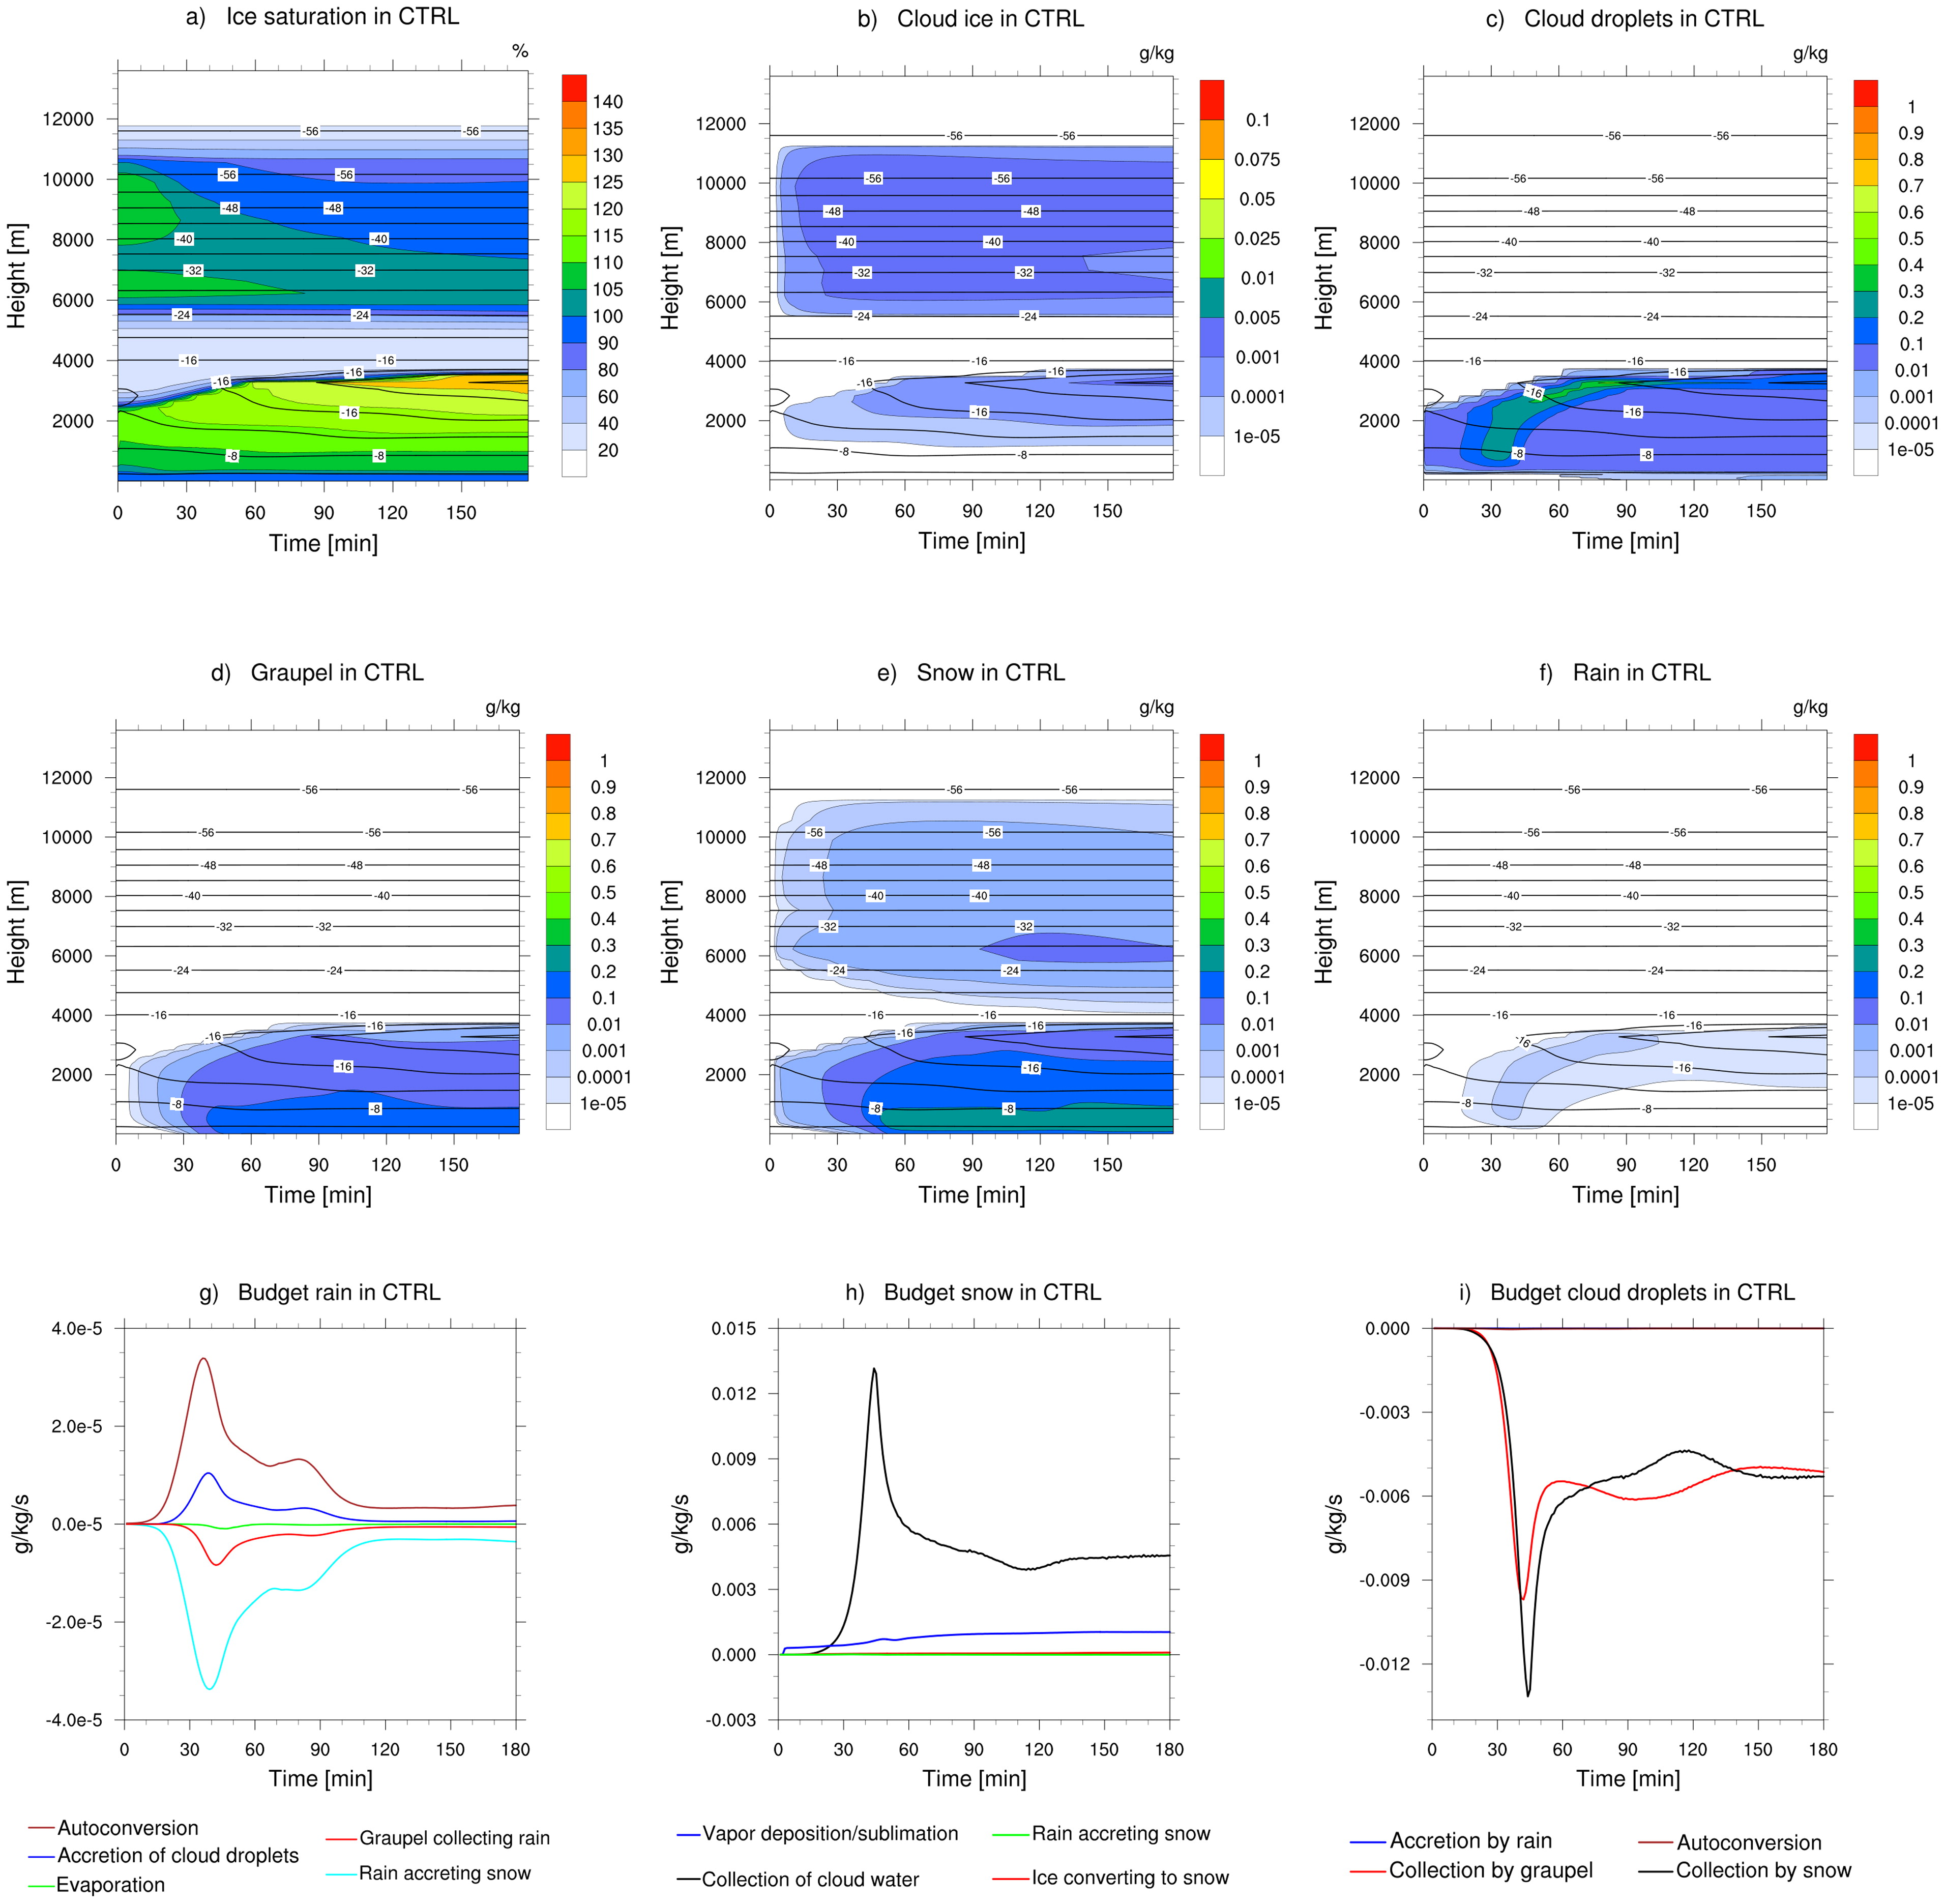
Fig. 8.
Results from the control experiment (CTRL) for the freezing drizzle case. Time-height cross-sections of (a) relative humidity with respect to ice saturation, mixing ratios of (b) cloud ice, (c) cloud droplets, (d) graupel, (e) snow, and (f) rain. Budget plots with time-evolutions of the sum of sources and sinks for (g) rain, (h) snow, and (i) cloud droplets.
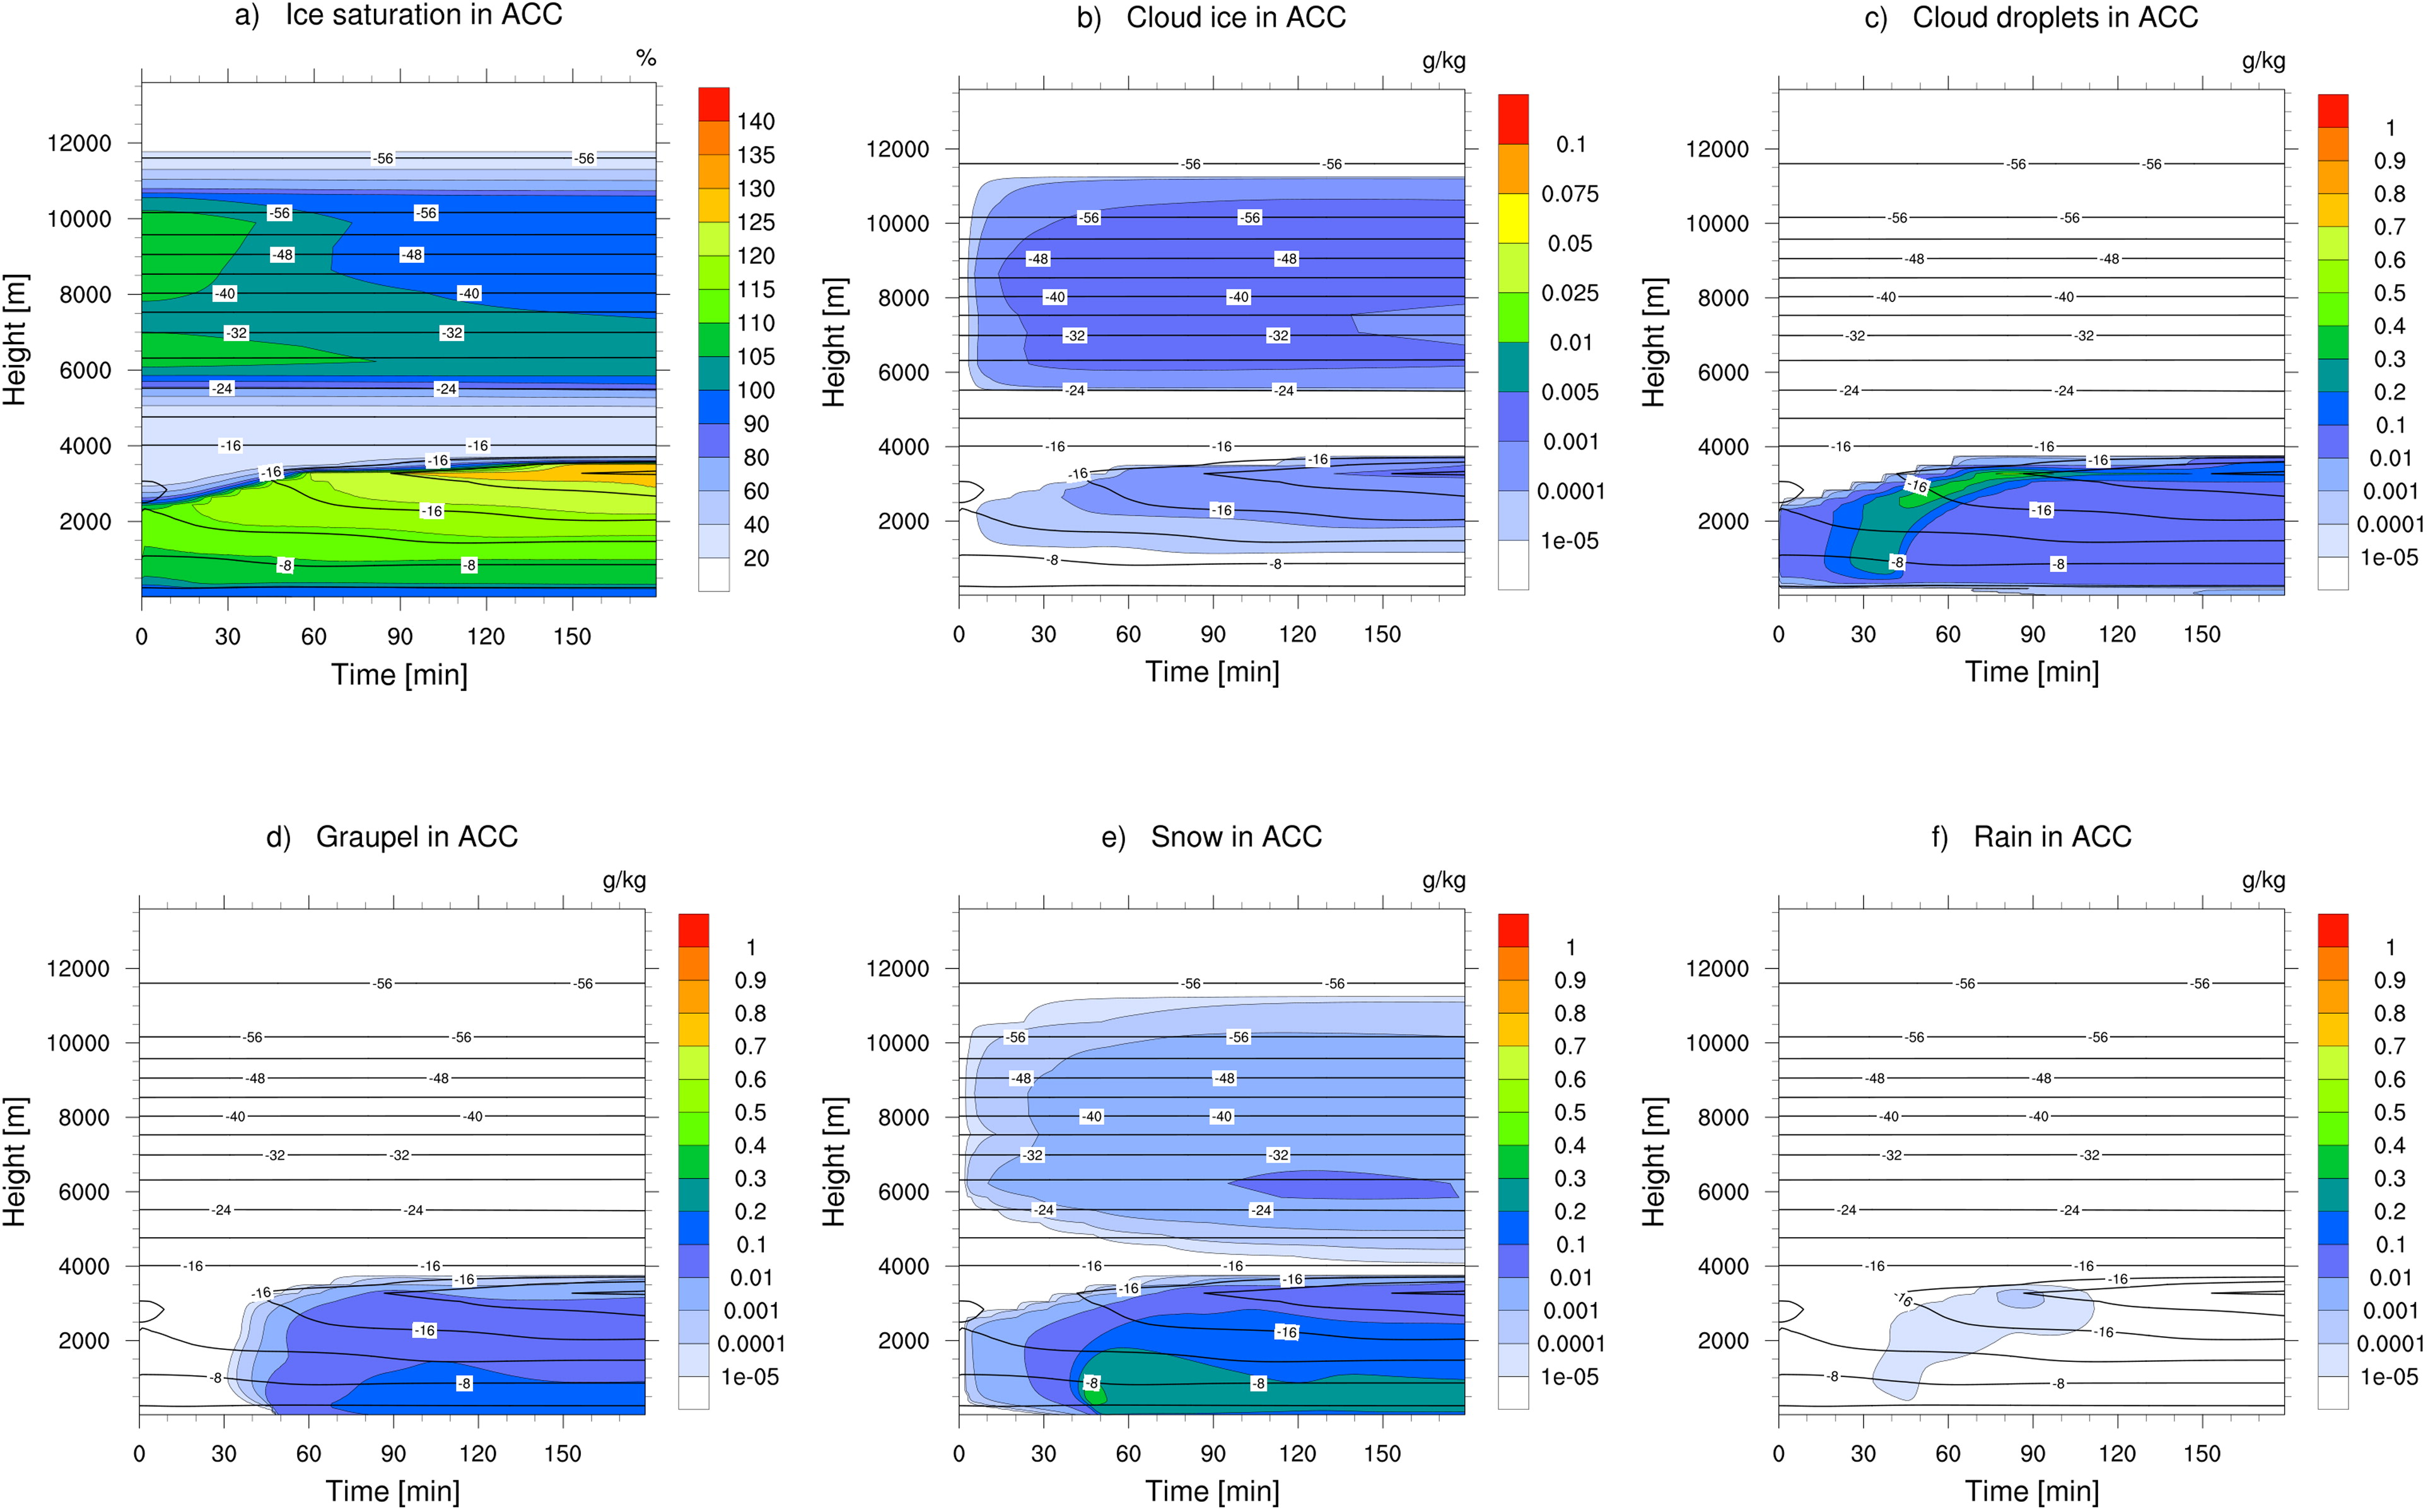
Fig. 9.
Results from the ACC experiment for the freezing drizzle case. Time-height cross-sections of (a) relative humidity with respect to ice saturation, mixing ratios of (b) cloud ice, (c) cloud droplets, (d) graupel, (e) snow, and (f) rain.
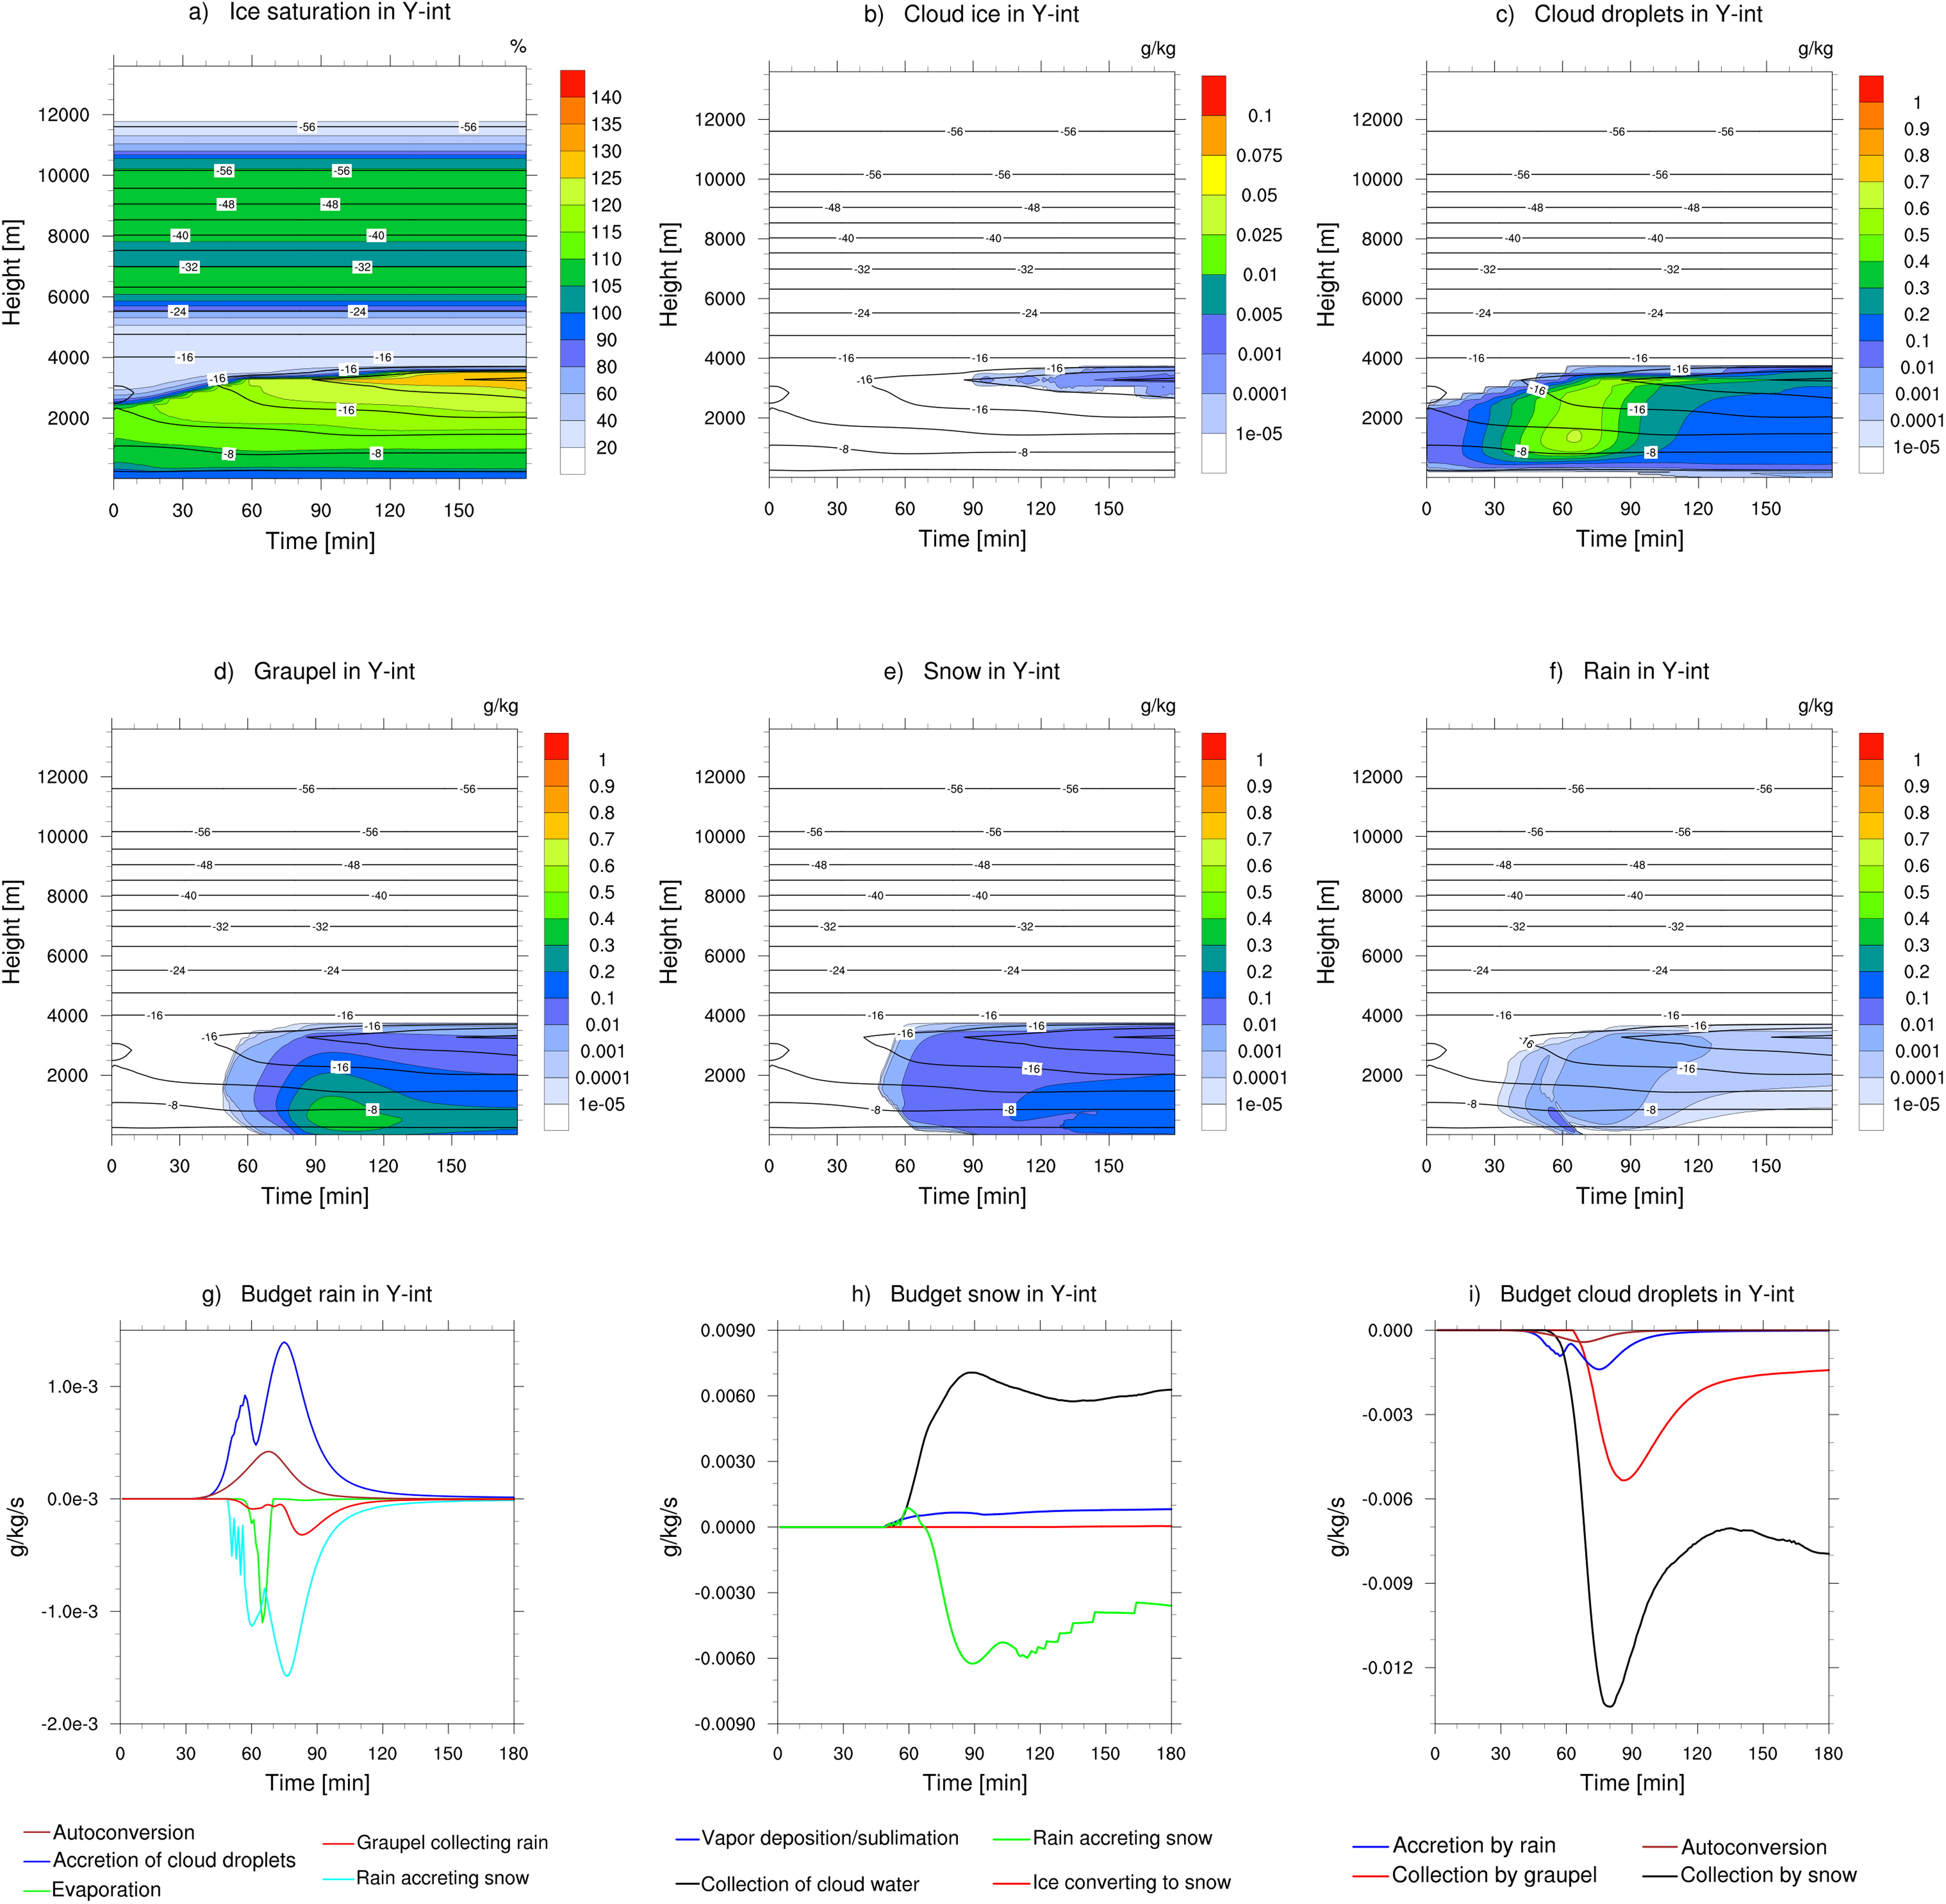
Fig. 10. Results from experiment Y-INT for the freezing drizzle case. Time-height cross-sections of (a) relative humidity with respect to ice saturation, mixing ratios of (b) cloud ice, (c) cloud droplets, (d) graupel, (e) snow, and (f) rain. Budget plots with time-evolutions of the sum of sources and sinks for (g) rain, (h) snow, and (i) cloud droplets.