
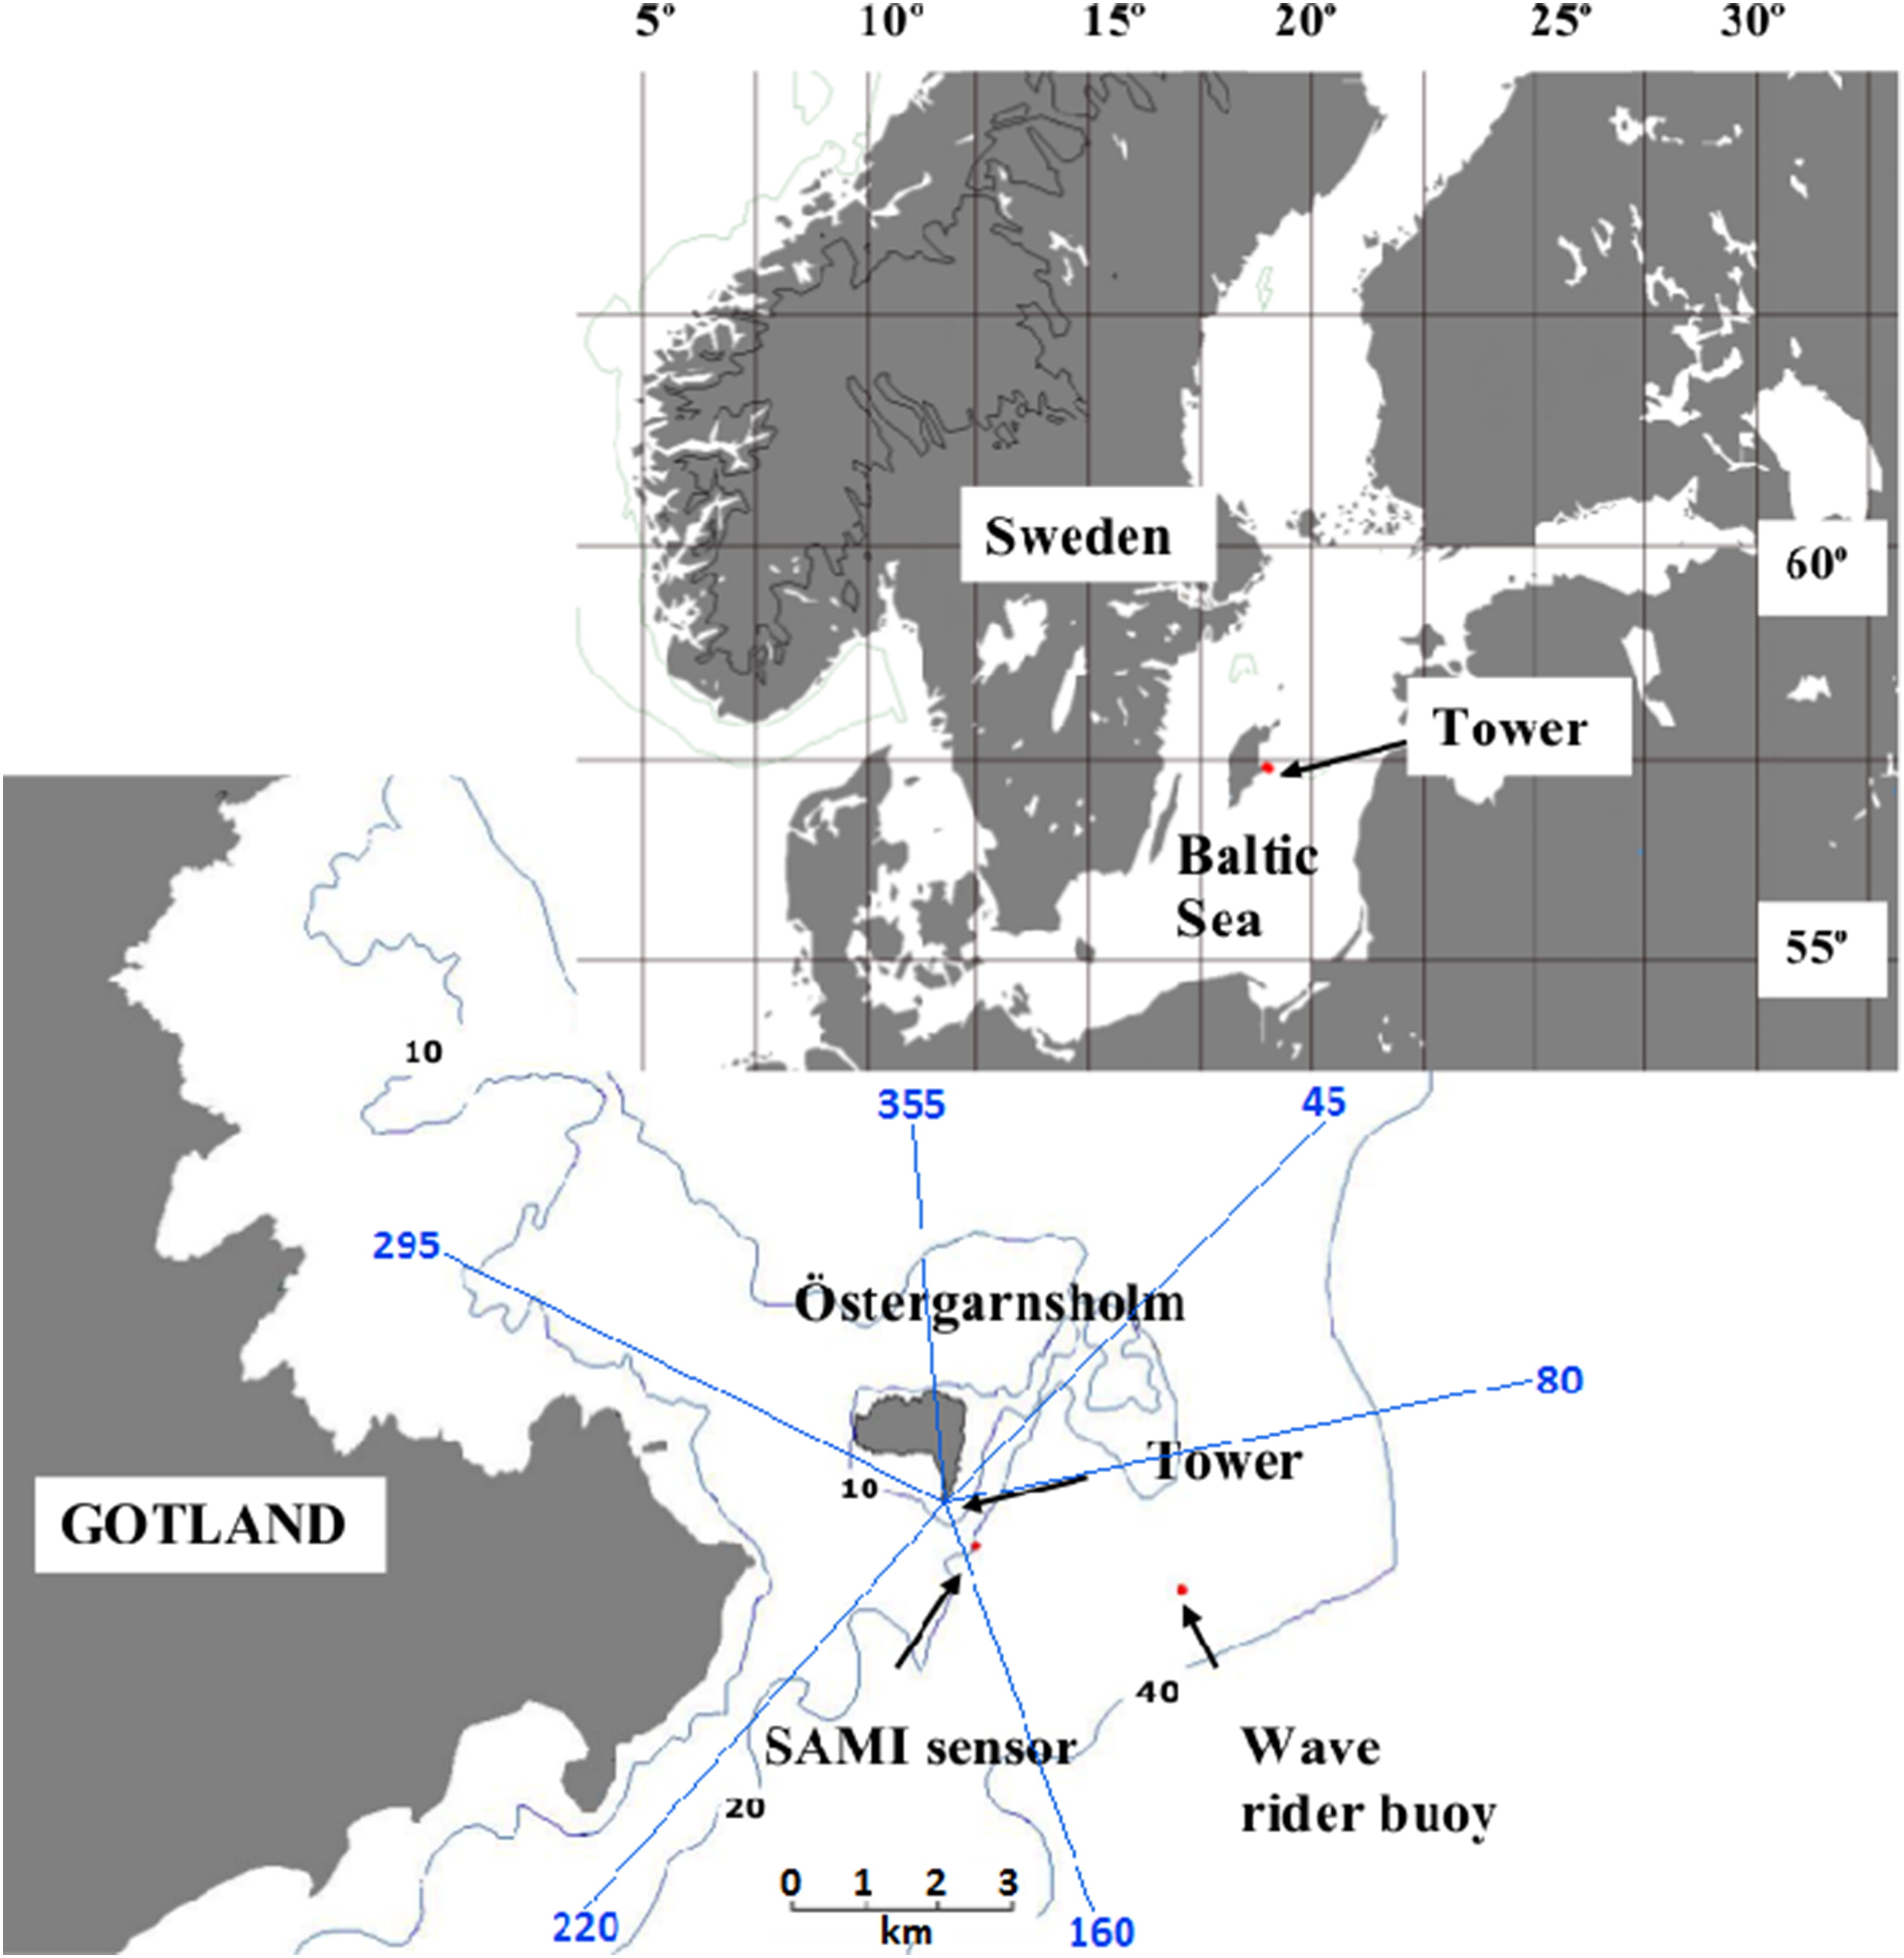
Fig. 1.
The Baltic Sea and the Östergarnsholm field station. The positions of the tower, the SAMI sensor and a Directional Waverider buoy (DWR) are shown by arrows in the lower figure. Thin lines in the lower figure represent isolines of water depth. Figure redrawn from Rutgersson and Smedman (2010). Blue lines illustrate the different wind direction sectors.
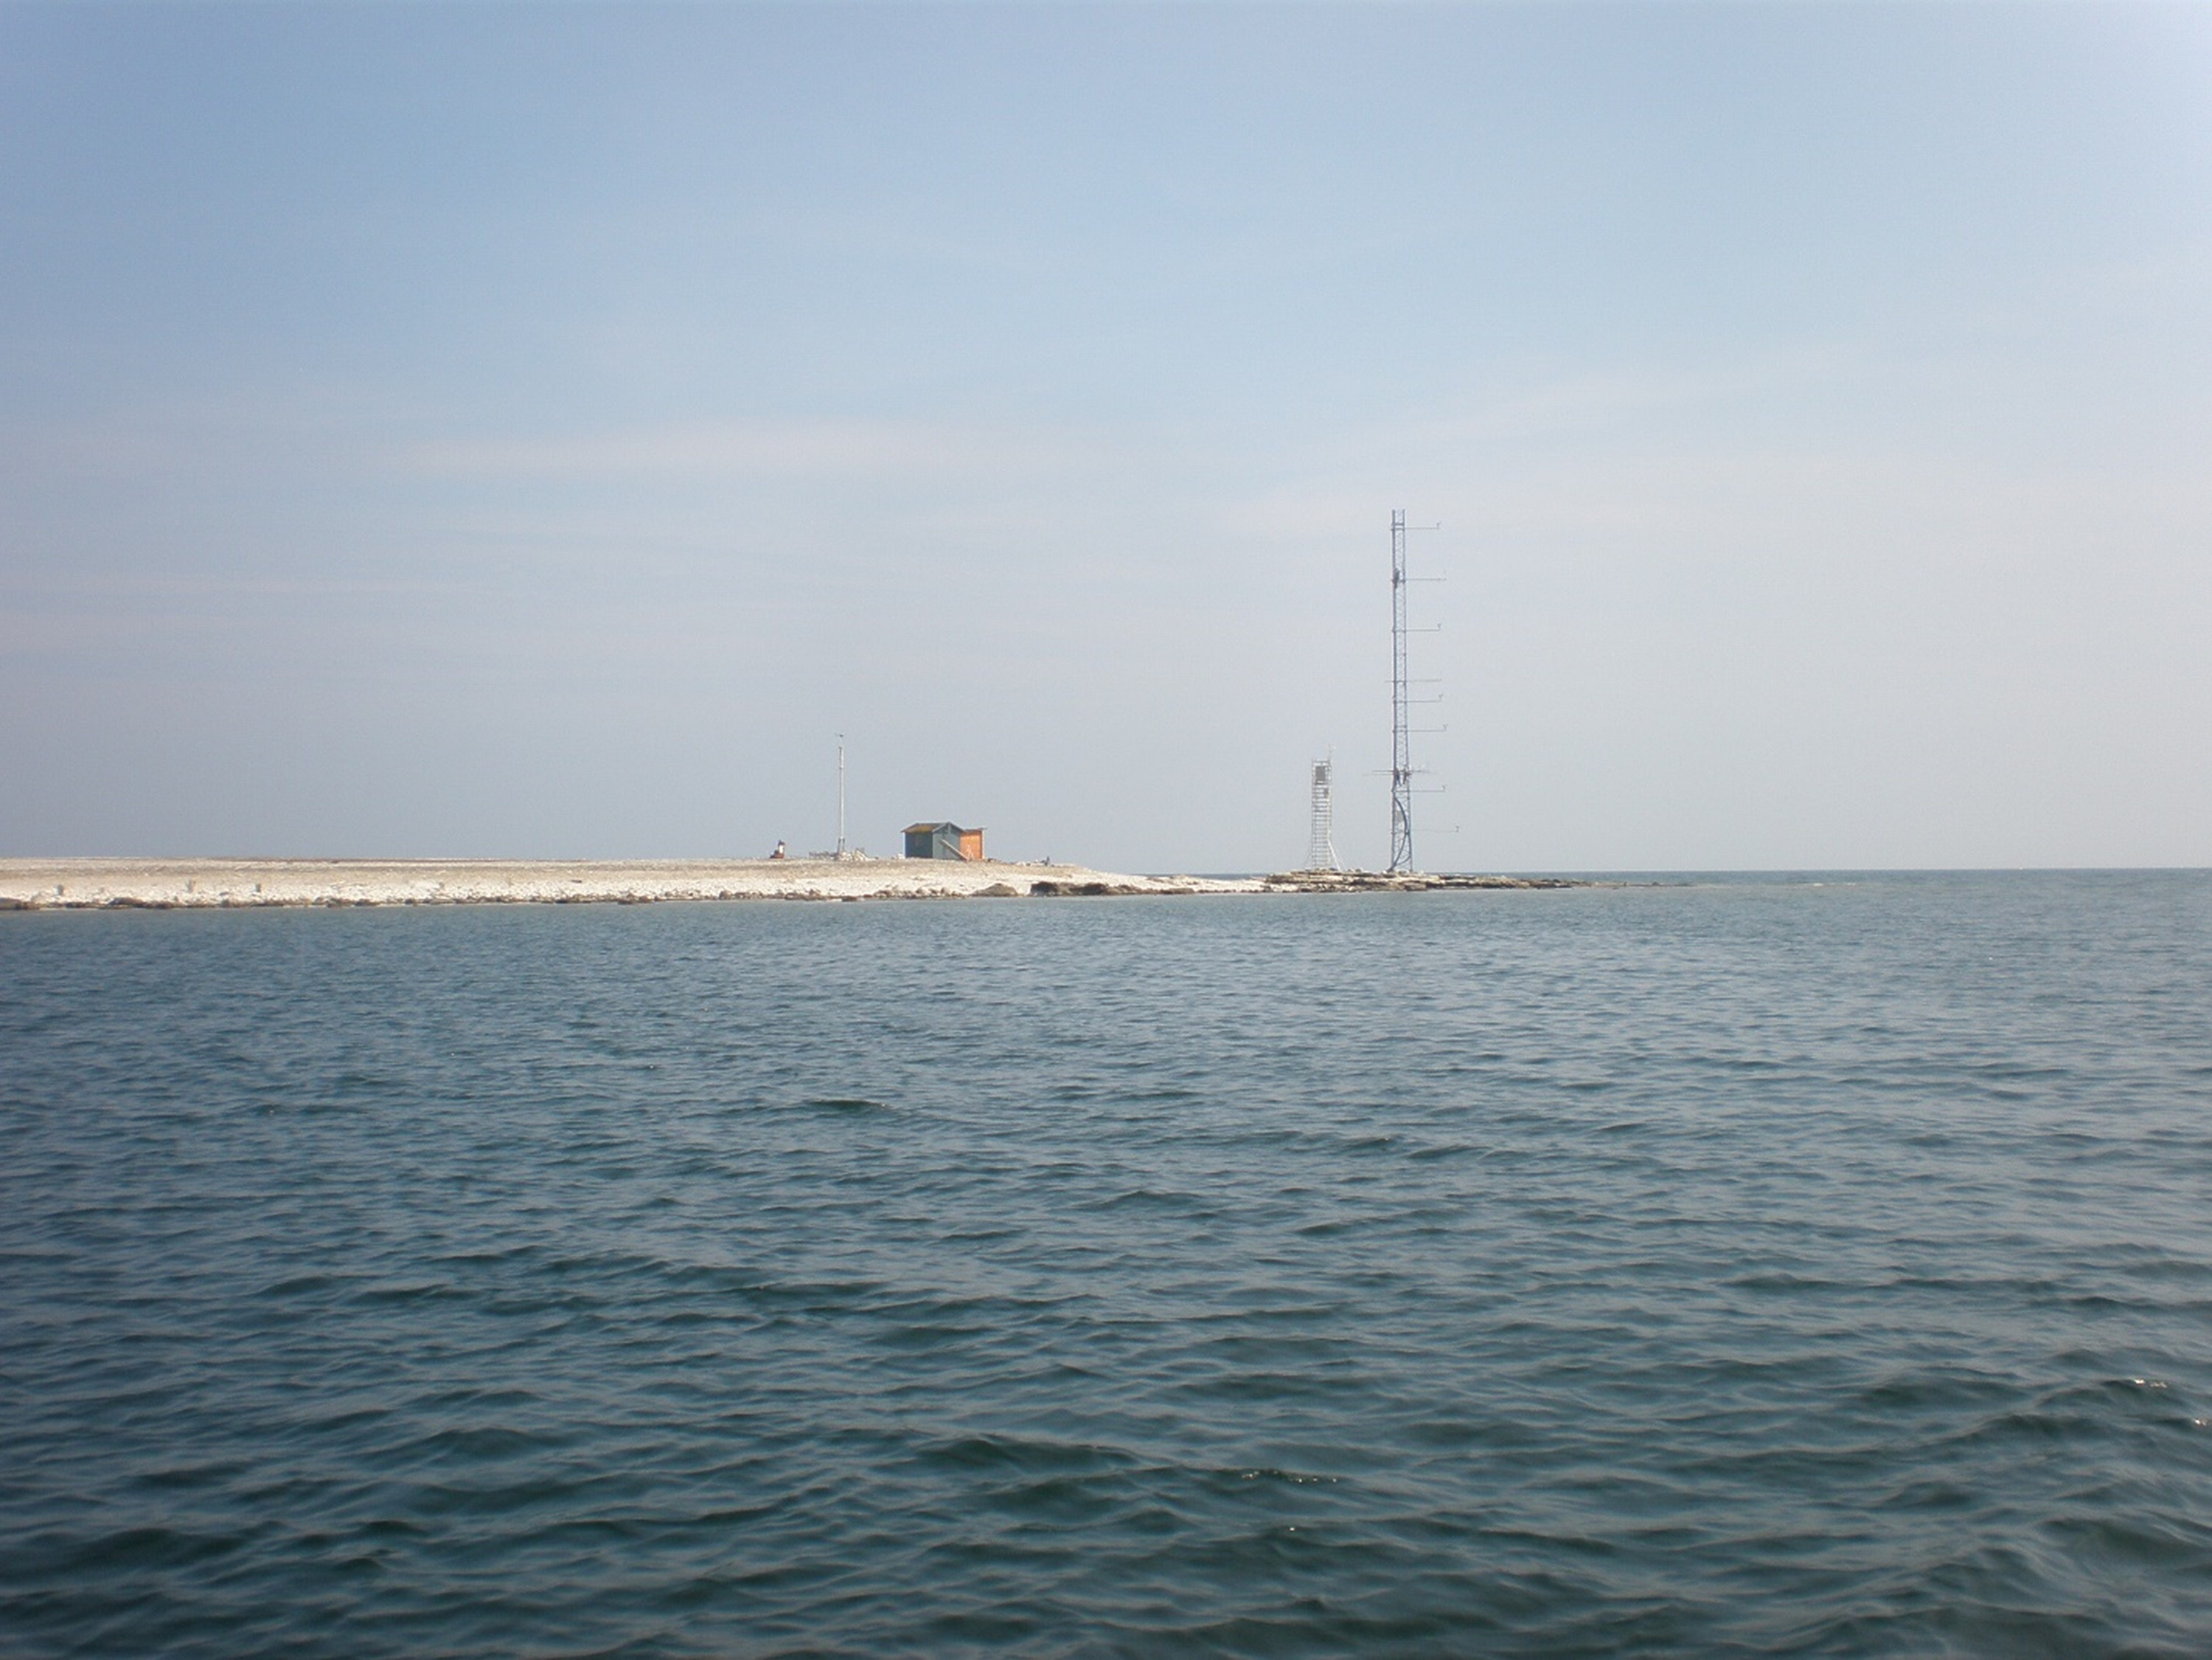
Fig. 2.
The two towers at the Östergarnsholm station (facing east). The 30 m high tower is for flux and meteorological measurements, and the 10 m high tower for aerosol measurements.
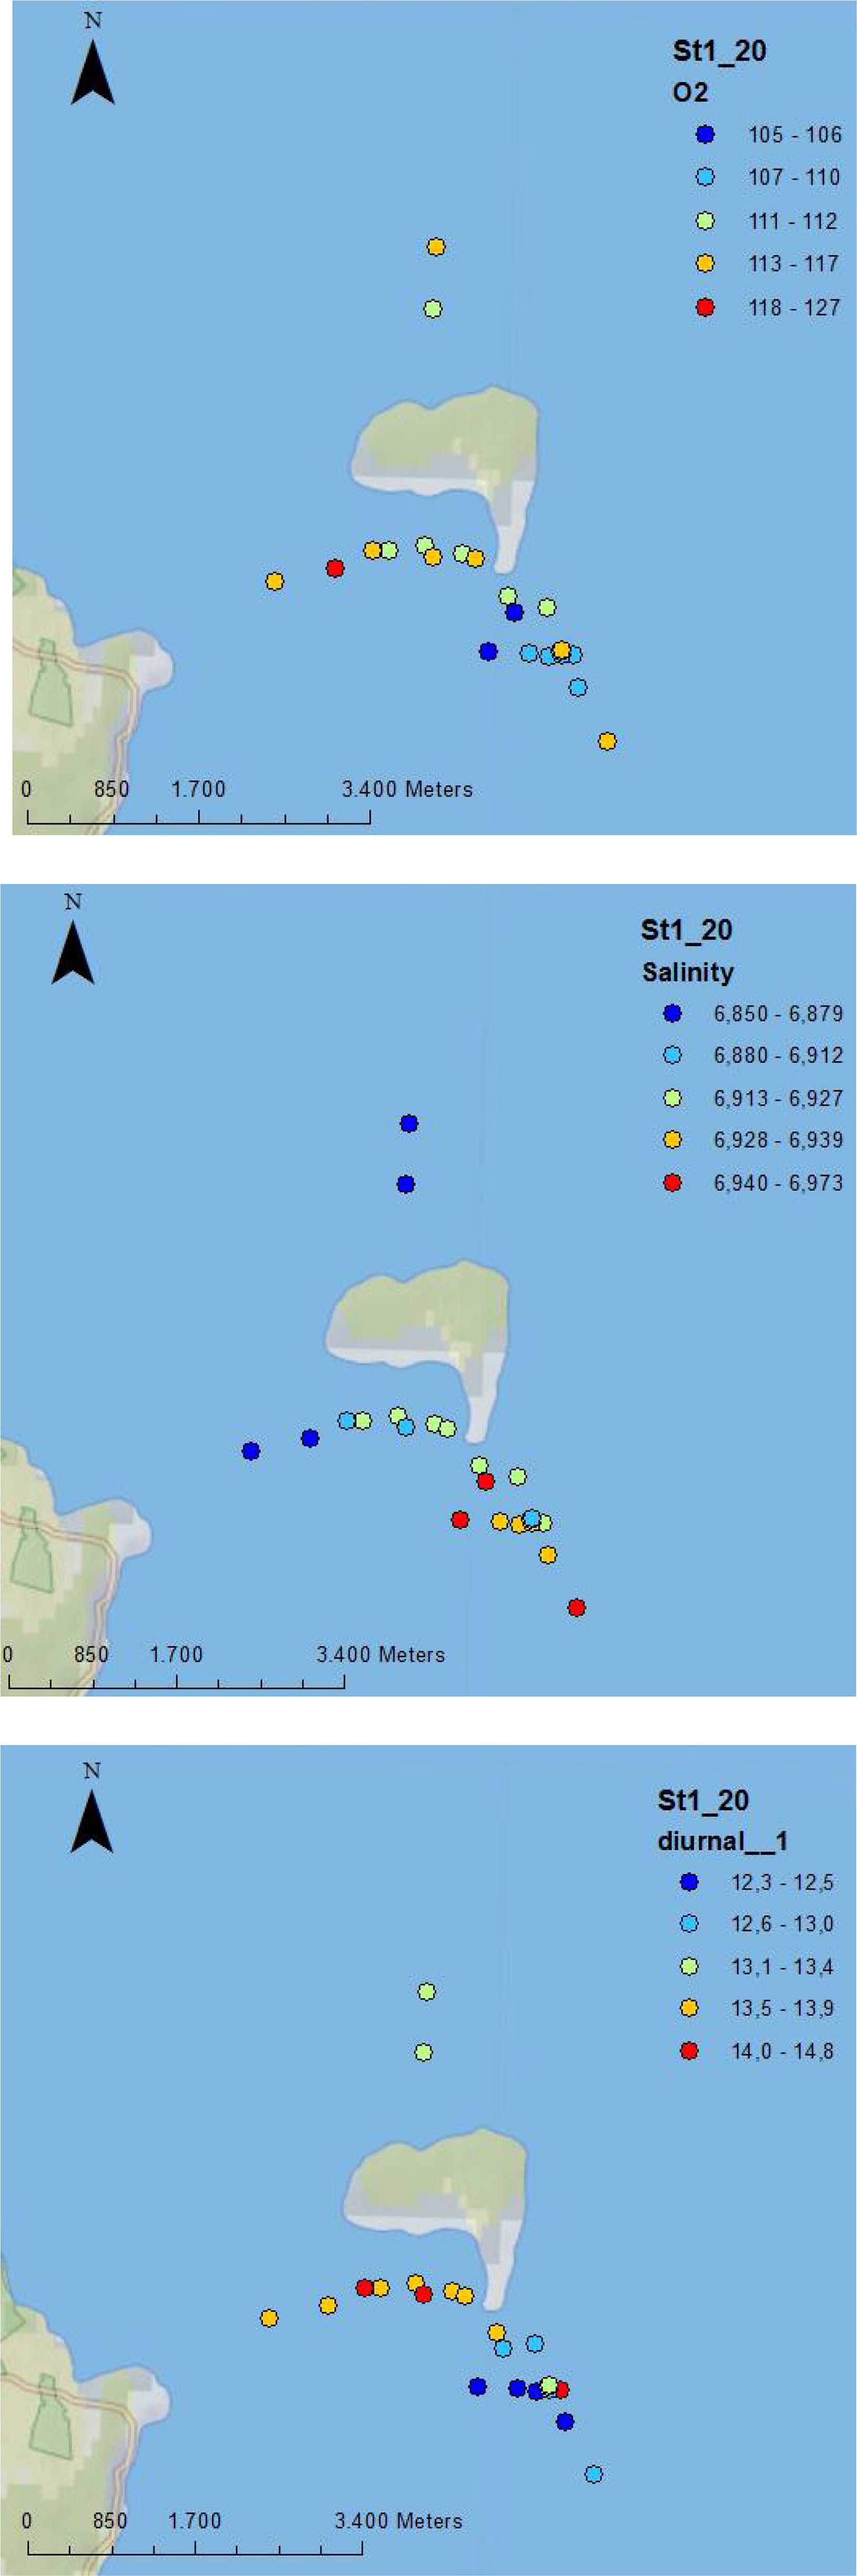
Fig. 3.
The horizontal water variation of diurnal corrected data of (upper) O2 saturation in %, (middle) salinity in PSU and (lower) temperature in °C, data taken in June 2012.
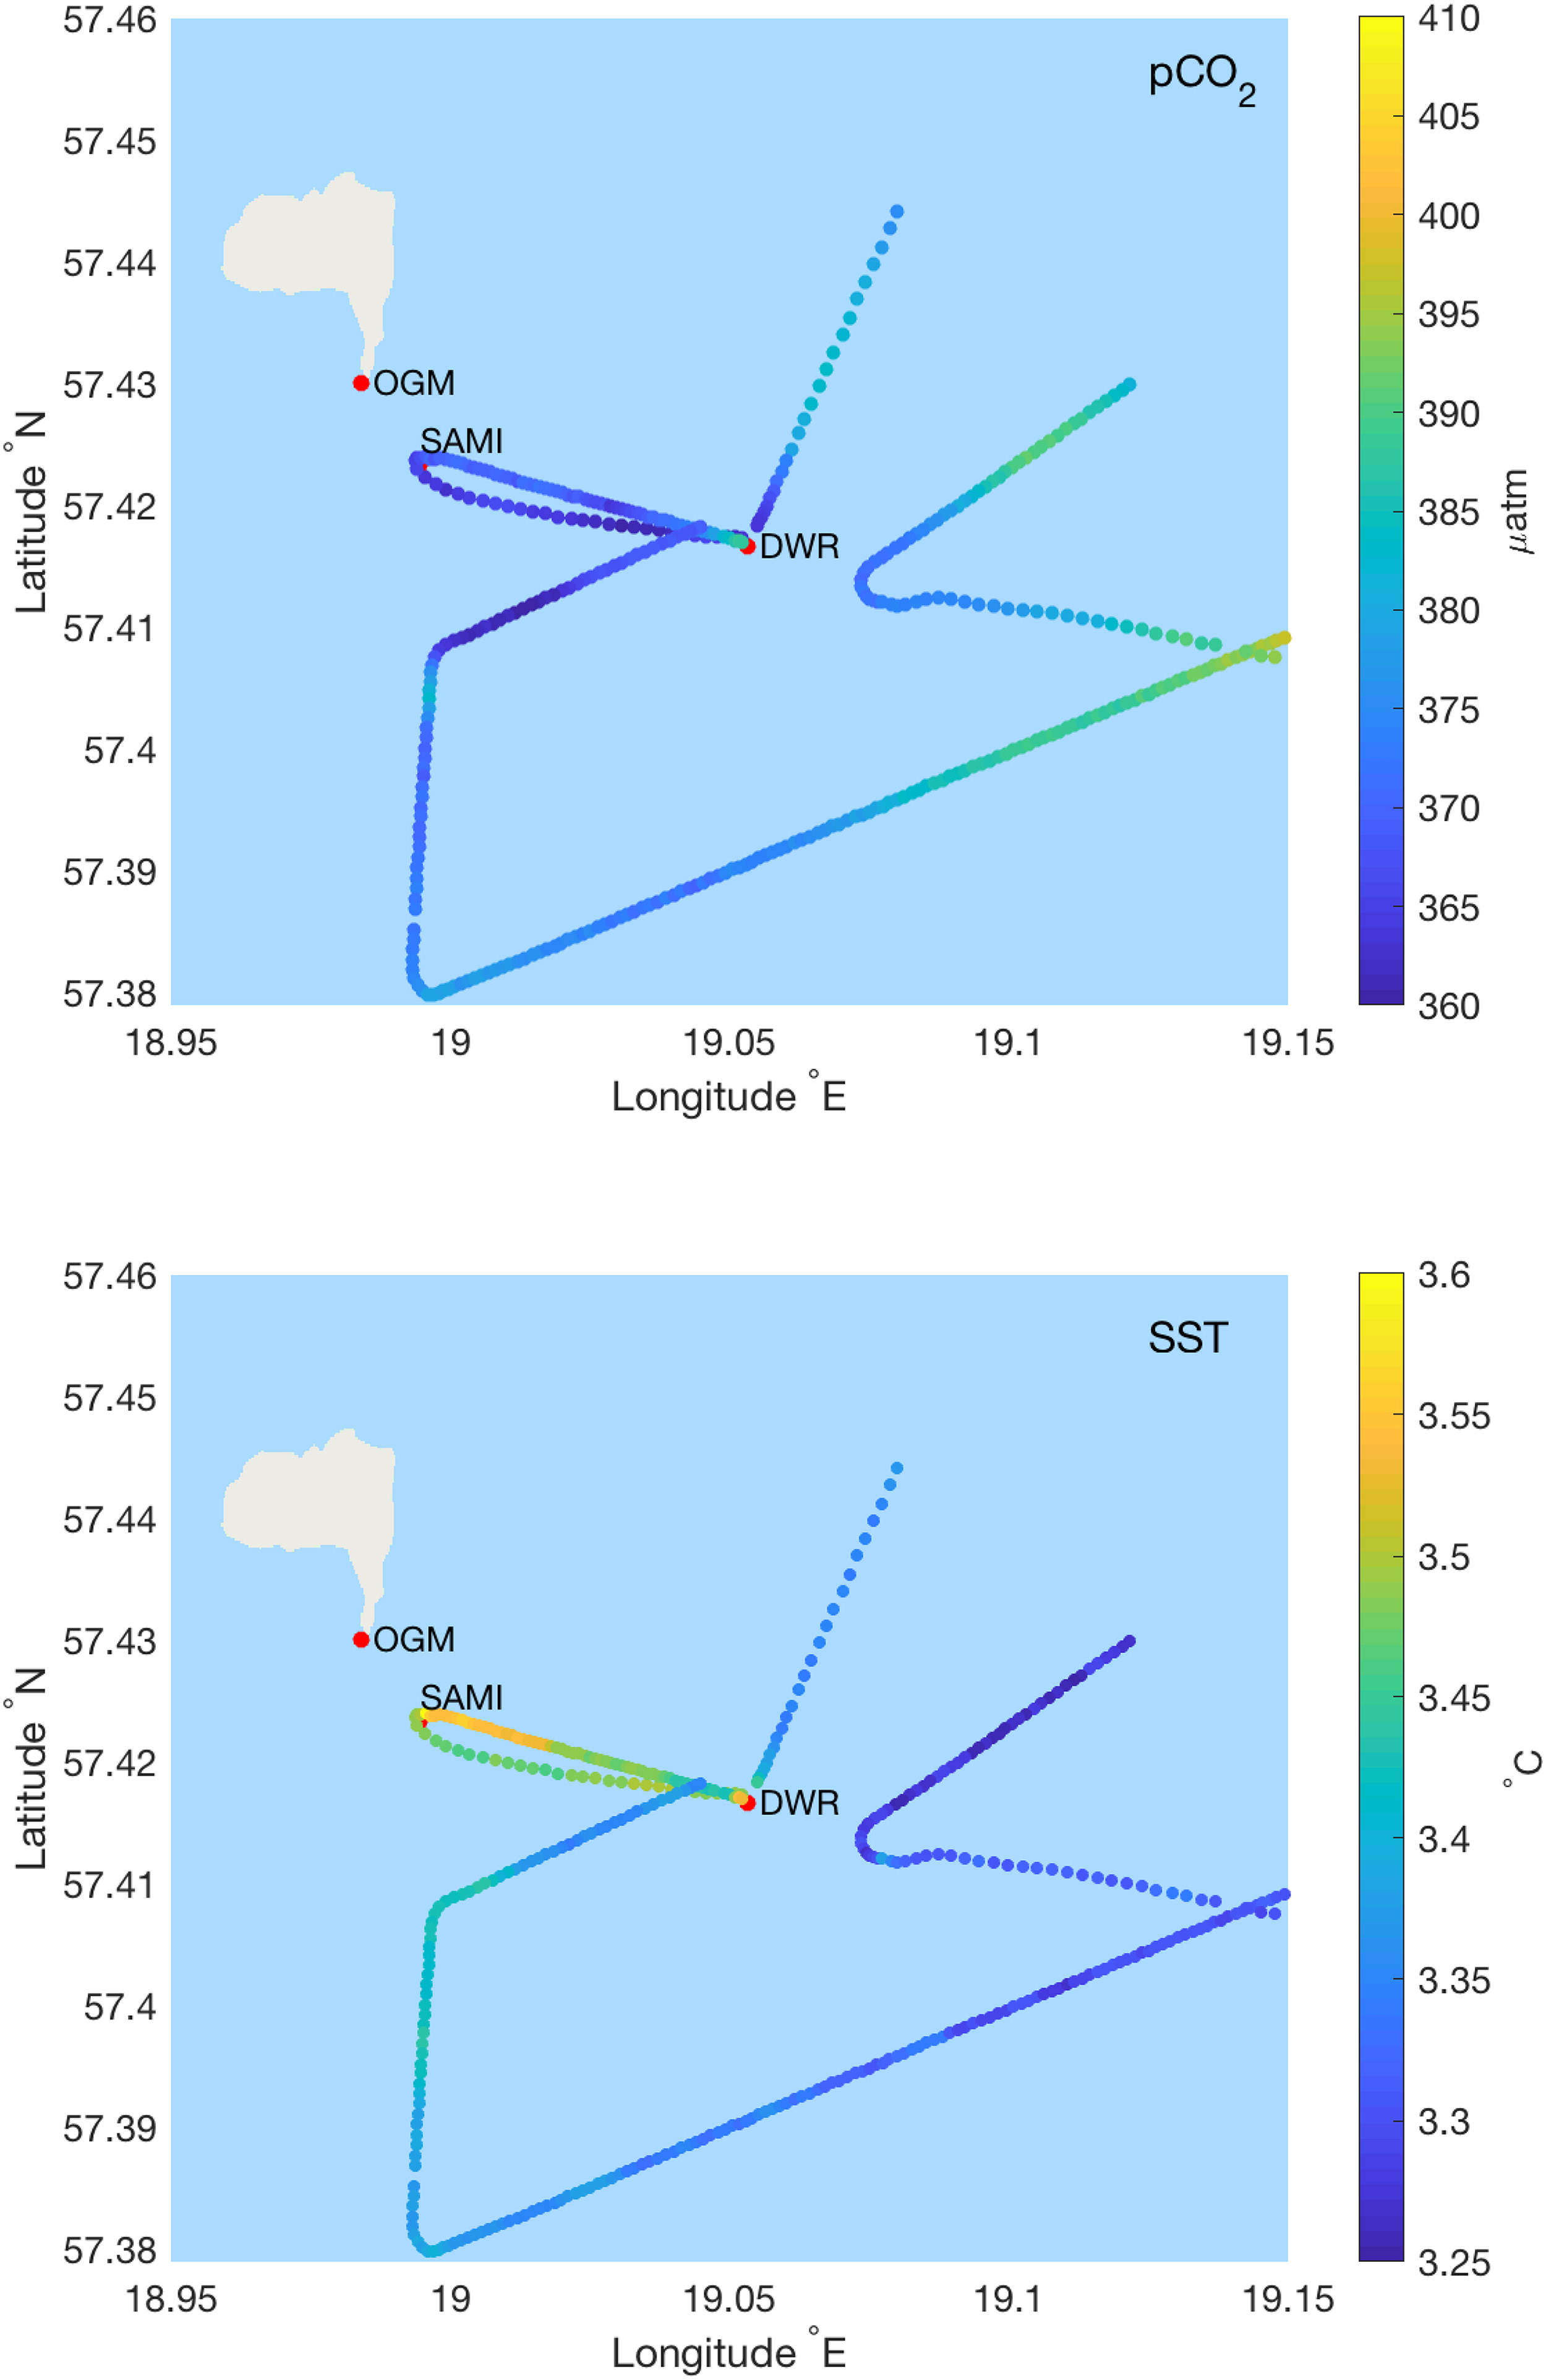
Fig. 4.
pCO2 (upper) and temperature (lower) at 4 m depth from R/V Aranda's cruise 8 and 10 April 2014. Östergarnsholm tower is denoted by OGM, the moored pCO2 sensor by SAMI and the Directional Waverider by DWR.
Table 1.
Characterization of data from different wind direction sectors concerning categories 1 to 3 for physical and biogeochemical properties.
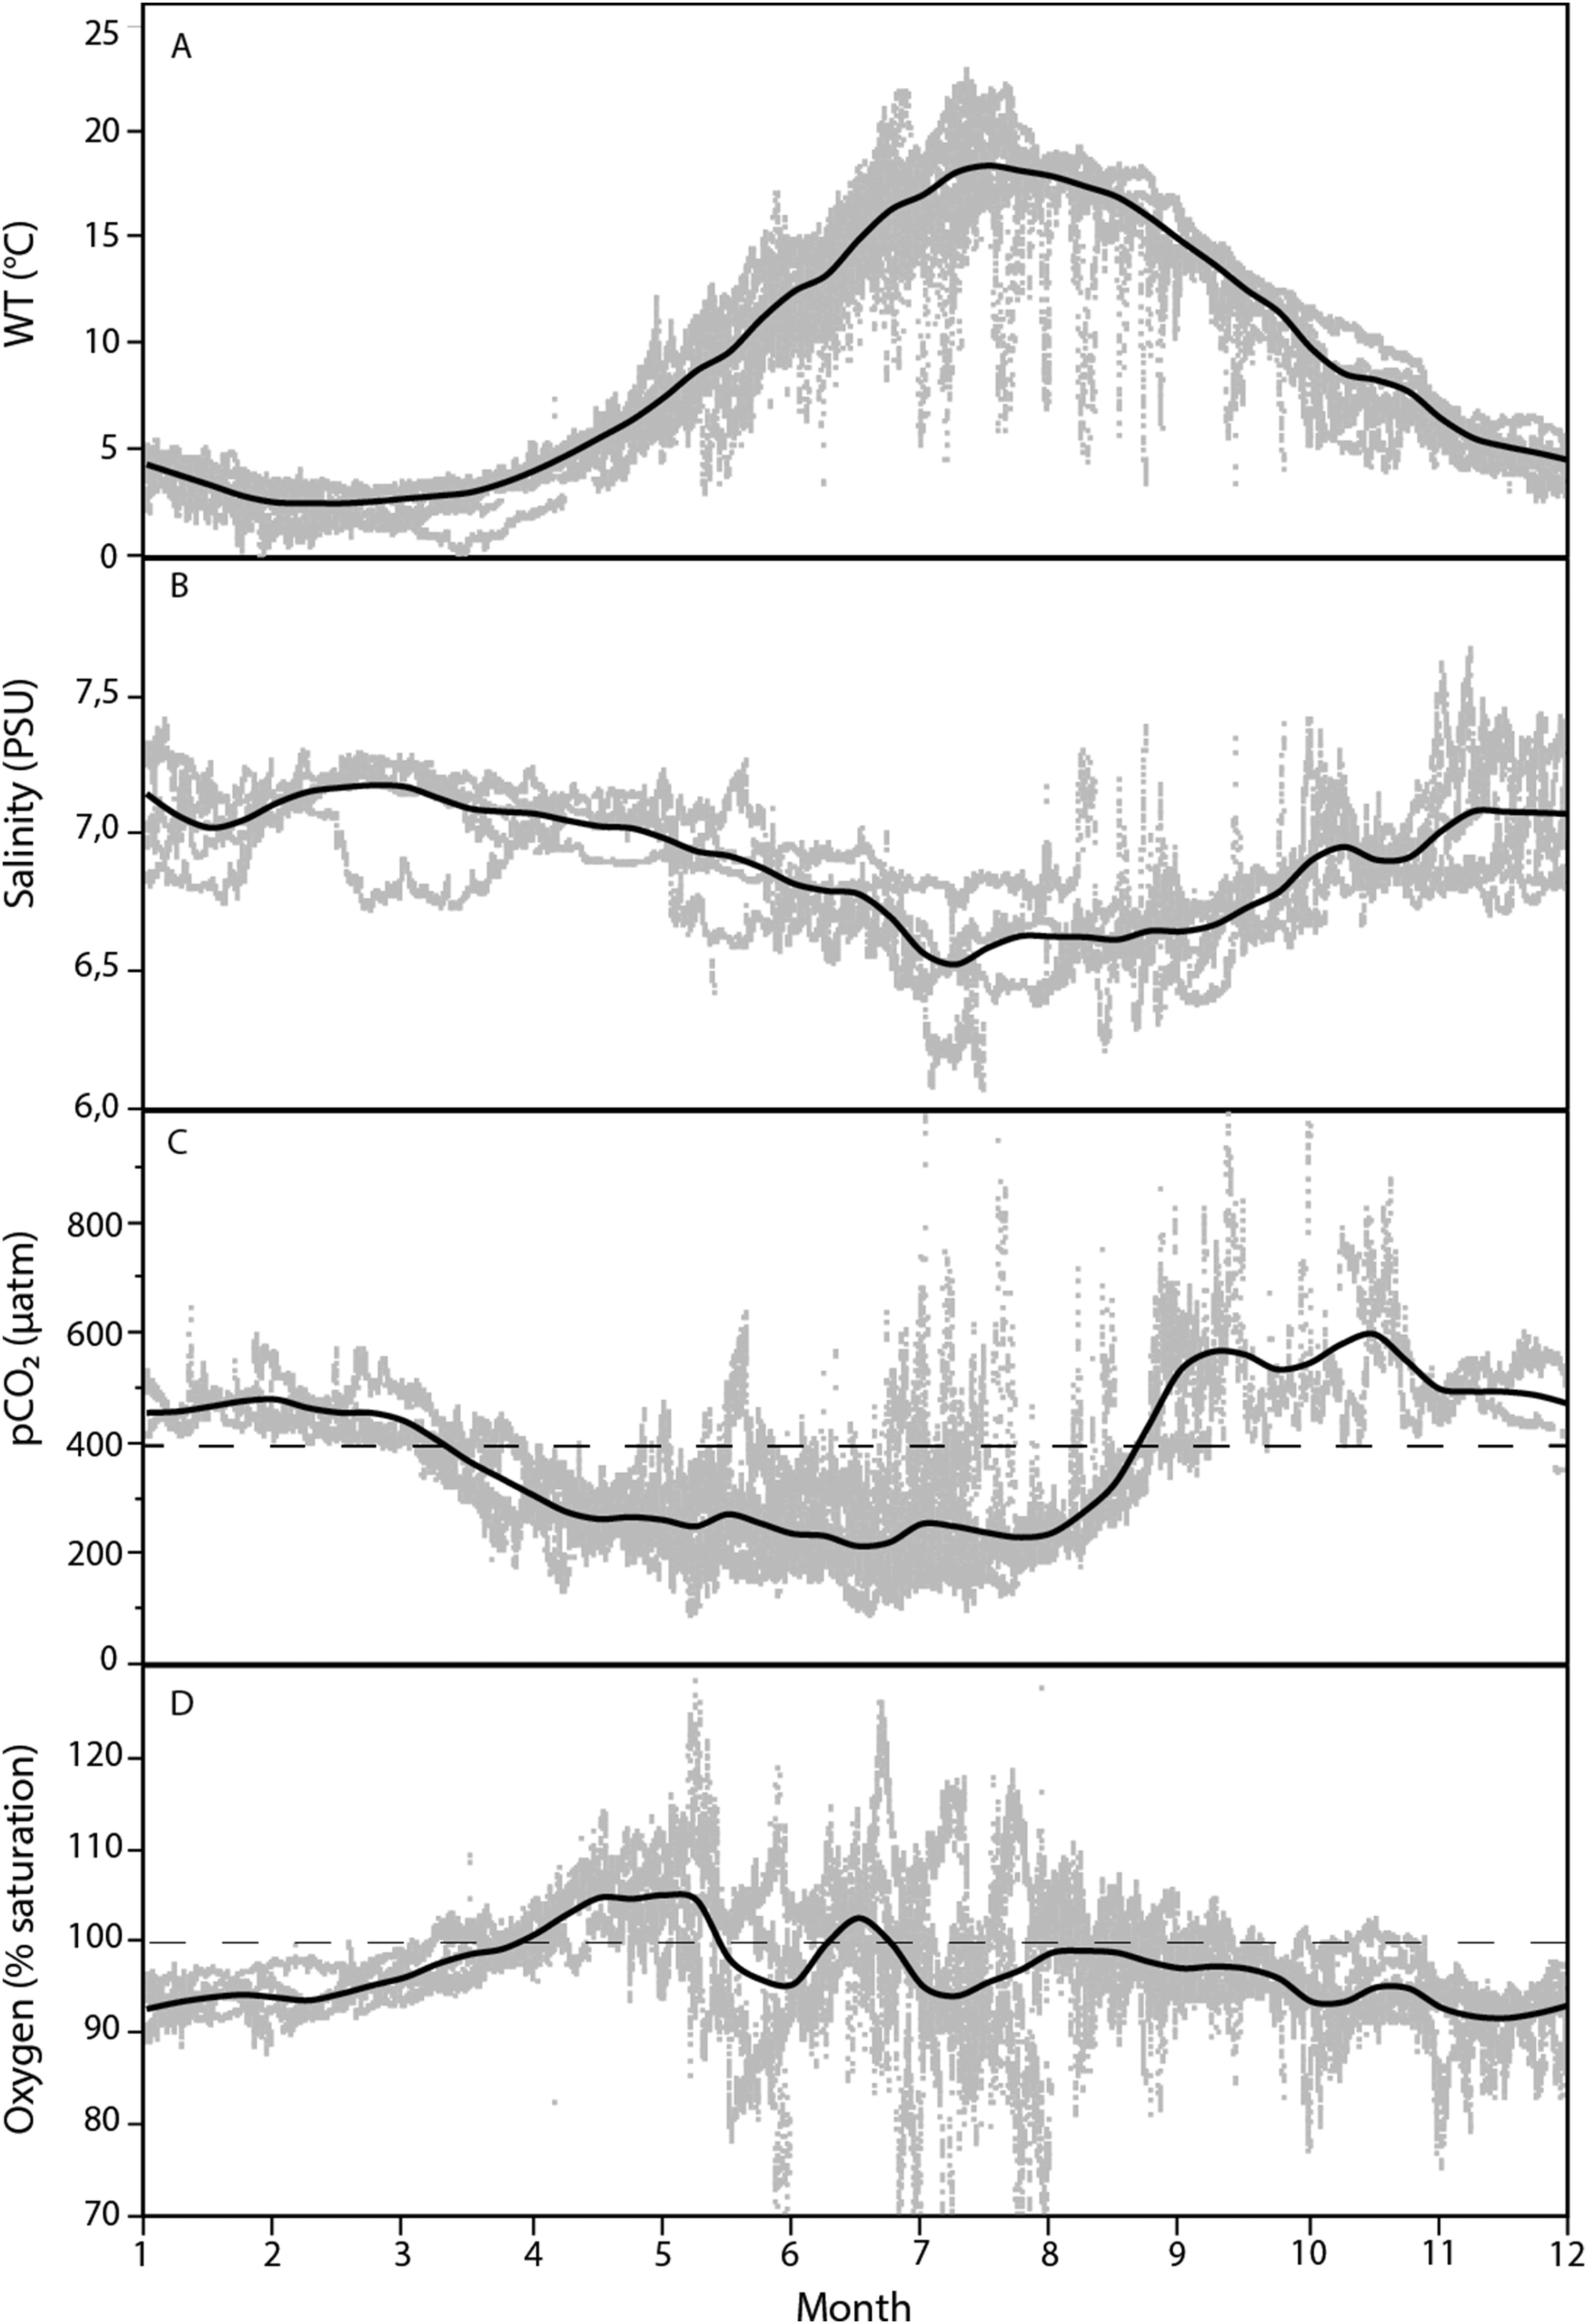
Fig. 5.
Annual cycle of (A) WT, (B) salinity, (C) pCO2 and (D) oxygen saturation measured during 2005–2016 for WT and pCO2, and during 2011–2016 for salinity and oxygen saturation at the Östergarnsholm site. Grey dots are individual measured data, solid black line is average value. Dashed lines represent current equilibrium with the atmosphere for CO2 and 100% saturation for oxygen. The sensors were placed at 5 m depth. Position of sensors is indicated by SAMI sensor in Figure 1.
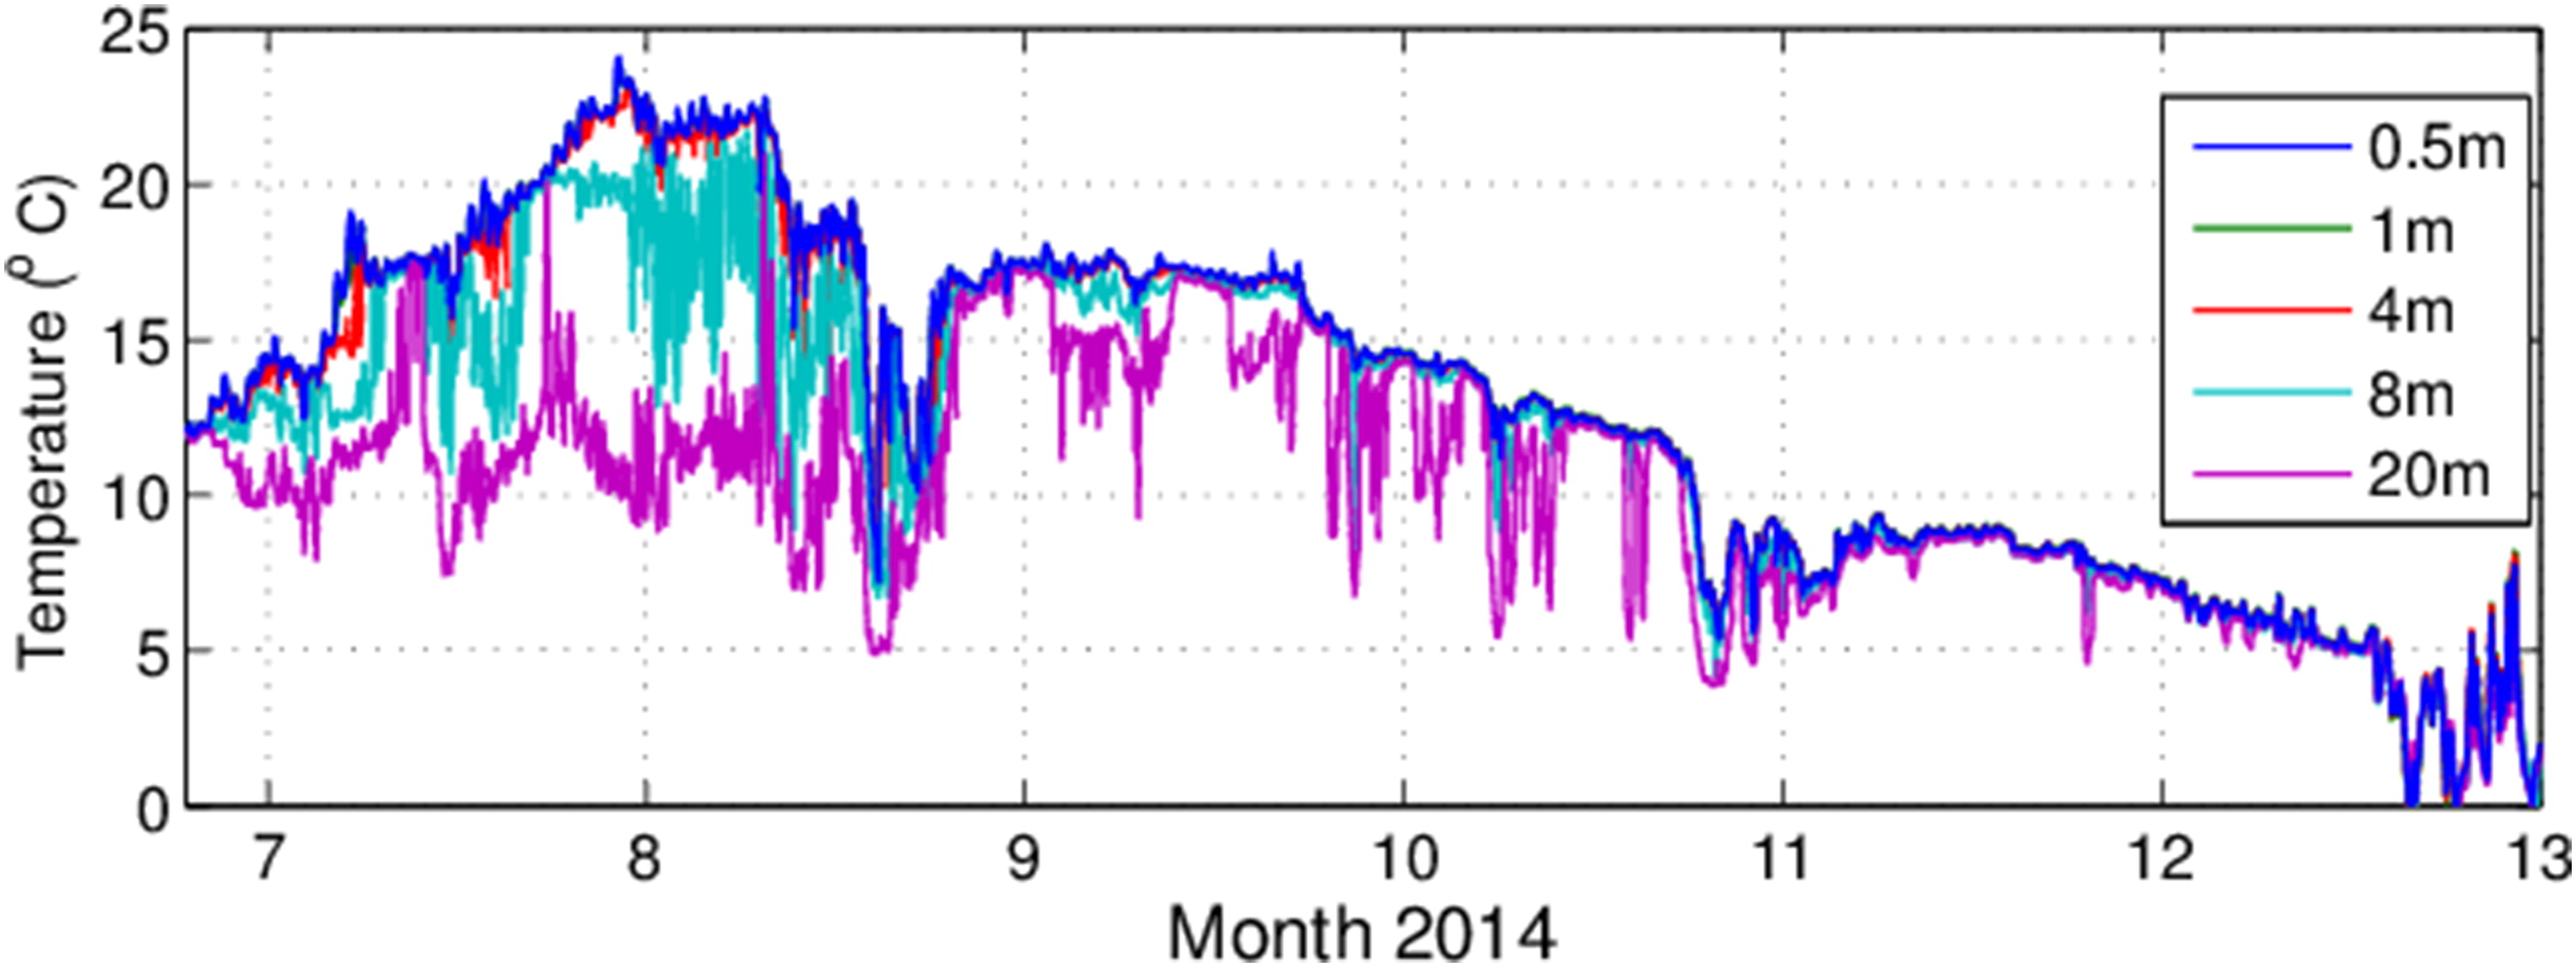
Fig. 6.
Water temperatures at the 5 measuring depths (0.5–20 m) from late June to late December 2014 (decimal month is shown in the figure).
Table 2.
Mean water chemistry based on monthly sampling during April to November 2016 at three different depths at the Östergarnsholm site.
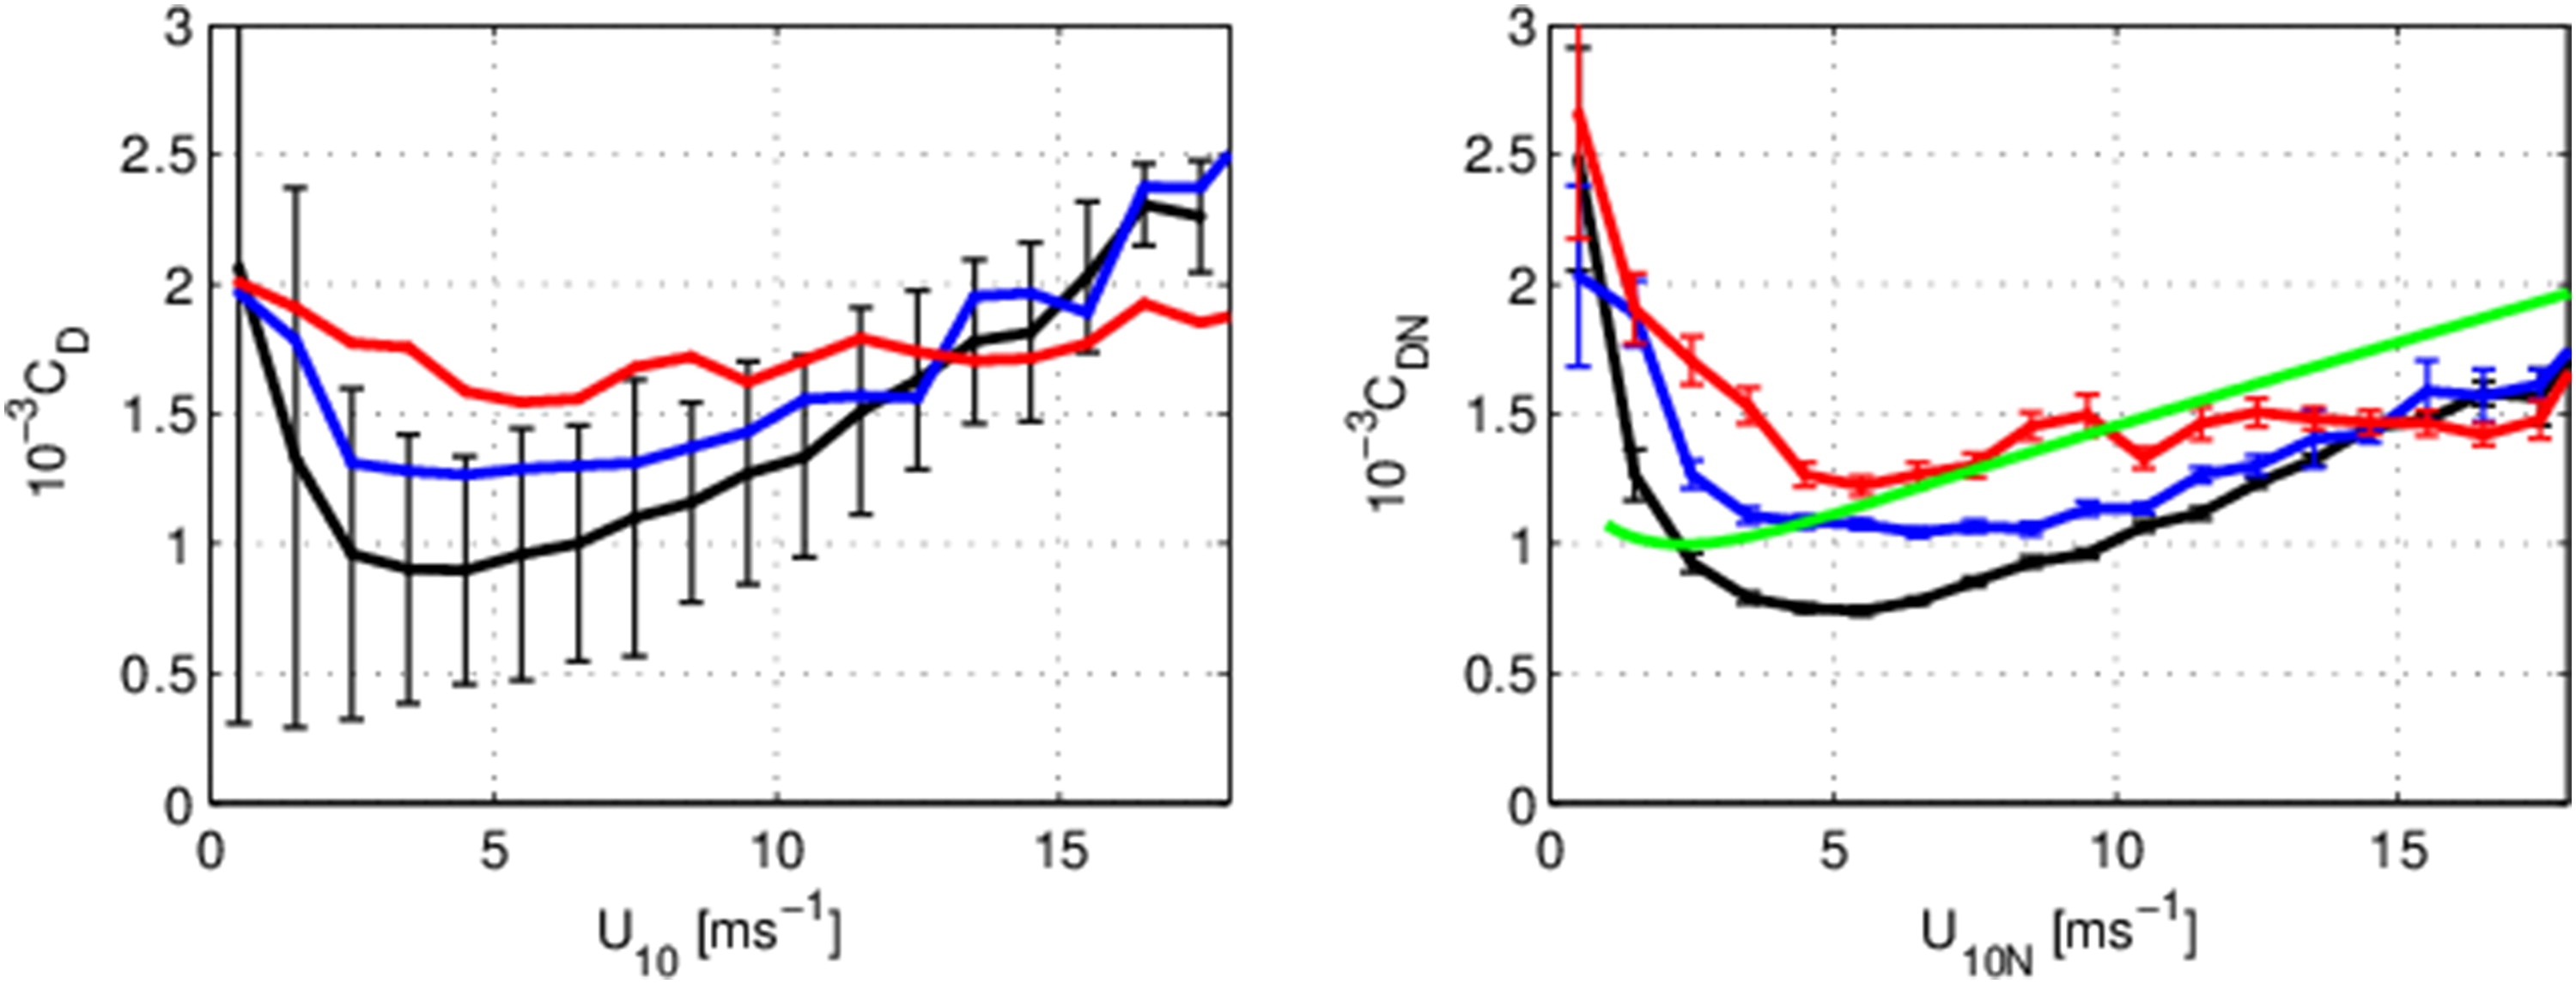
Fig. 7.
Drag coefficient averaged over wind-speed intervals, error bars show one standard deviation of the variability of CAT1; for clarity of the figure, variability is not shown for the other sectors, being larger than for CAT1, (a) and corresponding neutral drag coefficient; error bars show (b). Black lines represent open sea sector (CAT1), blue lines coastal sector (CAT2) and red lines mixed land–sea sector (CAT3). Green line in (b) is the drag coefficient calculated using Charnock equation. Data are from 2013 to 2015.
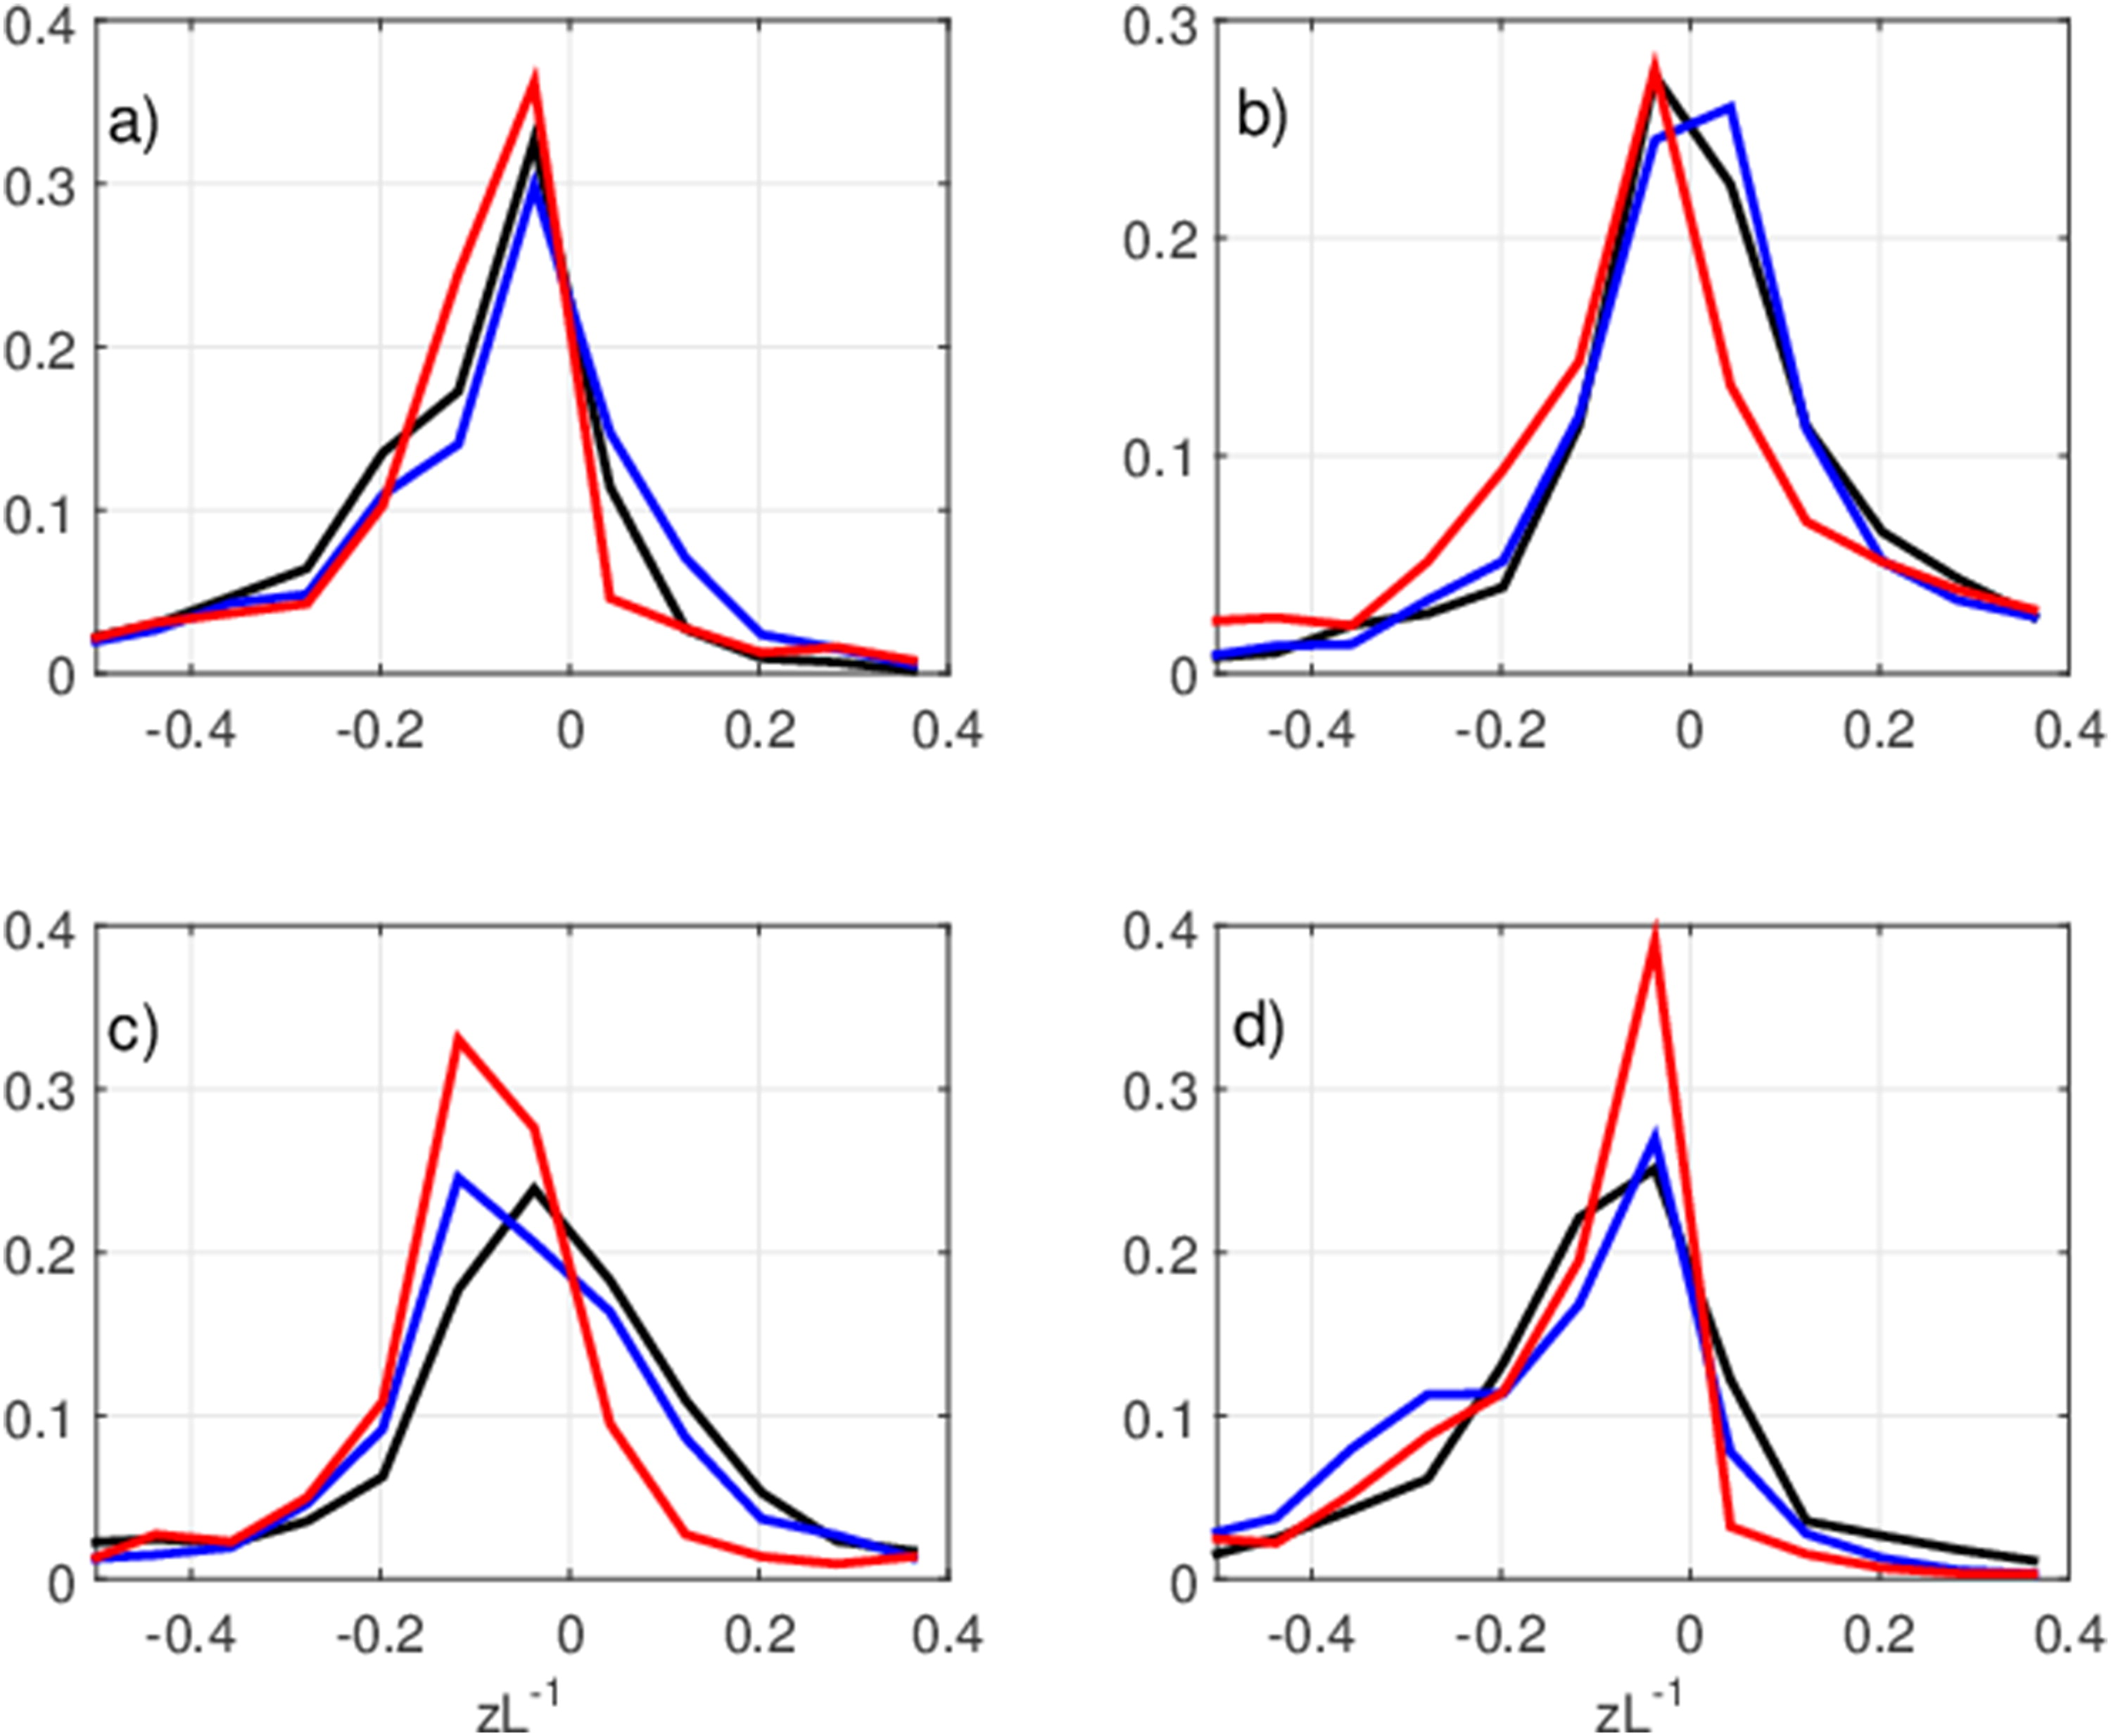
Fig. 8.
Frequency distribution of the stability parameter z/L for the different data categories for (a) winter (DJF), (b) spring (MAM), (c) summer (JJA) and (d) fall (SON). Black lines represent open sea sector (CAT1), blue coastal sector (CAT2) and red mixed land–sea sector (CAT3). Data are from 2013 to 2015.
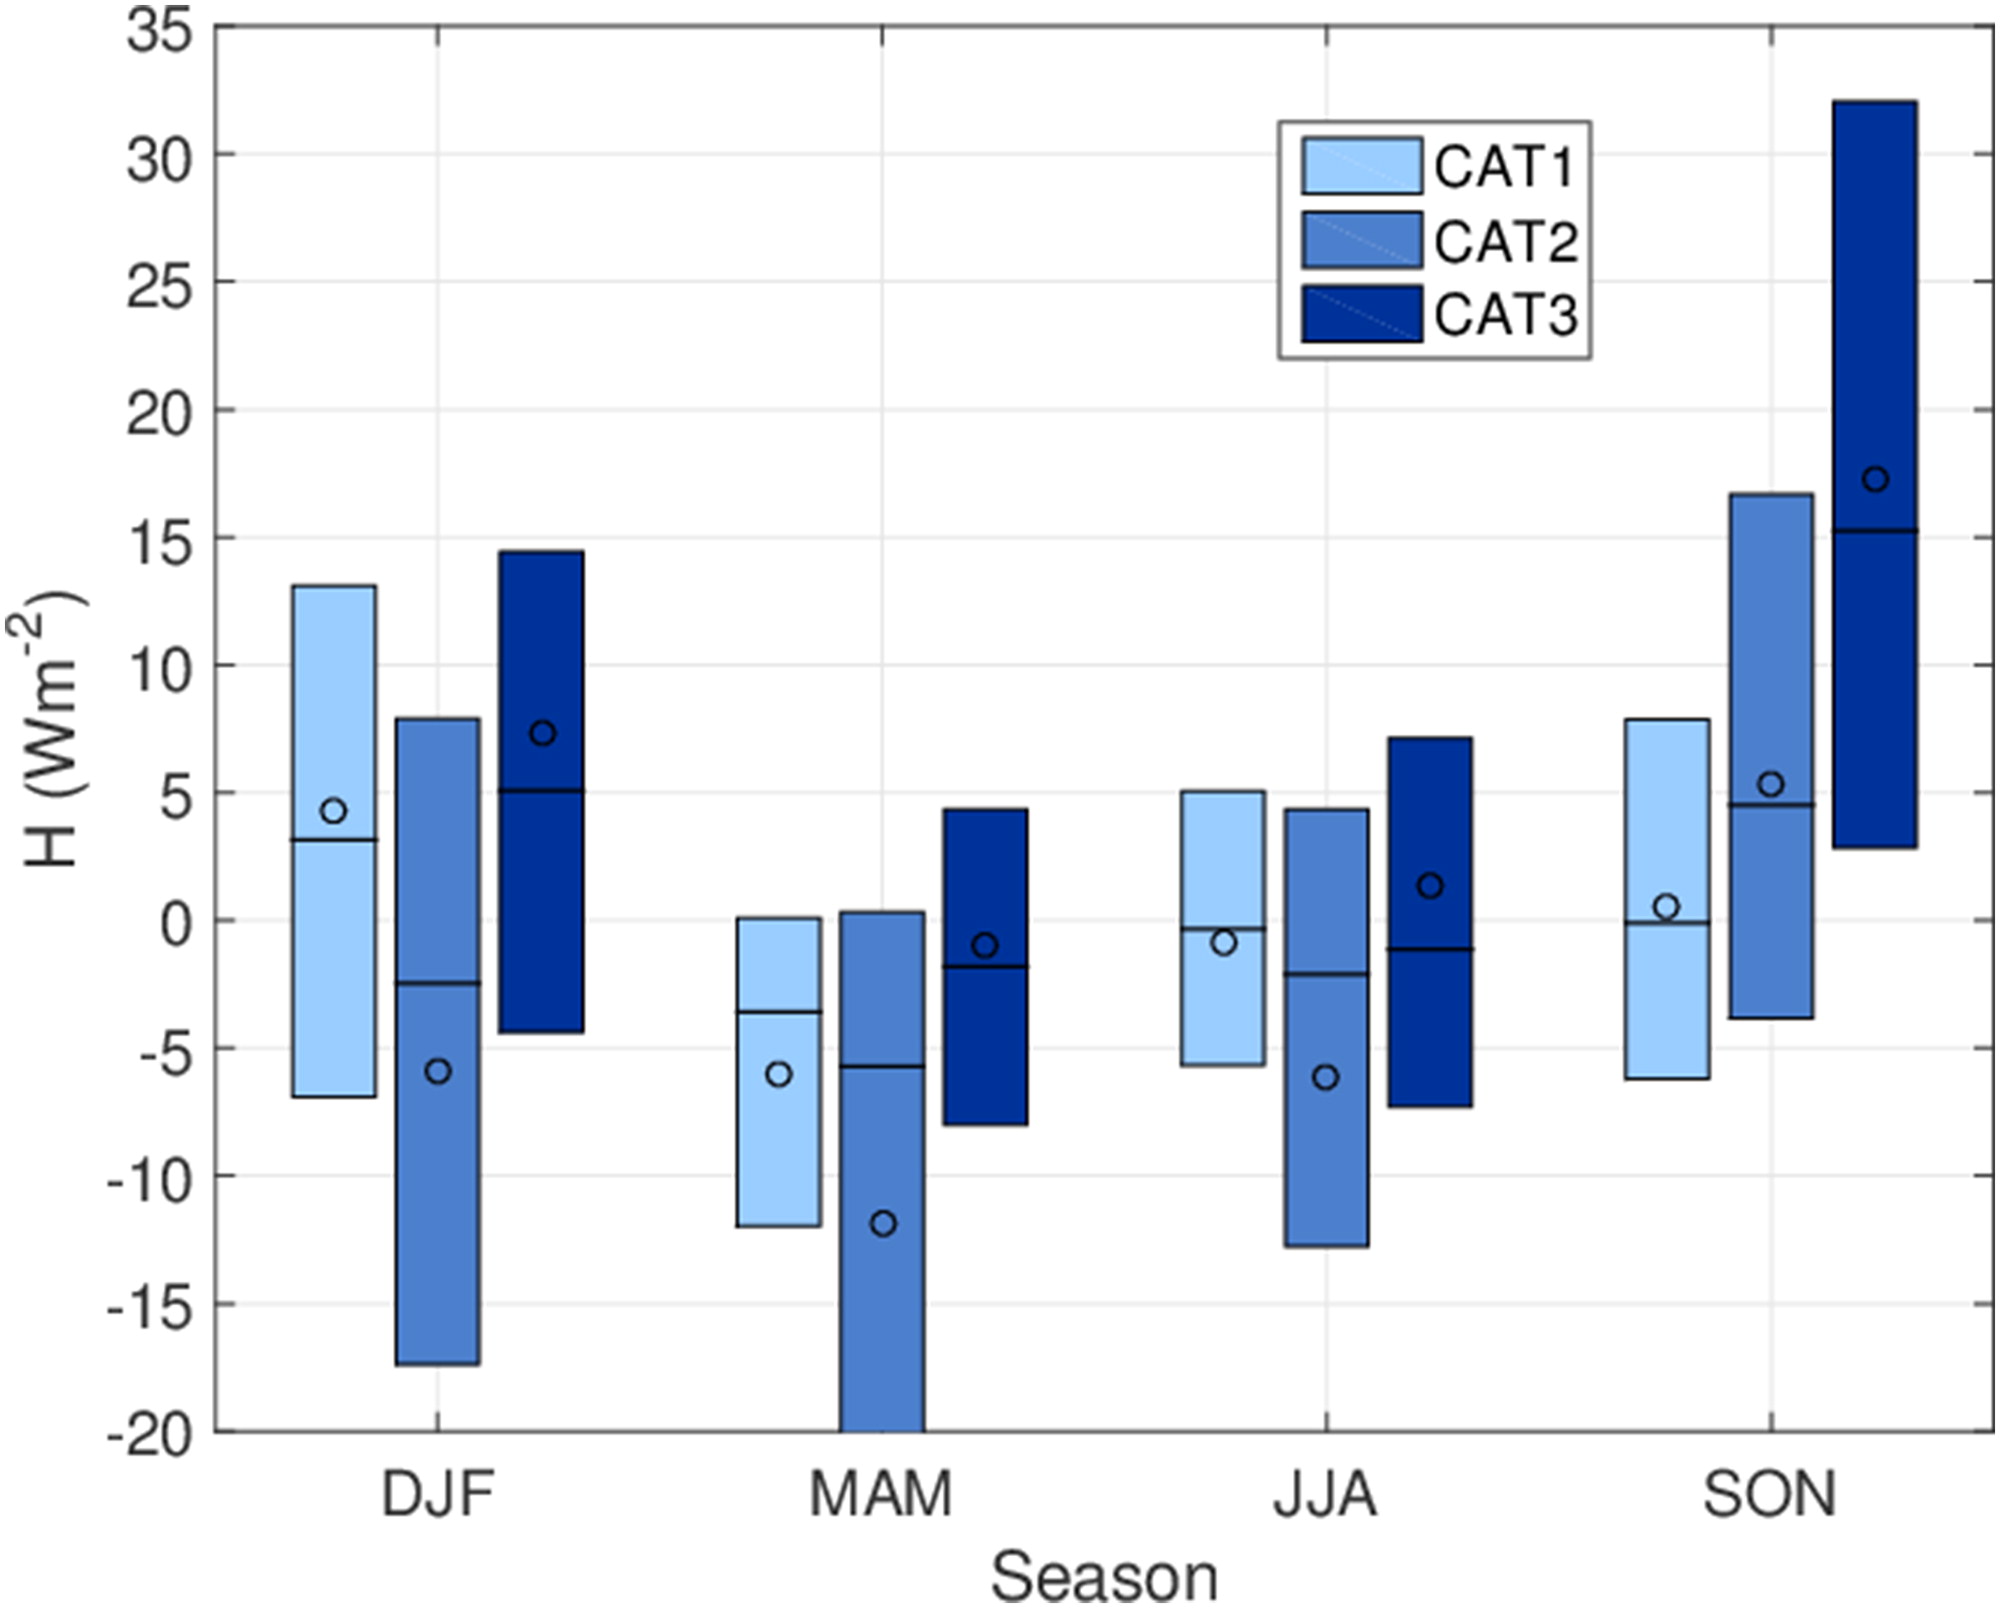
Fig. 9.
Seasonally averaged sensible heat flux for the different category data (CAT1, CAT2 and CAT3, respectively). The boxes are defined based on the first and third quartile of the distribution and thus show the interquartile range corresponding to 50% of the data; the circles are the mean, and thin horizontal lines the median. Number of data items for each of the boxes ranges from 500 to1800 for CAT1 and CAT 2 and from 130 to 355 for CAT3.
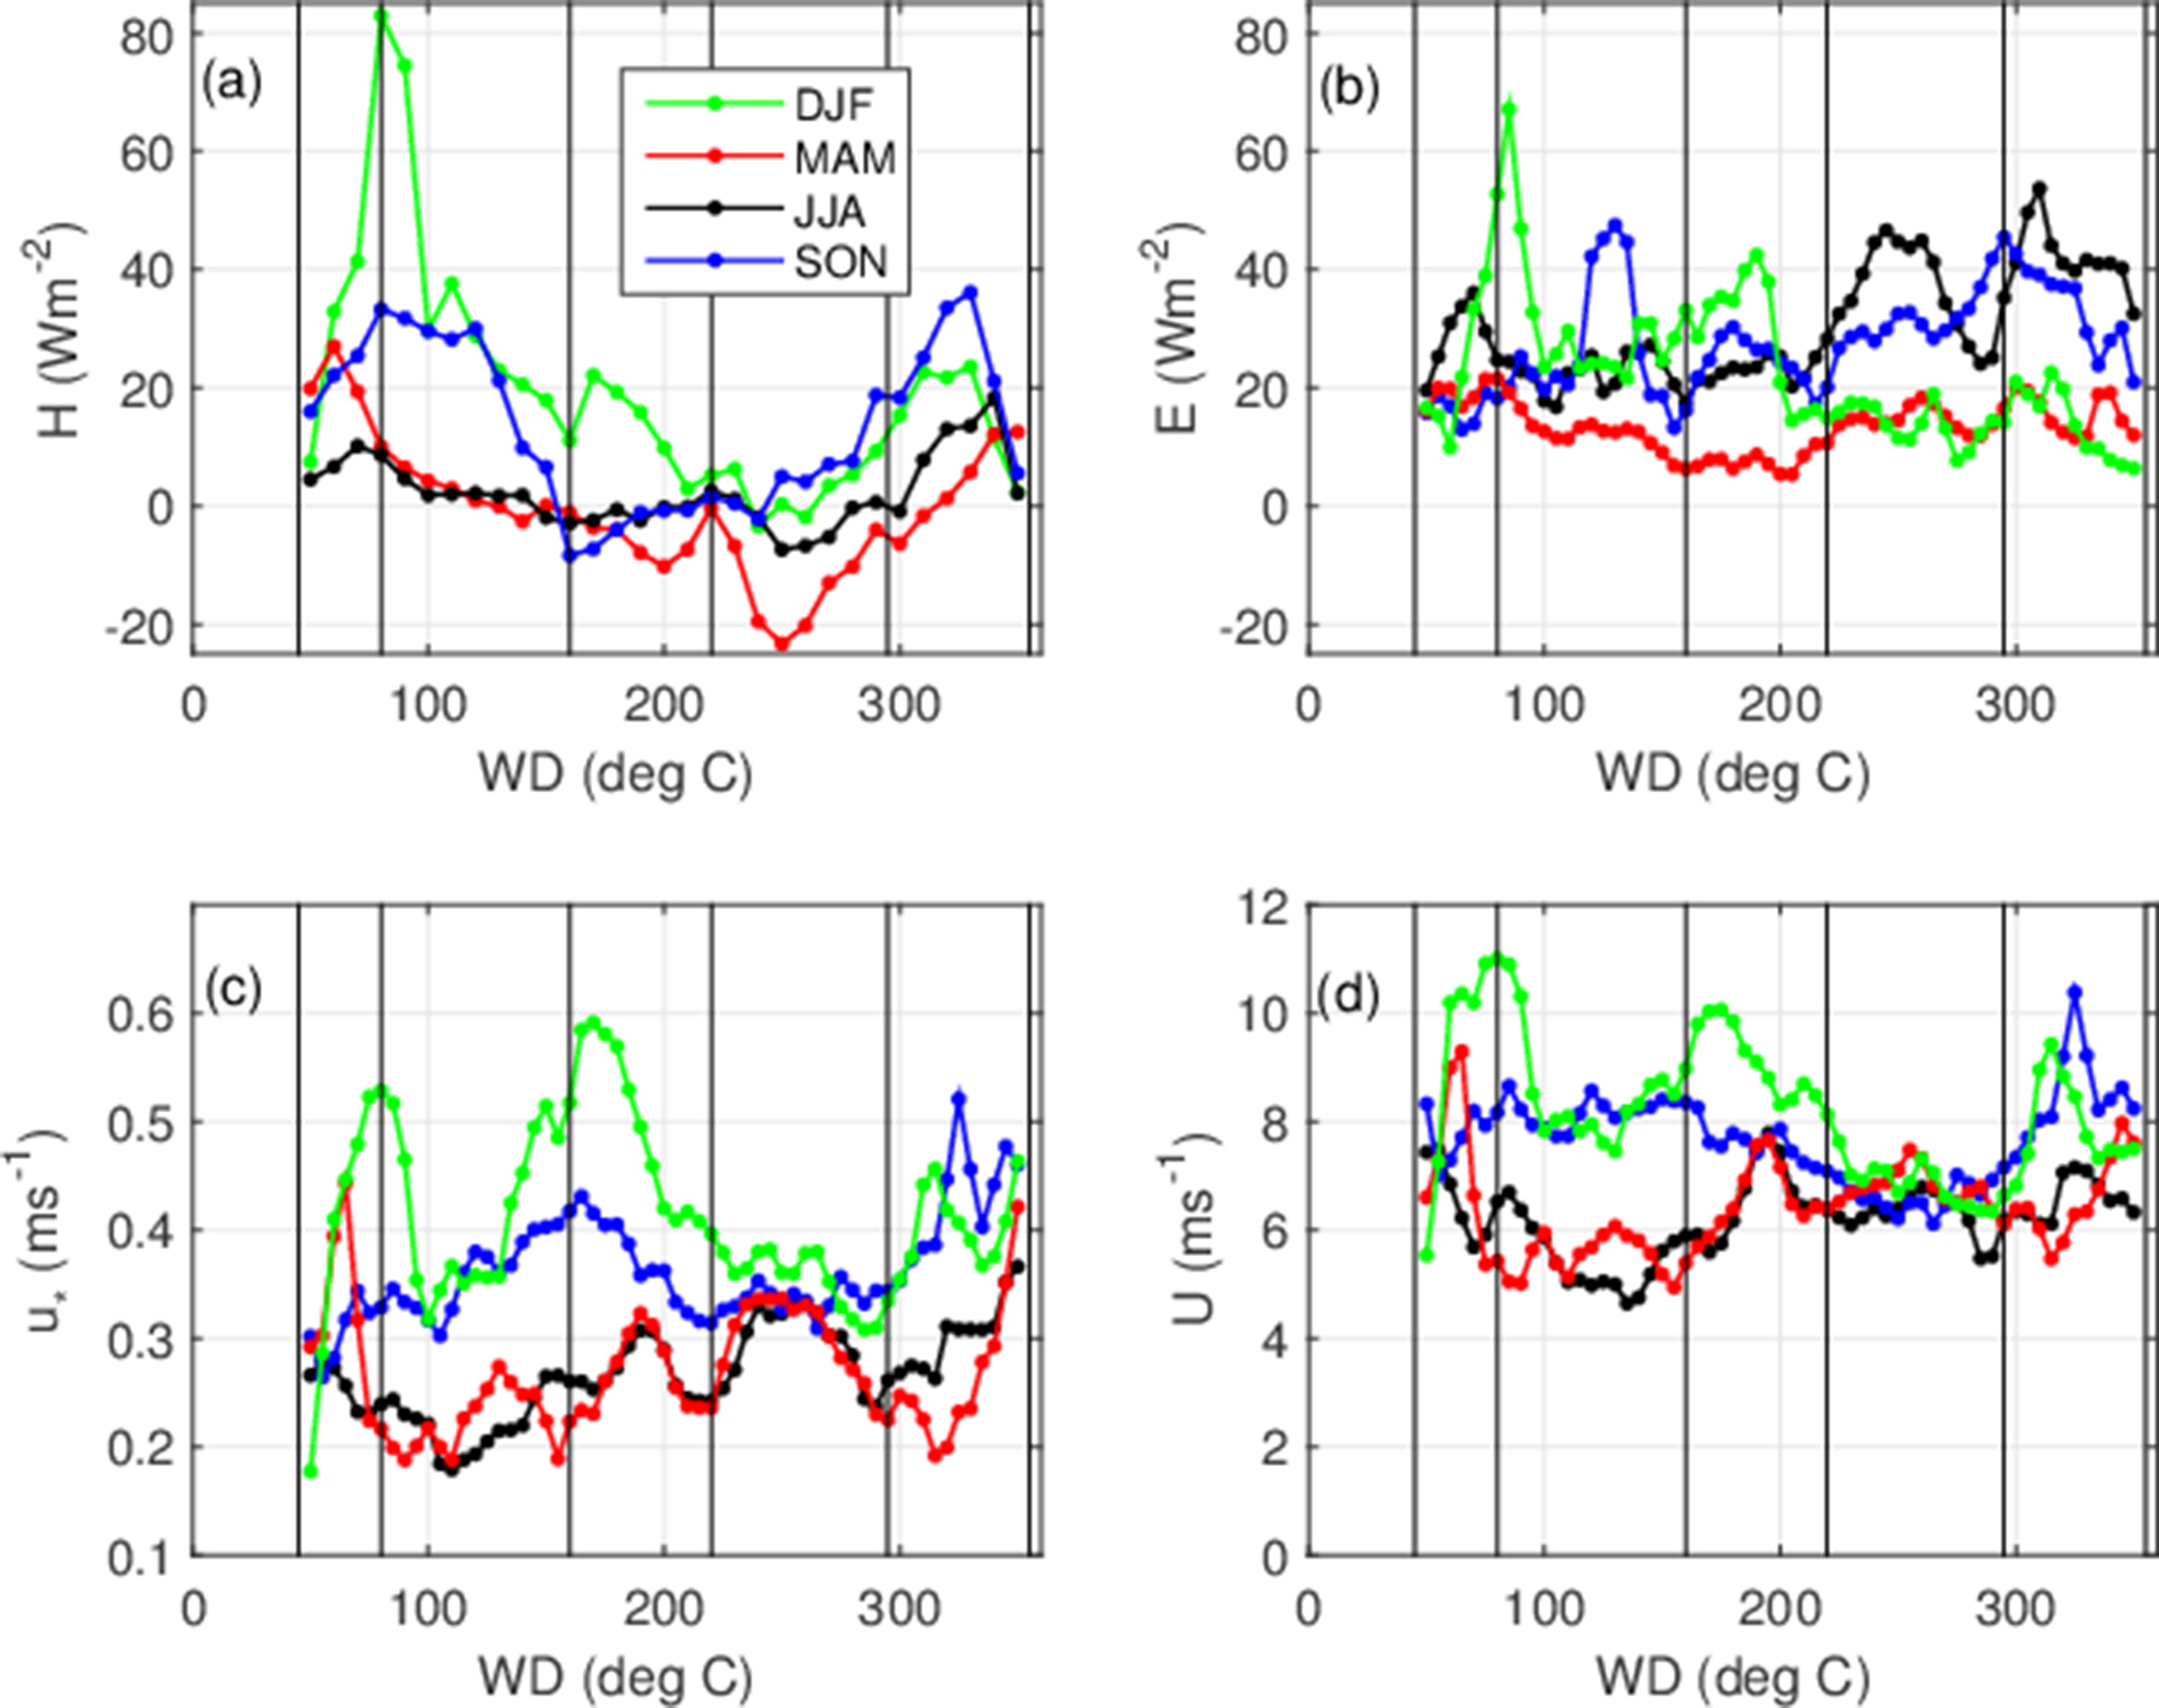
Fig. 10.
Bin (interval) averages of (a) sensible heat flux, (b) latent heat flux, (c) friction velocity and (d) wind speed. Lines represent winter DJF (green), spring MAM (red), summer JJA (black) and fall SON (blue). Thin vertical lines represent wind direction intervals according to Table 1.
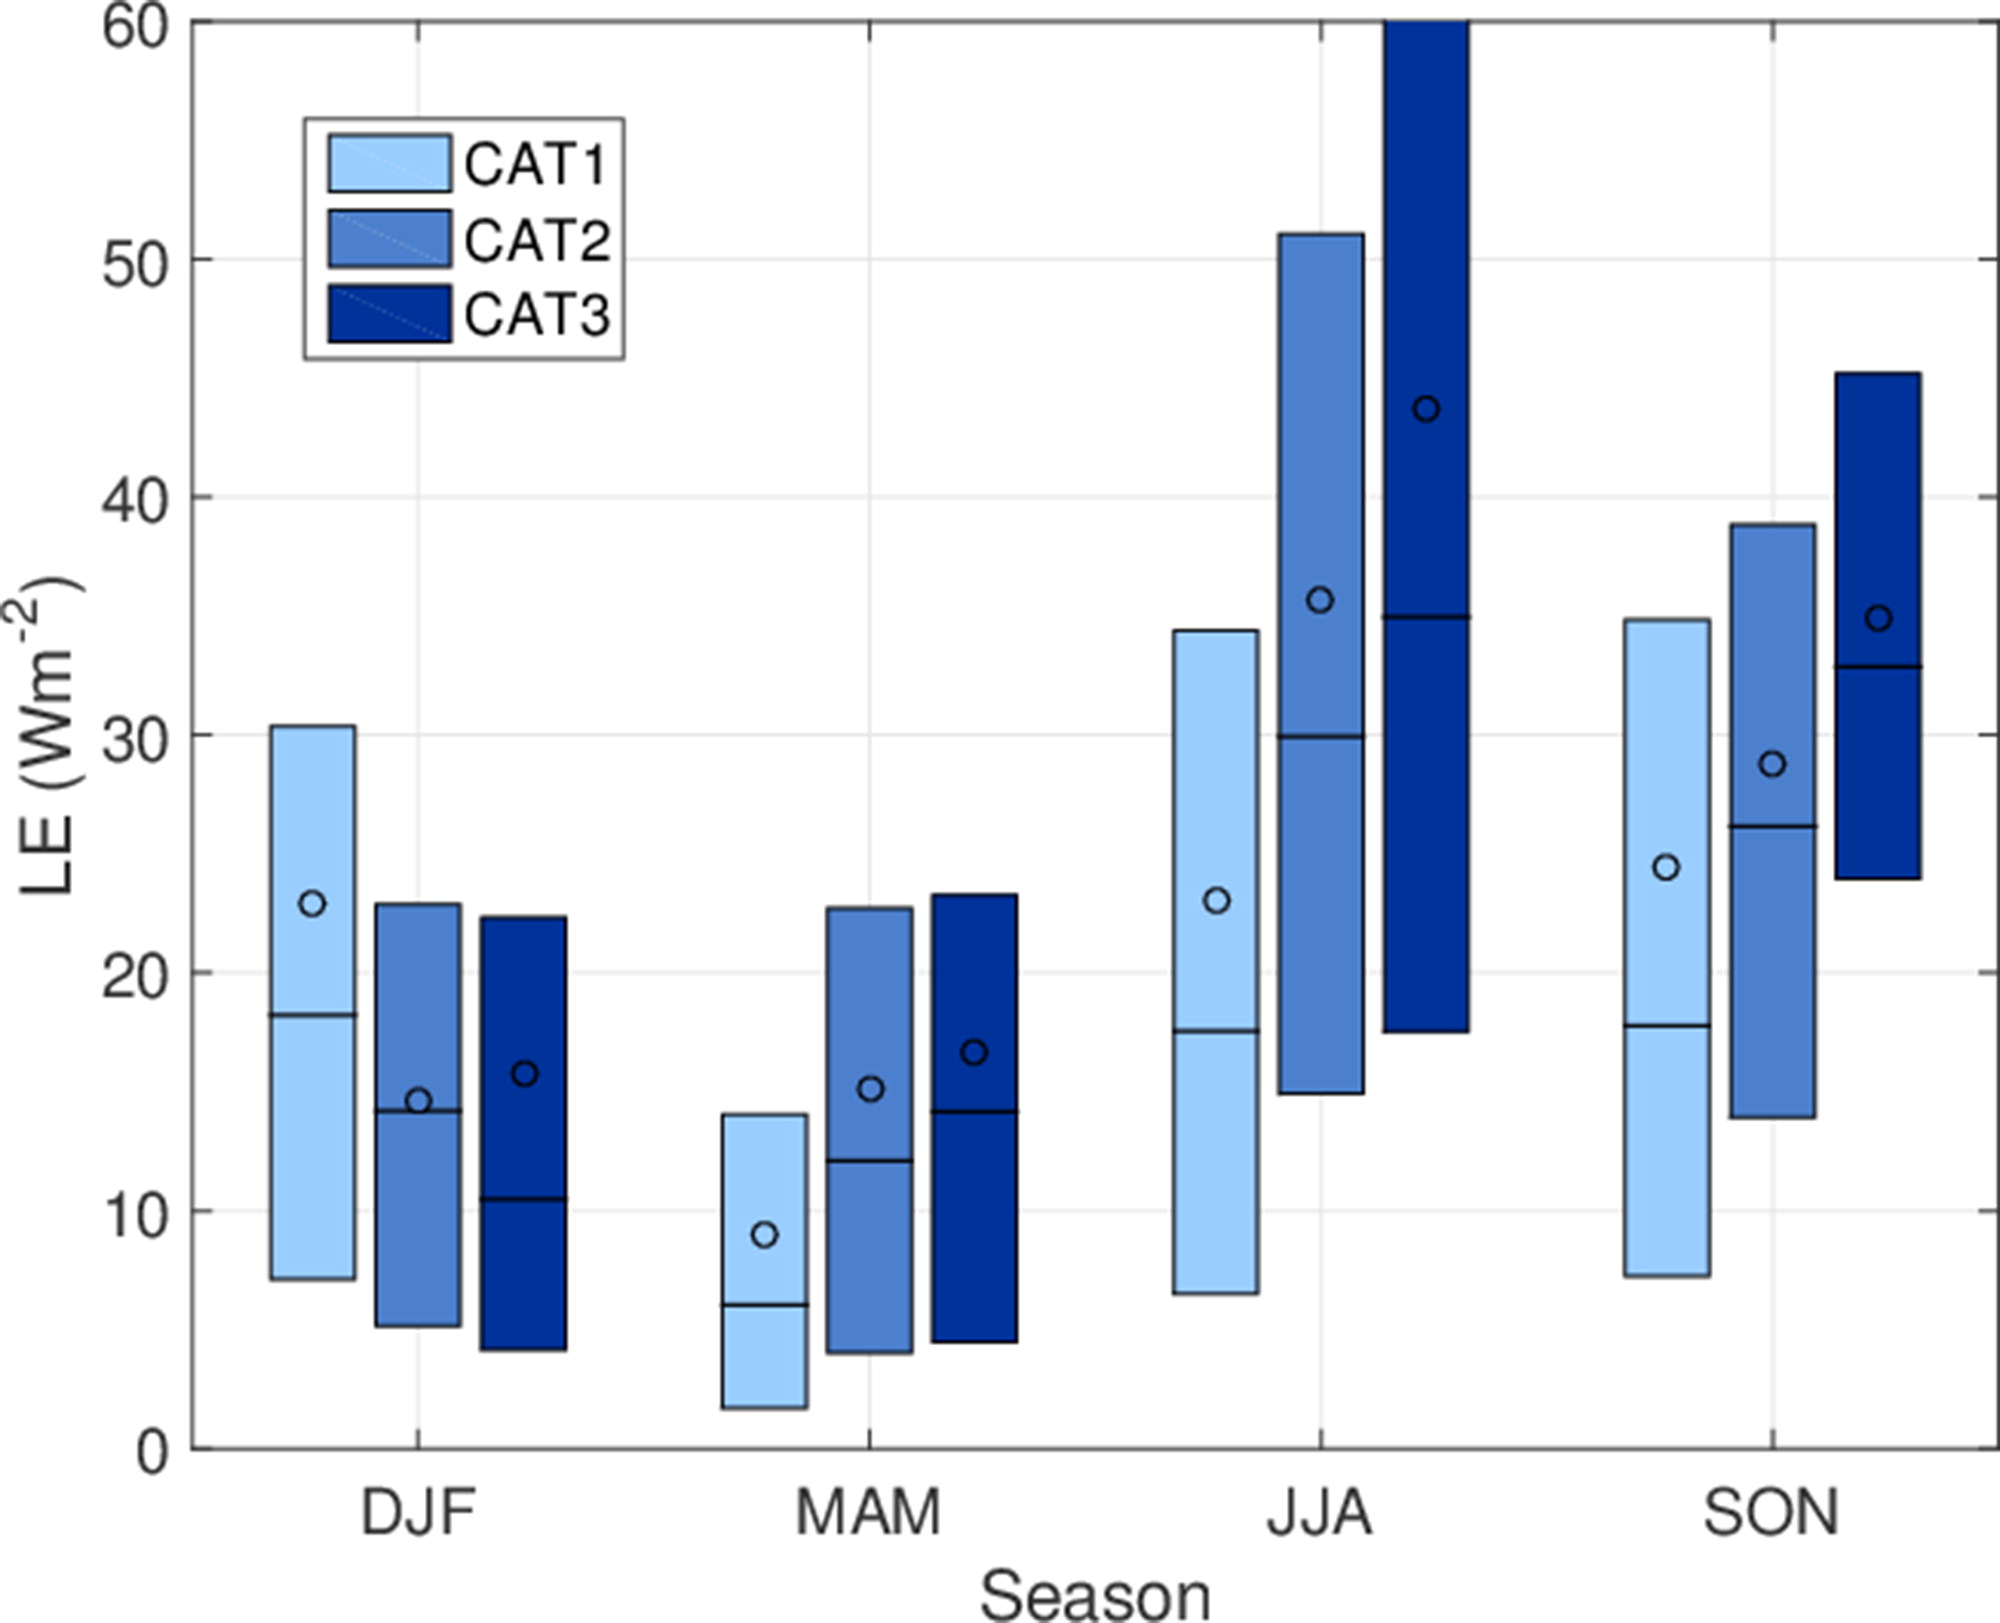
Fig. 11.
Seasonally averaged latent heat flux for the different category data. Boxes’ representation and number of data as in Figure 9.
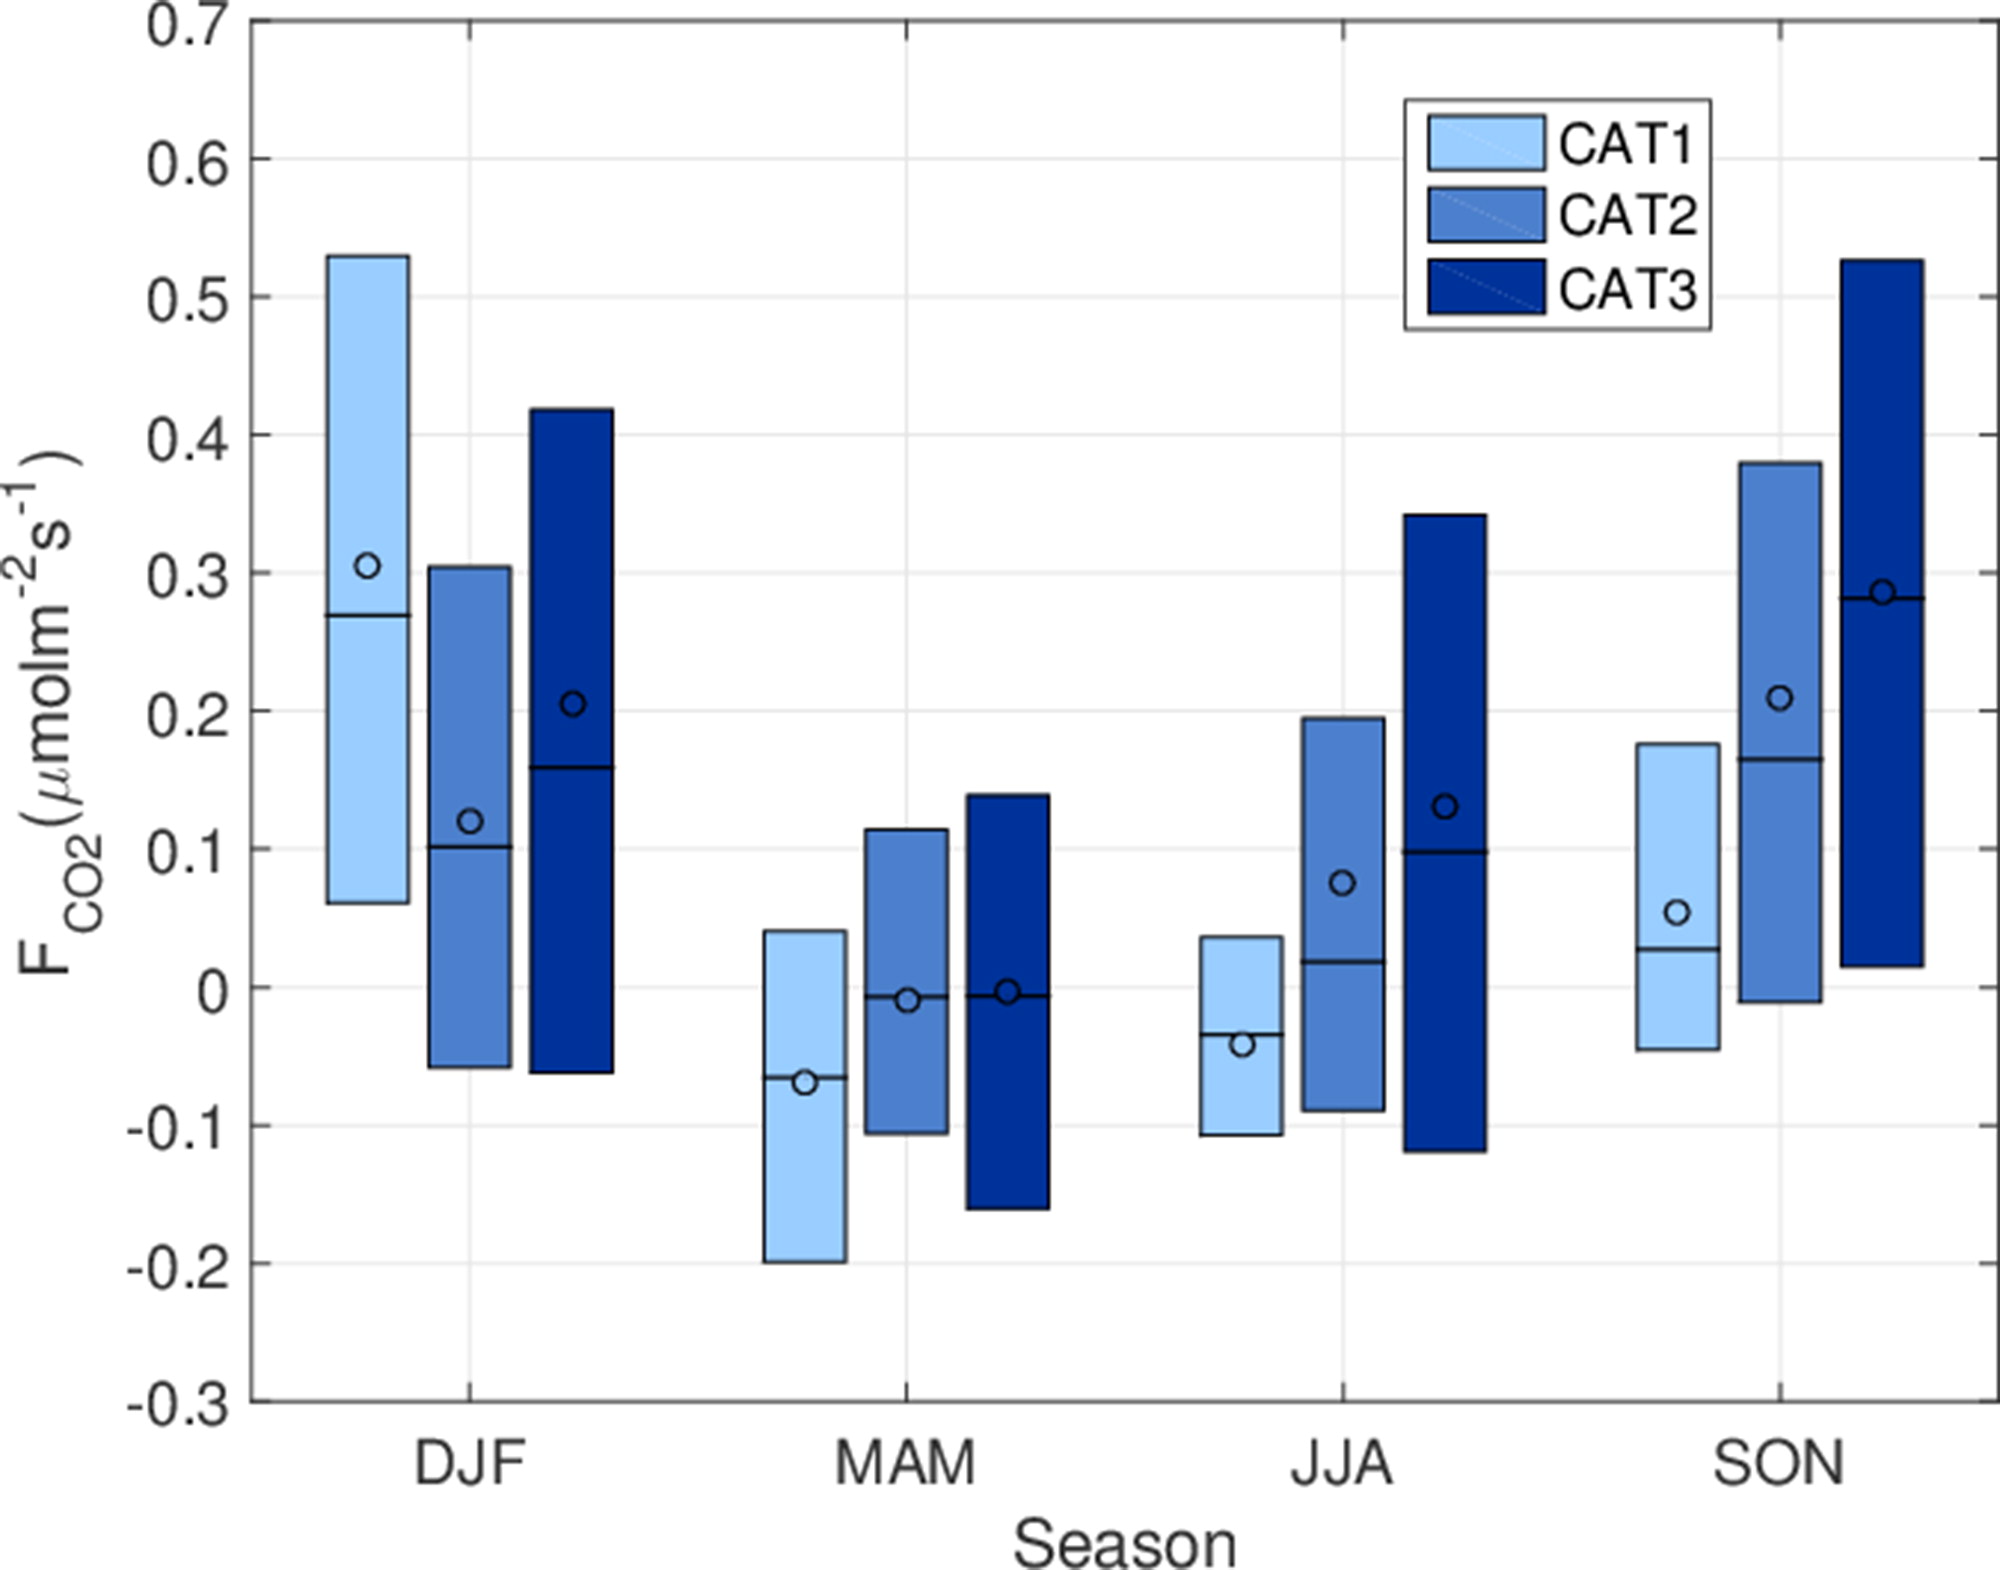
Fig. 12.
Seasonally averaged flux of carbon dioxide for the different category data. Note here the difference in wind direction ranges for physical and biogeochemical parameters for the different categories. Boxes’ representation as in Figure 9. Number of data for each of the box ranges from 100 to 600 for CAT1, 1300 to 2700 for CAT 2 and 130 to 355 in CAT3.
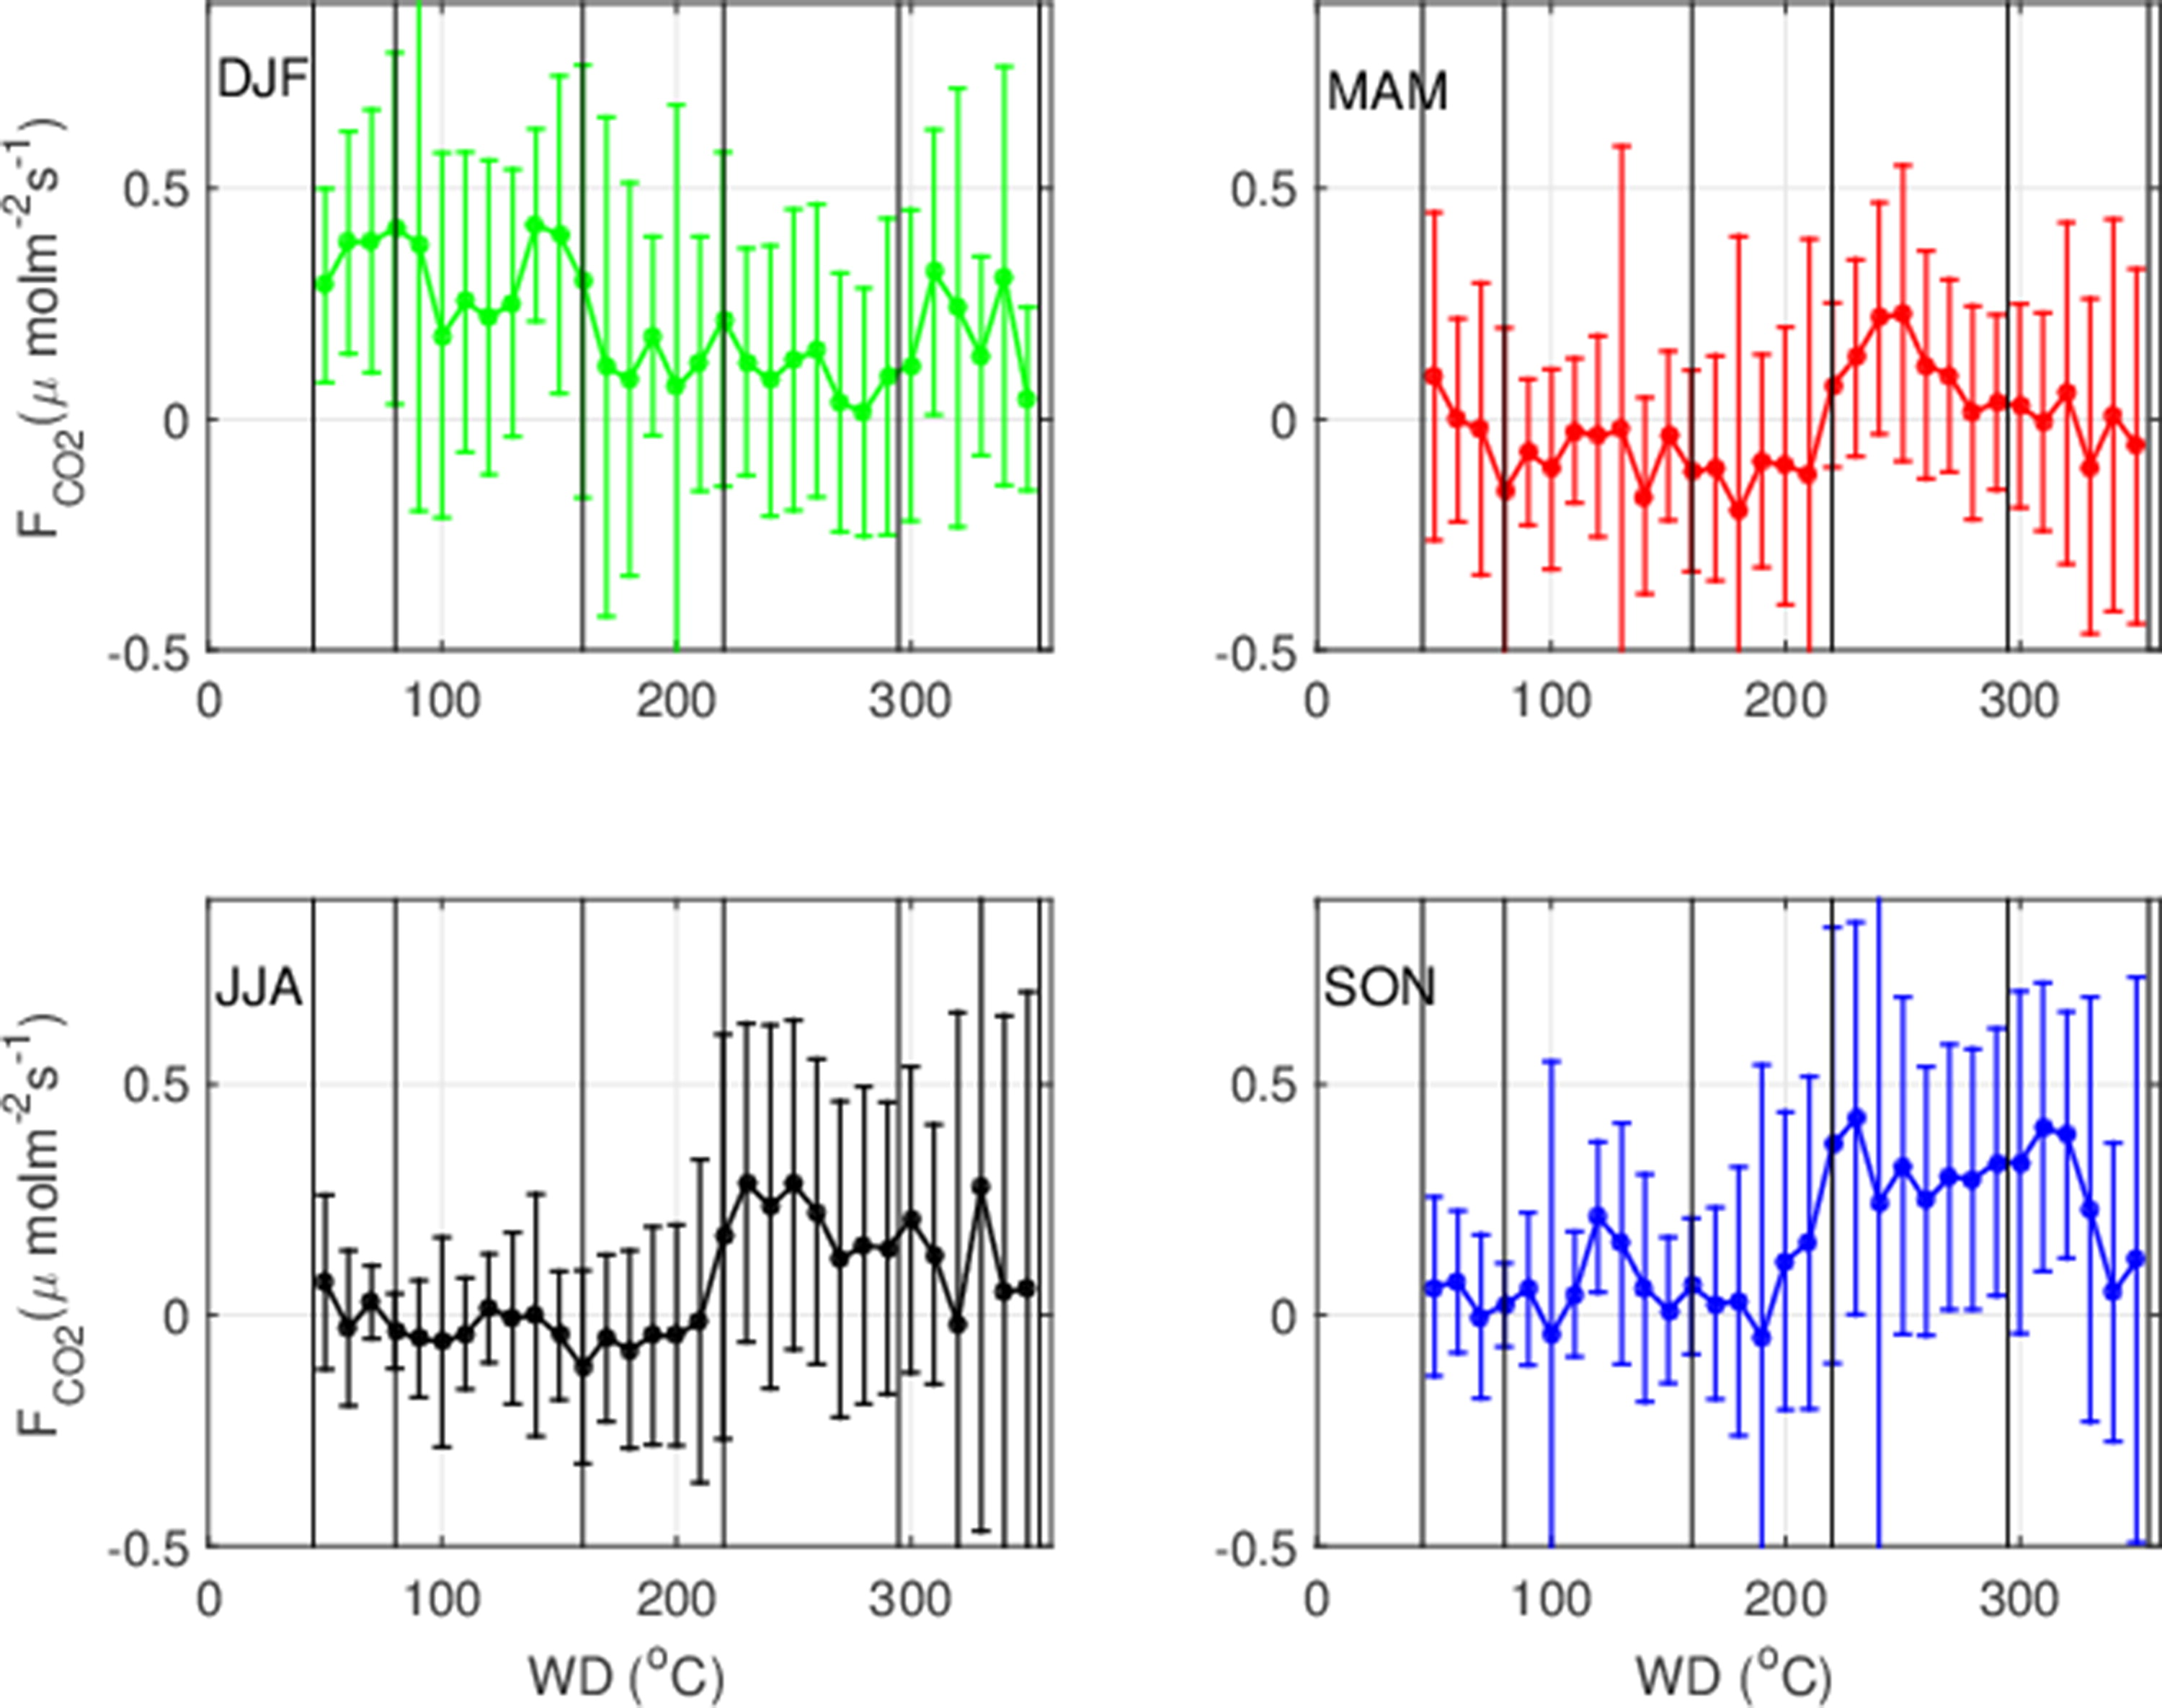
Fig. 13.
Flux of carbon dioxide (in μmolm−2s−1) averaged over wind direction intervals. Error bars represent one standard deviation of the data in the respective interval. Vertical black lines indicate limitation for wind direction intervals following Table 1.
Table 3.
Aerosol fluxes for wind speeds above 4 m/s.