
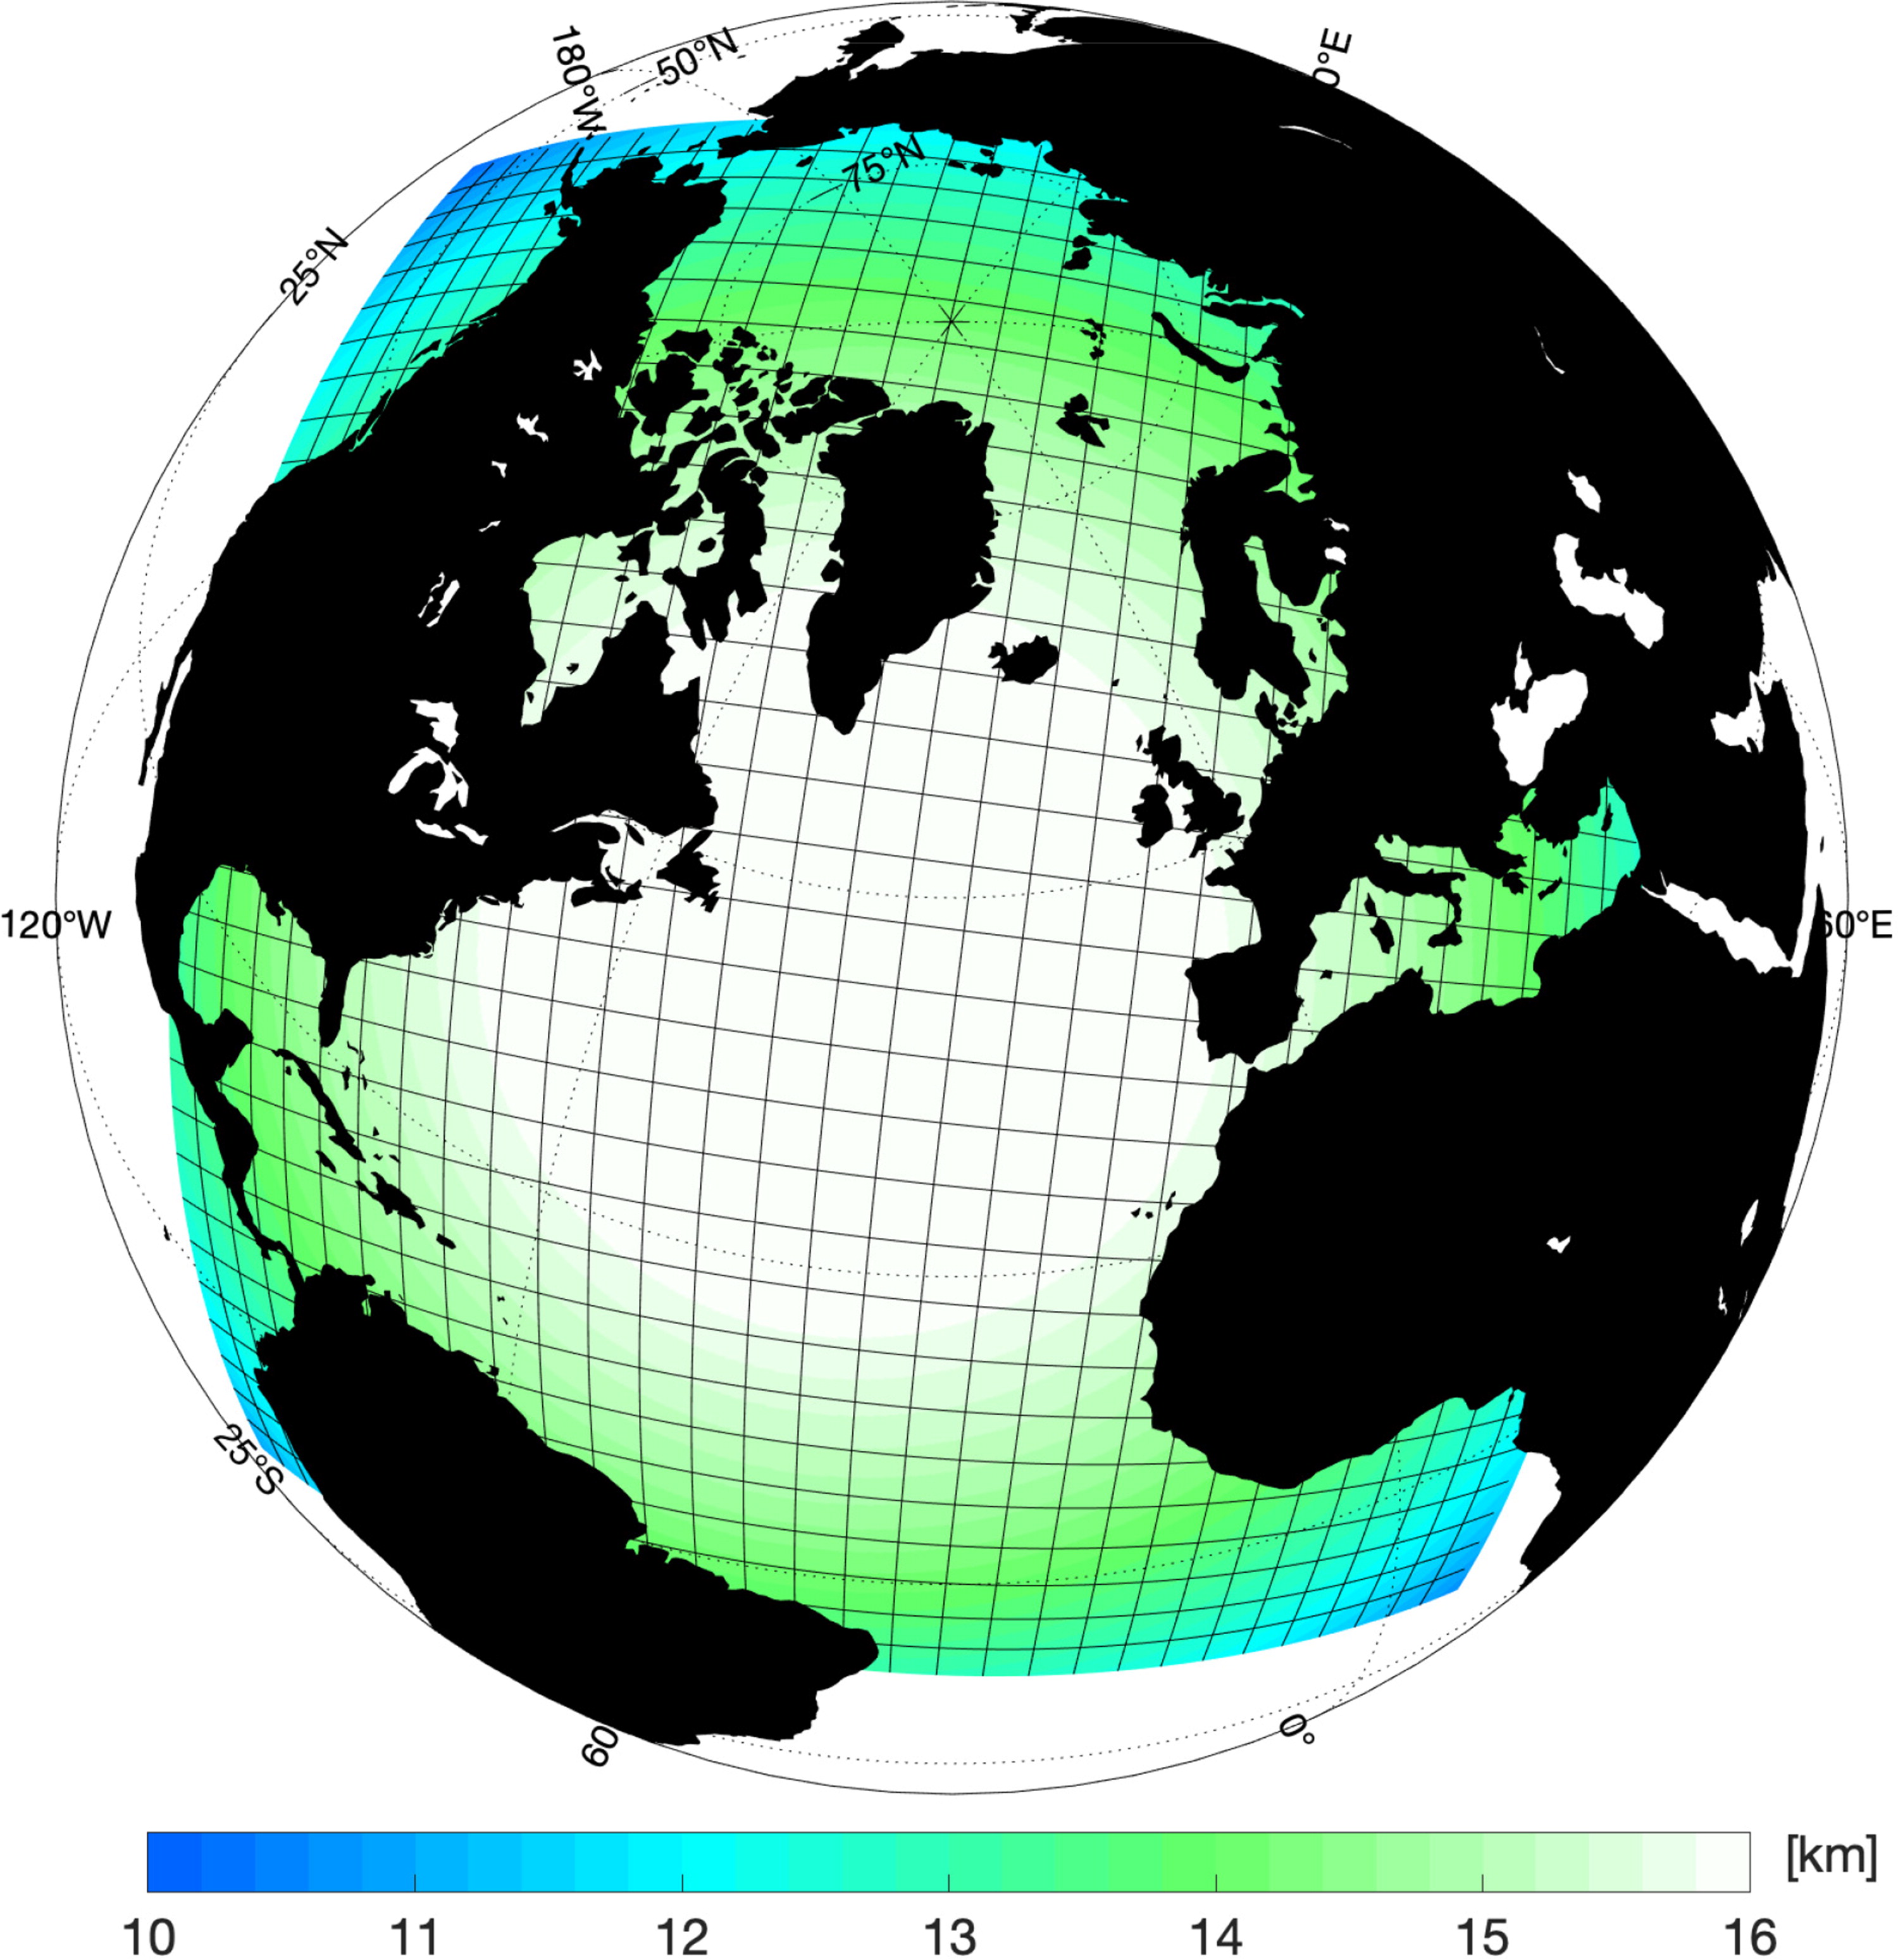
Fig. 1.
The TOPAZ4 model domain. Background color shading shows the horizontal grid resolution (km) while solid black color represents land.
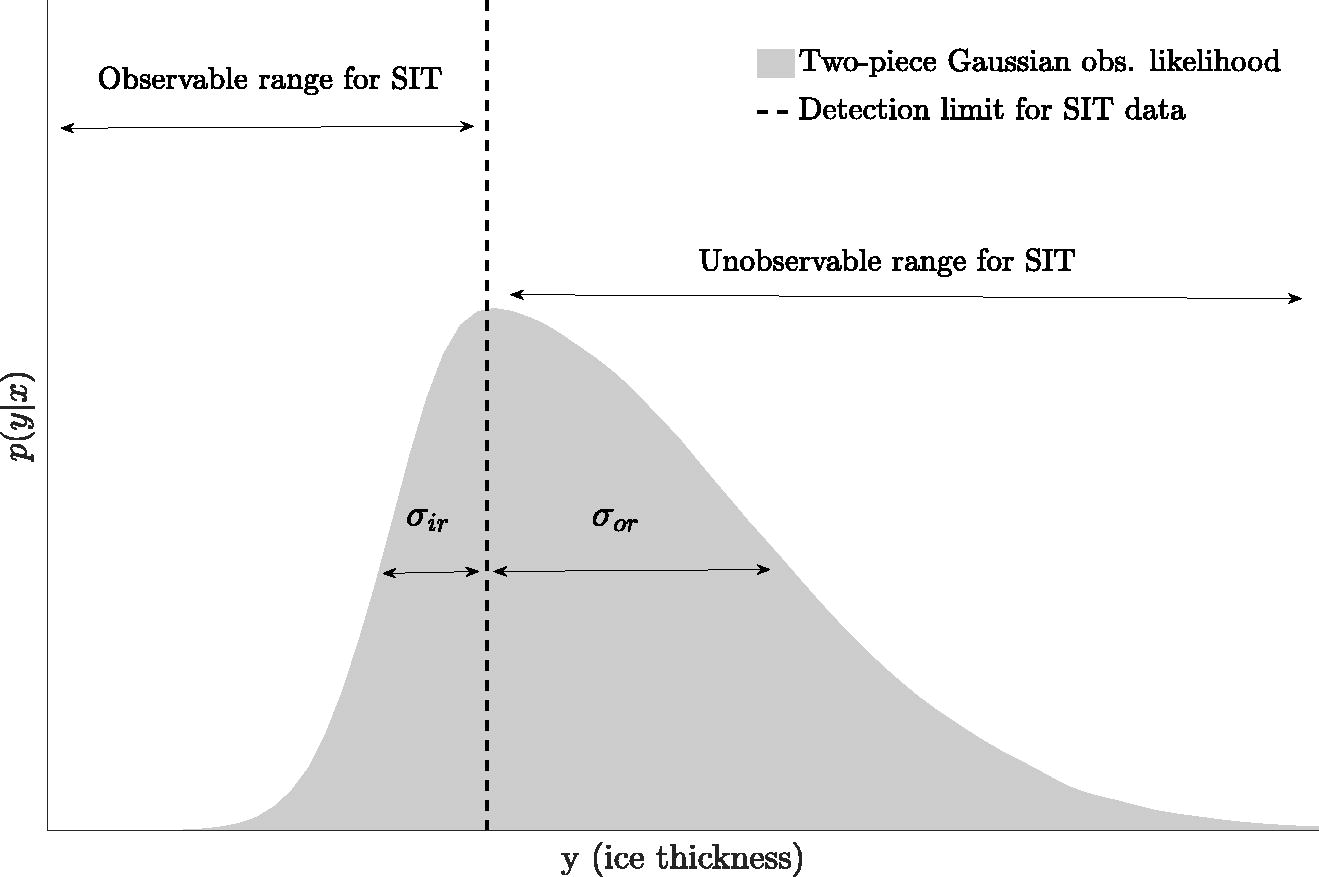
Fig. 2.
Illustration of the two-piece Gaussian OR-observation likelihood for SMOS-like thin SIT. σir is an in-range and σor is the out-of-range observation error standard deviations, respectively.
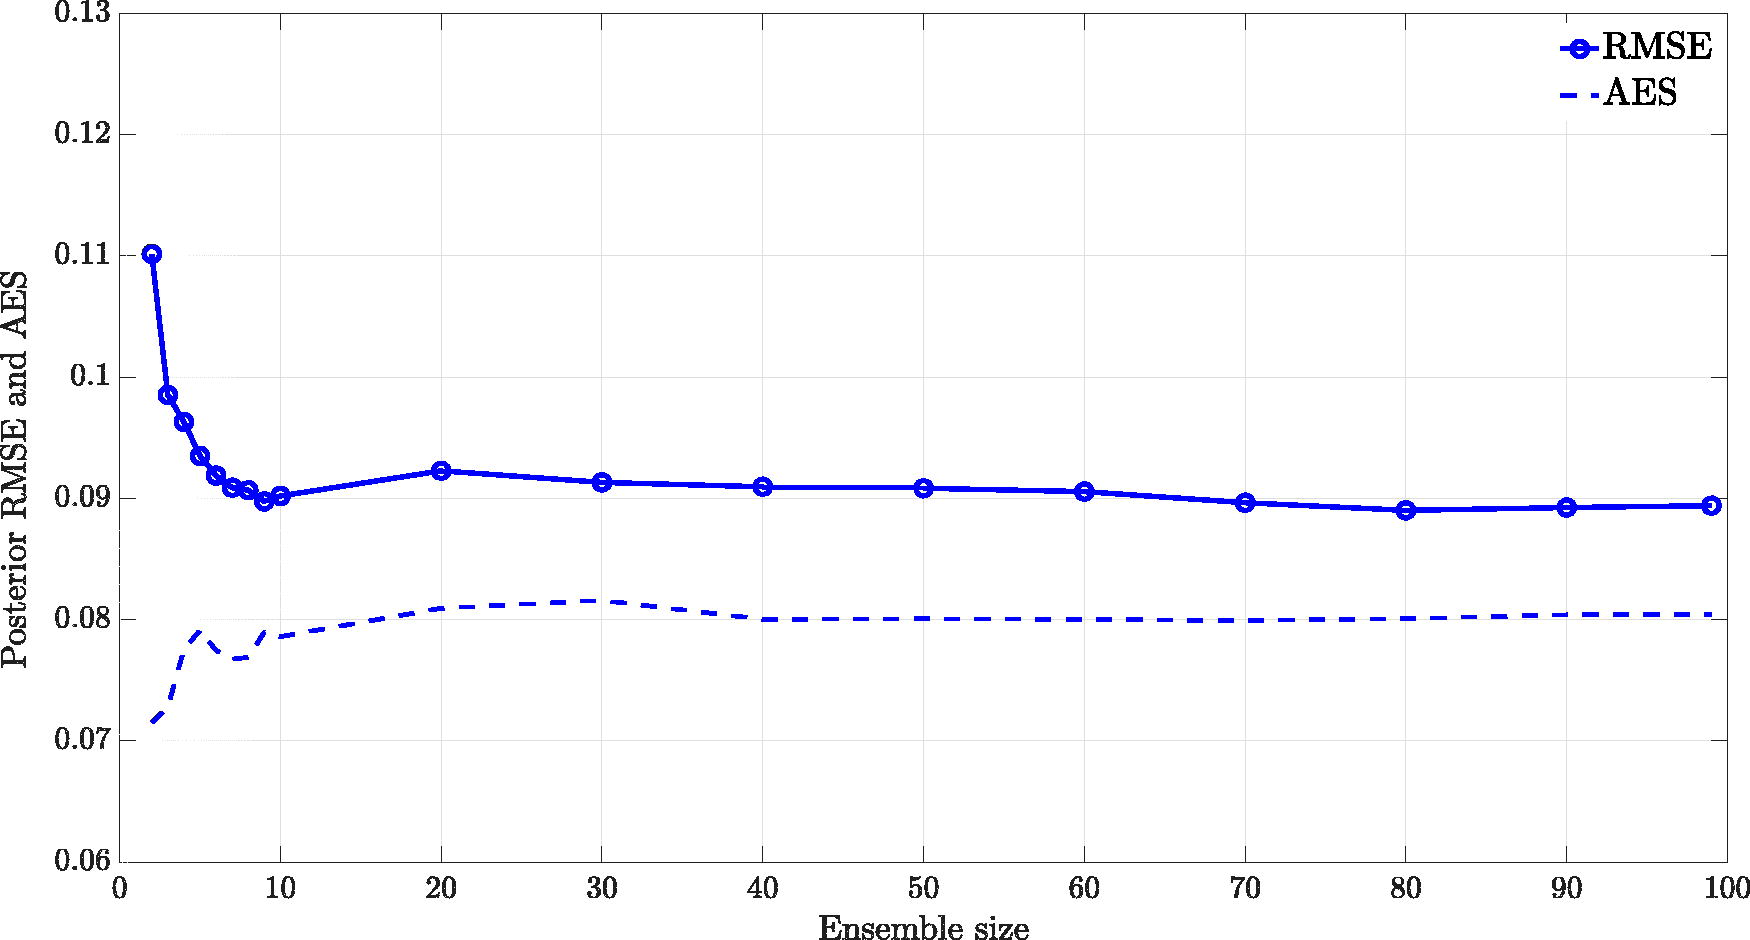
Fig. 3.
Time-averaged posterior RMSE and AES resulting from single cycle assimilation runs for different ensemble sizes using EnKF-SQ.
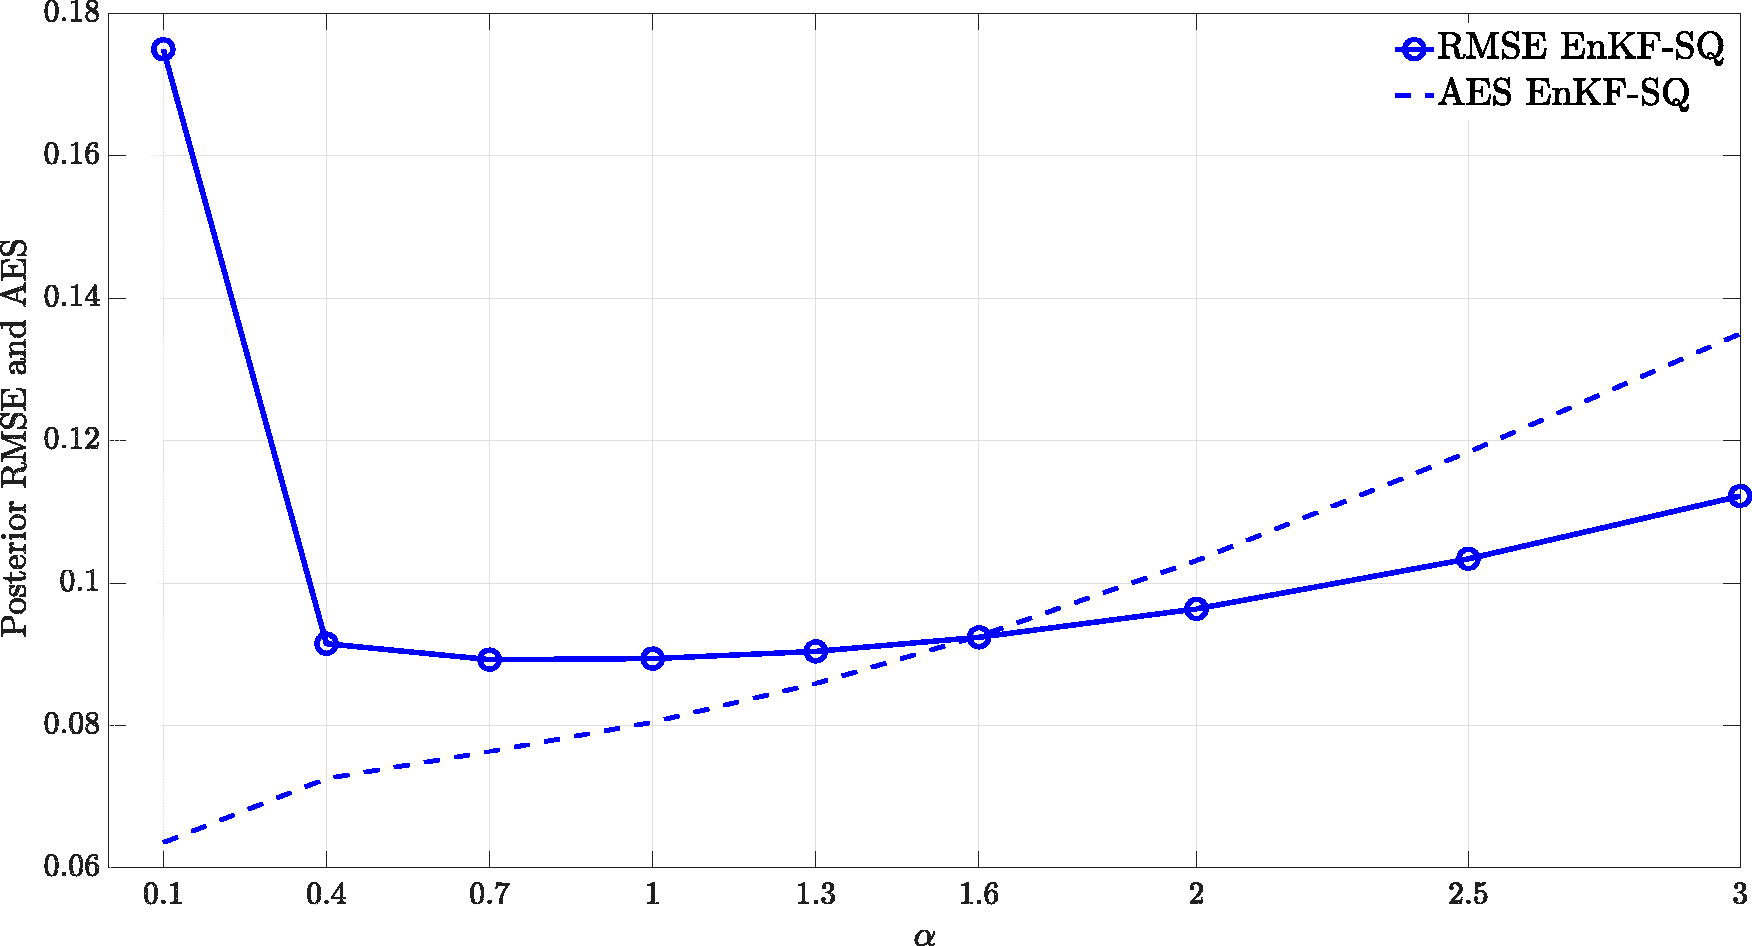
Fig. 4.
Time-averaged posterior RMSE and AES resulting from single cycle assimilation runs for a wide range of the multiplicative factor α.
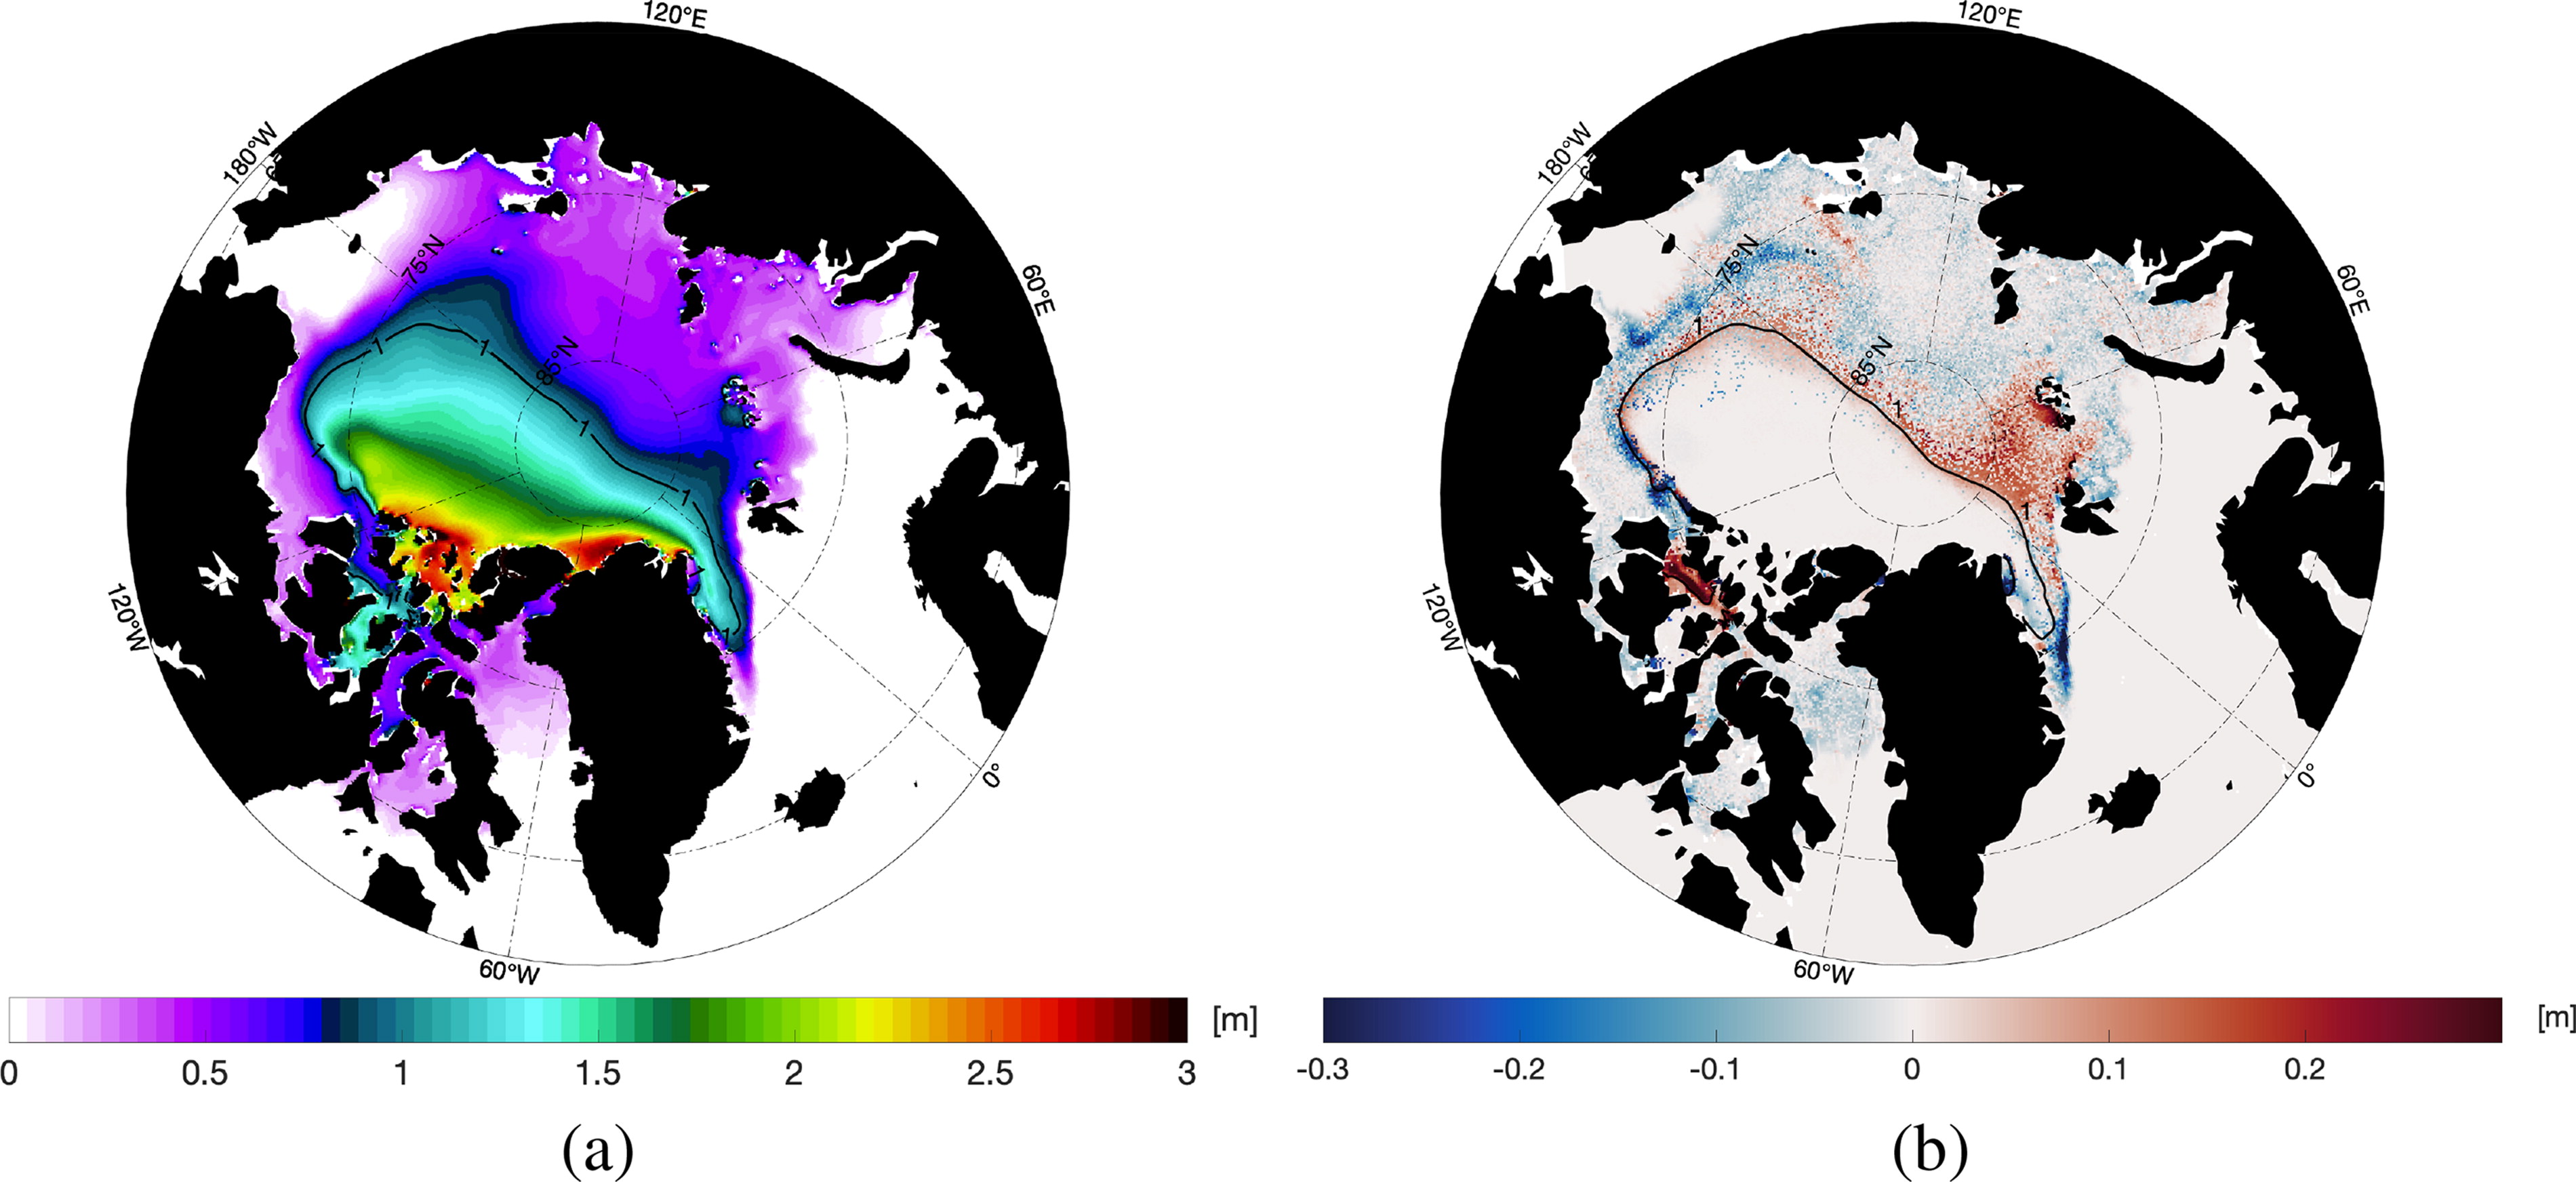
Fig. 5.
(a) Prior ensemble mean of the ice thickness on 11 November 2014. The solid black line is the 1 m SIT isoline. (b) The increment (analysis-forecast) for SIT after incorporating the observations.
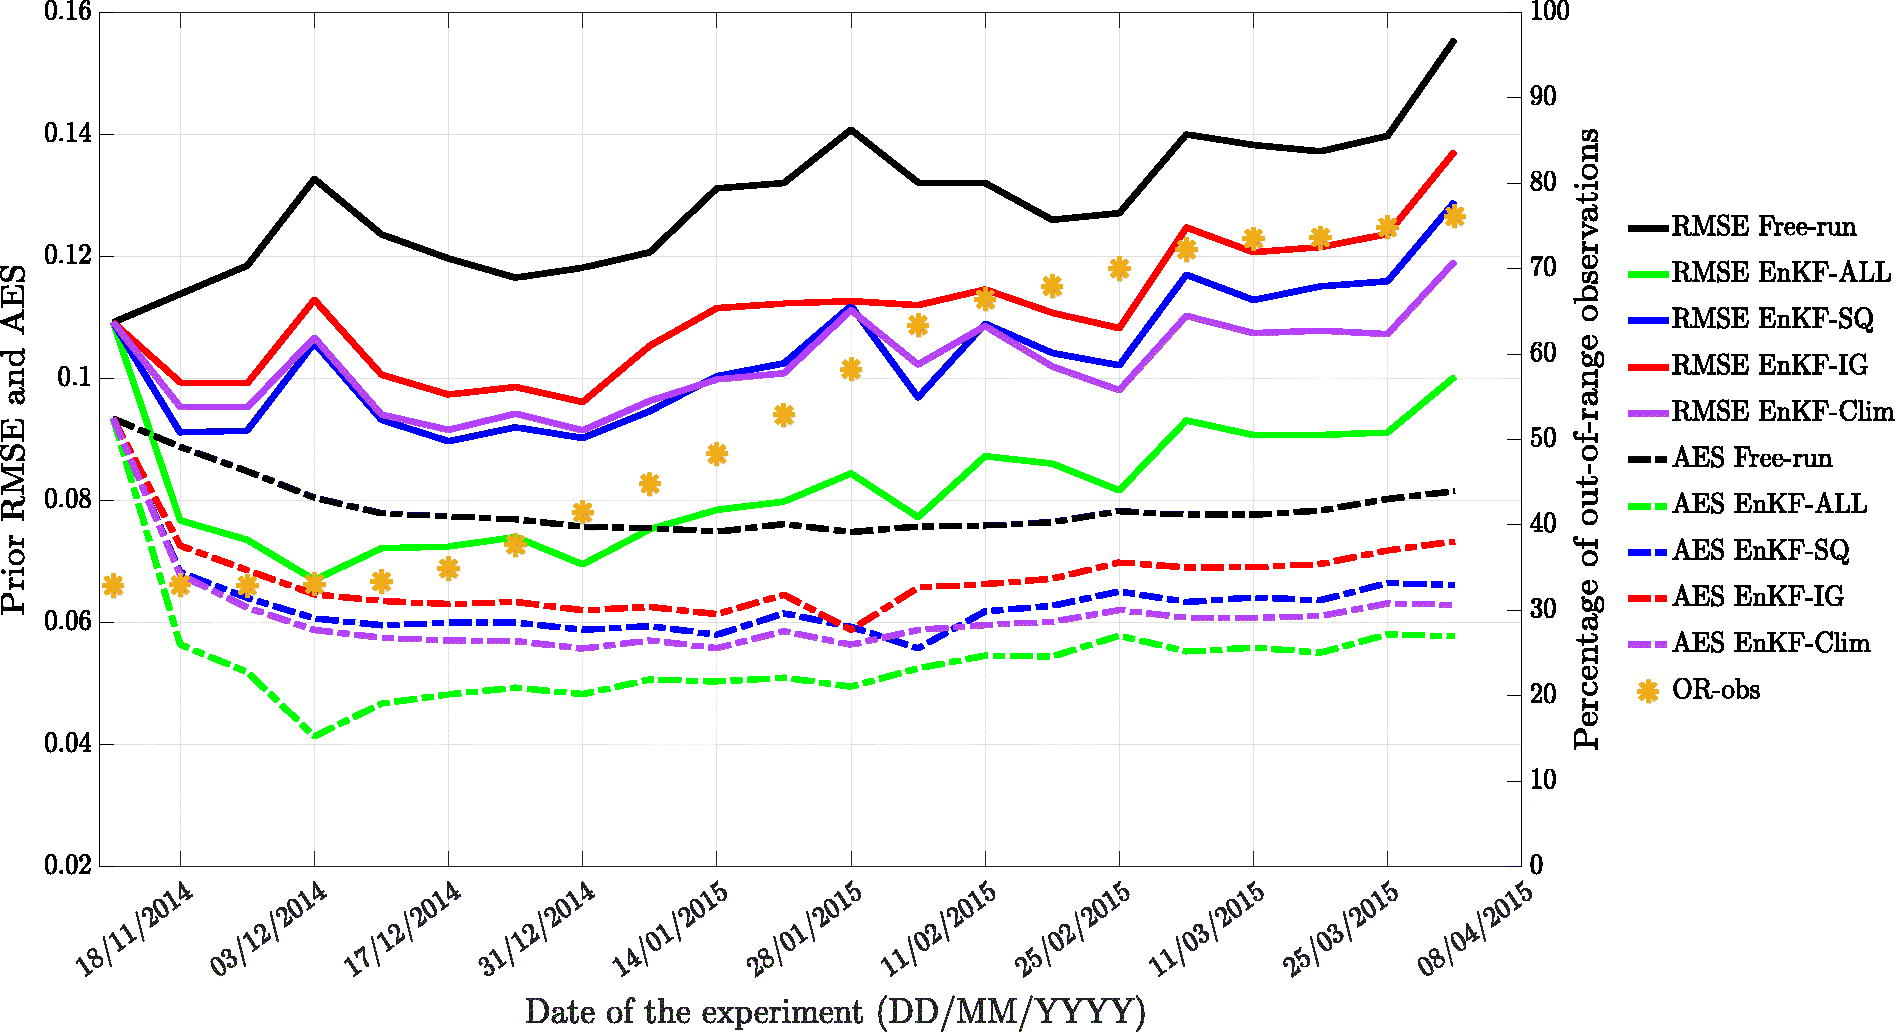
Fig. 6.
Left y-axis: Time evolution of the prior RMSE (solid lines) and AES (dashed lines) for SIT estimates. Right y-axis: The orange asterisks represent the percentage of the out-of-range observations during assimilation resulting from the EnKF-SQ, EnKF-CLIM and EnKF-IG.
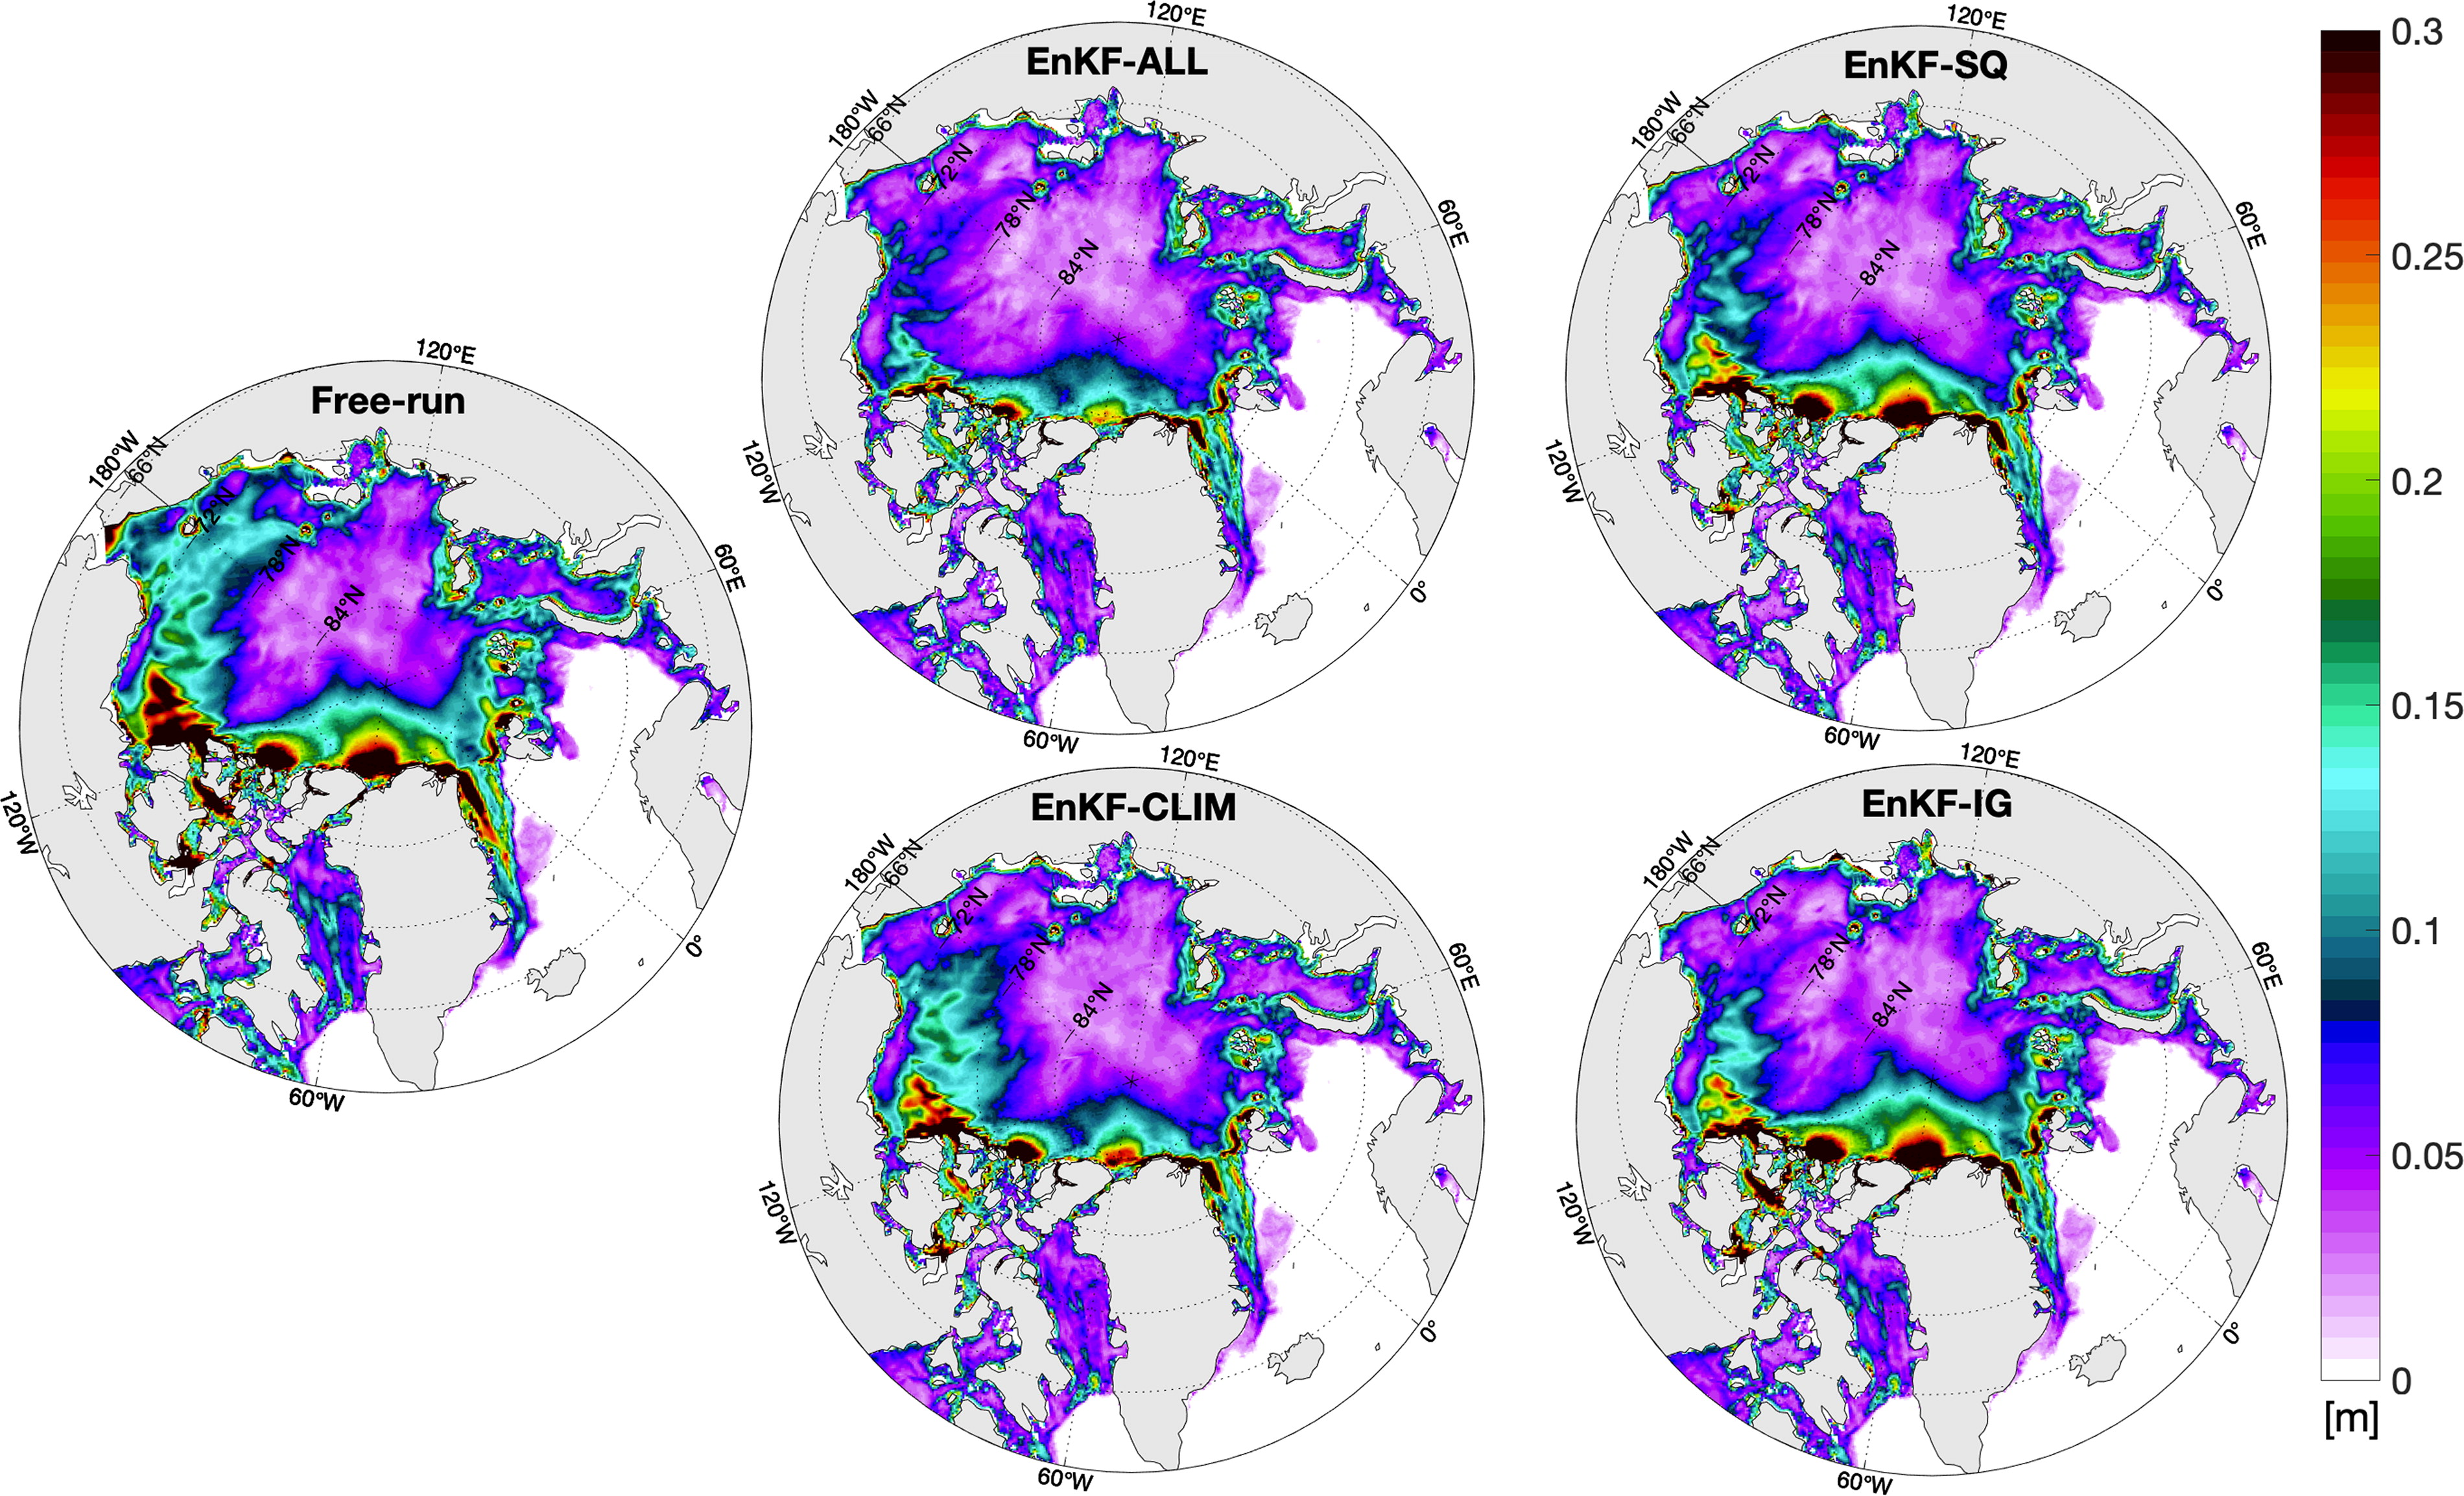
Fig. 7.
Maps of time-averaged prior RMSE for SIT obtained using: EnKF-ALL (top left), EnKF-SQ (top right), Free-run (center left), EnKF-CLIM (bottom left) and EnKF-IG (bottom right). Averaging is done over the period of experiment, i.e. from November 2014 to March 2015.
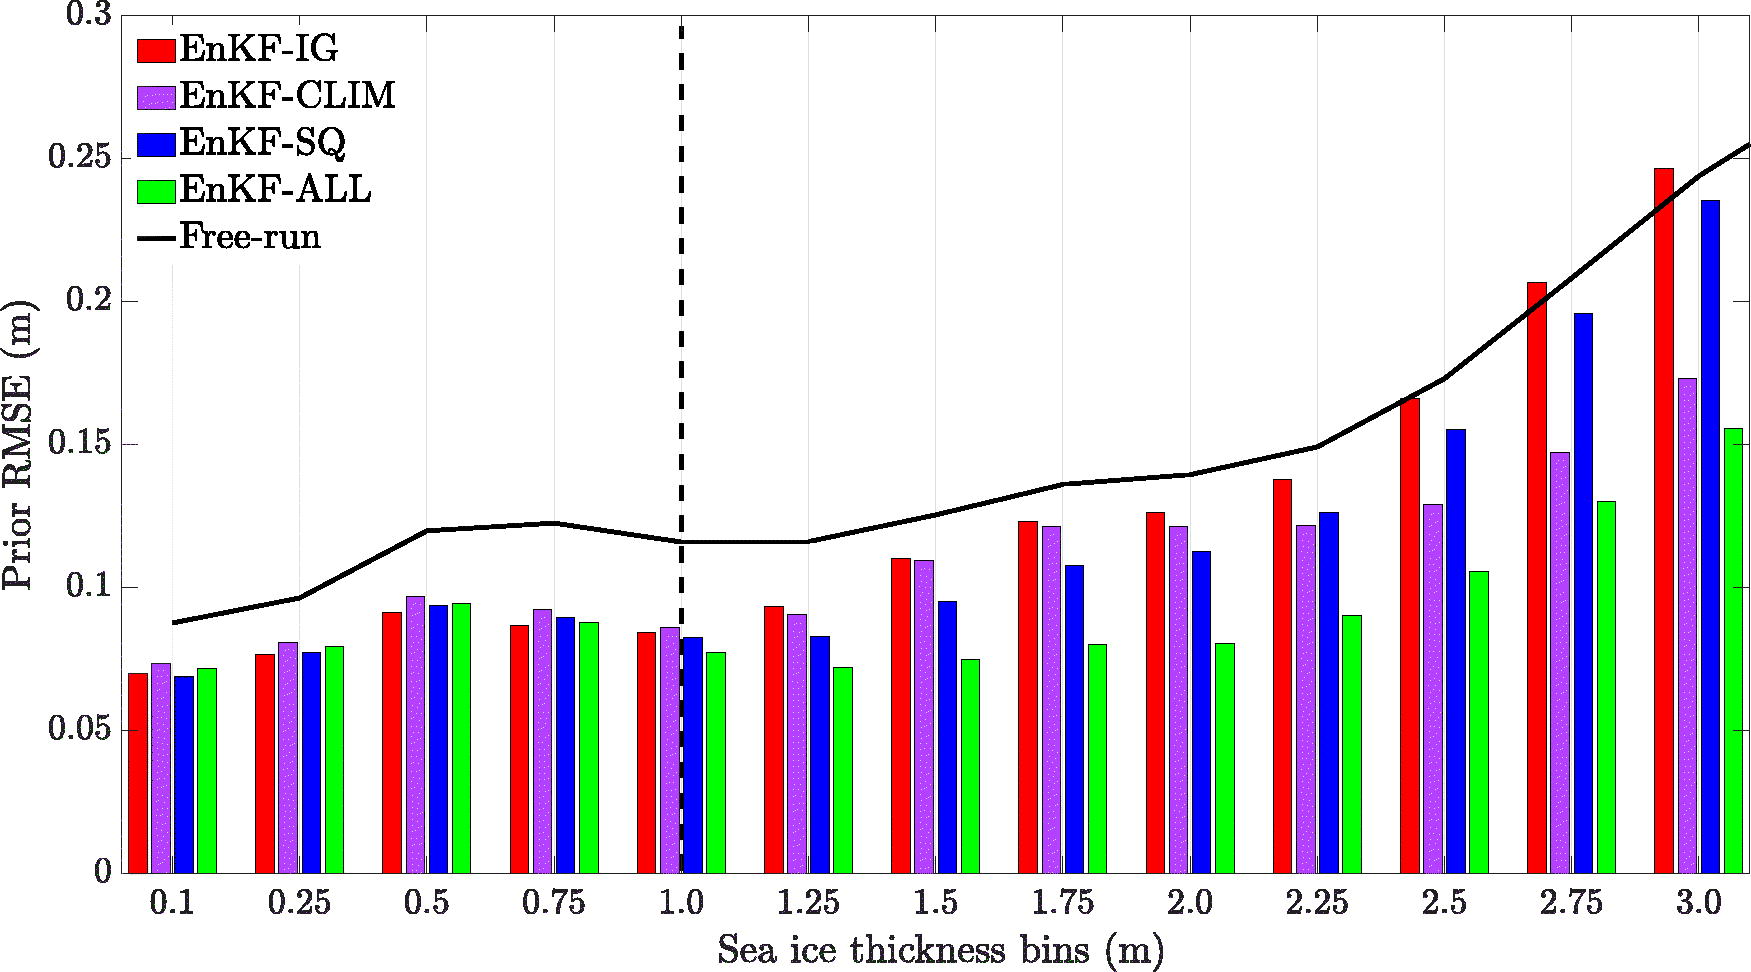
Fig. 8.
Bar chart of time-averaged conditional prior RMSEs for SIT obtained using all tested DA schemes. Solid black line represents time averaged Free-run RMSE. Black dashed line depicts the 1 m detection limit. The x-axis denotes the SIT bins with bin size of 25 cm. The values on x-axis are the upper bounds of the SIT for that particular bin.
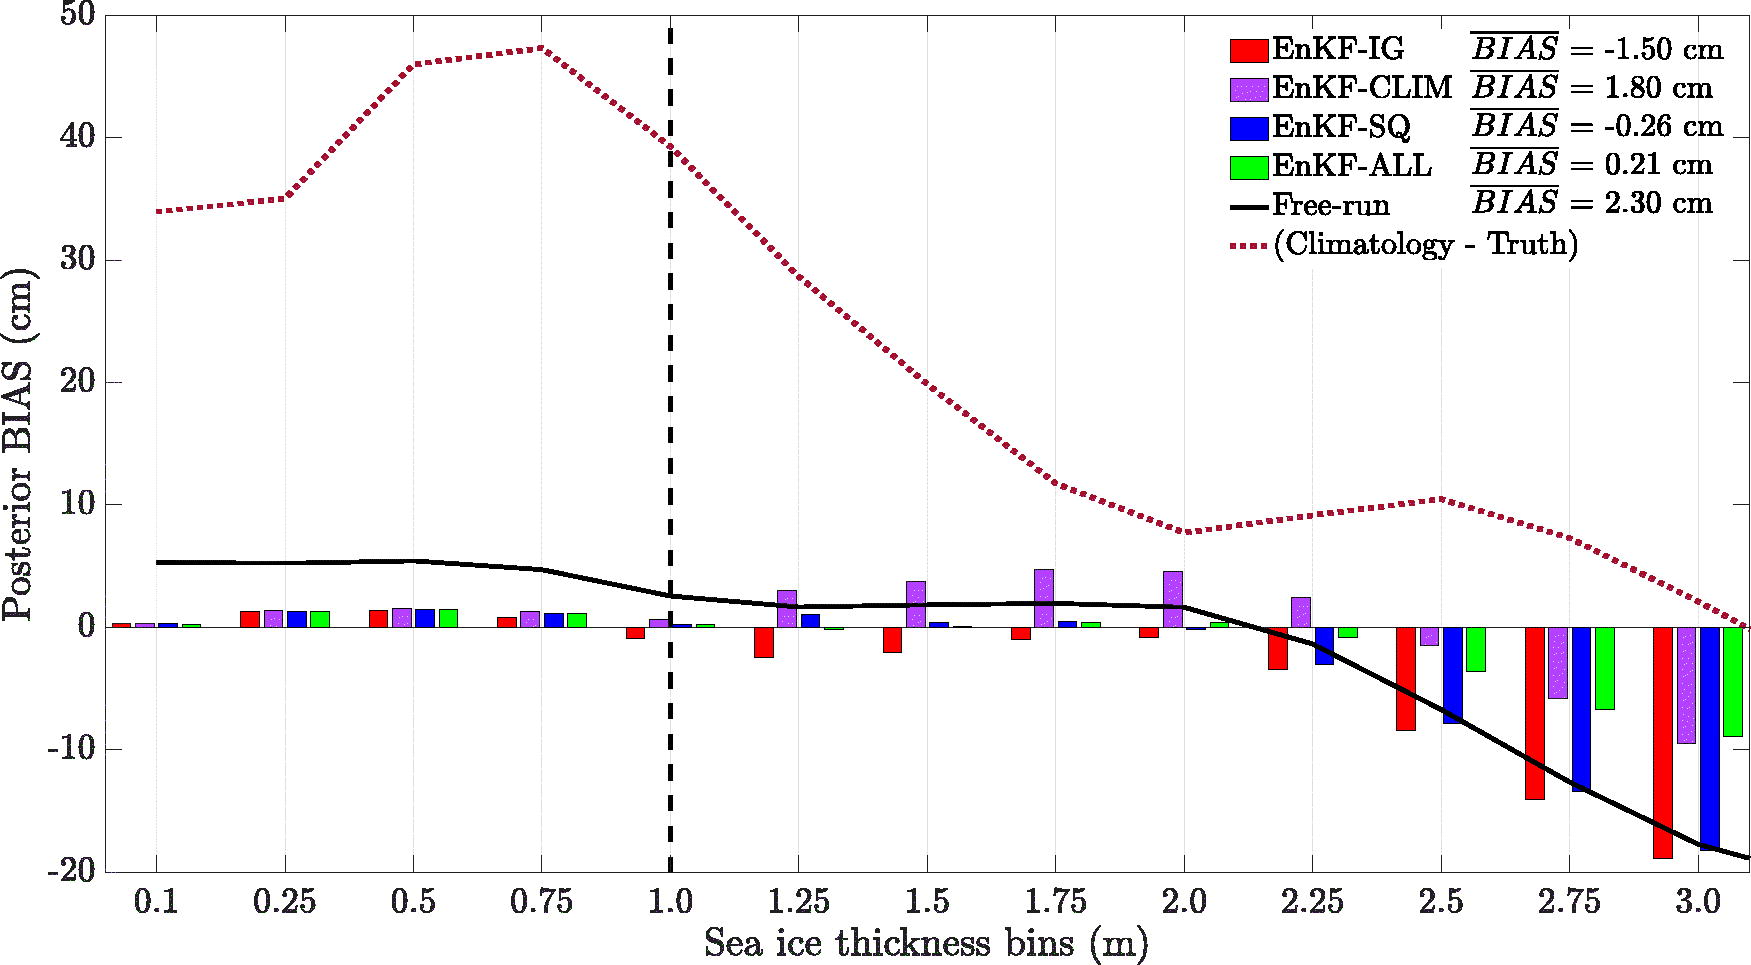
Fig. 9.
Bar chart of time-averaged posterior bias for SIT obtained from all tested DA schemes. Solid black line represents the time-averaged bias for SIT obtained using the Free-run. Red dotted line represents the time-averaged difference of climatology and truth. SIT bins are displayed on the x-axis with a bin size of 25 cm. Reported in the legend are the time-averaged-weighted total mean bias including the bins for ice thicker than 3 m, which is not shown here. The weights are computed as a fraction of the number of grid cells falling in specific bin interval over total number of grid cells.
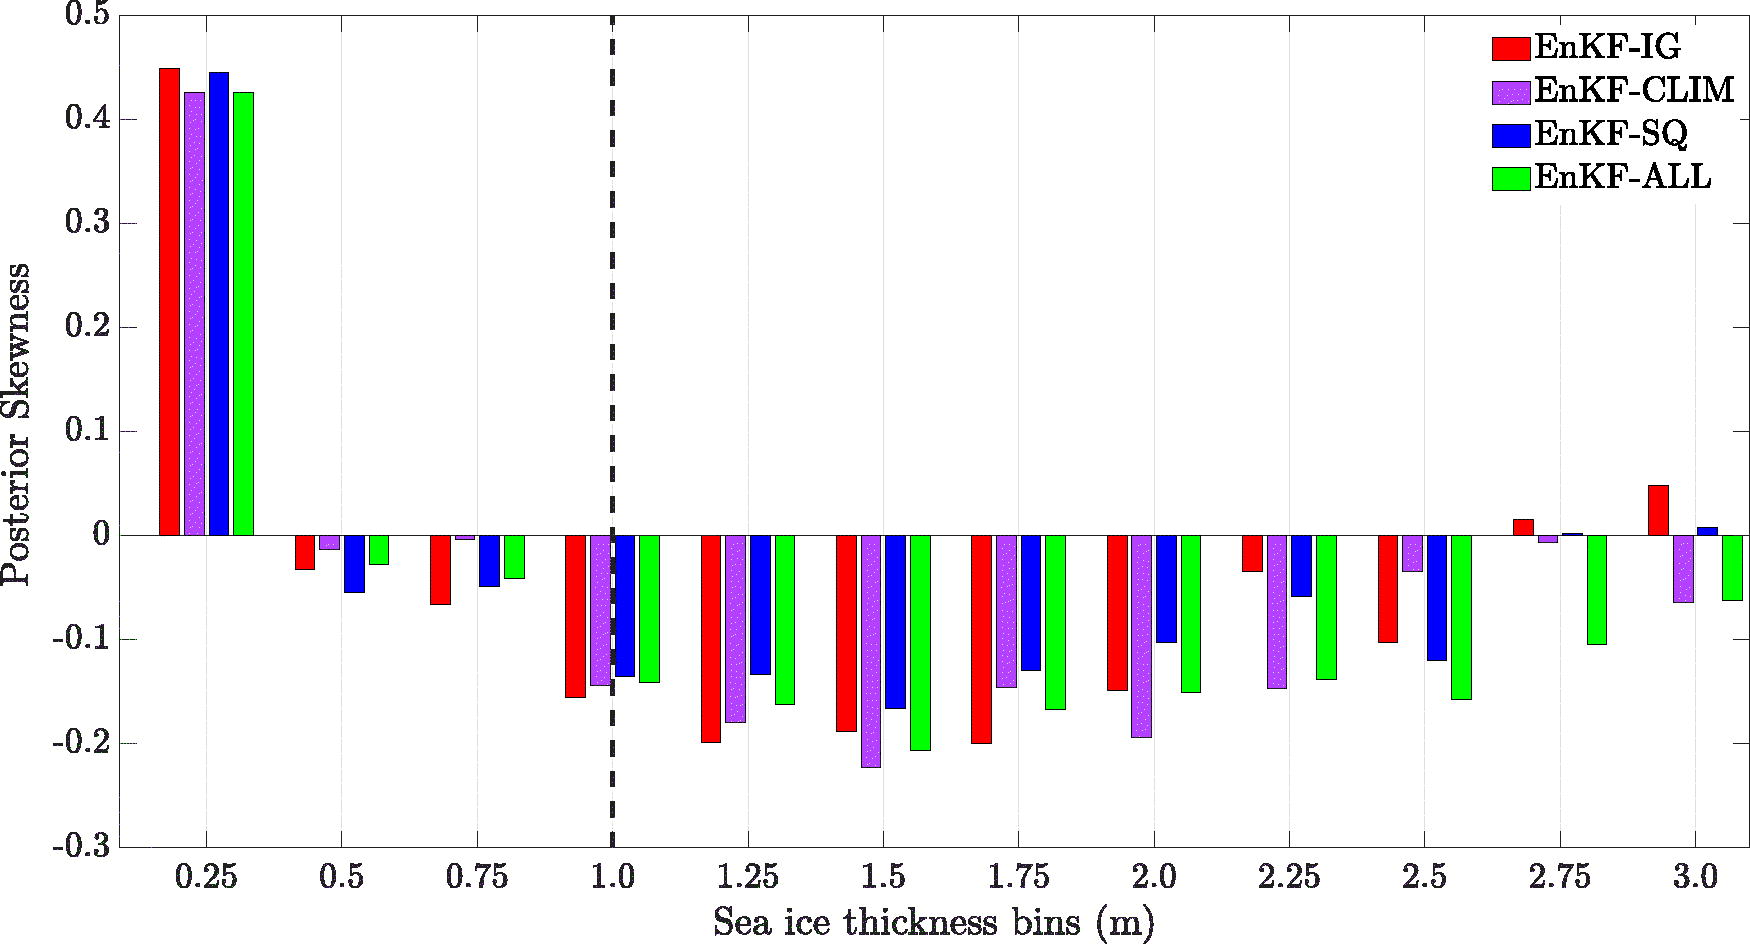
Fig. 10.
Bar chart of the conditional posterior skewness for SIT estimates obtained using all tested DA schemes and computed at the final assimilation time. Dashed black line represents the detection limit of 1 m SIT.
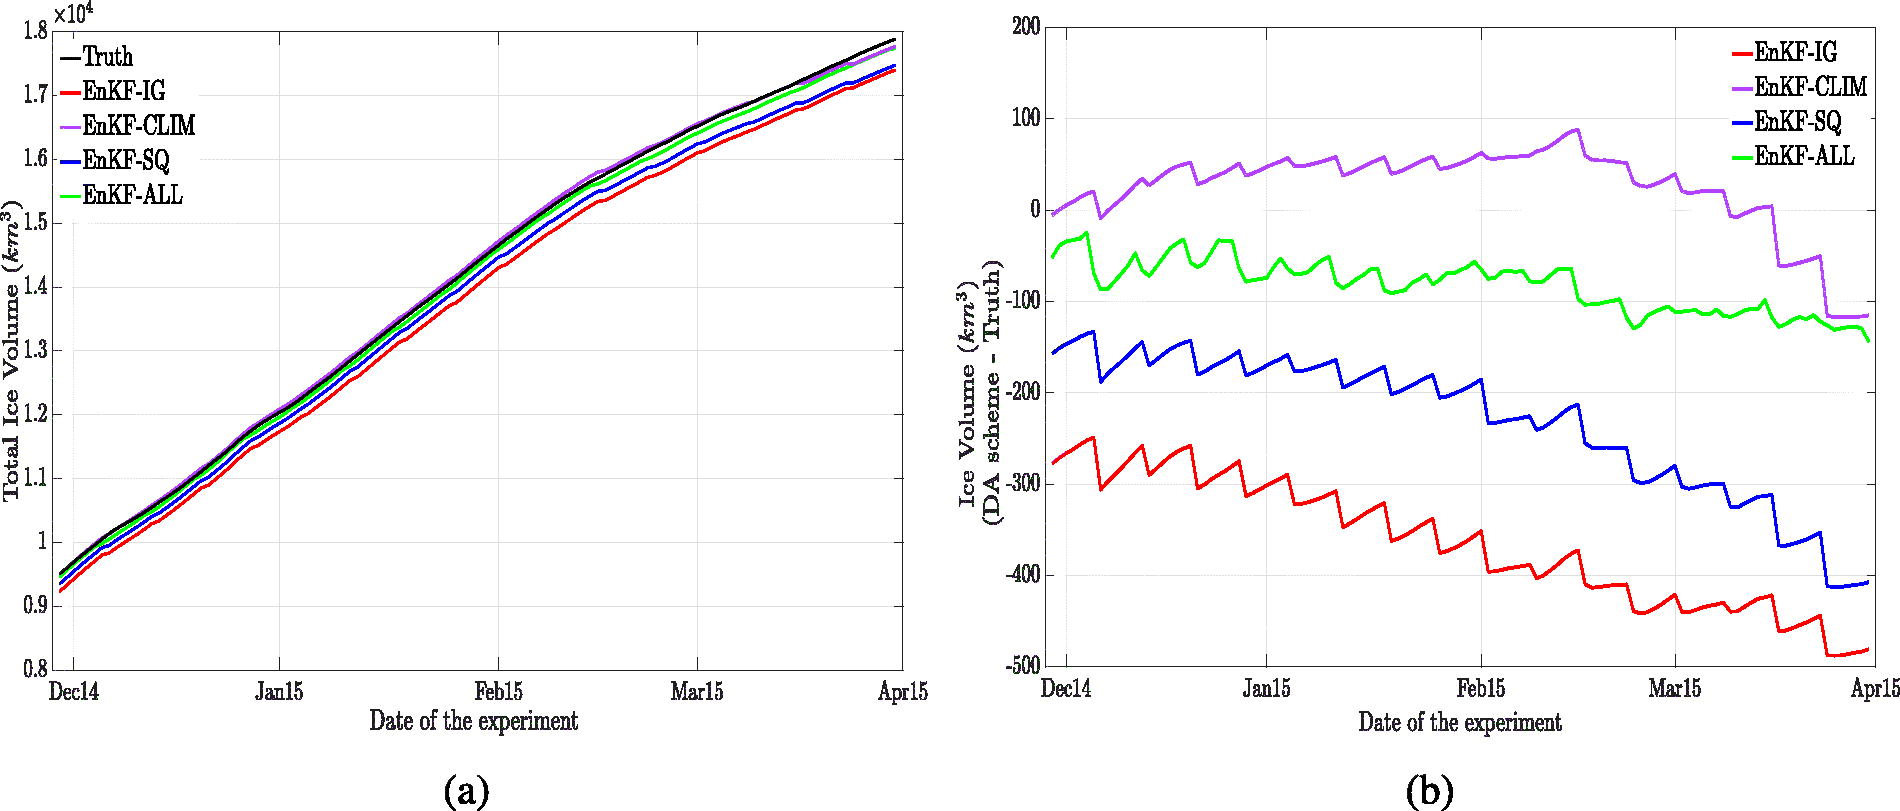
Fig. 11.
(a) Daily ensemble average of sea ice volume over the TOPAZ4 model area for the entire experiment time. (b) Difference of sea ice volume from the truth and all tested DA schemes.