Have a personal or library account? Click to login
Improving the condition number of estimated covariance matrices Cover

Improving the condition number of estimated covariance matrices

Open Access
|Jan 2020

Figures & Tables

Table 1

Change in standard deviation for the SOAR covariance matrix for both methods of reconditioning.
κmaxσσRRα corr. RRσMEα corr. ME10002.236062.264711.0132.254391.0085002.236062.293401.0262.275991.0181002.236062.513061.1242.457371.099

[i] Columns 4 and 6 show α, the multiplicative inflation factor corresponding to the values for σRR and σME, respectively.

Fig. 1.

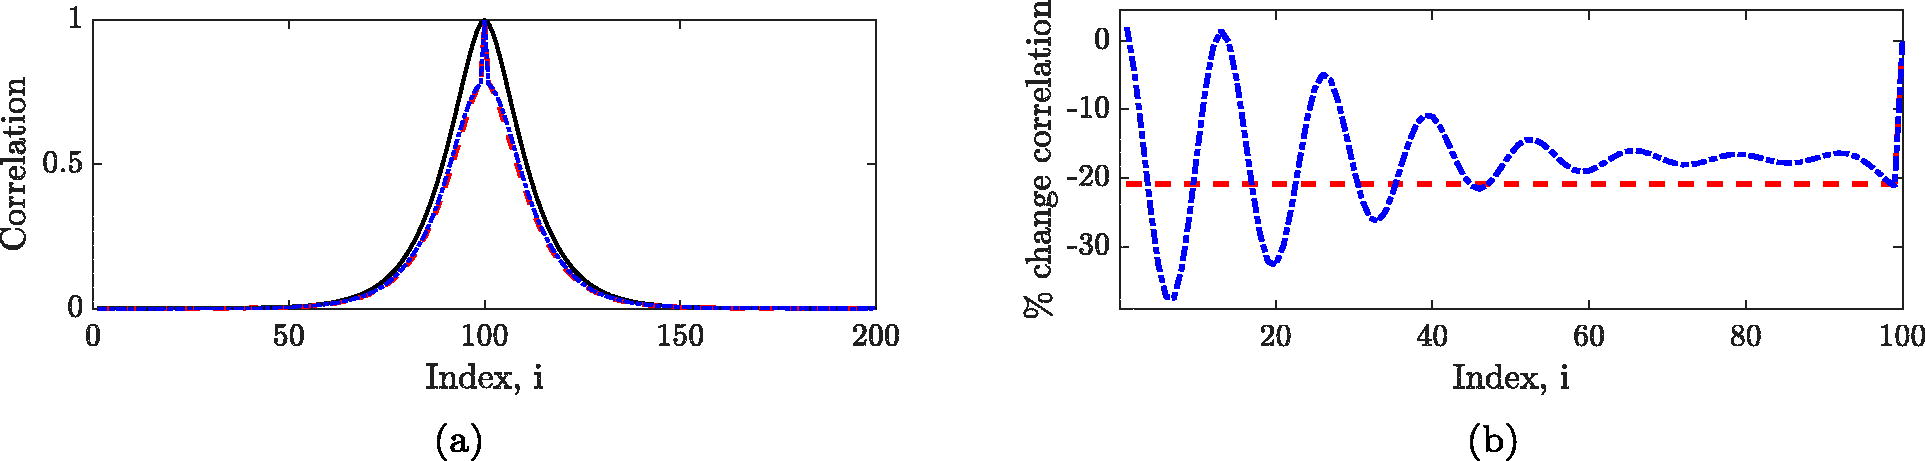
Changes to correlations between the original SOAR matrix and the reconditioned matrices for κmax=100. (a) shows C(100,:)=CMVI(100,:) (black solid), CRR(100,:) (red dashed), CME(100,:) (blue dot-dashed) (b) shows 100×C(100,:)CRR(100,:)C(100,:) (red dashed) and 100×C(100,:)CME(100,:)C(100,:) (blue dot-dashed). As the SOAR matrix is symmetric, we only plot the first 100 entries for (b).
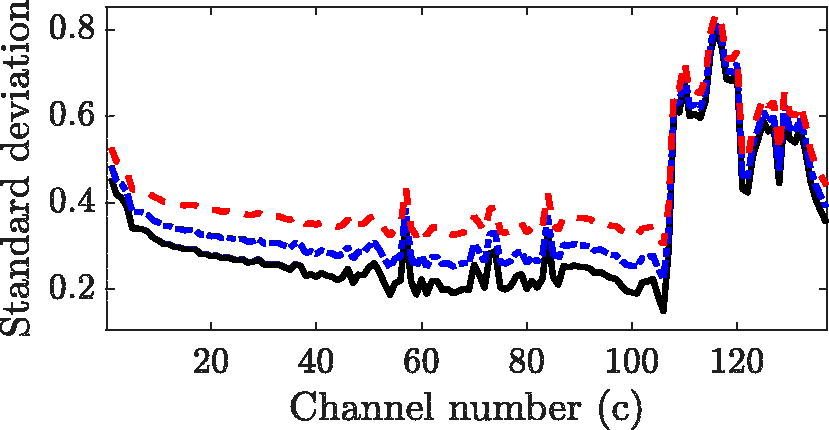
Fig. 2.

Standard deviations for the IASI covariance matrix Σ (black solid), ΣRR (red dashed), ΣME (blue dot-dashed) for κmax=100.

Fig. 3.

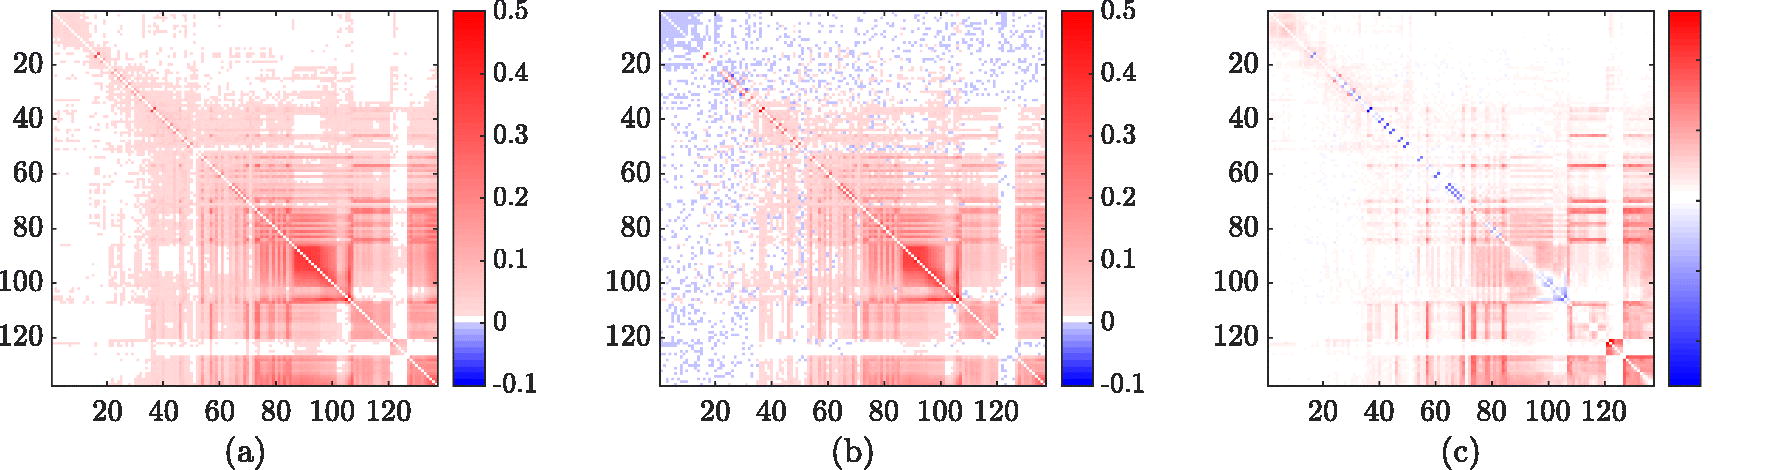
Difference in correlations for IASI (a) (CCRR)°sign(C), (b) (CCME)°sign(C), and (c) (CMECRR)°sign(C), where ° denotes the Hadamard product. Red indicates that the absolute correlation is decreased by reconditioning and blue indicates the absolute correlation is increased. The colourscale is the same for (a) and (b) but different for (c). Condition numbers of the corresponding covariance matrices are given by κ(R)=2005.98,κ(RRR)=100 and κ(RME)=100.

Fig. 4.

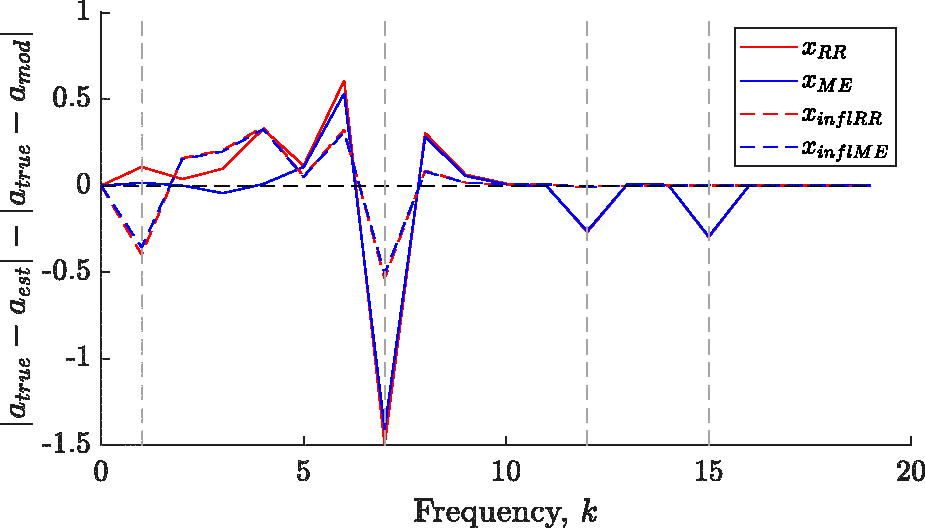
Change in pointwise difference of discrete Fourier transform (DFT) from xest to xmod where aest denotes the vector of coefficients of the imaginary part of DFT(xest). A positive (negative) value indicates that xmod is closer to (further from) xtrue than xest and the amplitude shows how large this change is. Vertical dashed lines show the locations of non-zero values for the true signal.
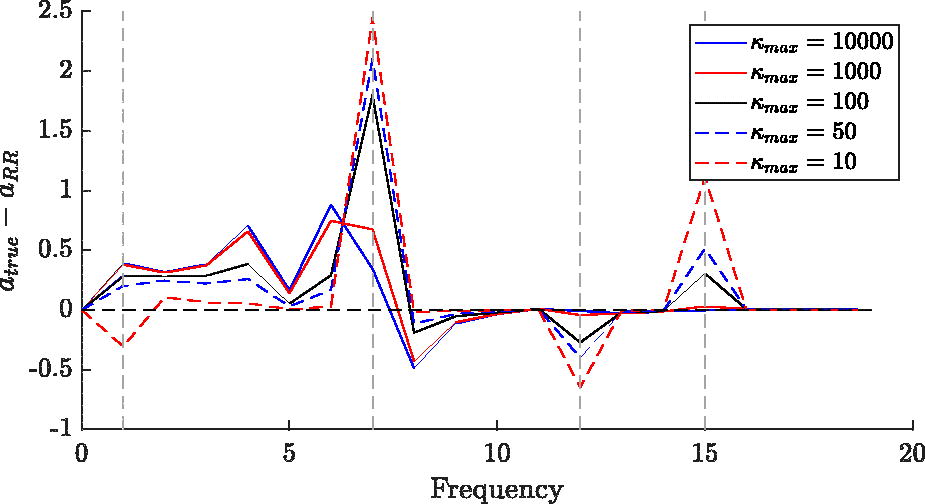
Fig. 5.

Difference between atrue and aRR for different choices of κmax. Vertical dashed lines show the locations of non-zero values for the true signal.

Table 2

Changes to convergence of RR, MI and MVI for different values of κmax.

κmax10, 0001, 0001005010RR24524417014173ME24023919314576Infl RR244244238233199

[i] For all choices of κmax, convergence for Rtrue occurs in 17 iterations and Rest occurs in 244 iterations.

Language: English
Page range: 1696646 - 1696646
Published on: Jan 1, 2020
Published by: Stockholm University Press
In partnership with: Paradigm Publishing Services

© 2020 Jemima M. Tabeart, Sarah L. Dance, Amos S. Lawless, Nancy K. Nichols, Joanne A. Waller, published by Stockholm University Press
This work is licensed under the Creative Commons Attribution 4.0 License.