
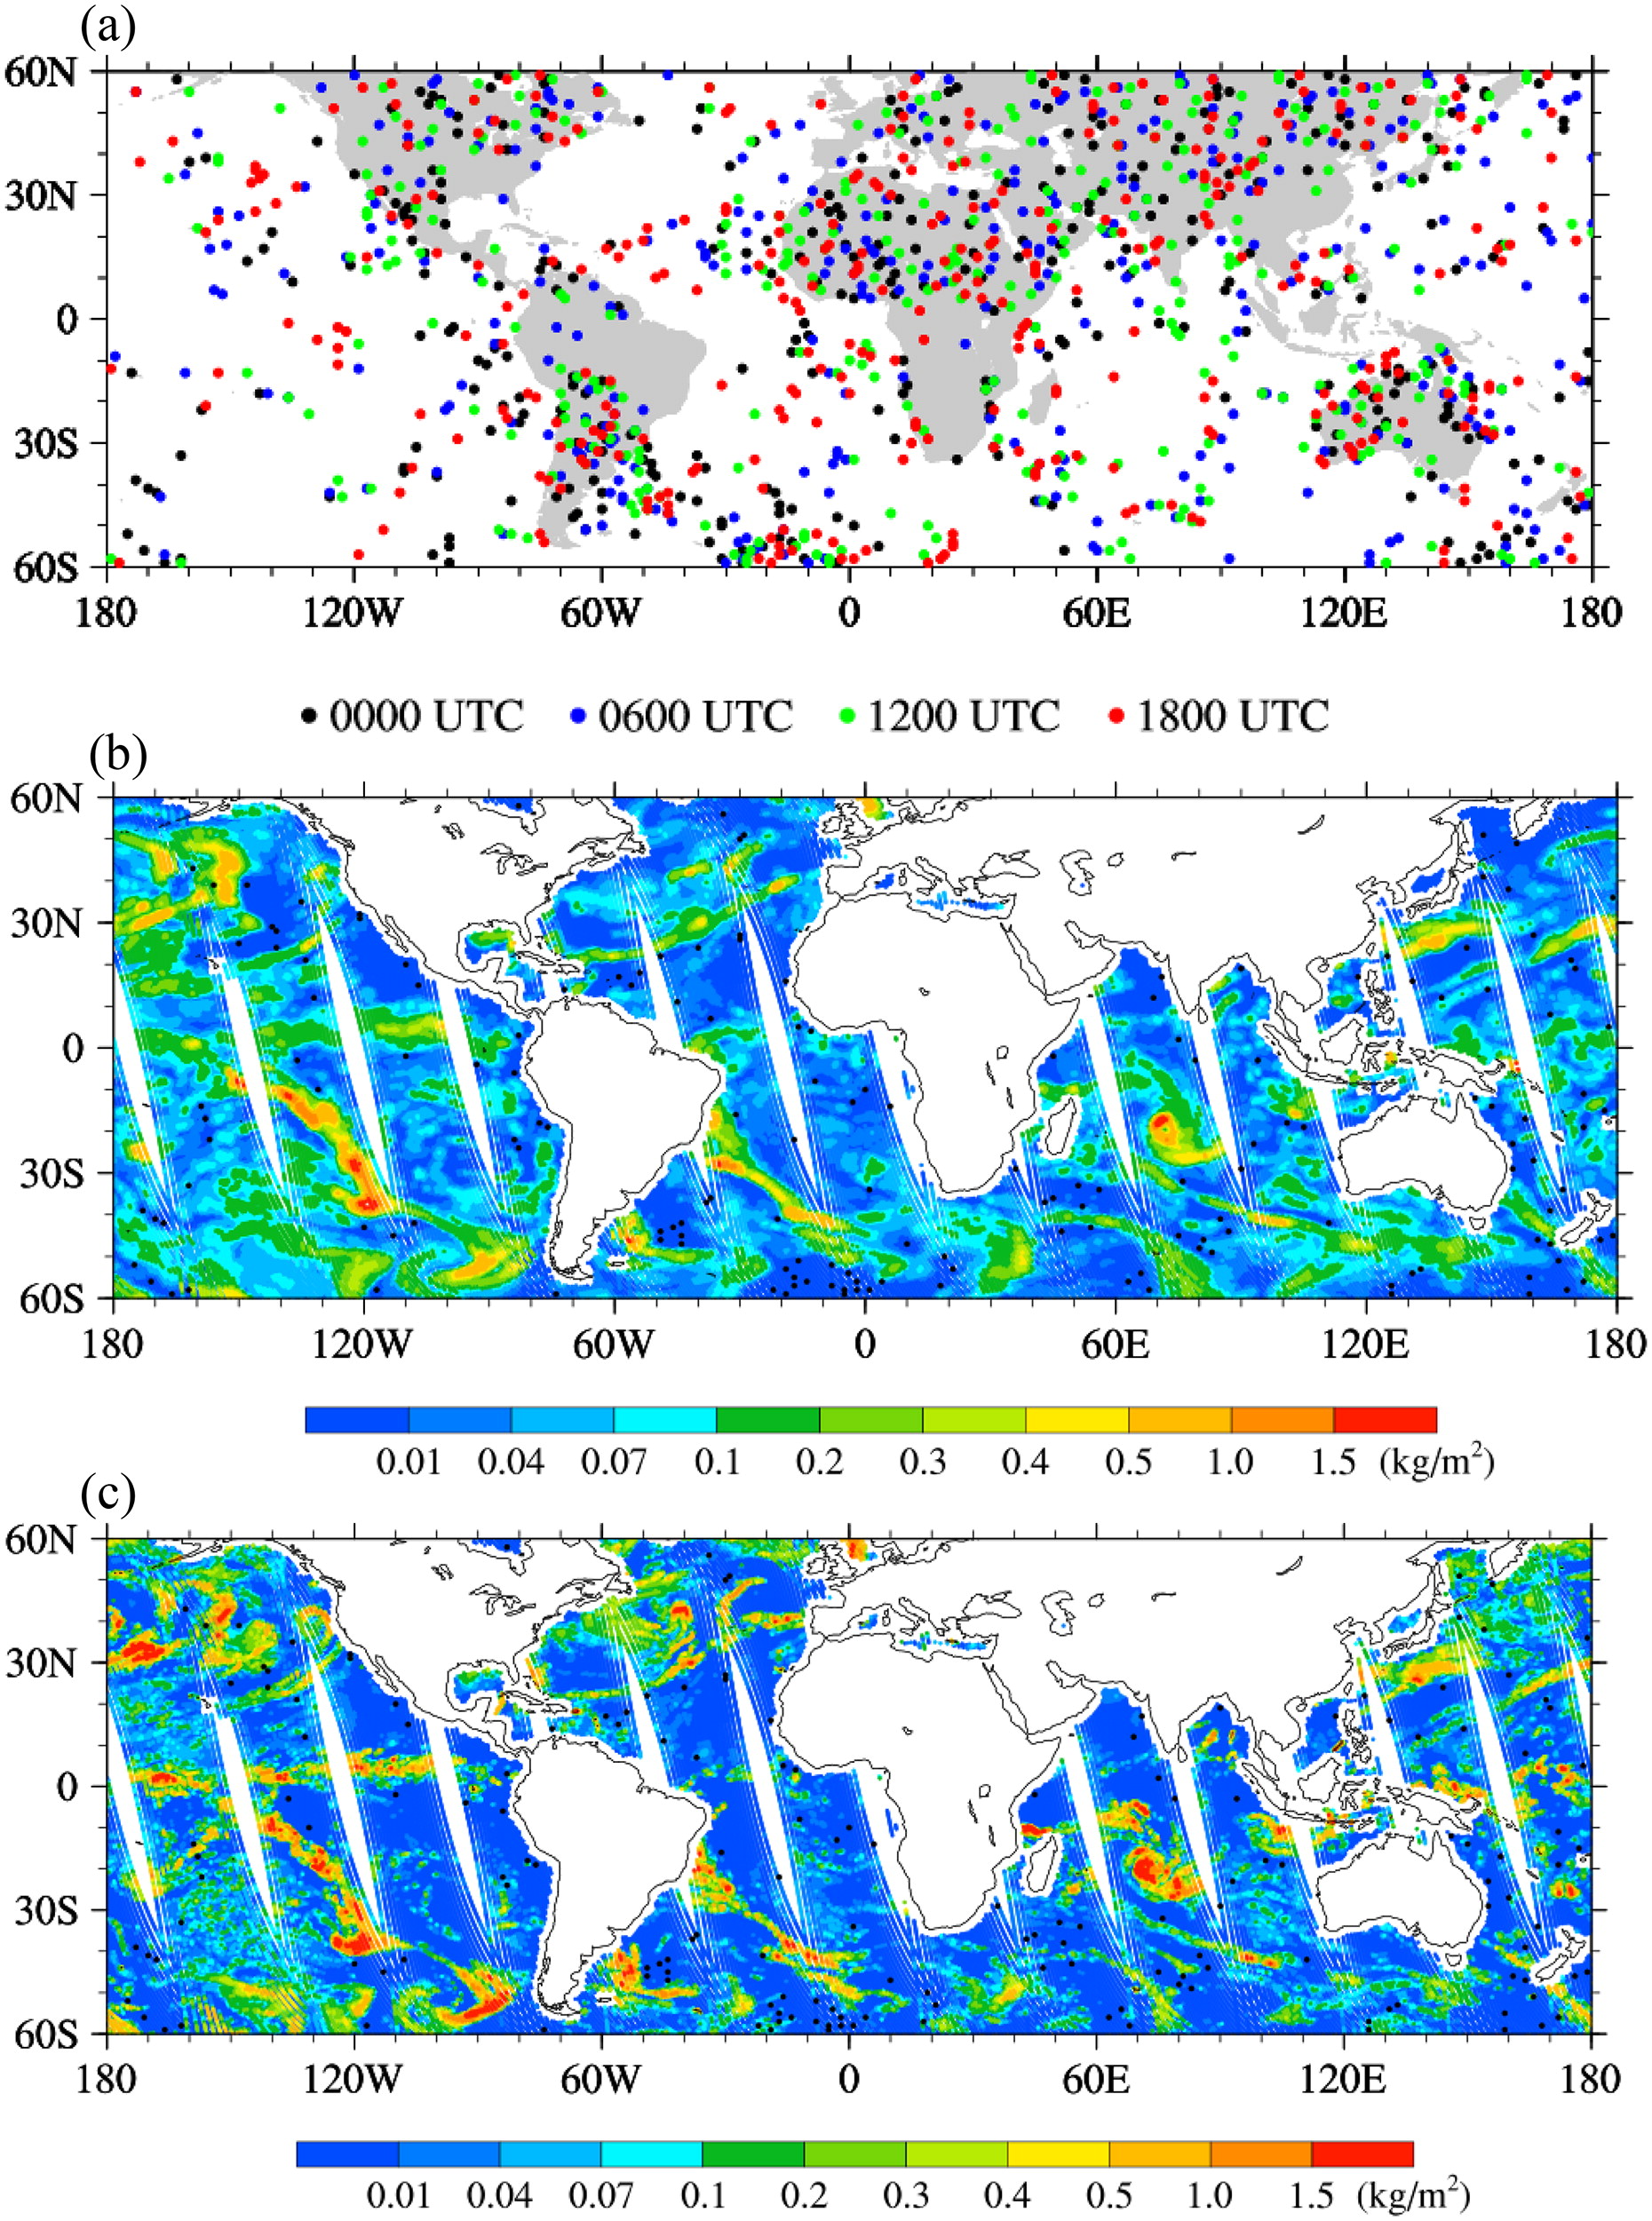
Fig. 1.
(a) Geographic distributions of clear-sky ECMWF profiles selected at 0000, 0600, 1200 and 1800 UTC 22 January 2016. (b) Geographical distribution of ECMWF-modelled cloud liquid water path interpolated to NOAA-19 data points, and (c) NOAA-19 AMSU-A-retrieved cloud liquid water path over oceans on 22 January 2016. The black dots in (b) and (c) are a subset of the clear-sky ECMWF profiles selected within three hours of the NOAA-19 data points.
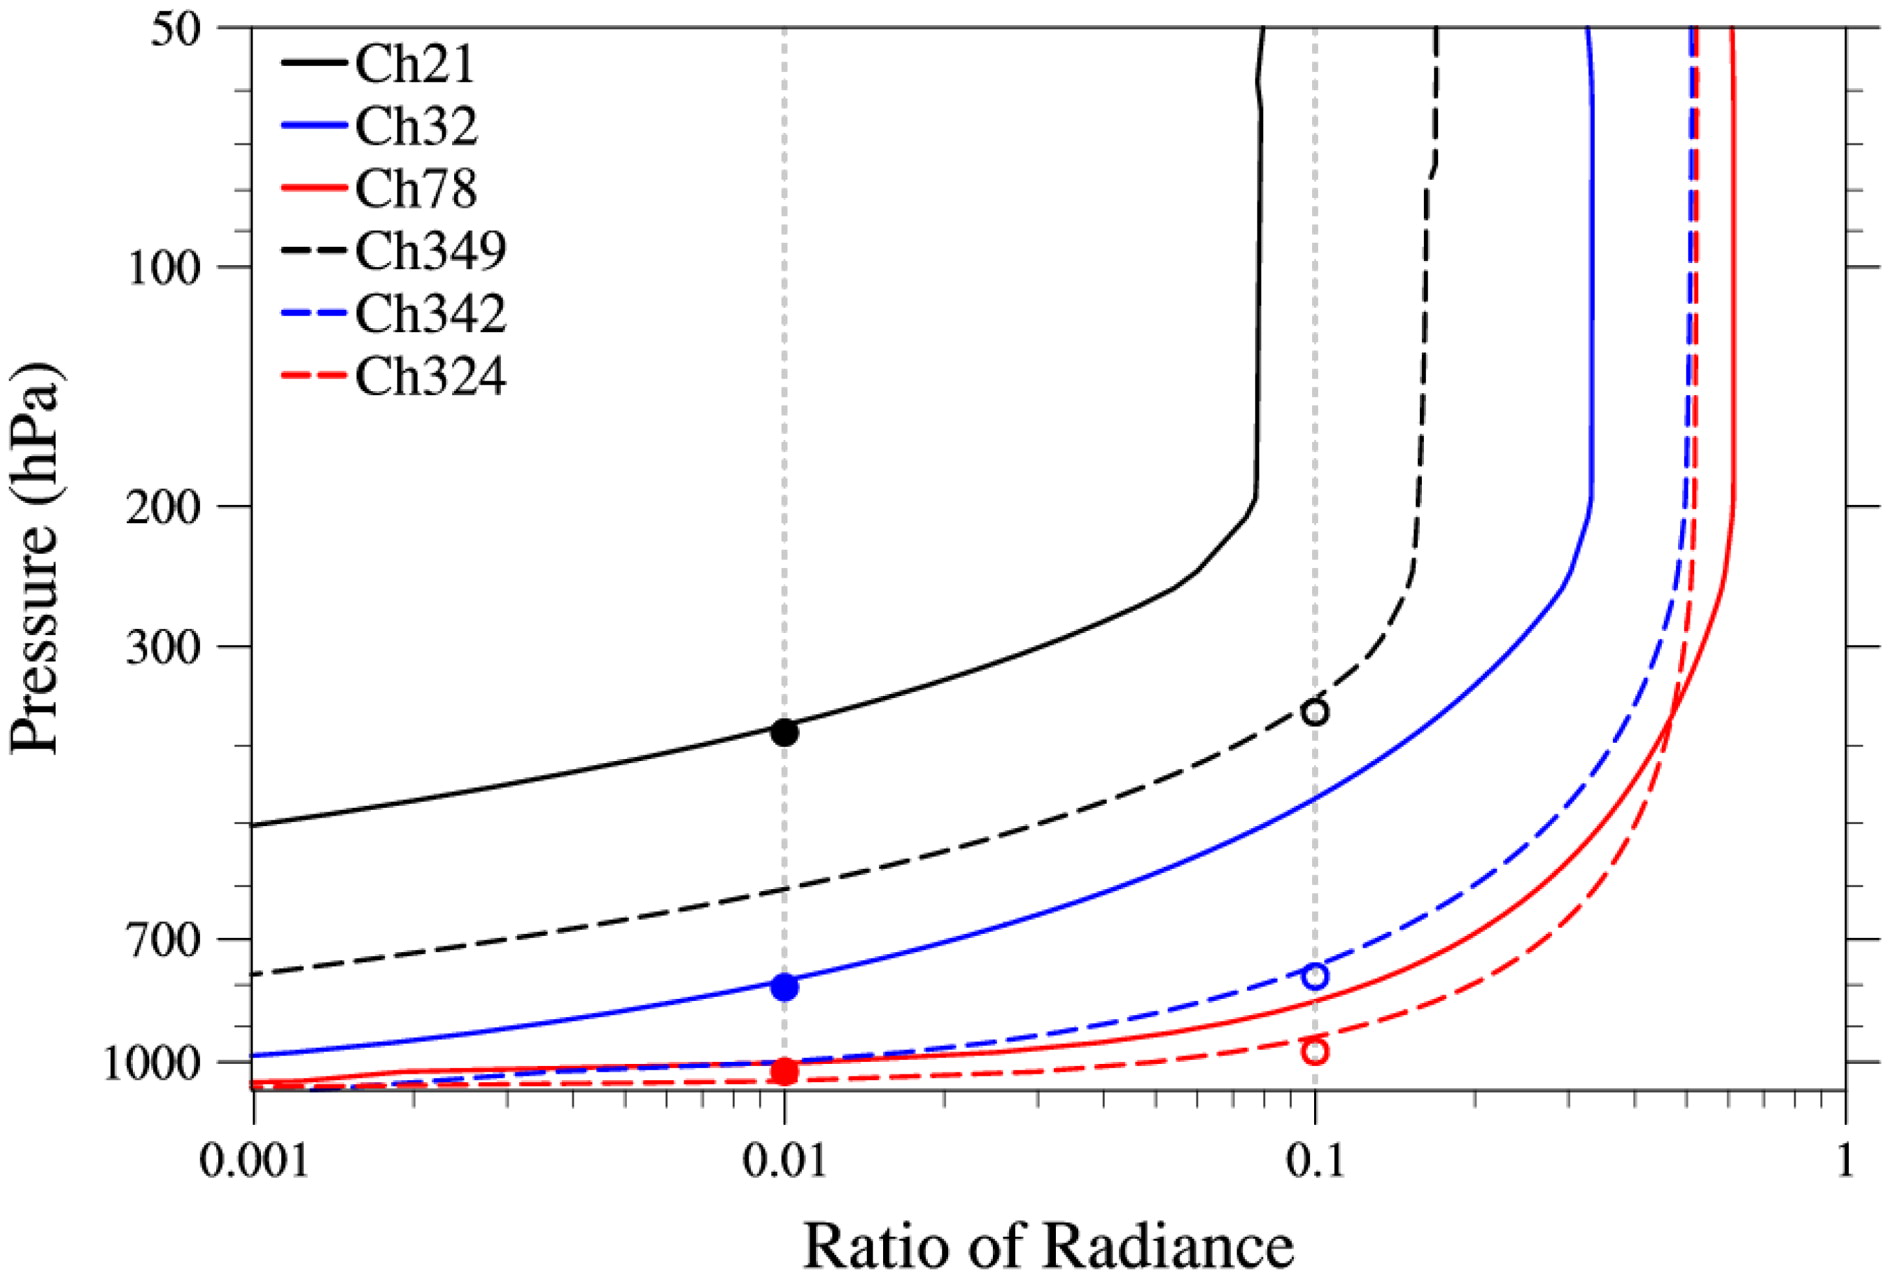
Fig. 2.
Relative ratios, for LWIR channels 21, 32 and 78 (solid lines) and SWIR channels 349, 342 and 324 (dashed lines). The vertical grey dotted lines are the thresholds, that is, 0.1 for SWIR and 0.01 for LWIR. The solid and open circles represent the channel-dependent lowest cloud-sensitive levels for LWIR and SWIR, respectively.
Table 1.
Input variables for calculating clear-sky and cloudy radiances with the CRTM.
Table 2.
Channel number, wave number, weighting function (WF) peaks, and the lowest cloud-sensitive level for 26 paired LWIR and SWIR channels.
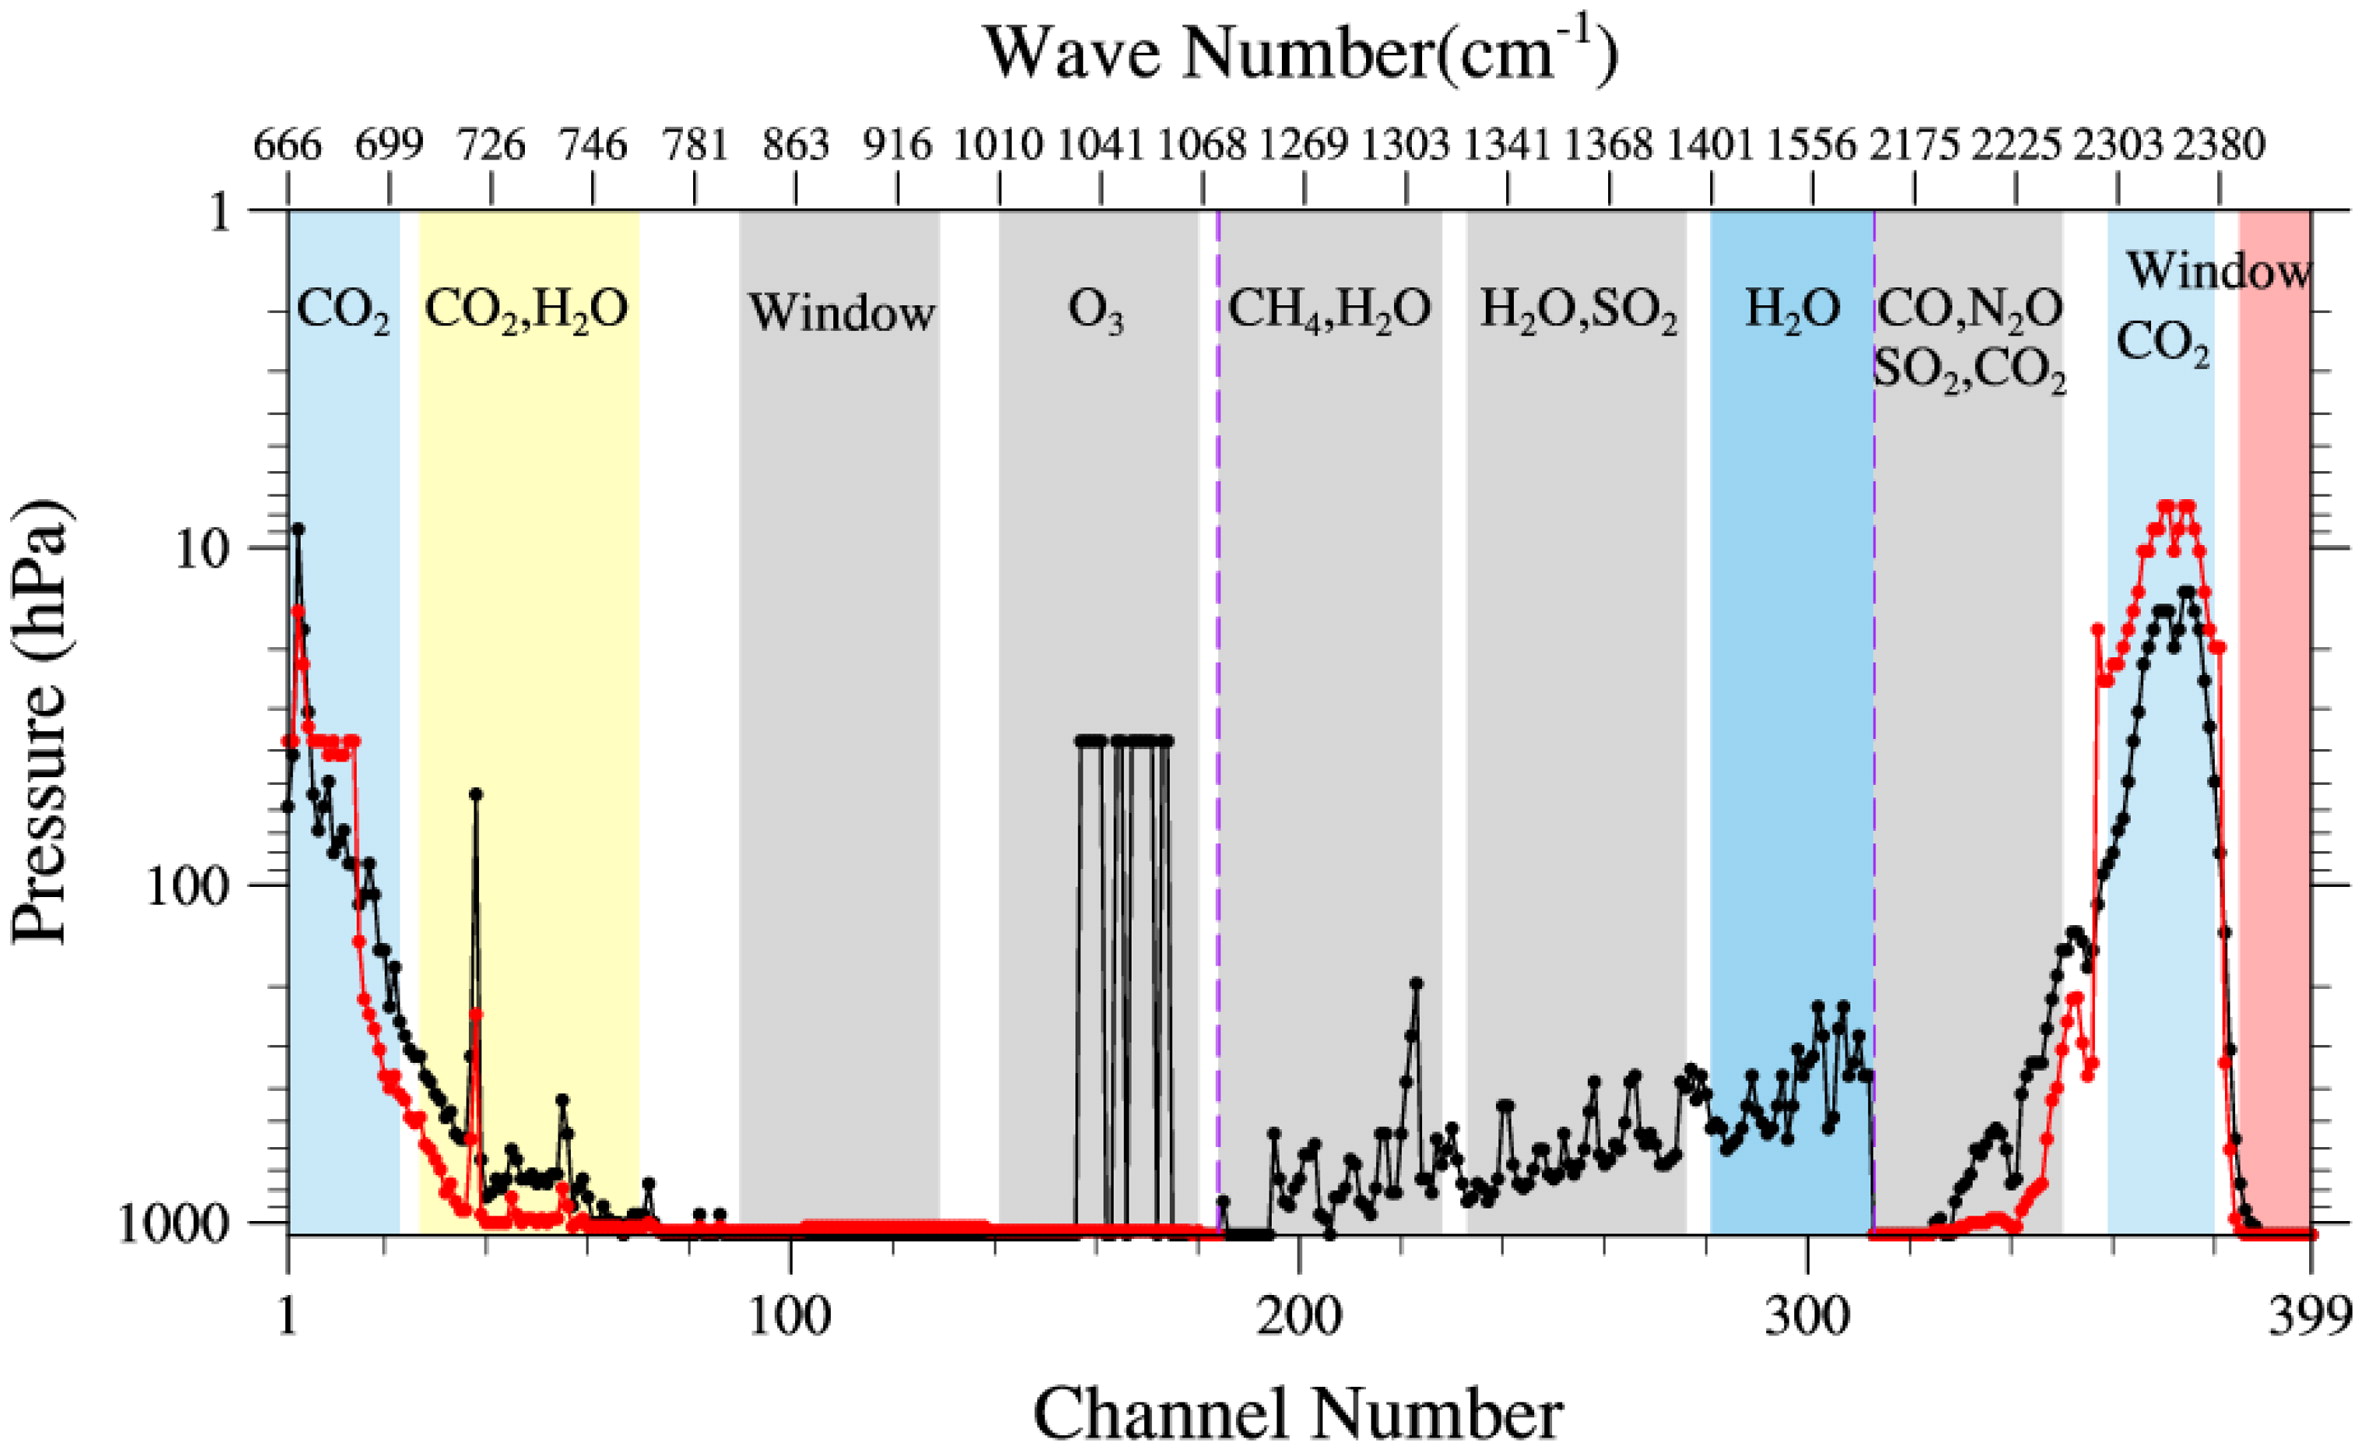
Fig. 3.
Weighting function peaks (black) and the lowest cloud-sensitive levels (red) of the 399 CrIS channels selected for NWP, calculated using the CRTM with the U.S. standard atmosphere profile.
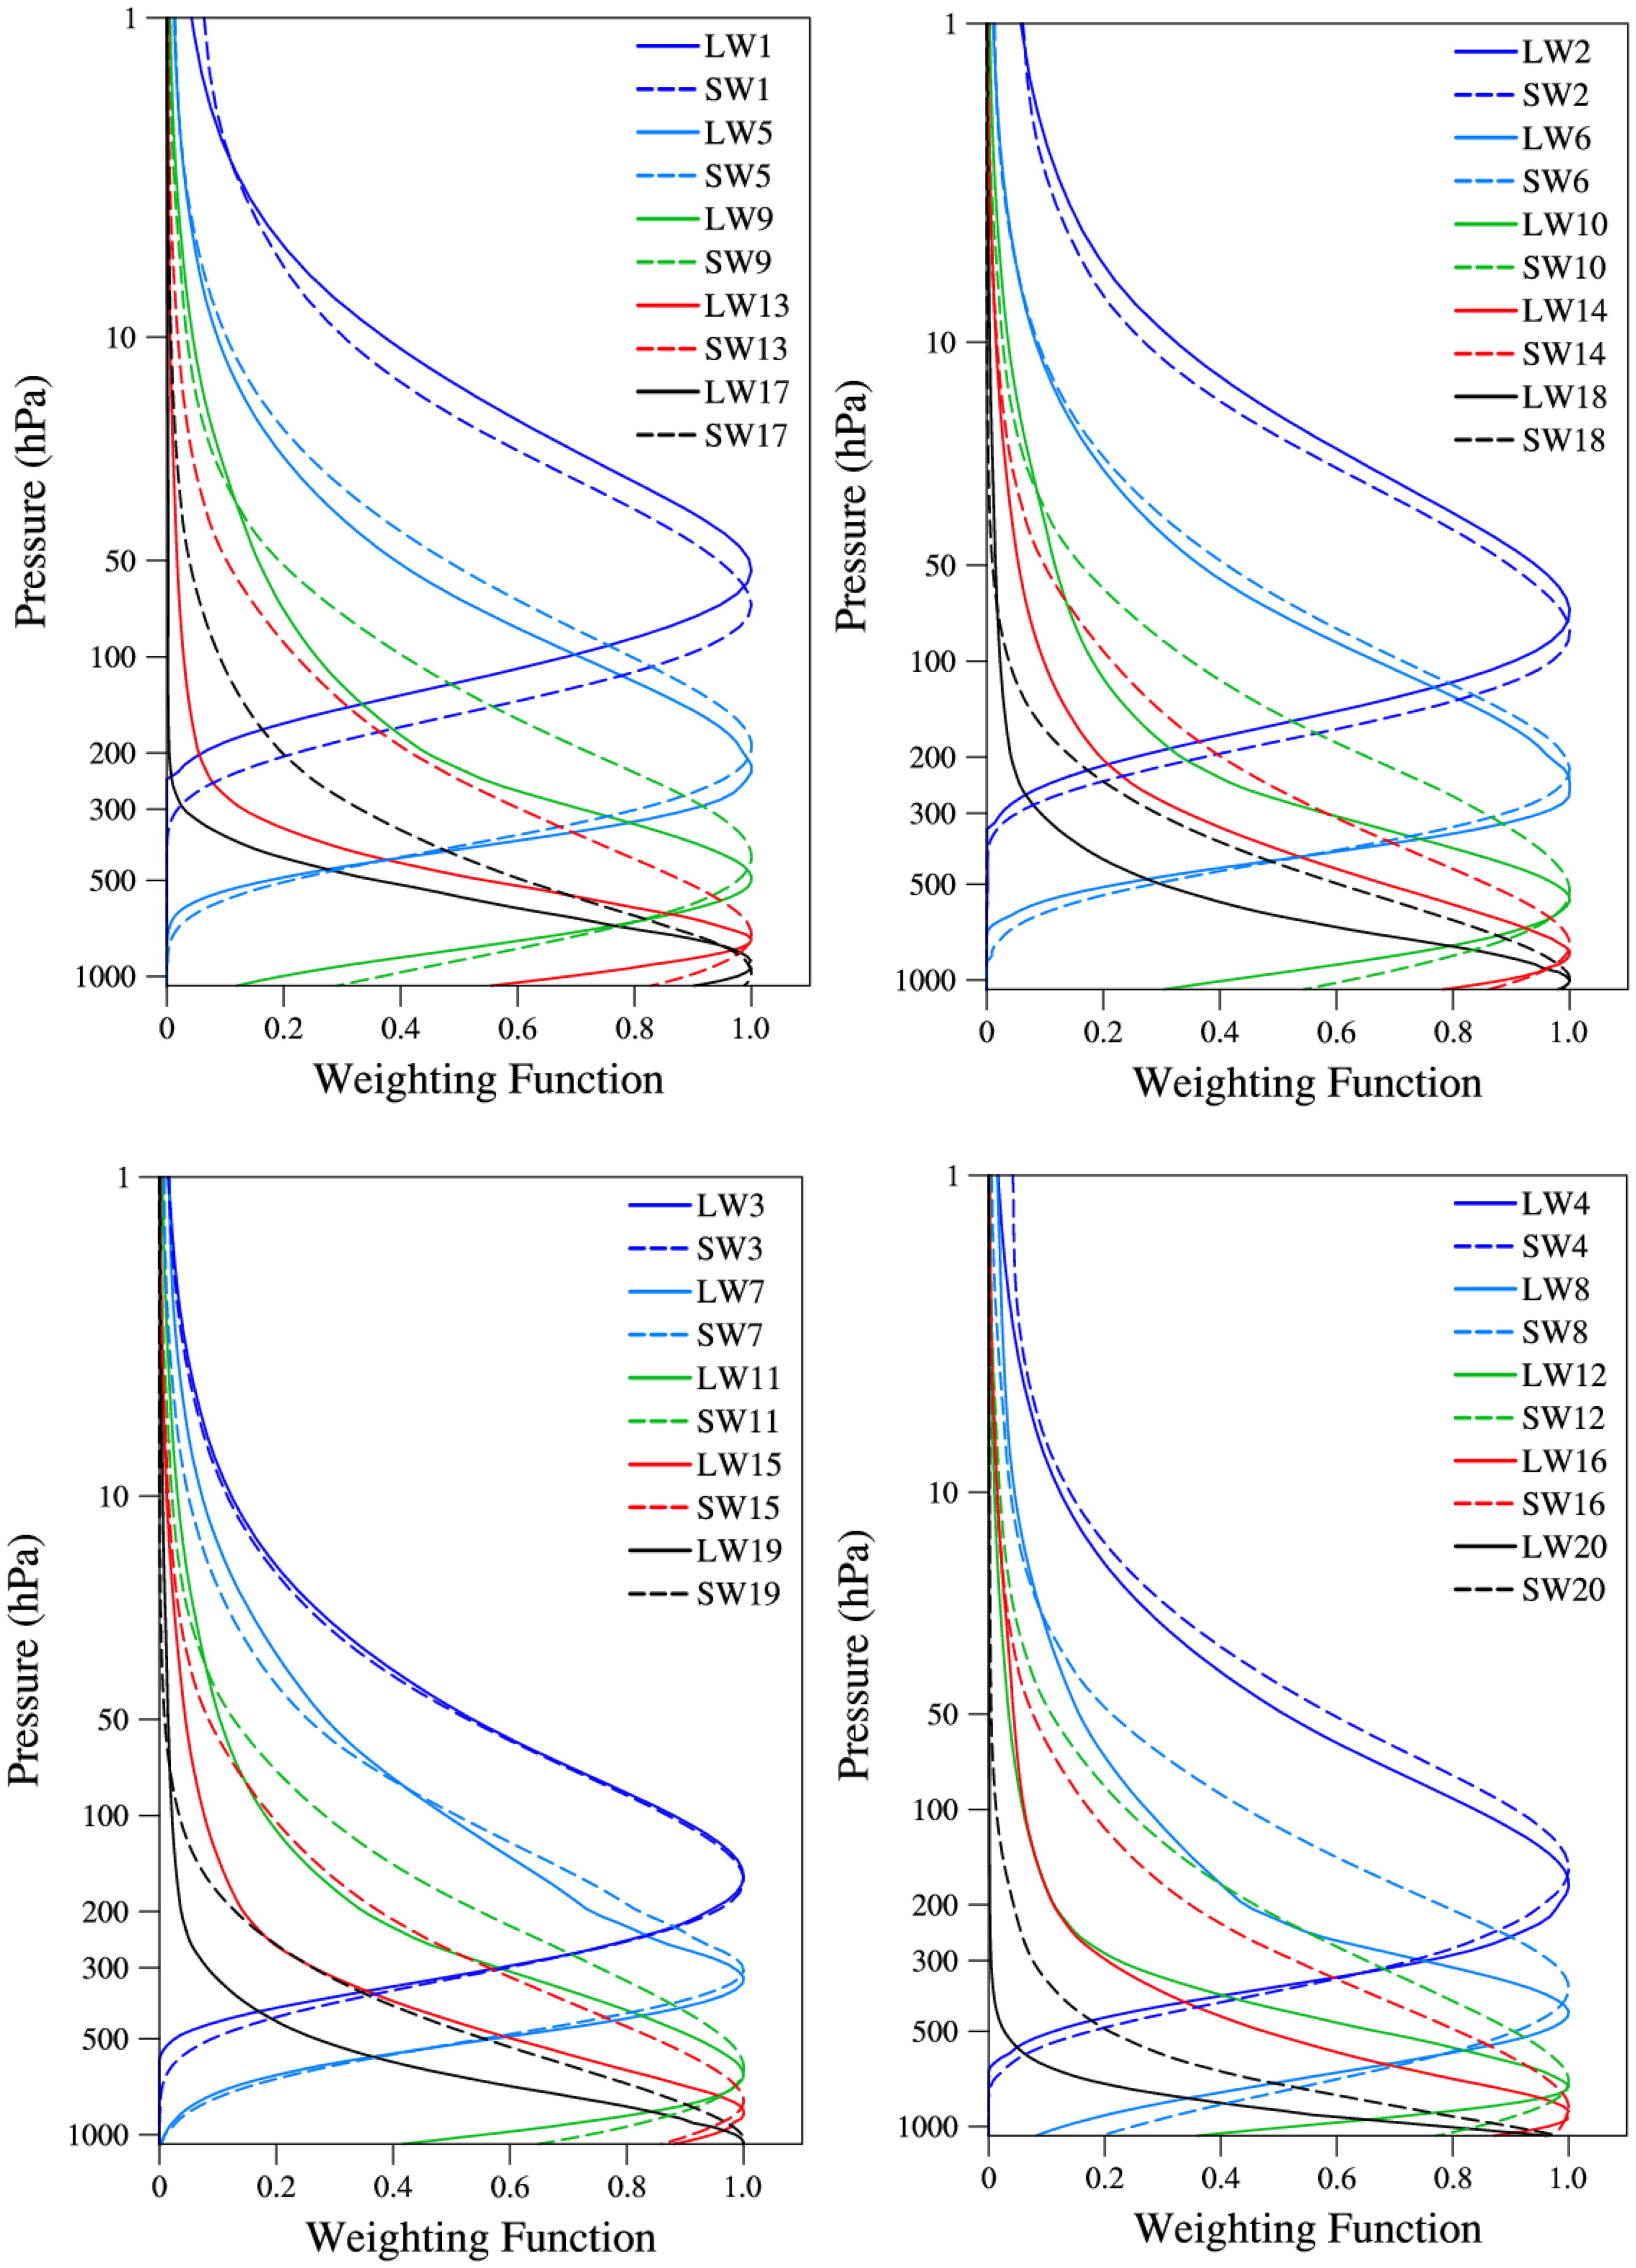
Fig. 4.
Normalised weighting functions for the LWIR (solid lines) and SWIR (dashed lines) channels of pairs 1–20.
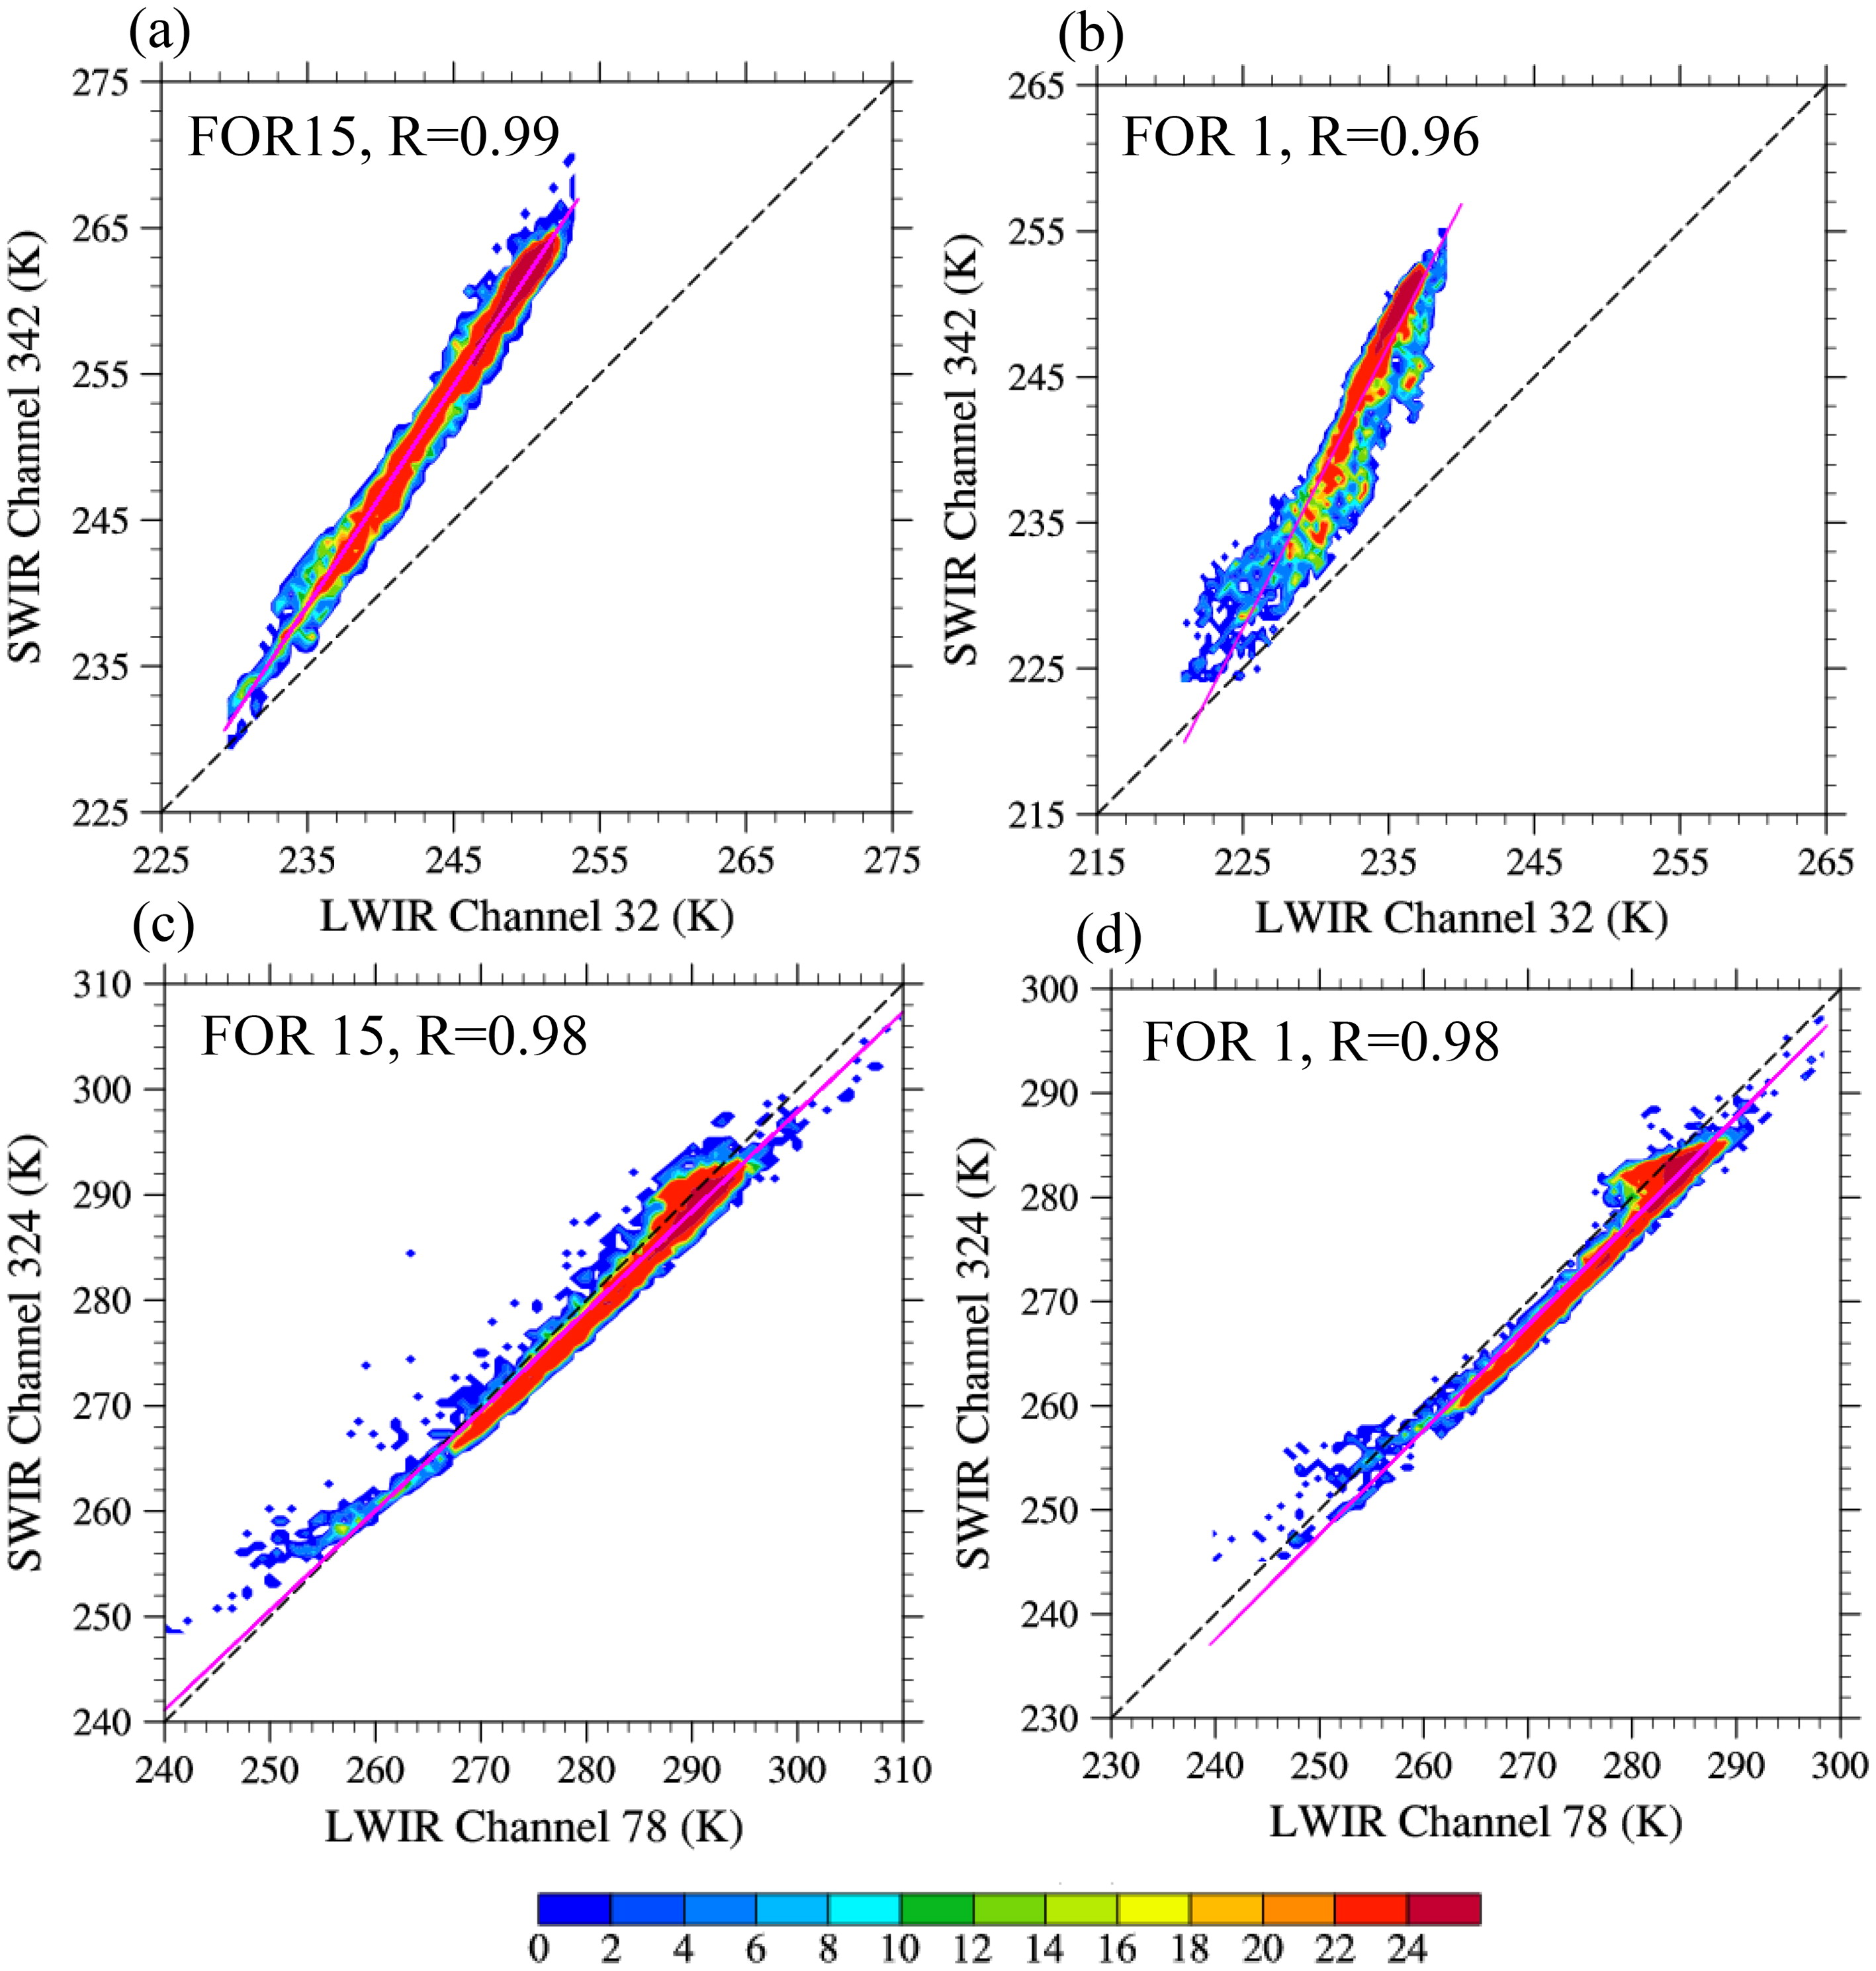
Fig. 5.
Data count of CRTM-simulated brightness temperatures of (a, b) pair-9 channels and (c, d) pair-19 channels at the field of regards (FORs) 15 (left panels) and 1 (right panels) using the 6400 selected clear-sky ECMWF profiles. The letter ‘R’ represents the correlation coefficient.
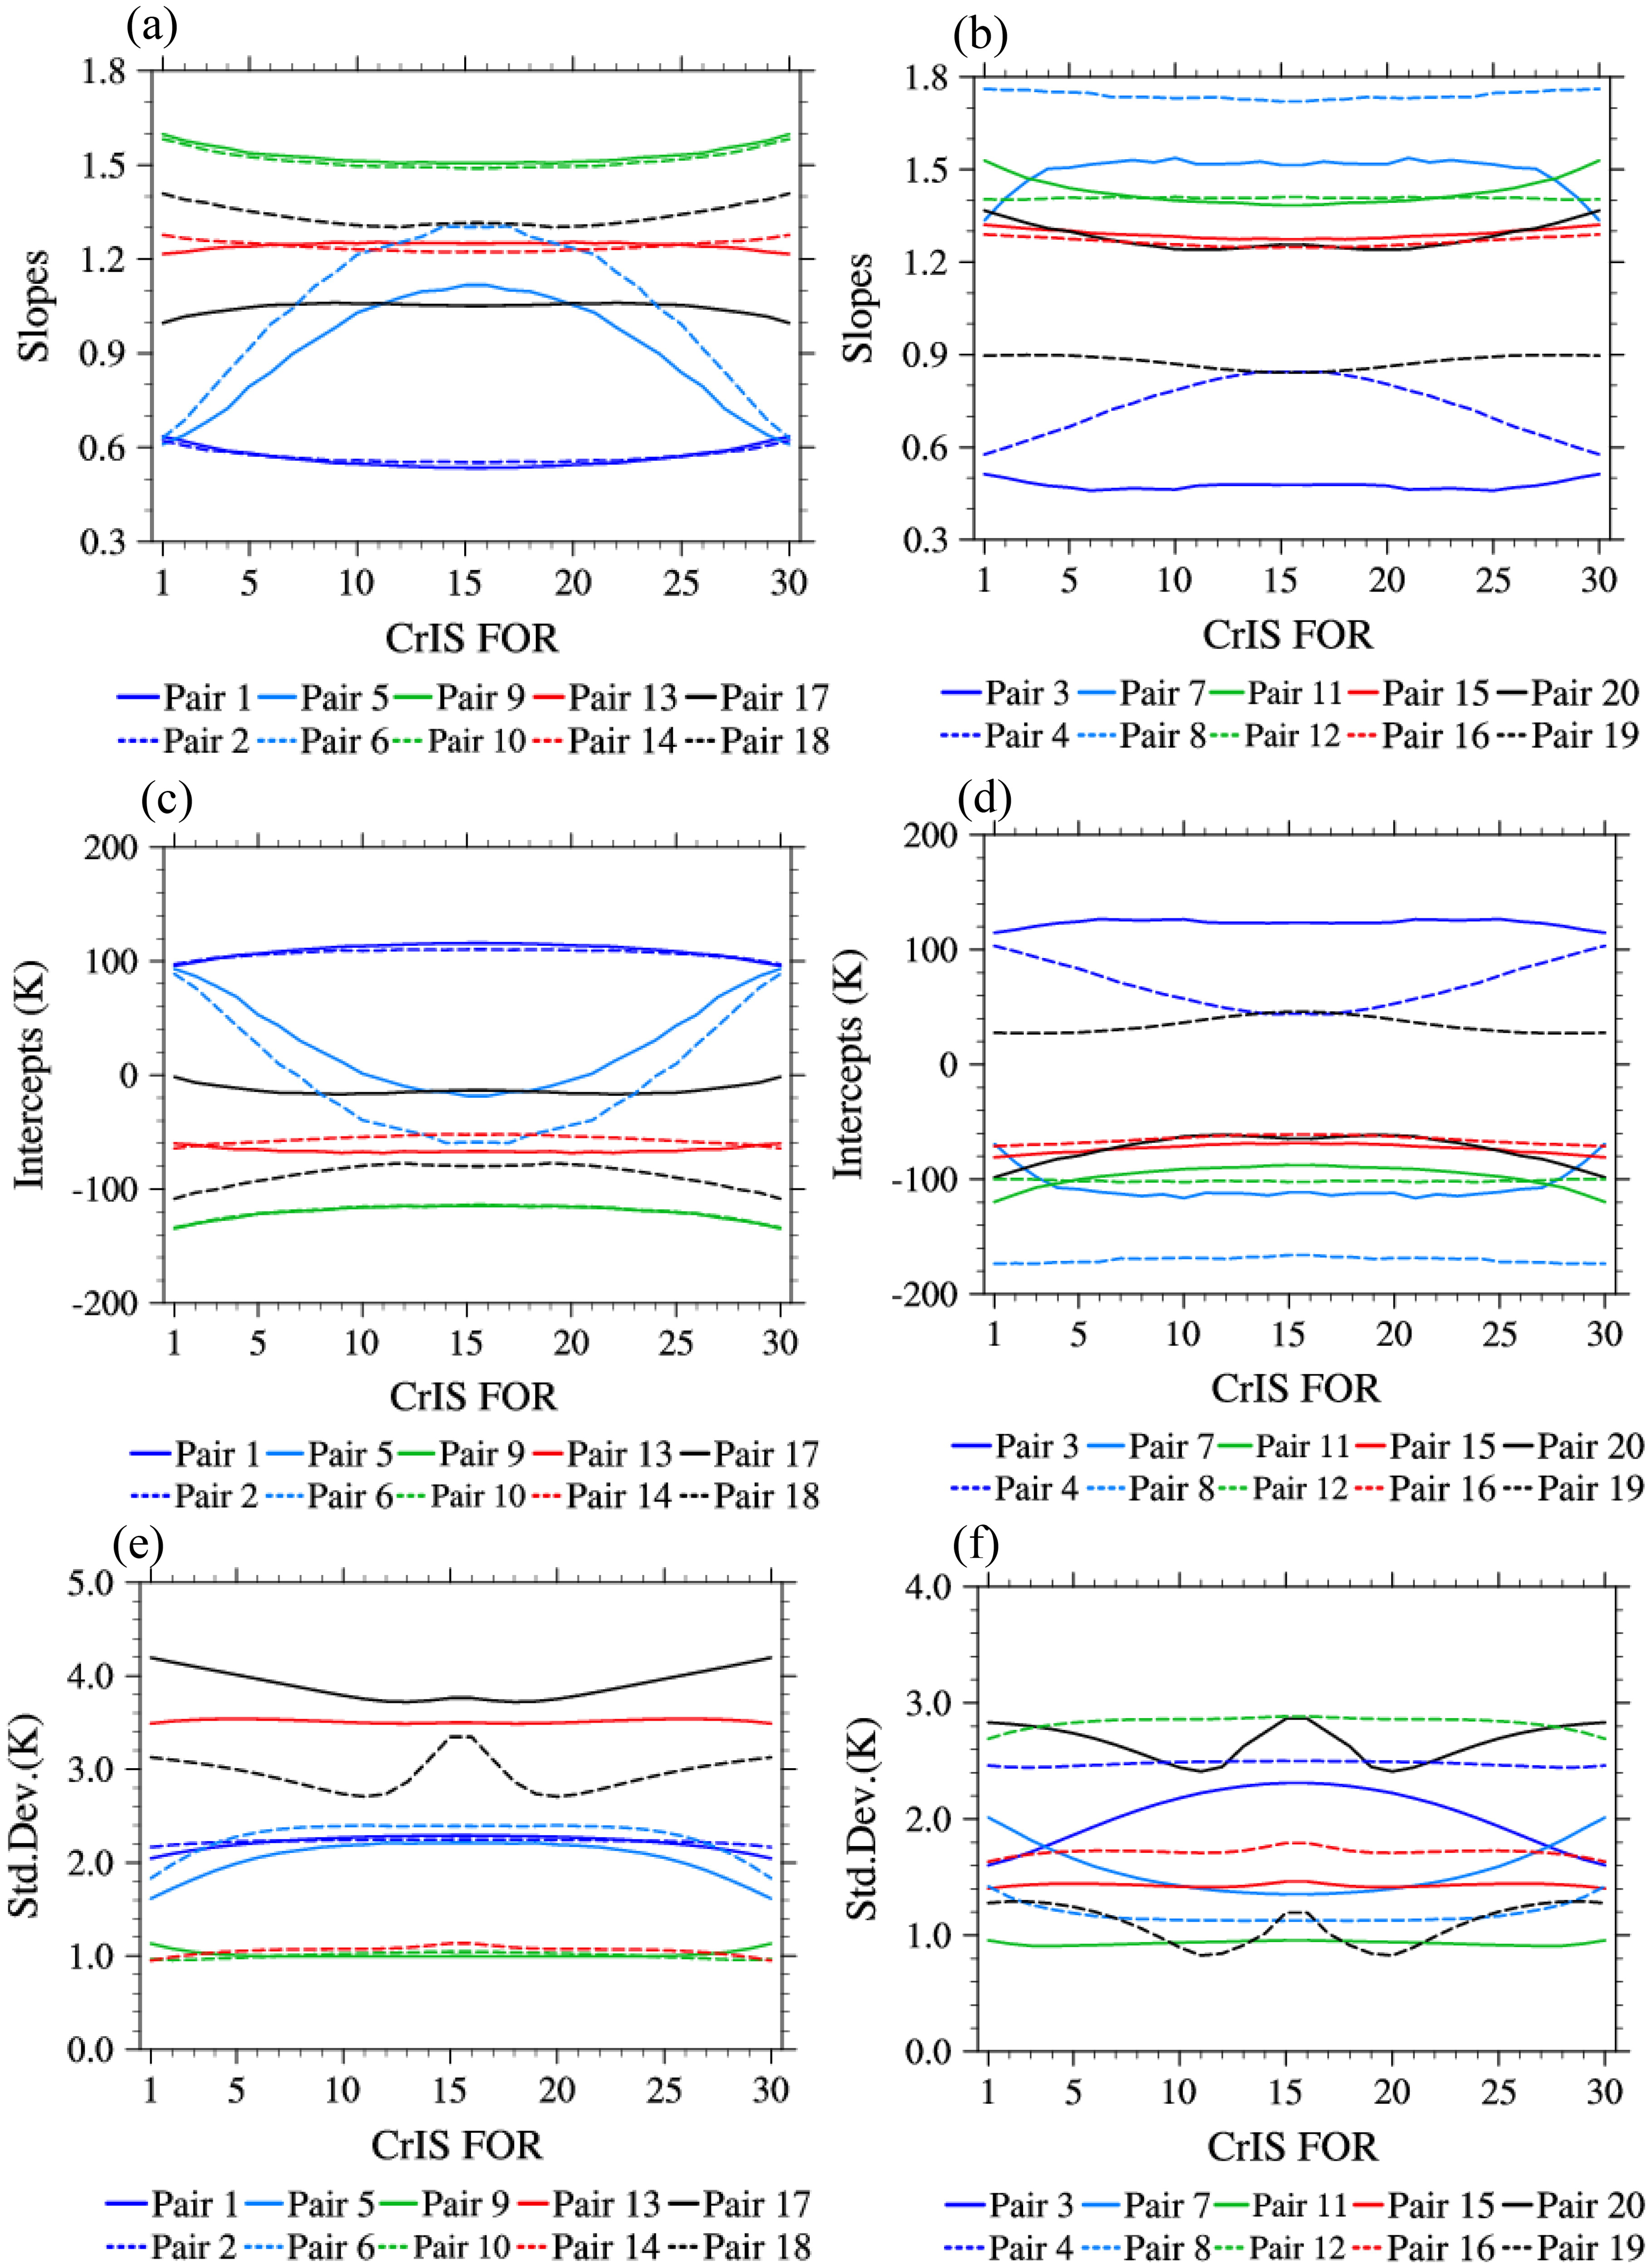
Fig. 6.
Regression coefficients (a, b) α and (c, d) β, and (e, f) standard deviations of the regression model for 30 fields of regard (FORs) of pairs 1–20.
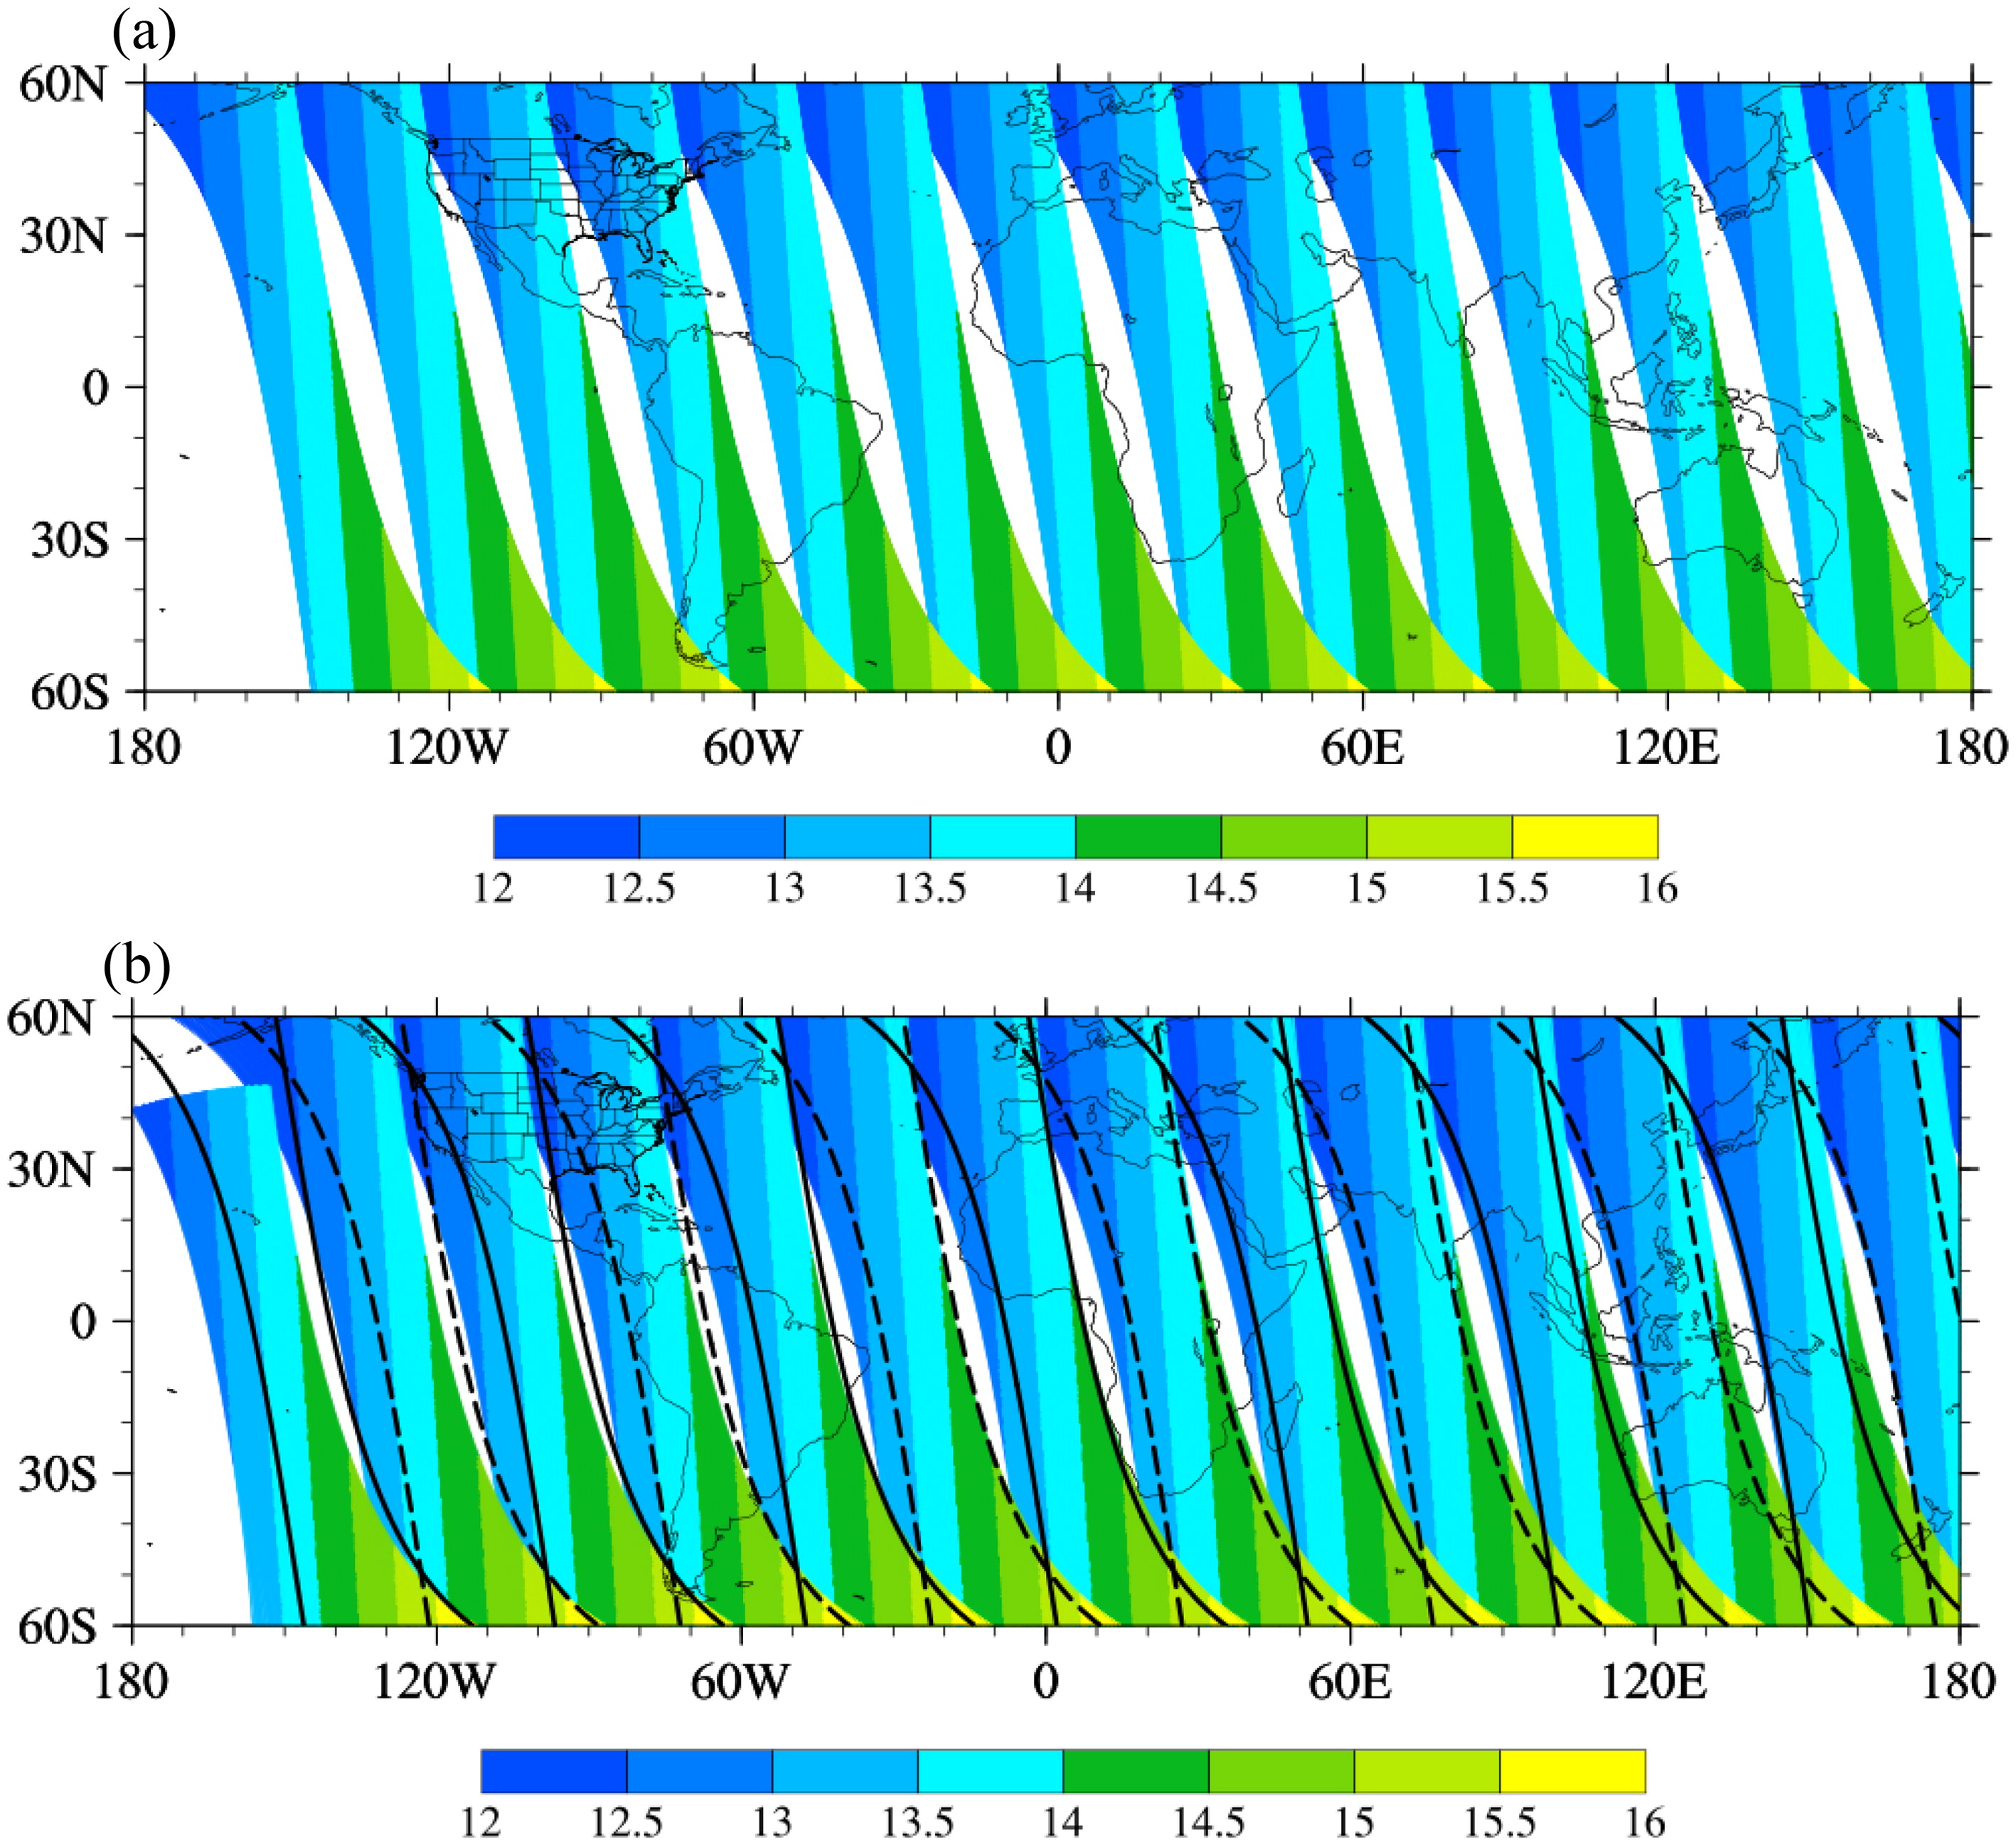
Fig. 7.
Local time distributions (unit: hour) of (a) the AIRS and (b) the CrIS from ascending nodes during 0300–2400 UTC 22 January 2016. The black lines in (b) are the limb along-tracks of the AIRS.
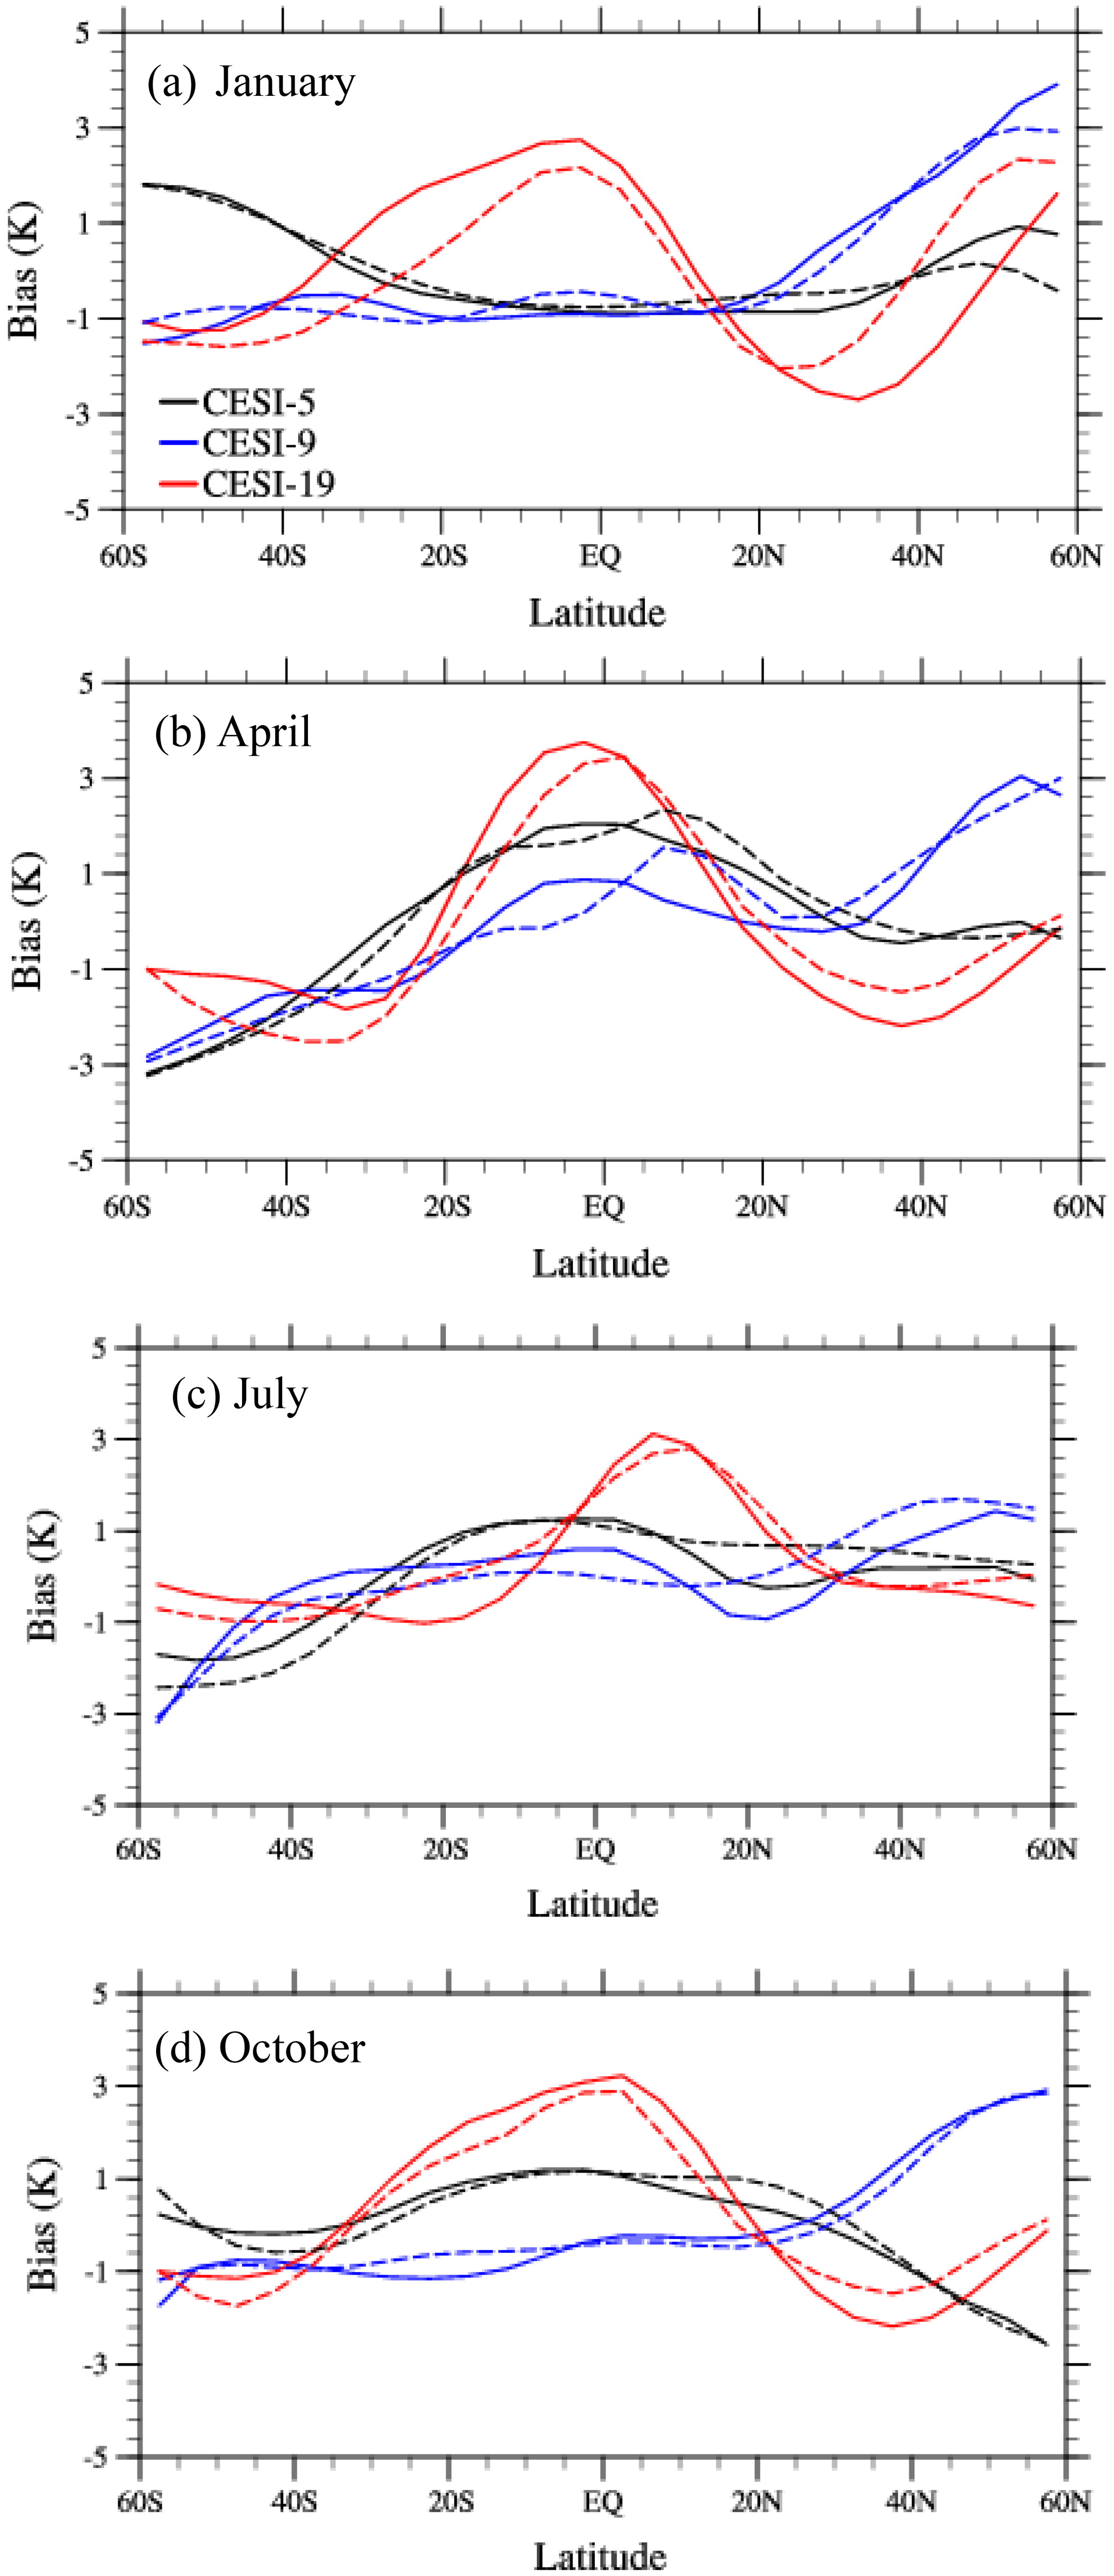
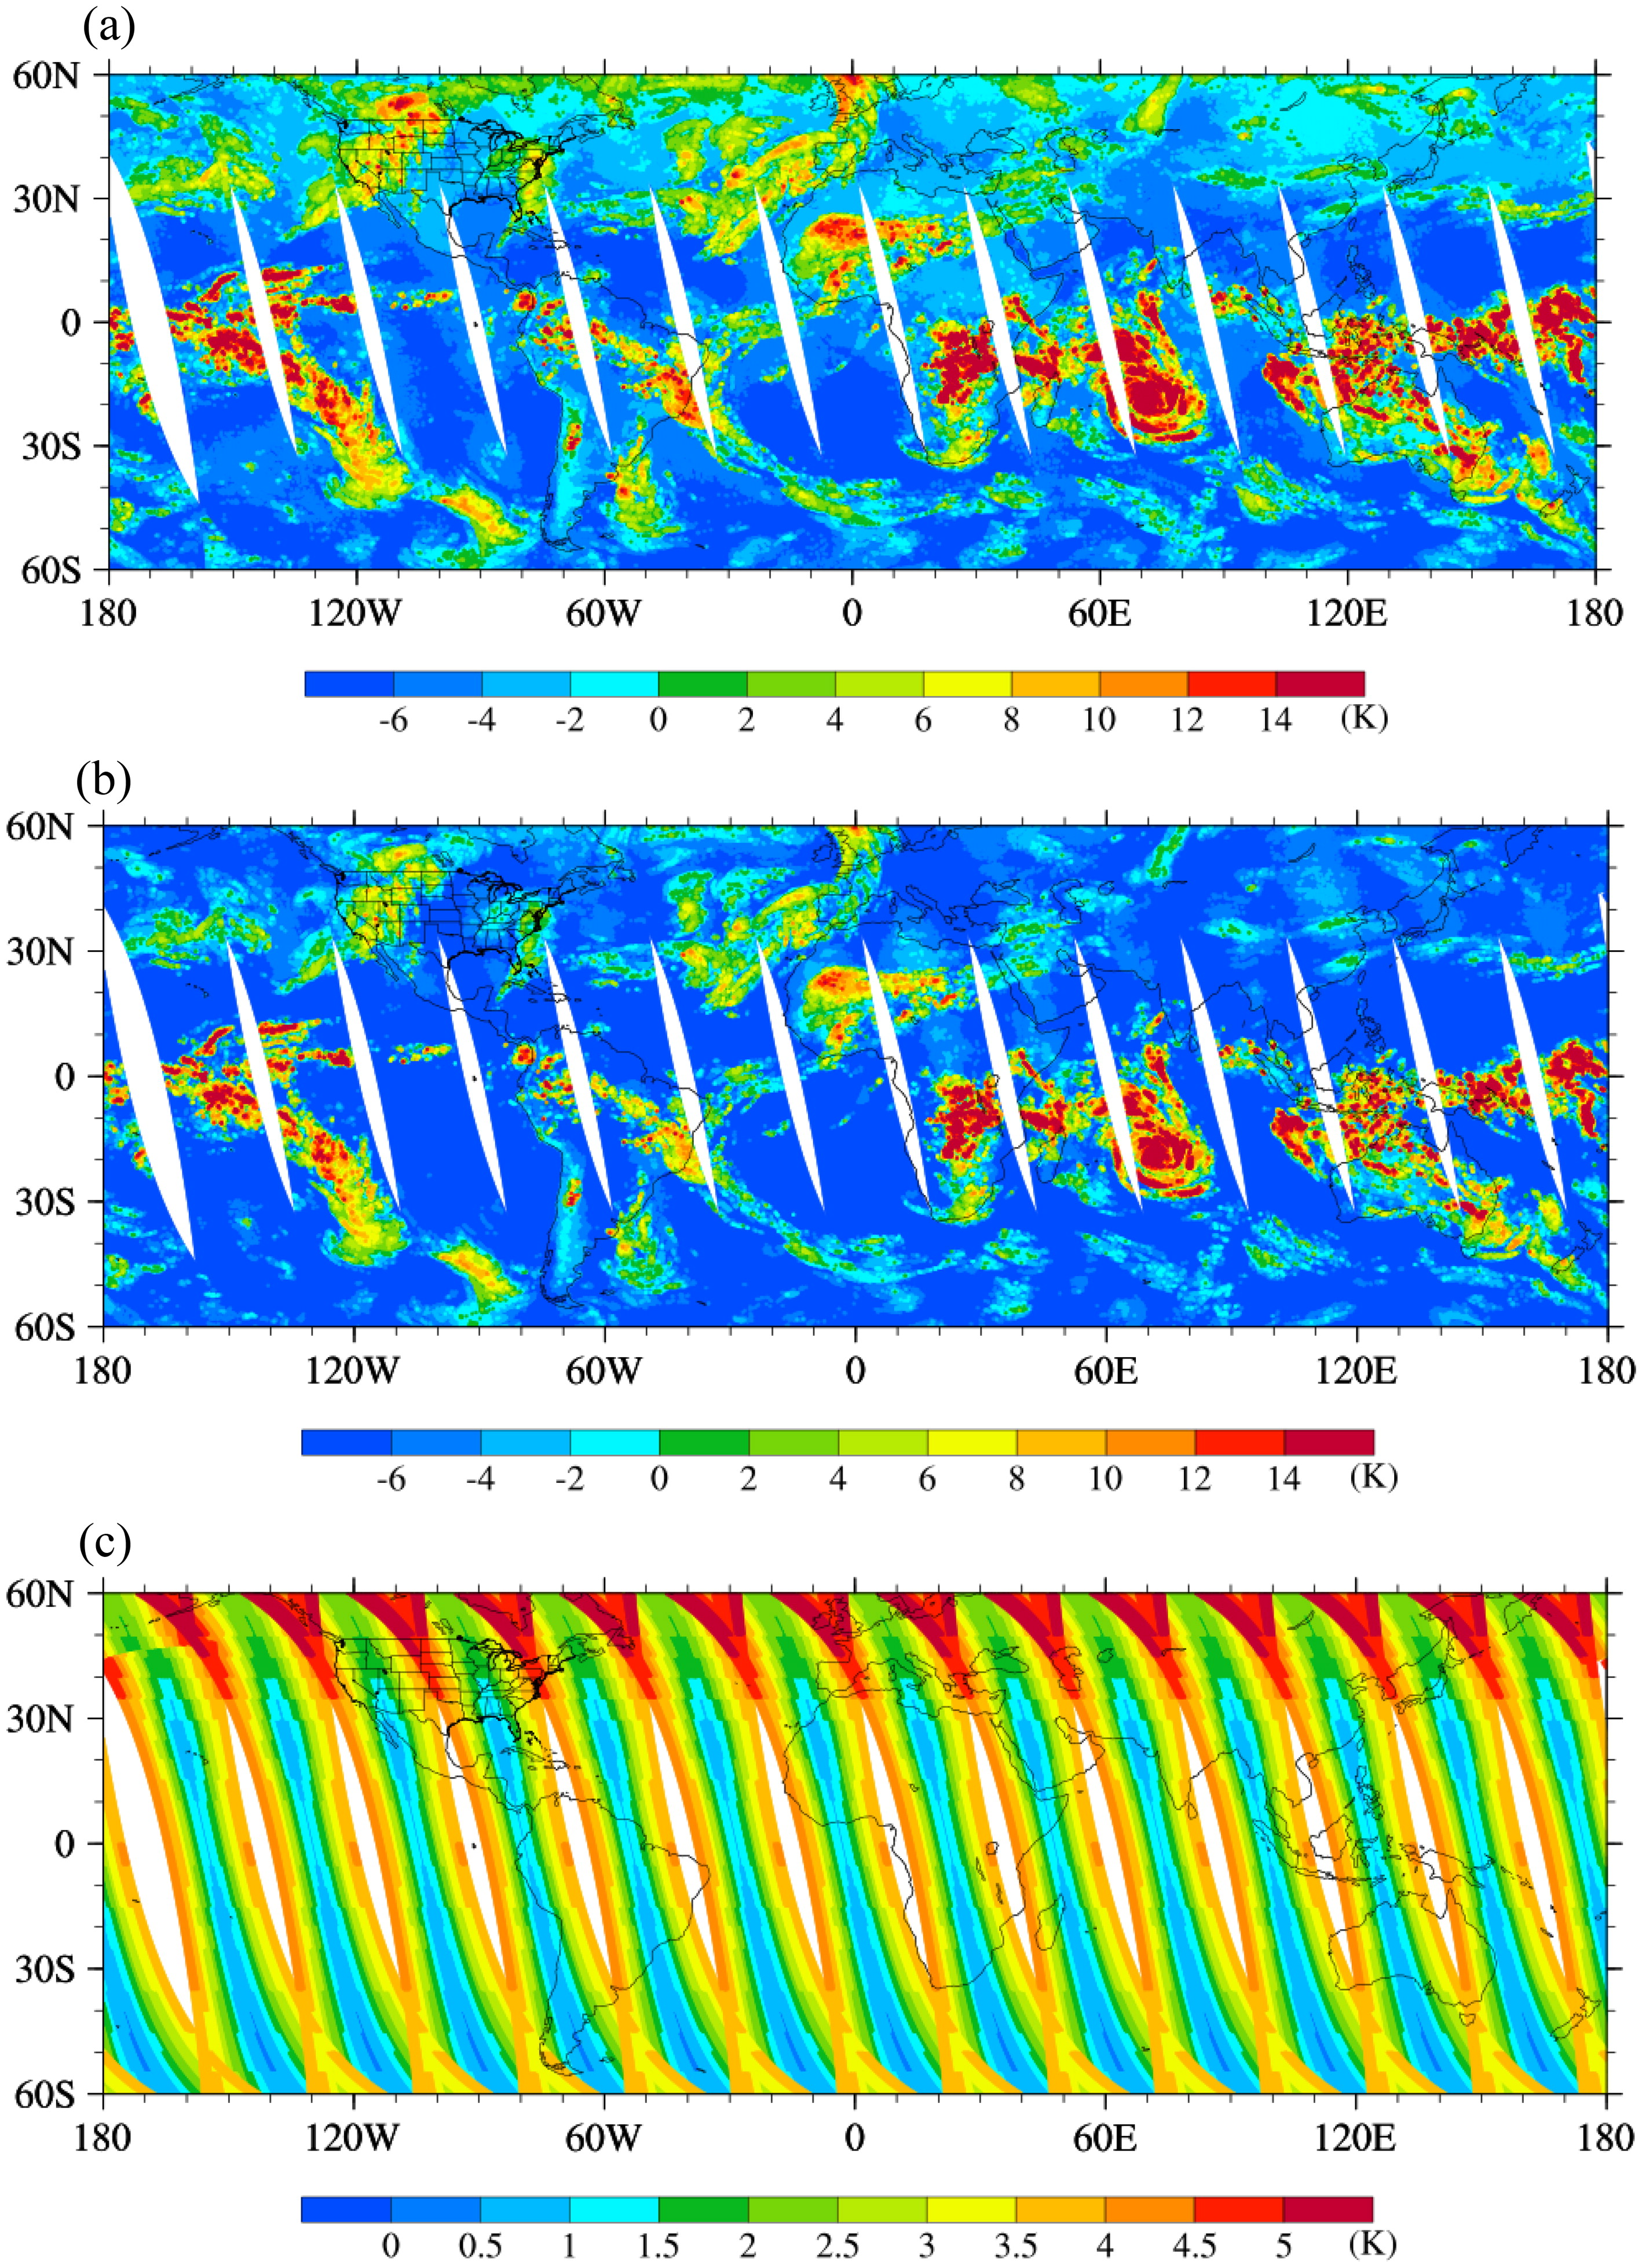
Fig. 9.
Spatial distributions of CESI-9 (a) without and (b) with bias correction at CrIS ascending nodes on 22 January 2016. (c) Differences between (a) and (b).
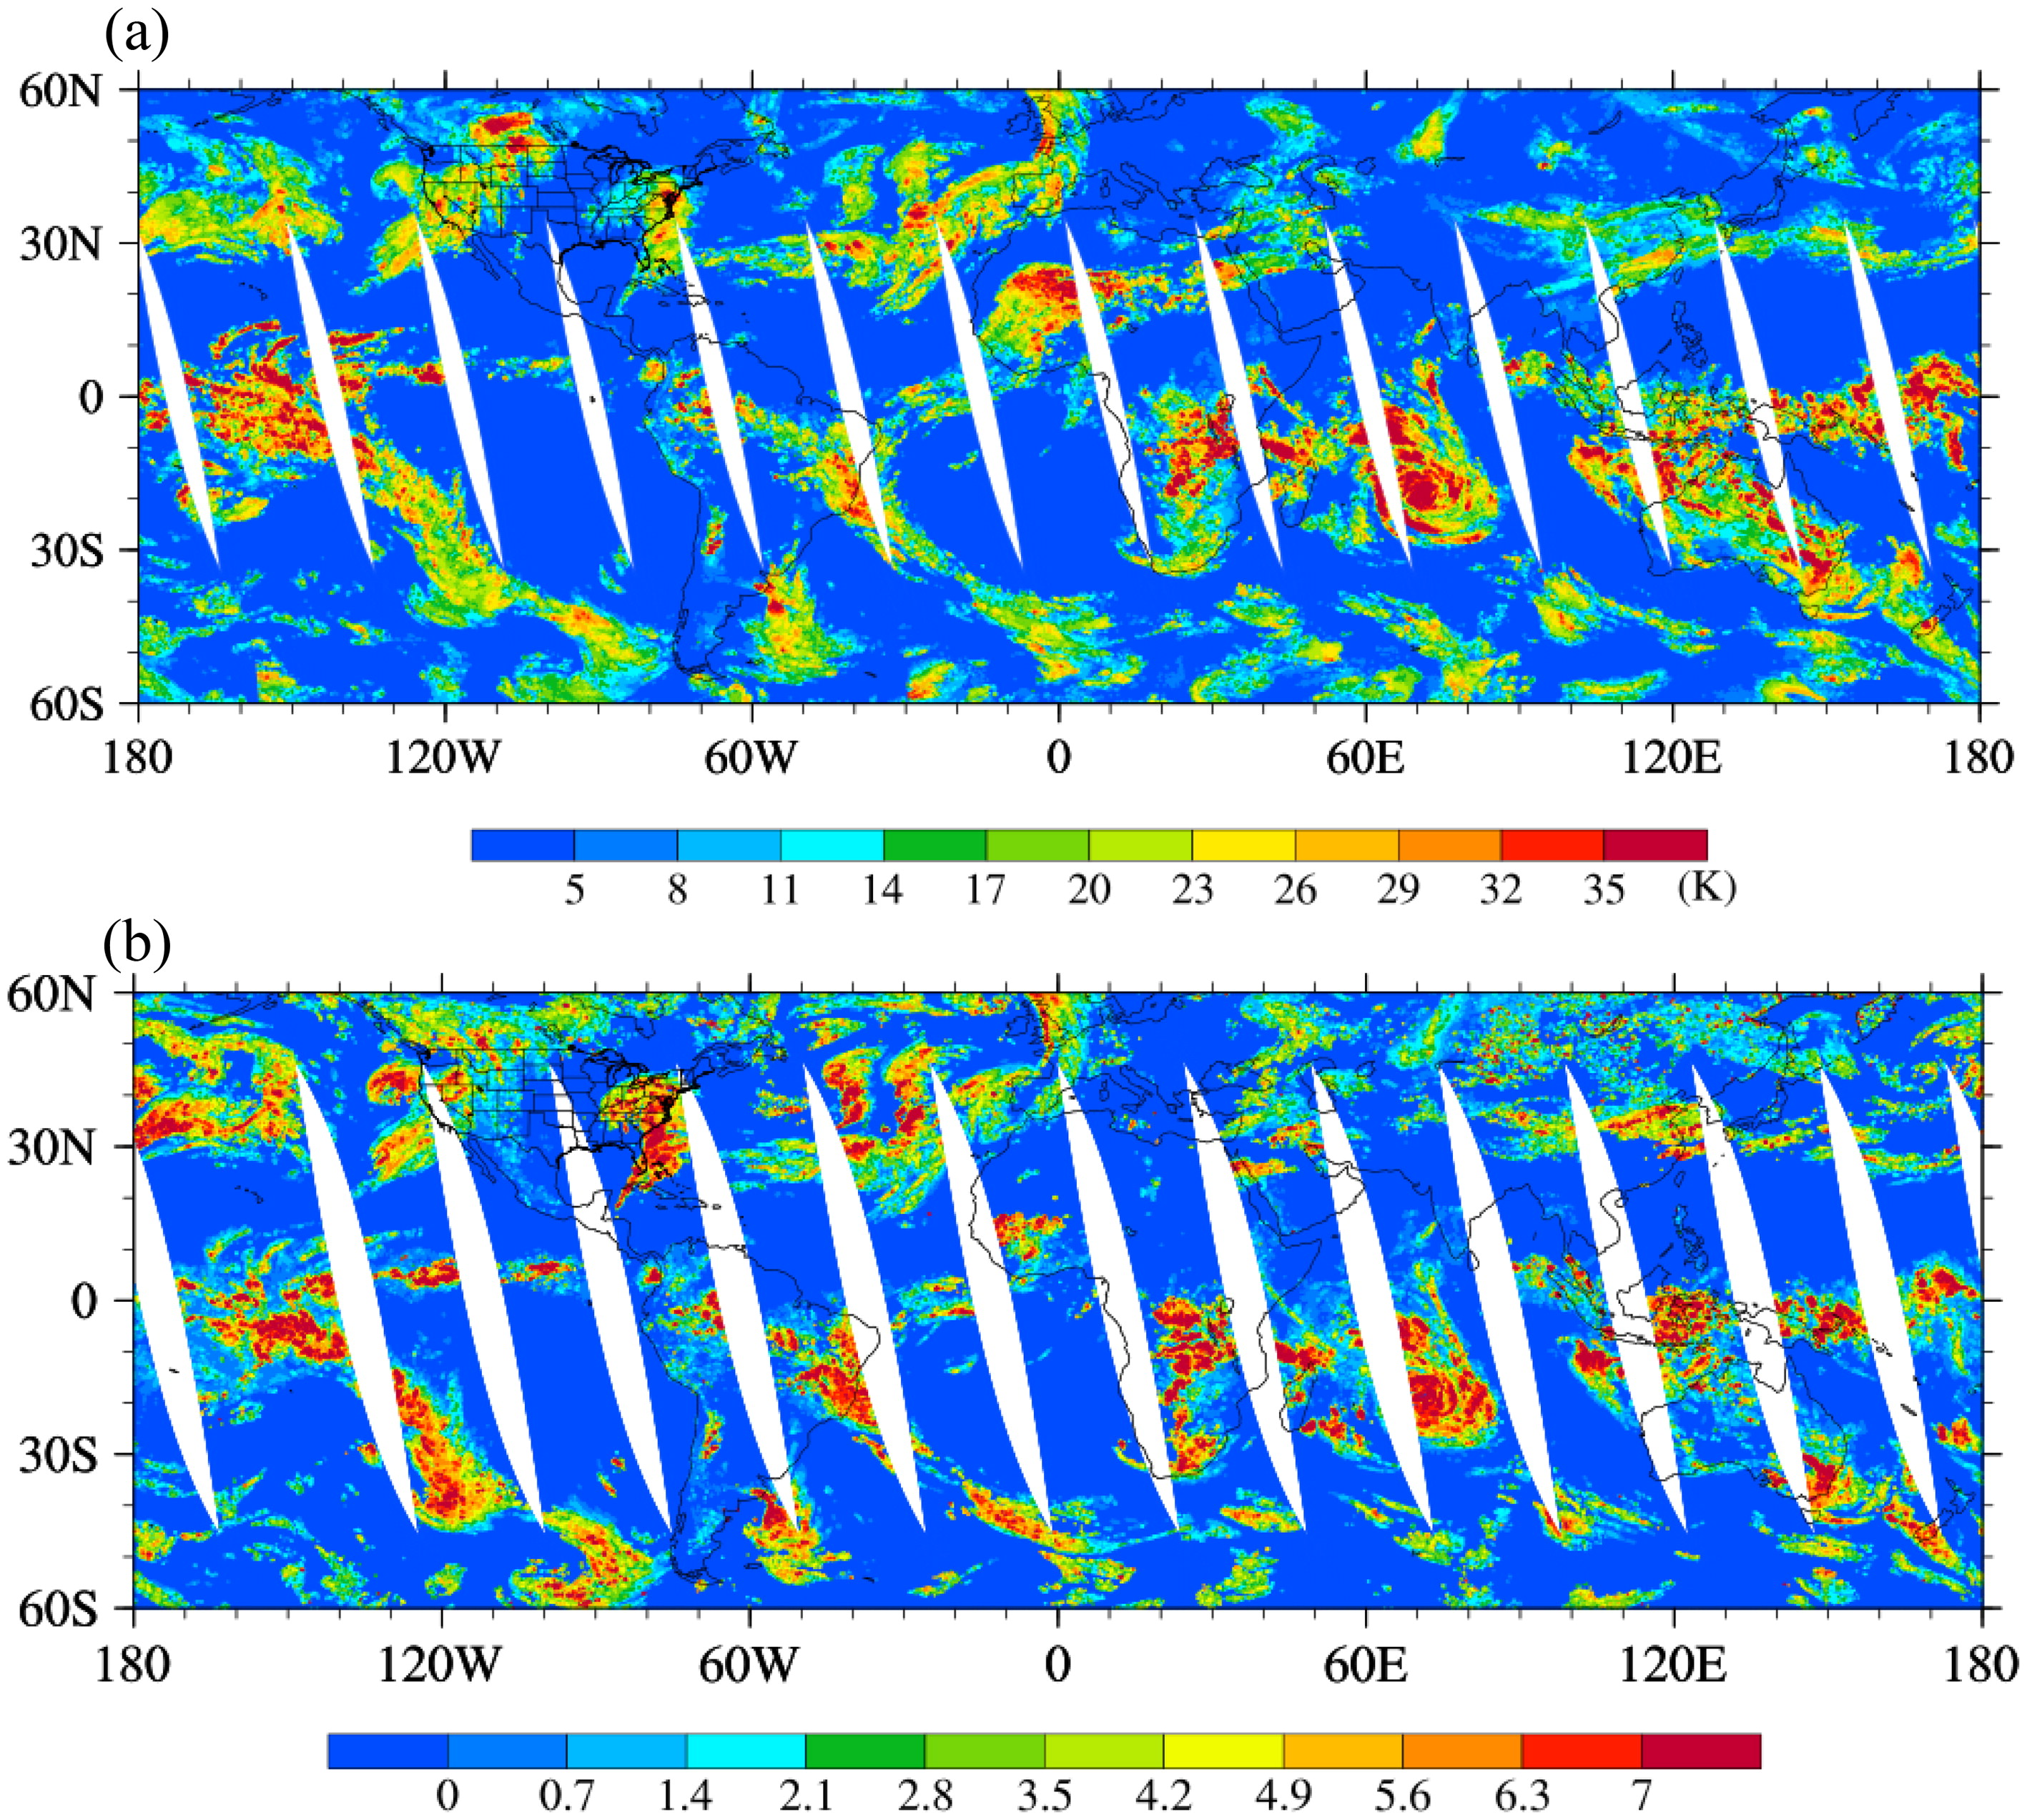
Fig. 10.
Spatial distributions of (a) CESI-19 and (b) AIRS version 6 ice cloud optical thickness from ascending nodes between 60°S and 60°N on 22 January 2016.
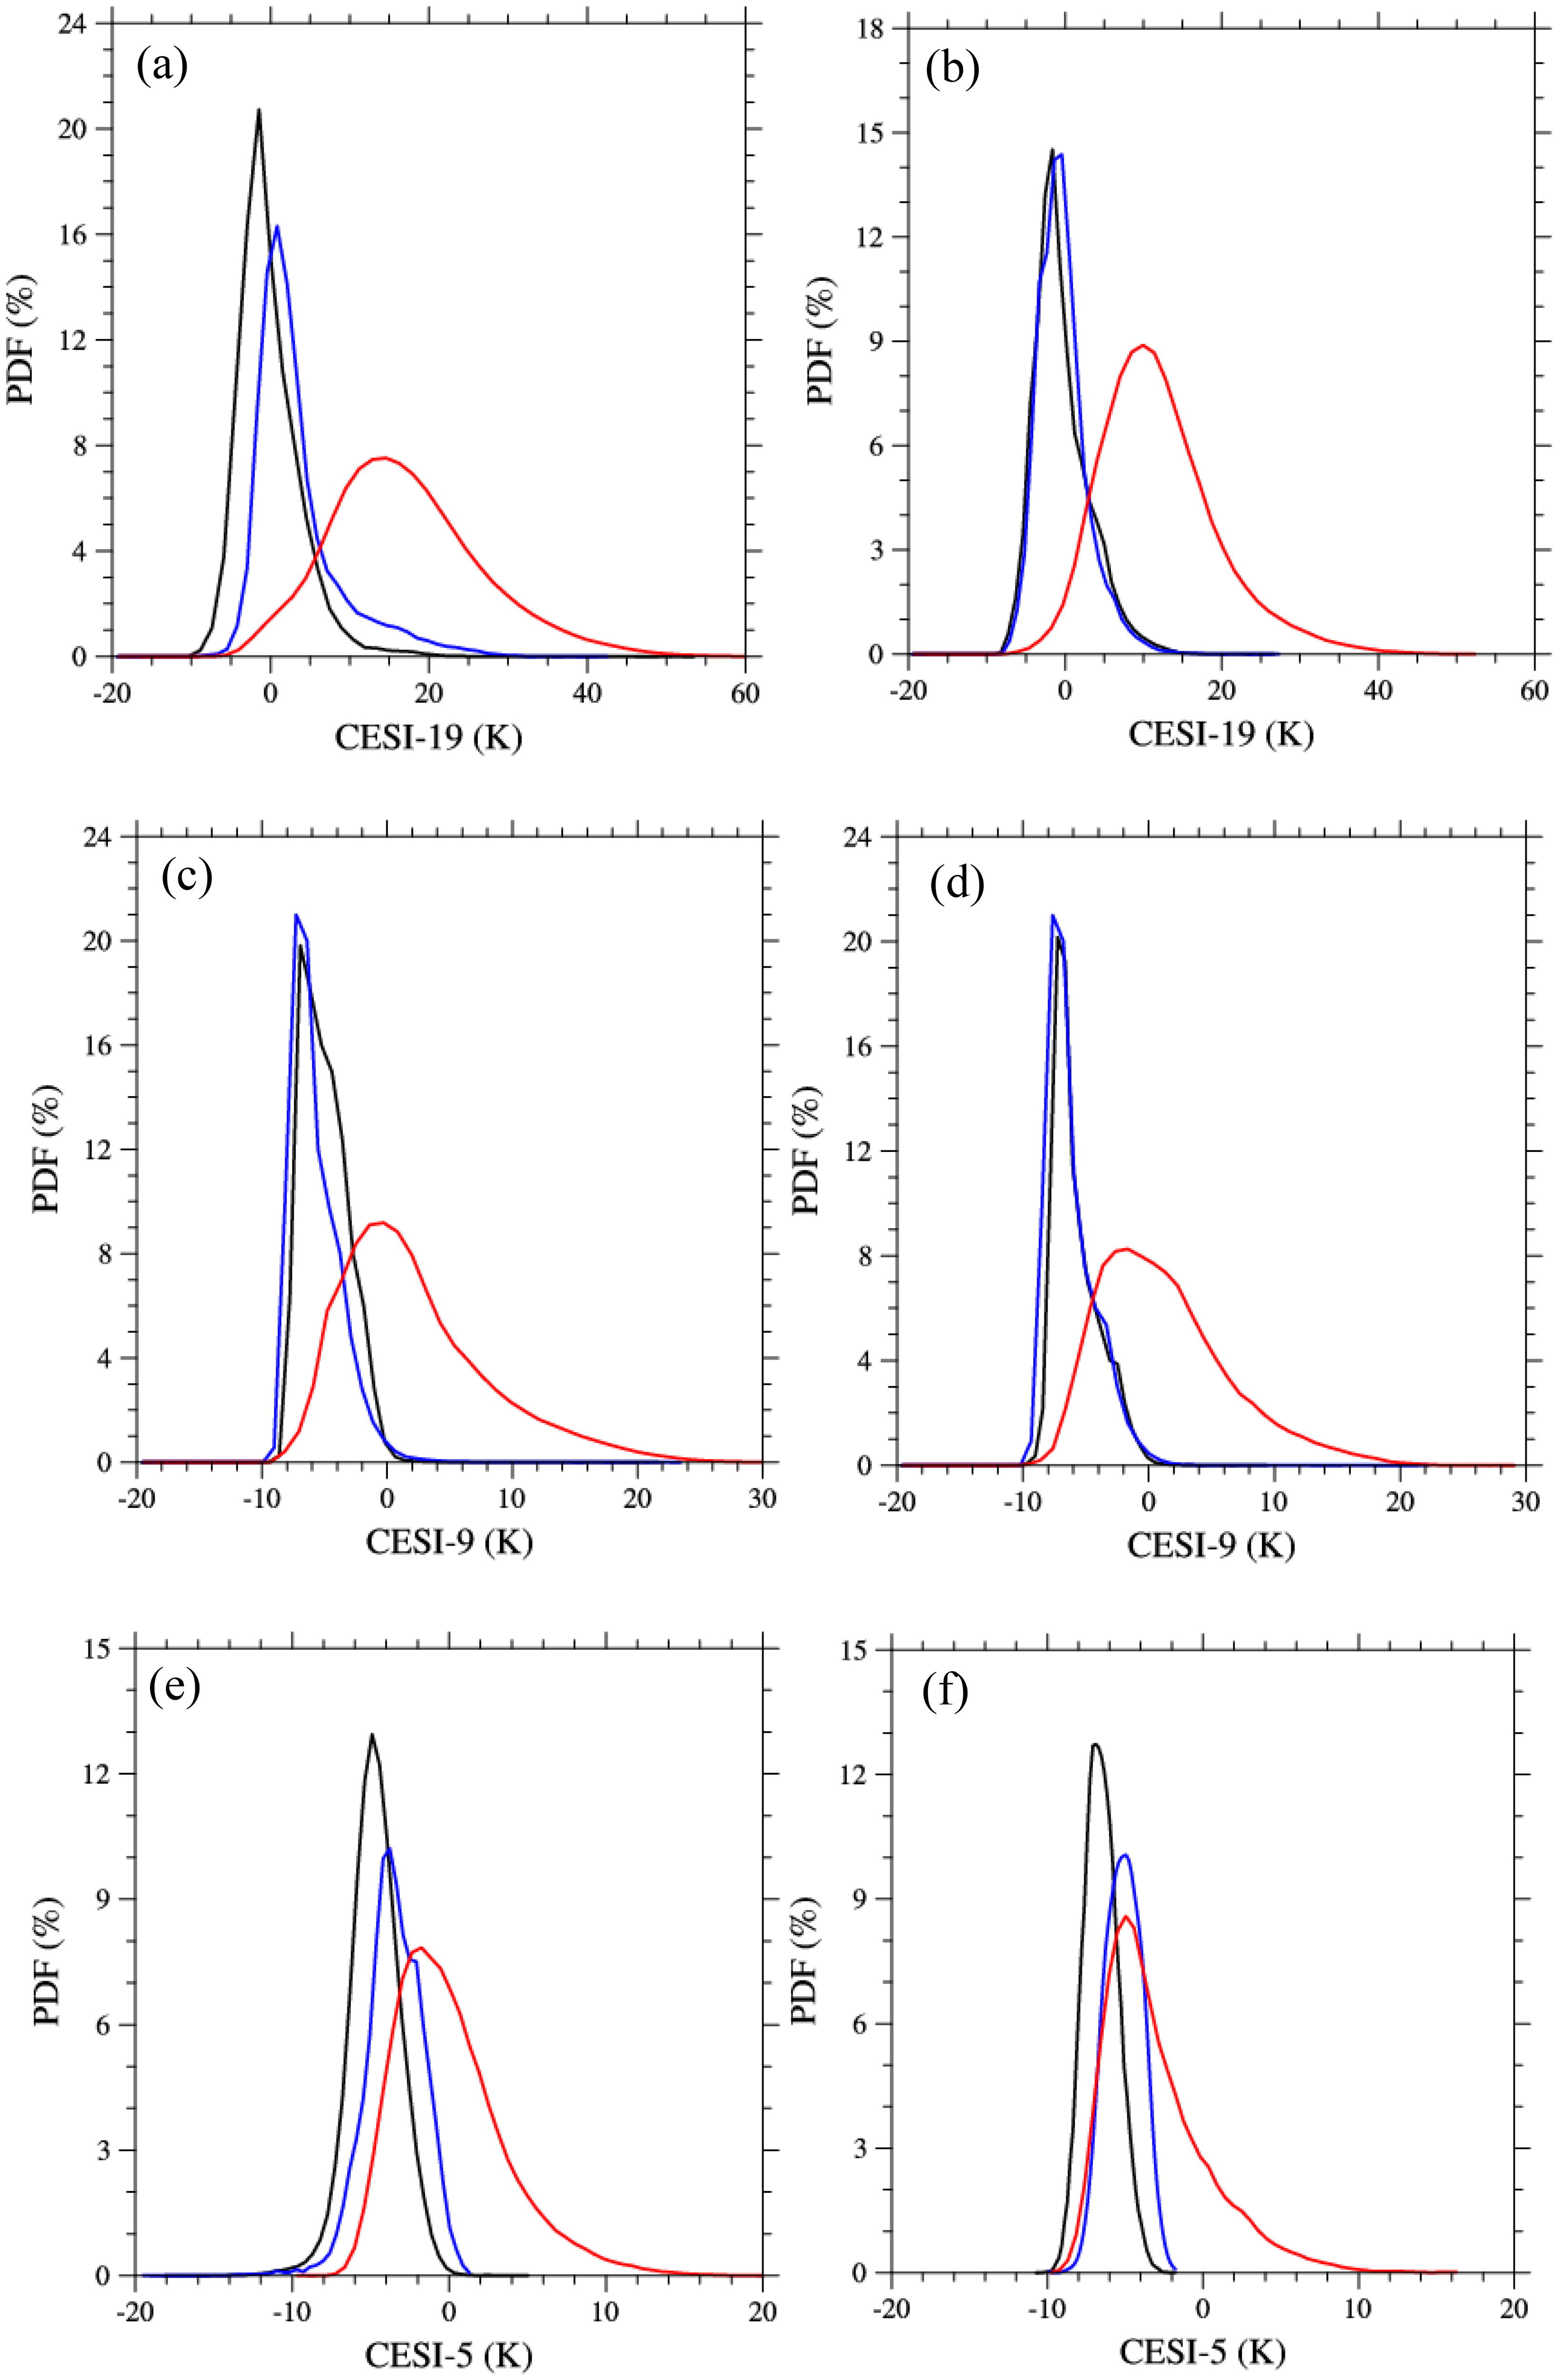
Fig. 11.
Probability distributions of (a, b) CESI-19, (c, d) CESI-9, and (e, f) CESI-5 under clear skies (black), water clouds (blue) and ice clouds (red) from AIRS-CrIS overlapped data points between 60°S and 60°N at ascending (left panels) and descending (right panels) nodes on 22 January 2016.
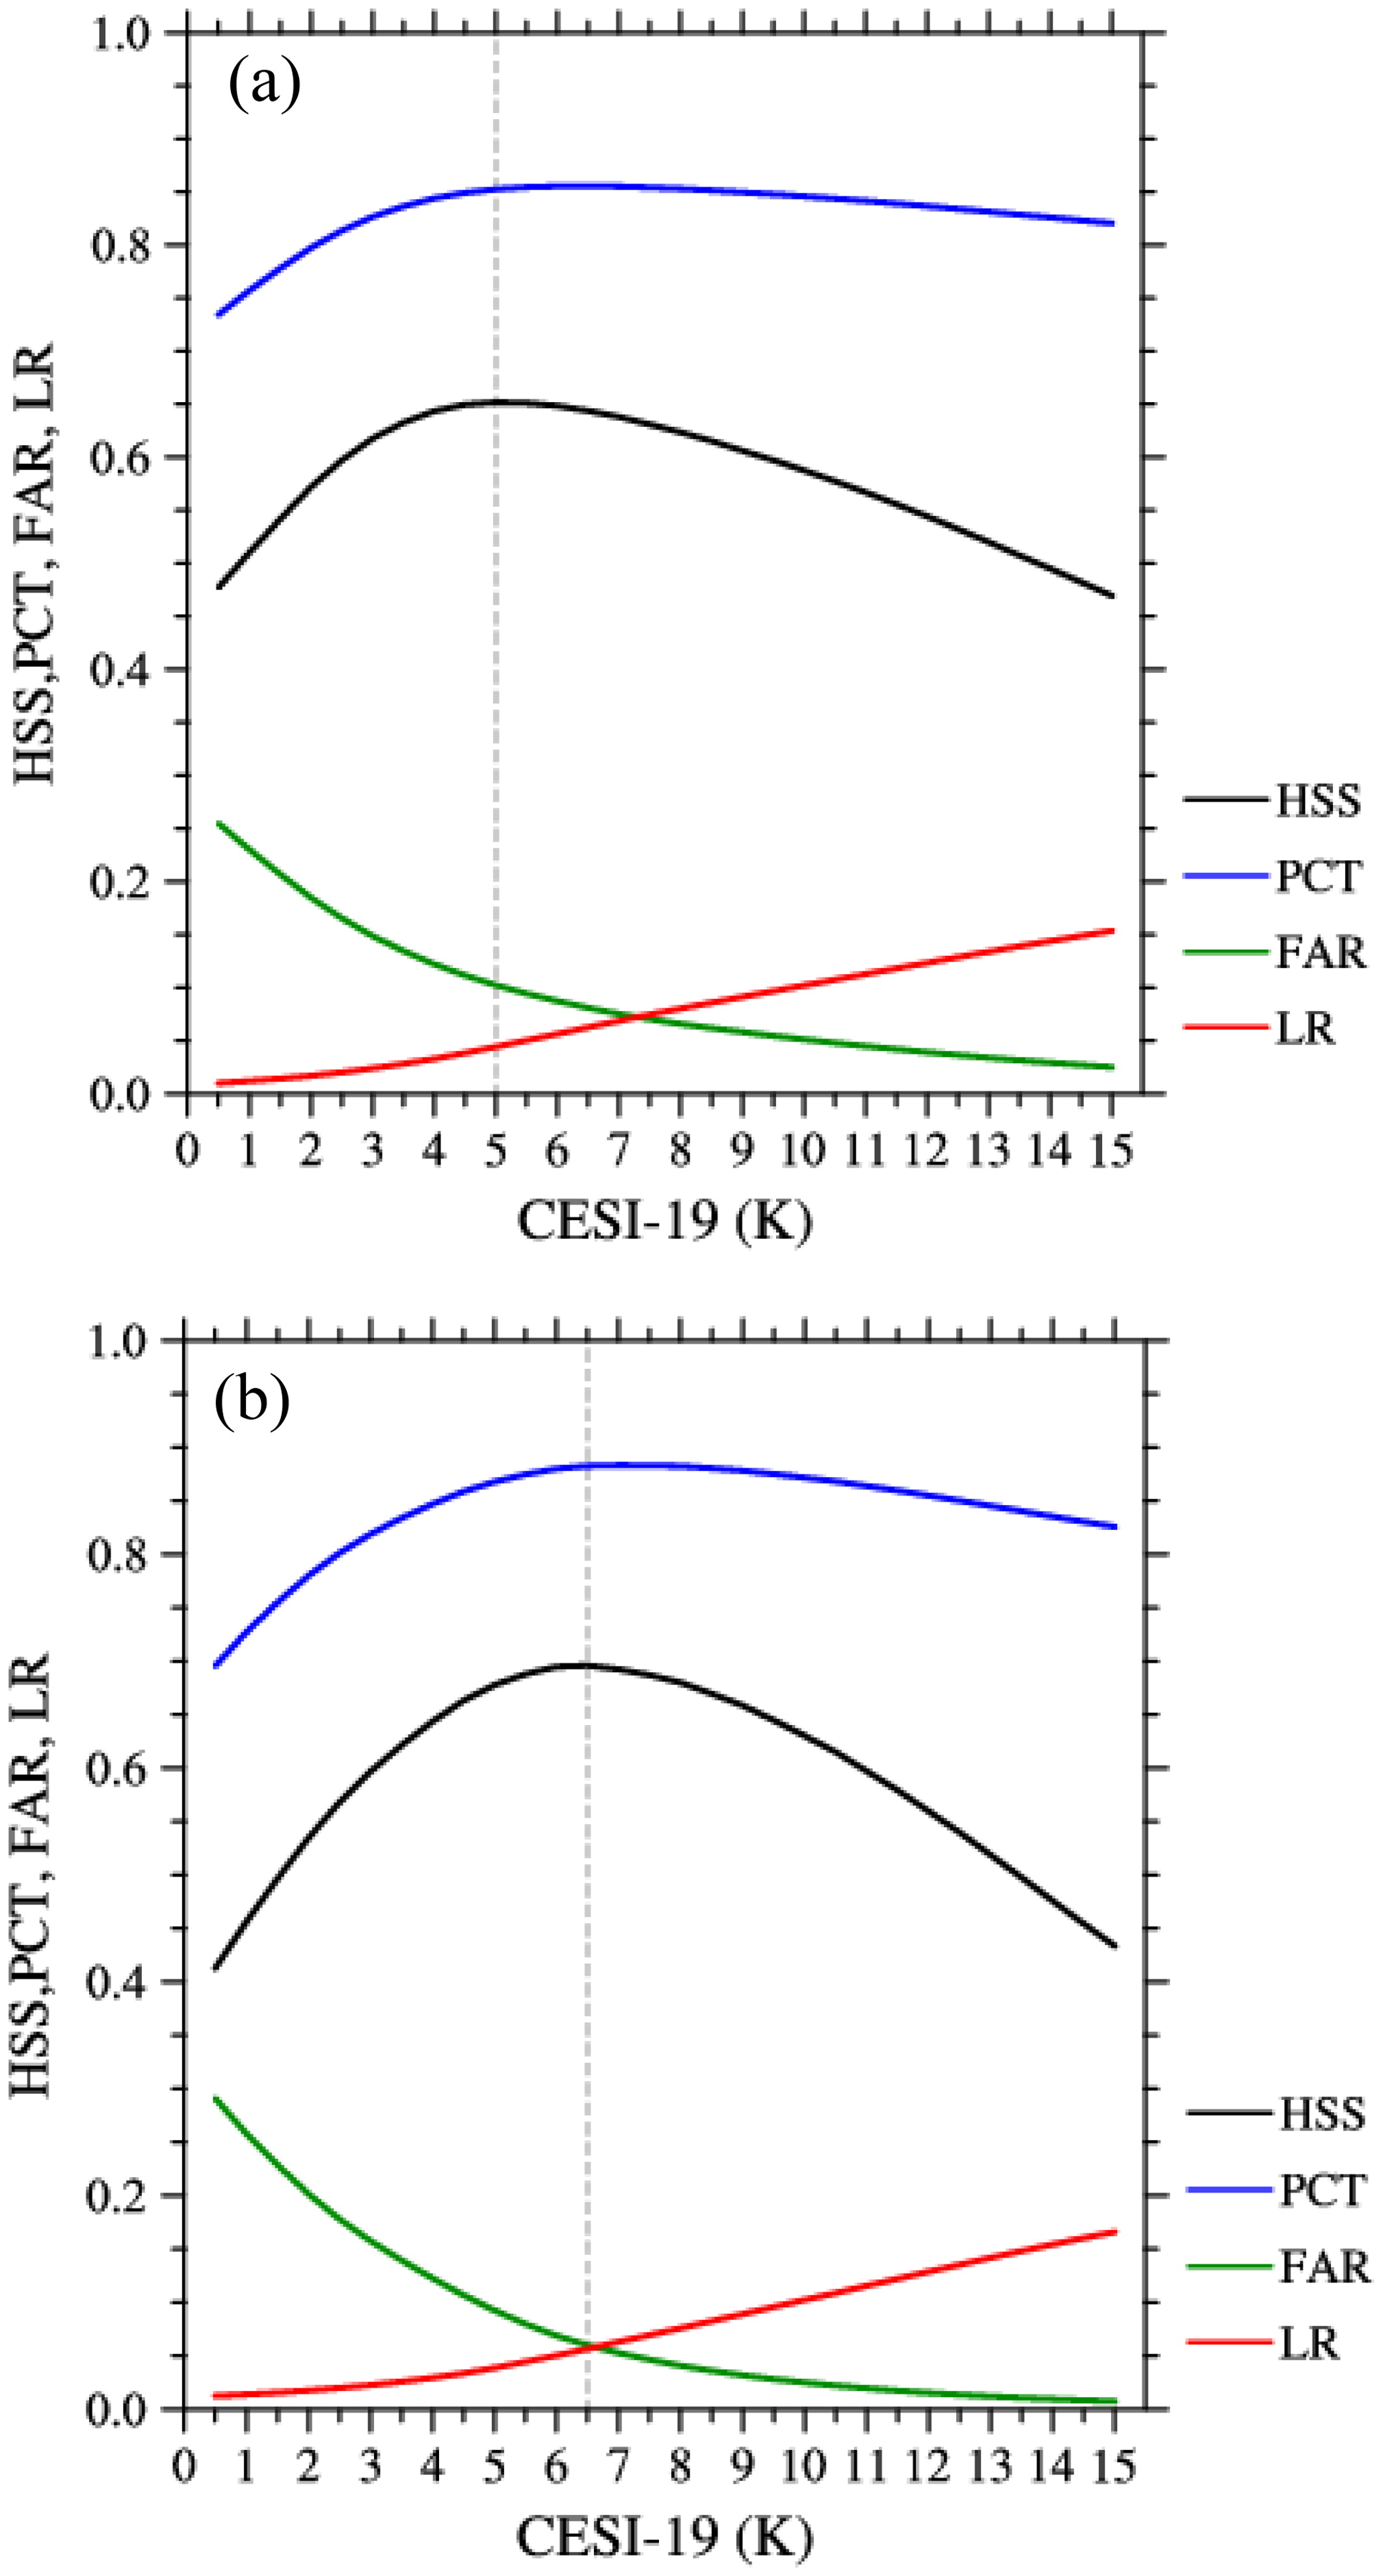
Fig. 12.
The probabilities of correct typing (PCT, blue), the false alarm rate (FAR, green), the leakage rate (LR, red), and the Heike skill score (HSS, black) of different thresholds of CESI-19 and ICOD from (a) ascending and (b) descending nodes on 22 January 2016. ‘True’ data are ICOD data. The black dotted line is set at the maximum HSS value.
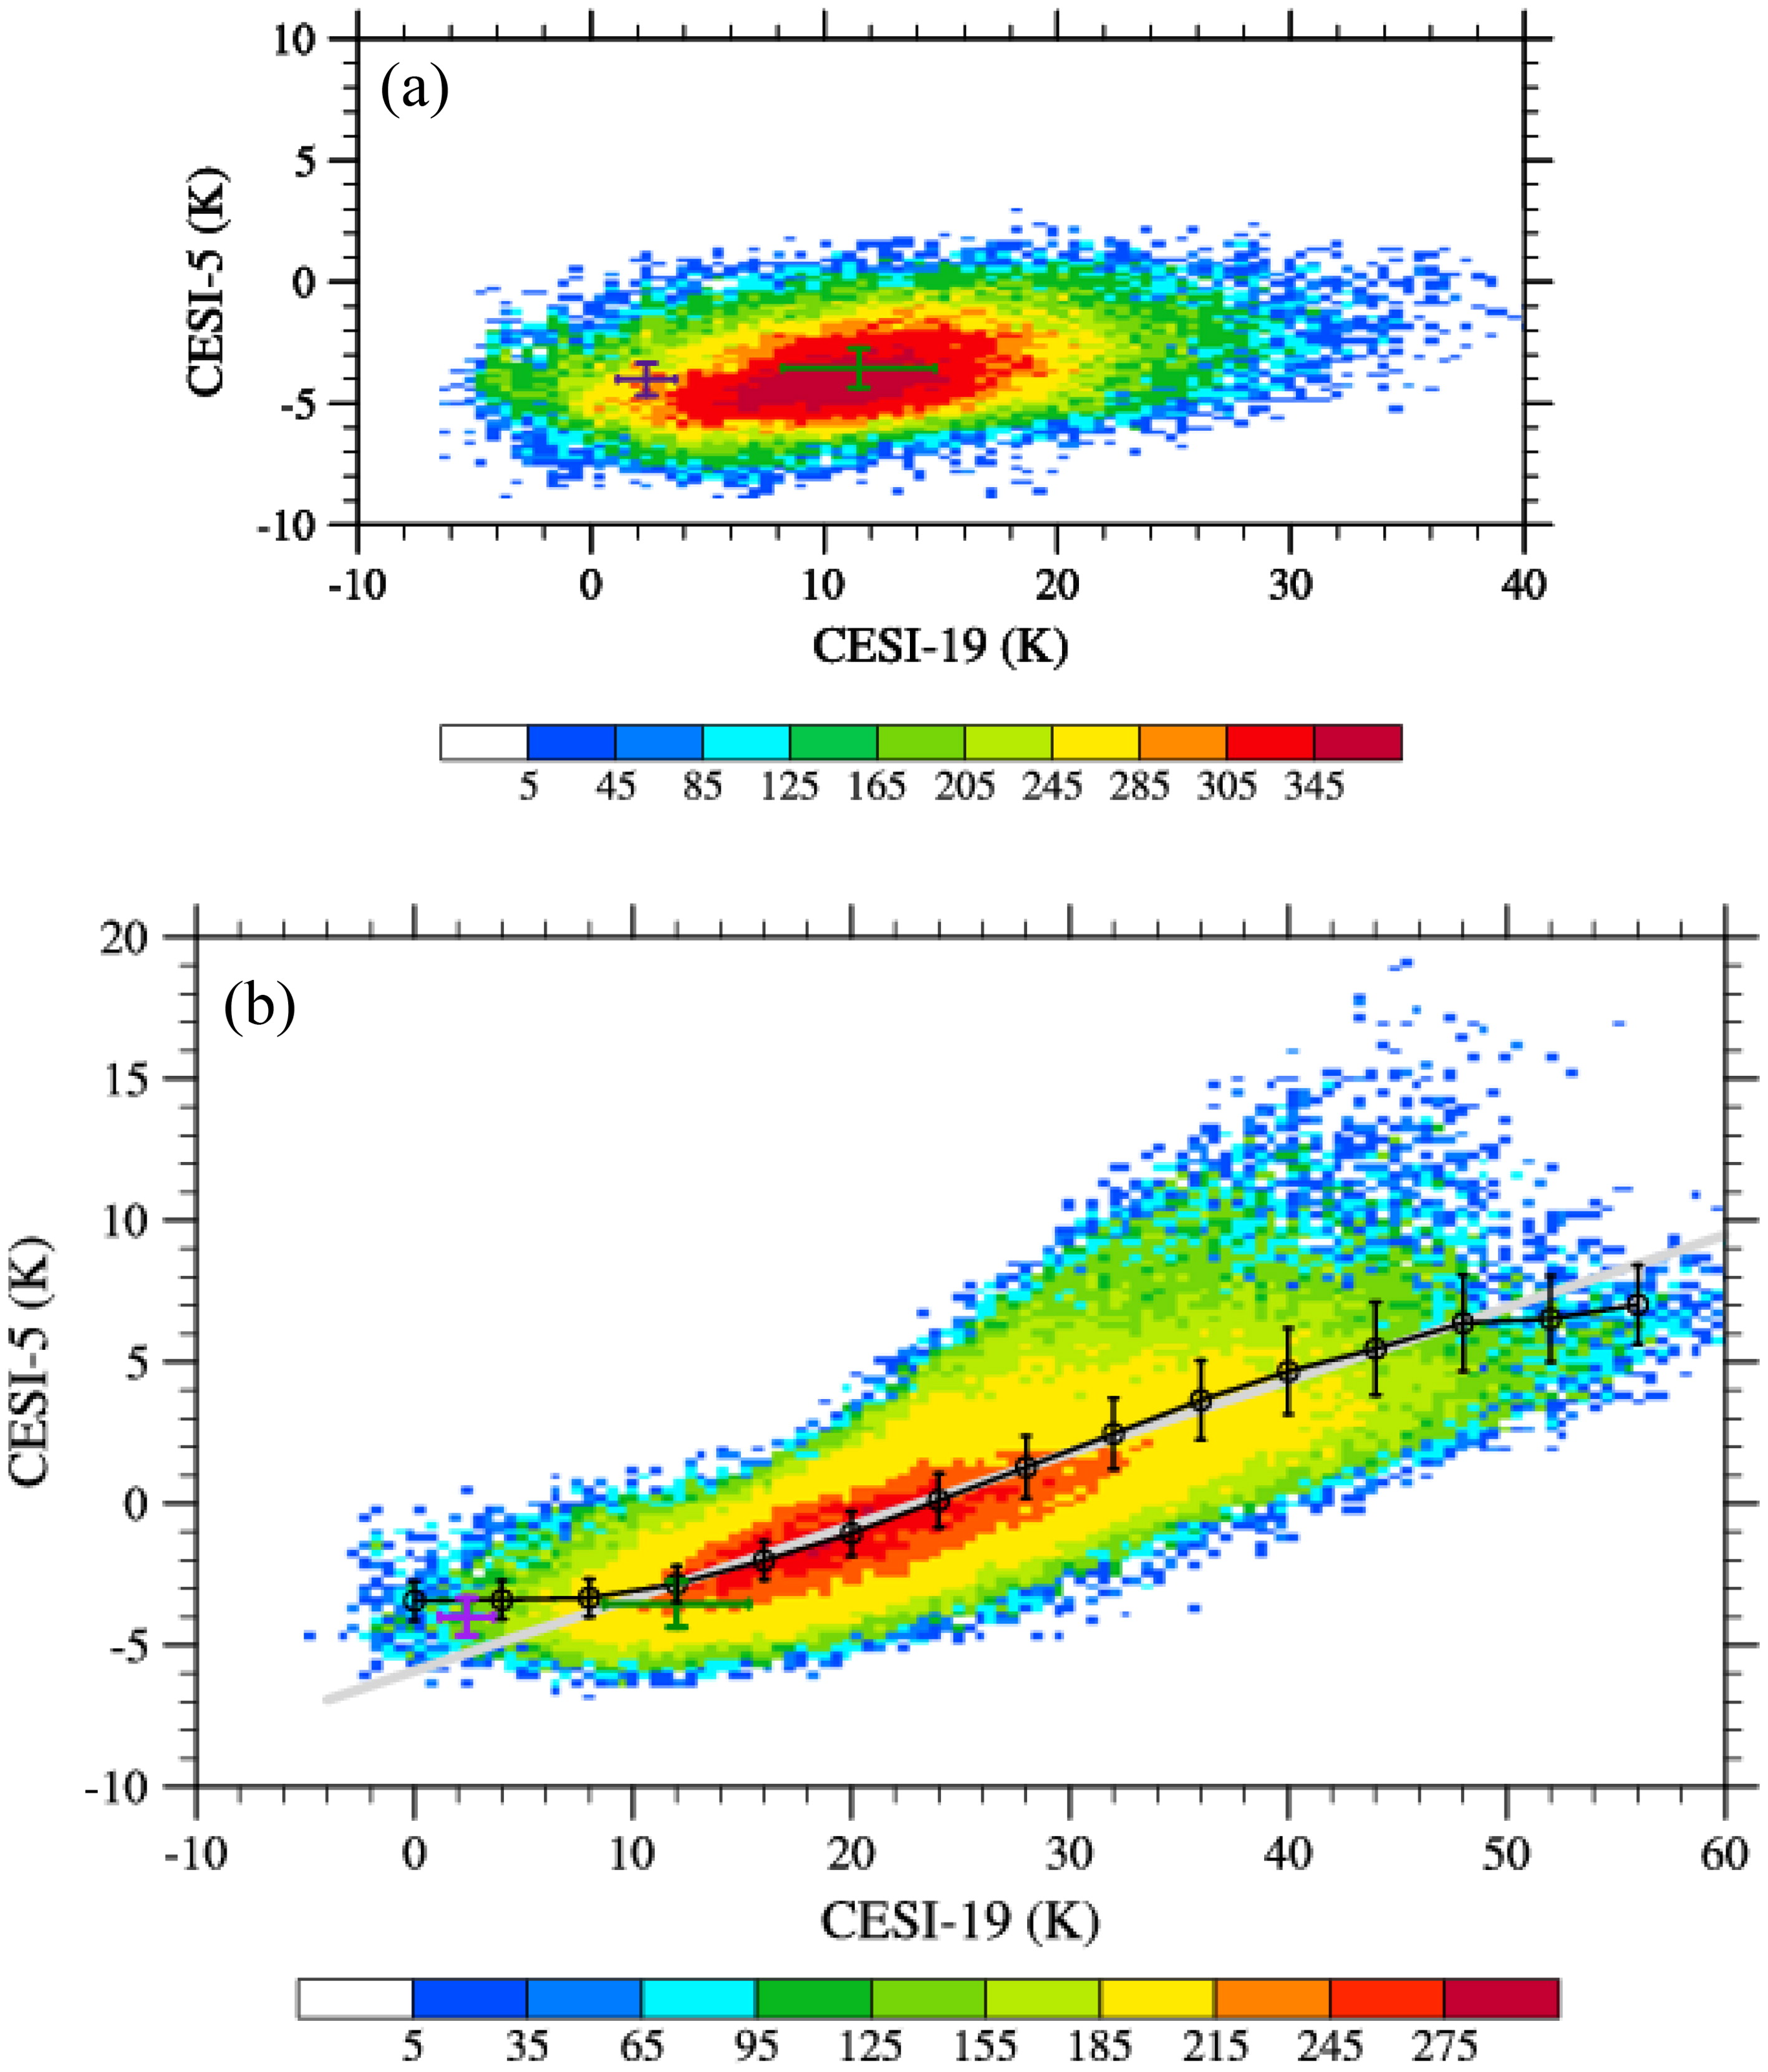
Fig. 13.
CESI-19 and CESI-5 data counts (bin size: 0.5 K × 0.25 K) when (a) ICOD > 0, CTP > 300 hPa, and (b) ICOD > 0, CTP300 hPa. The crosses are the means and standard deviations of the CESIs of the coordinate axes under clear-sky (purple) and ICOD > 0, CTP > 300 hPa (green) conditions. The black curves connect the means (black dots) and standard deviations (vertical lines) of CESI-5 in each CESI-19 4-K bin (x-axis). AIRS-overlapped CrIS data points between 60°S and 60°N from the ascending swaths during 23–28 January 2016 are used.
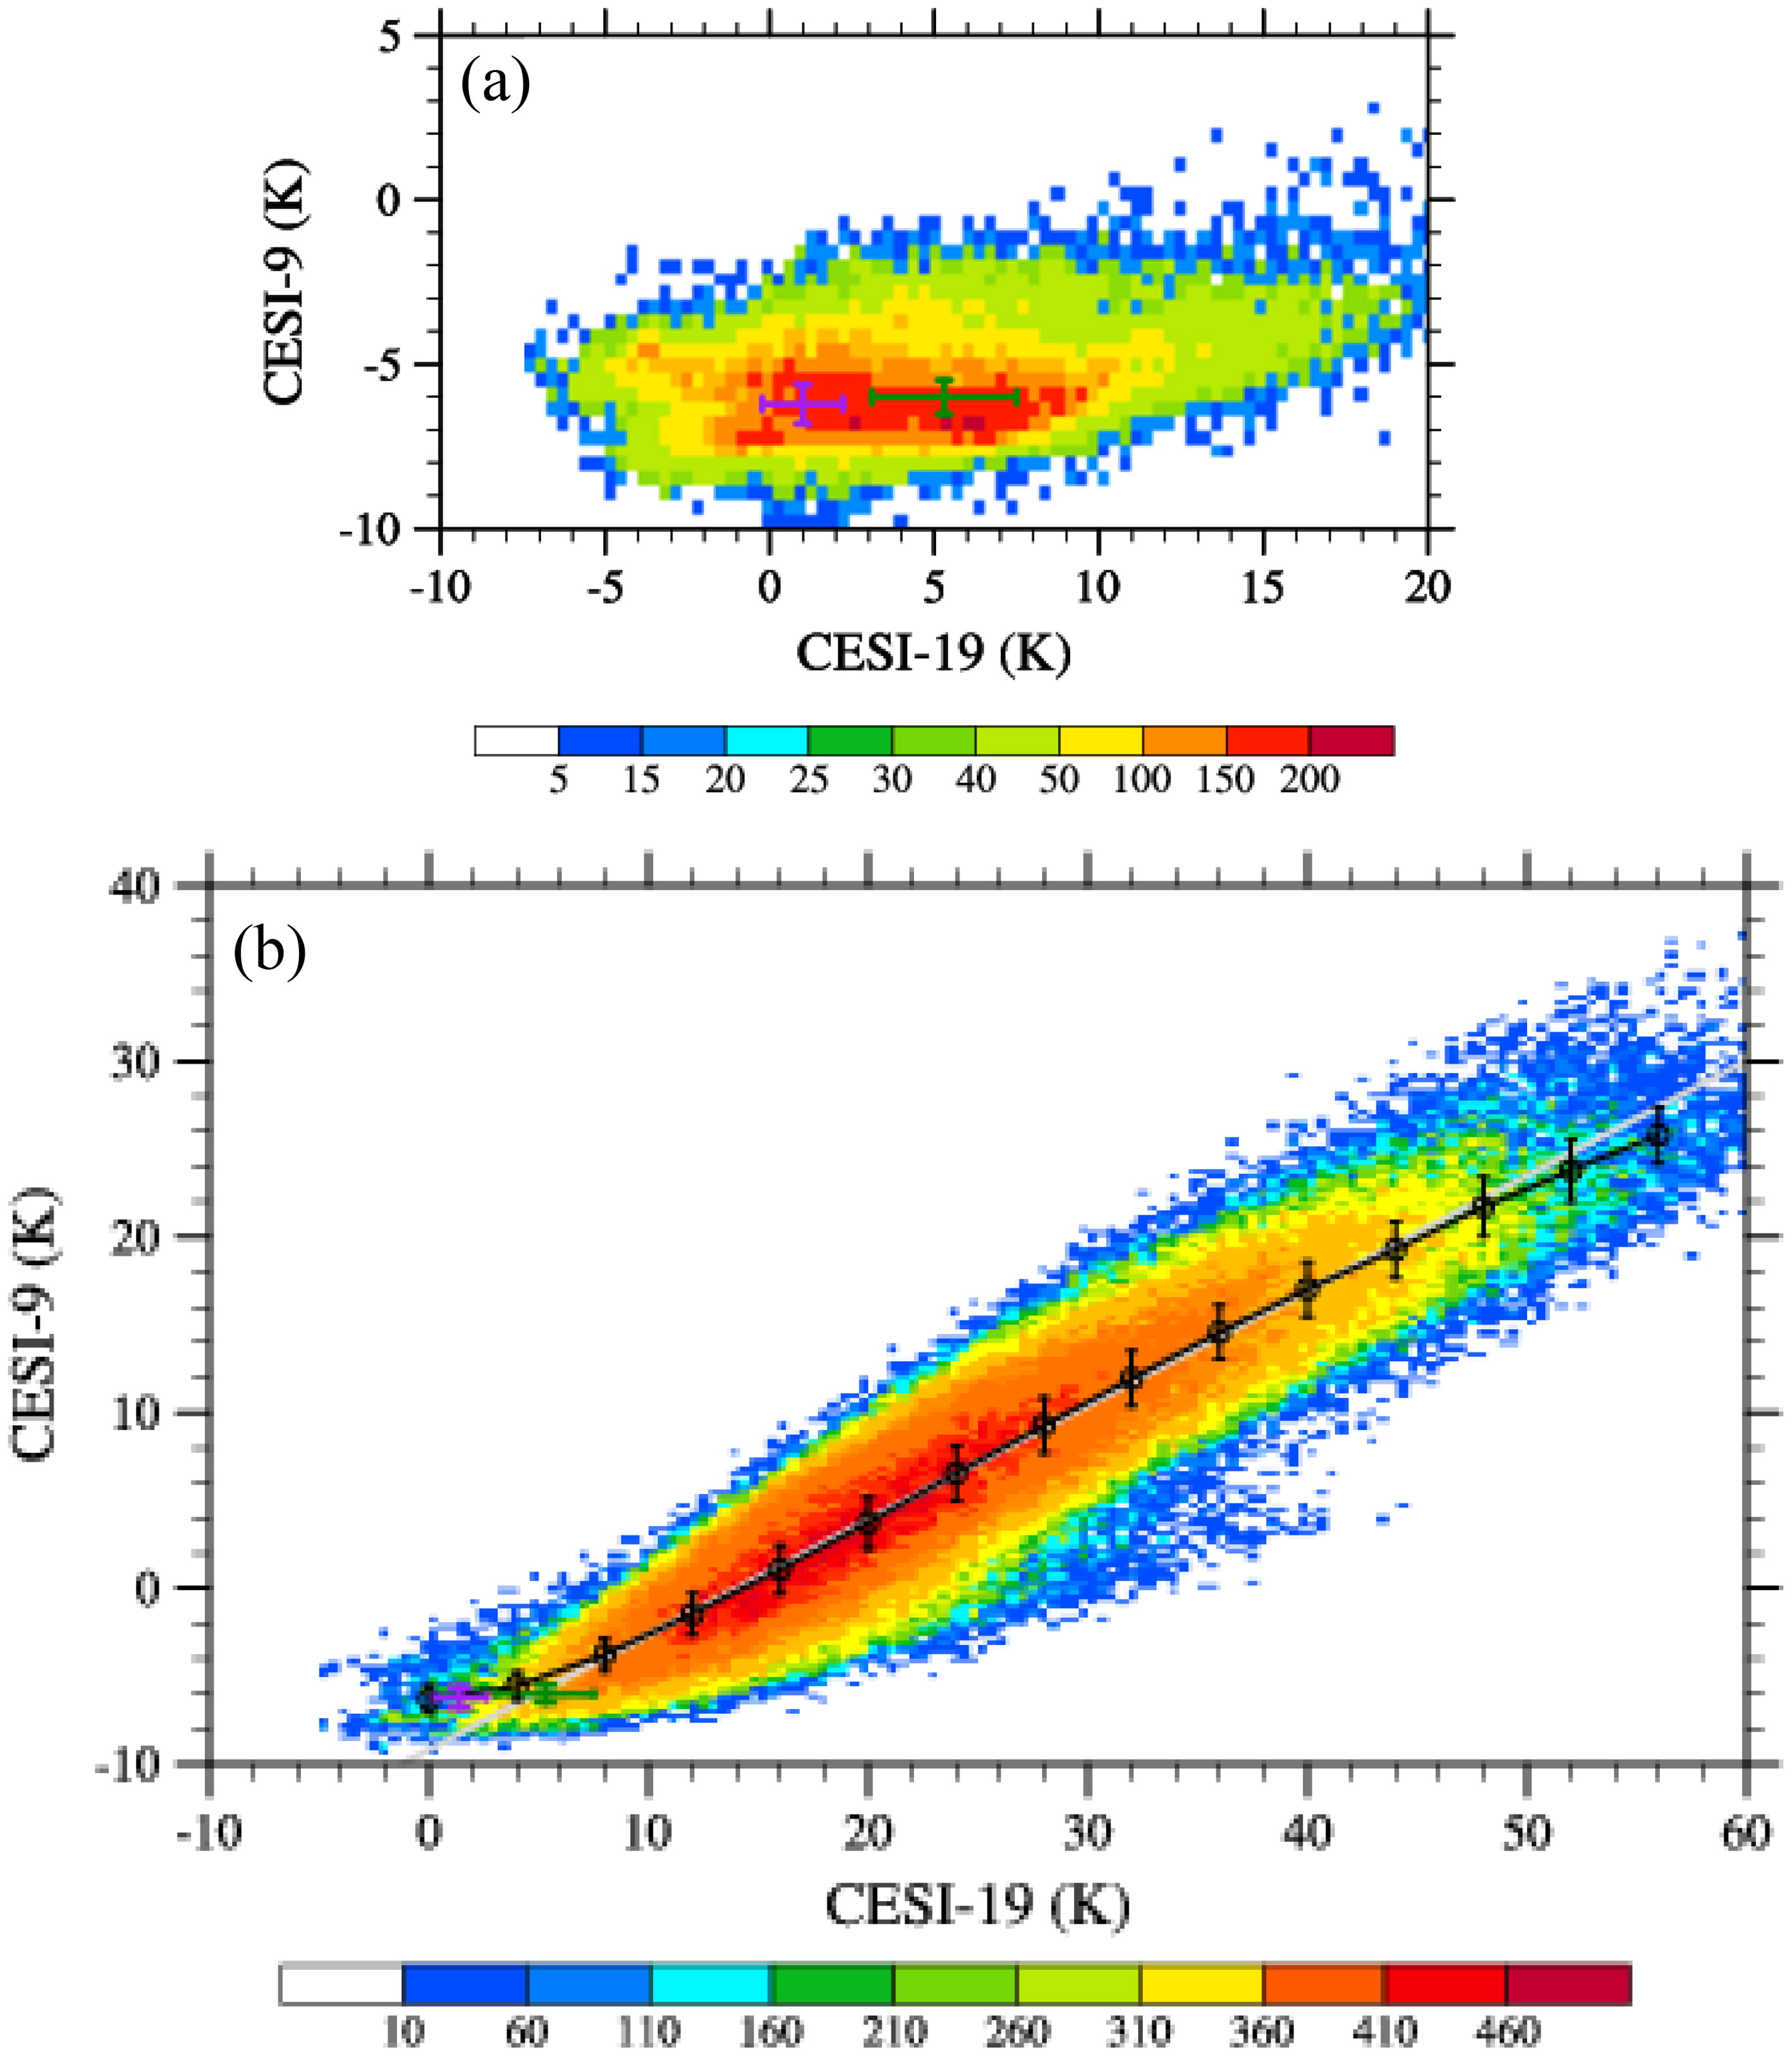
Fig. 14.
Same as Fig. 13 except for CESI-19 and CESI-9 data counts when (a) ICOD > 0, CTP > 600 hPa, and (b) ICOD > 0, CTP600 hPa. The crosses are the means and standard deviations of the CESIs of the coordinate axes under clear-sky (purple) and ICOD > 0, CTP > 600 hPa (green) conditions.
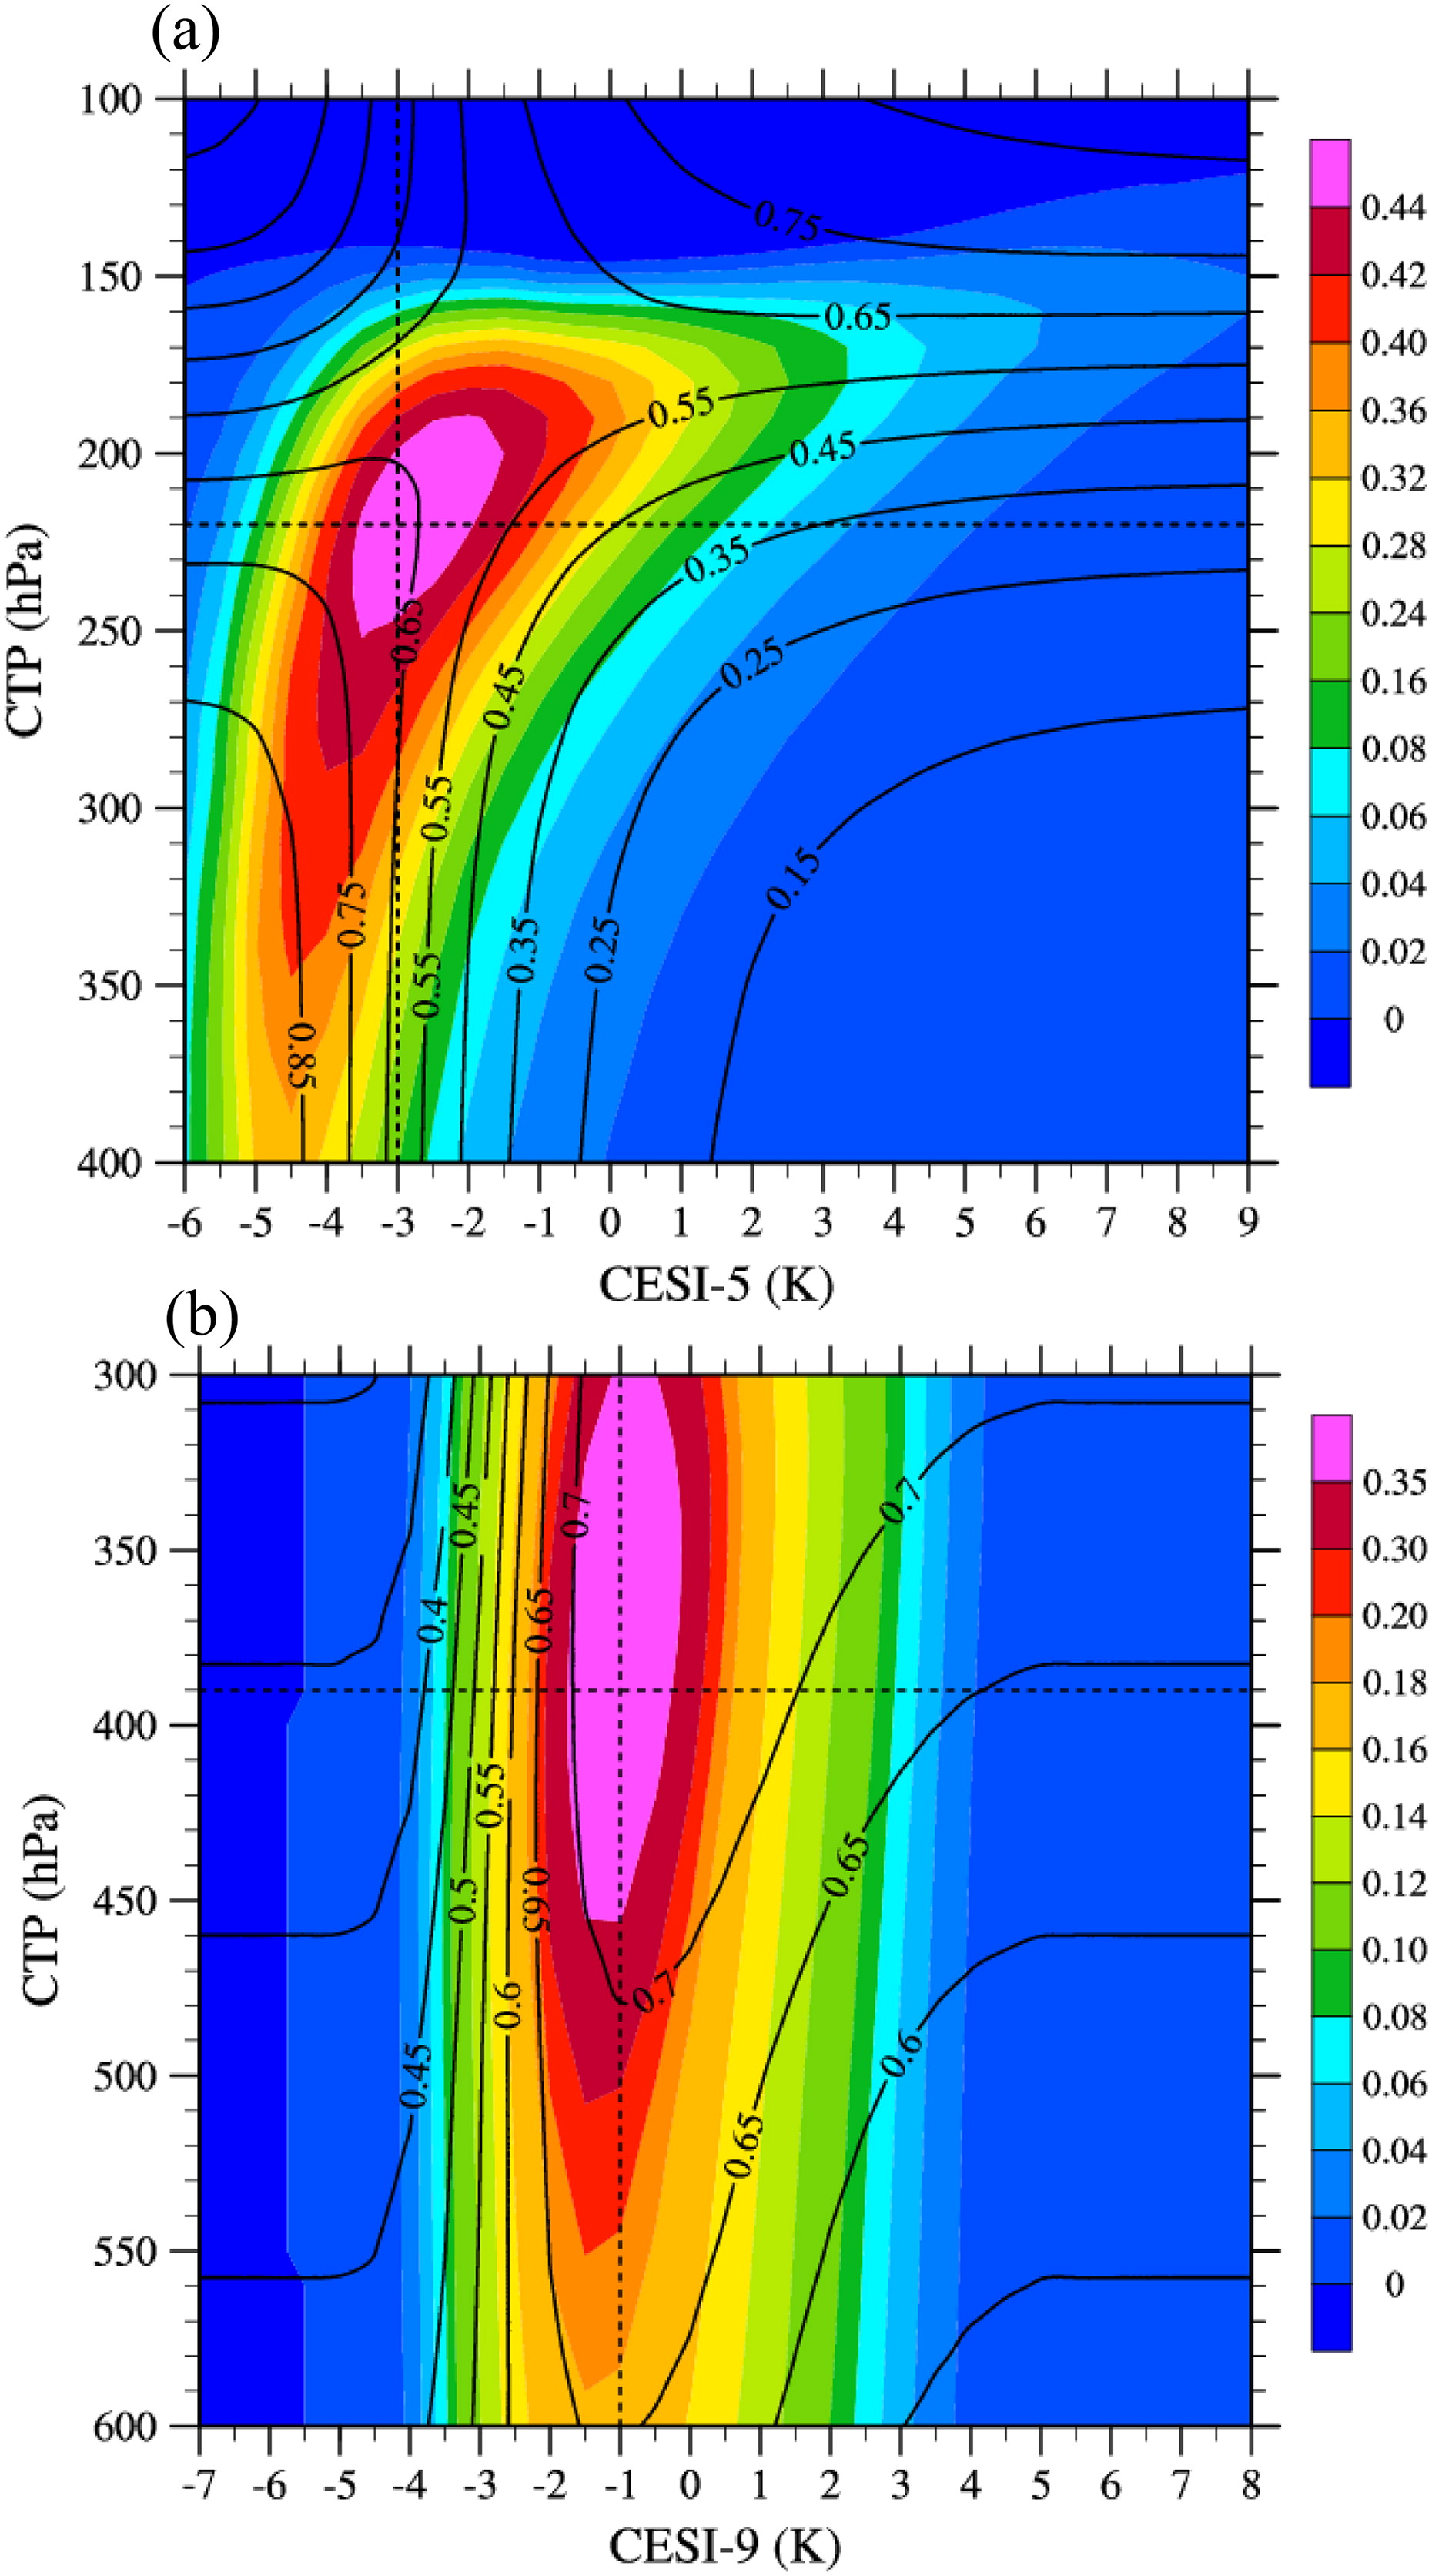
Fig. 15.
(a) The Heike skill score (color shading), probability of correct typing (black lines) for the (a) CESI-5 with the cloud top pressure of ice clouds and (b) CESI-9 with cloud top pressure of ice clouds under condition of CESI-5−3 K from ascending nodes during 22 January 2016. The black dashed lines represent the maximum Heike skill score locations (a) (−3 K, 220 hPa) and (b) (−1 K, 390 hPa).
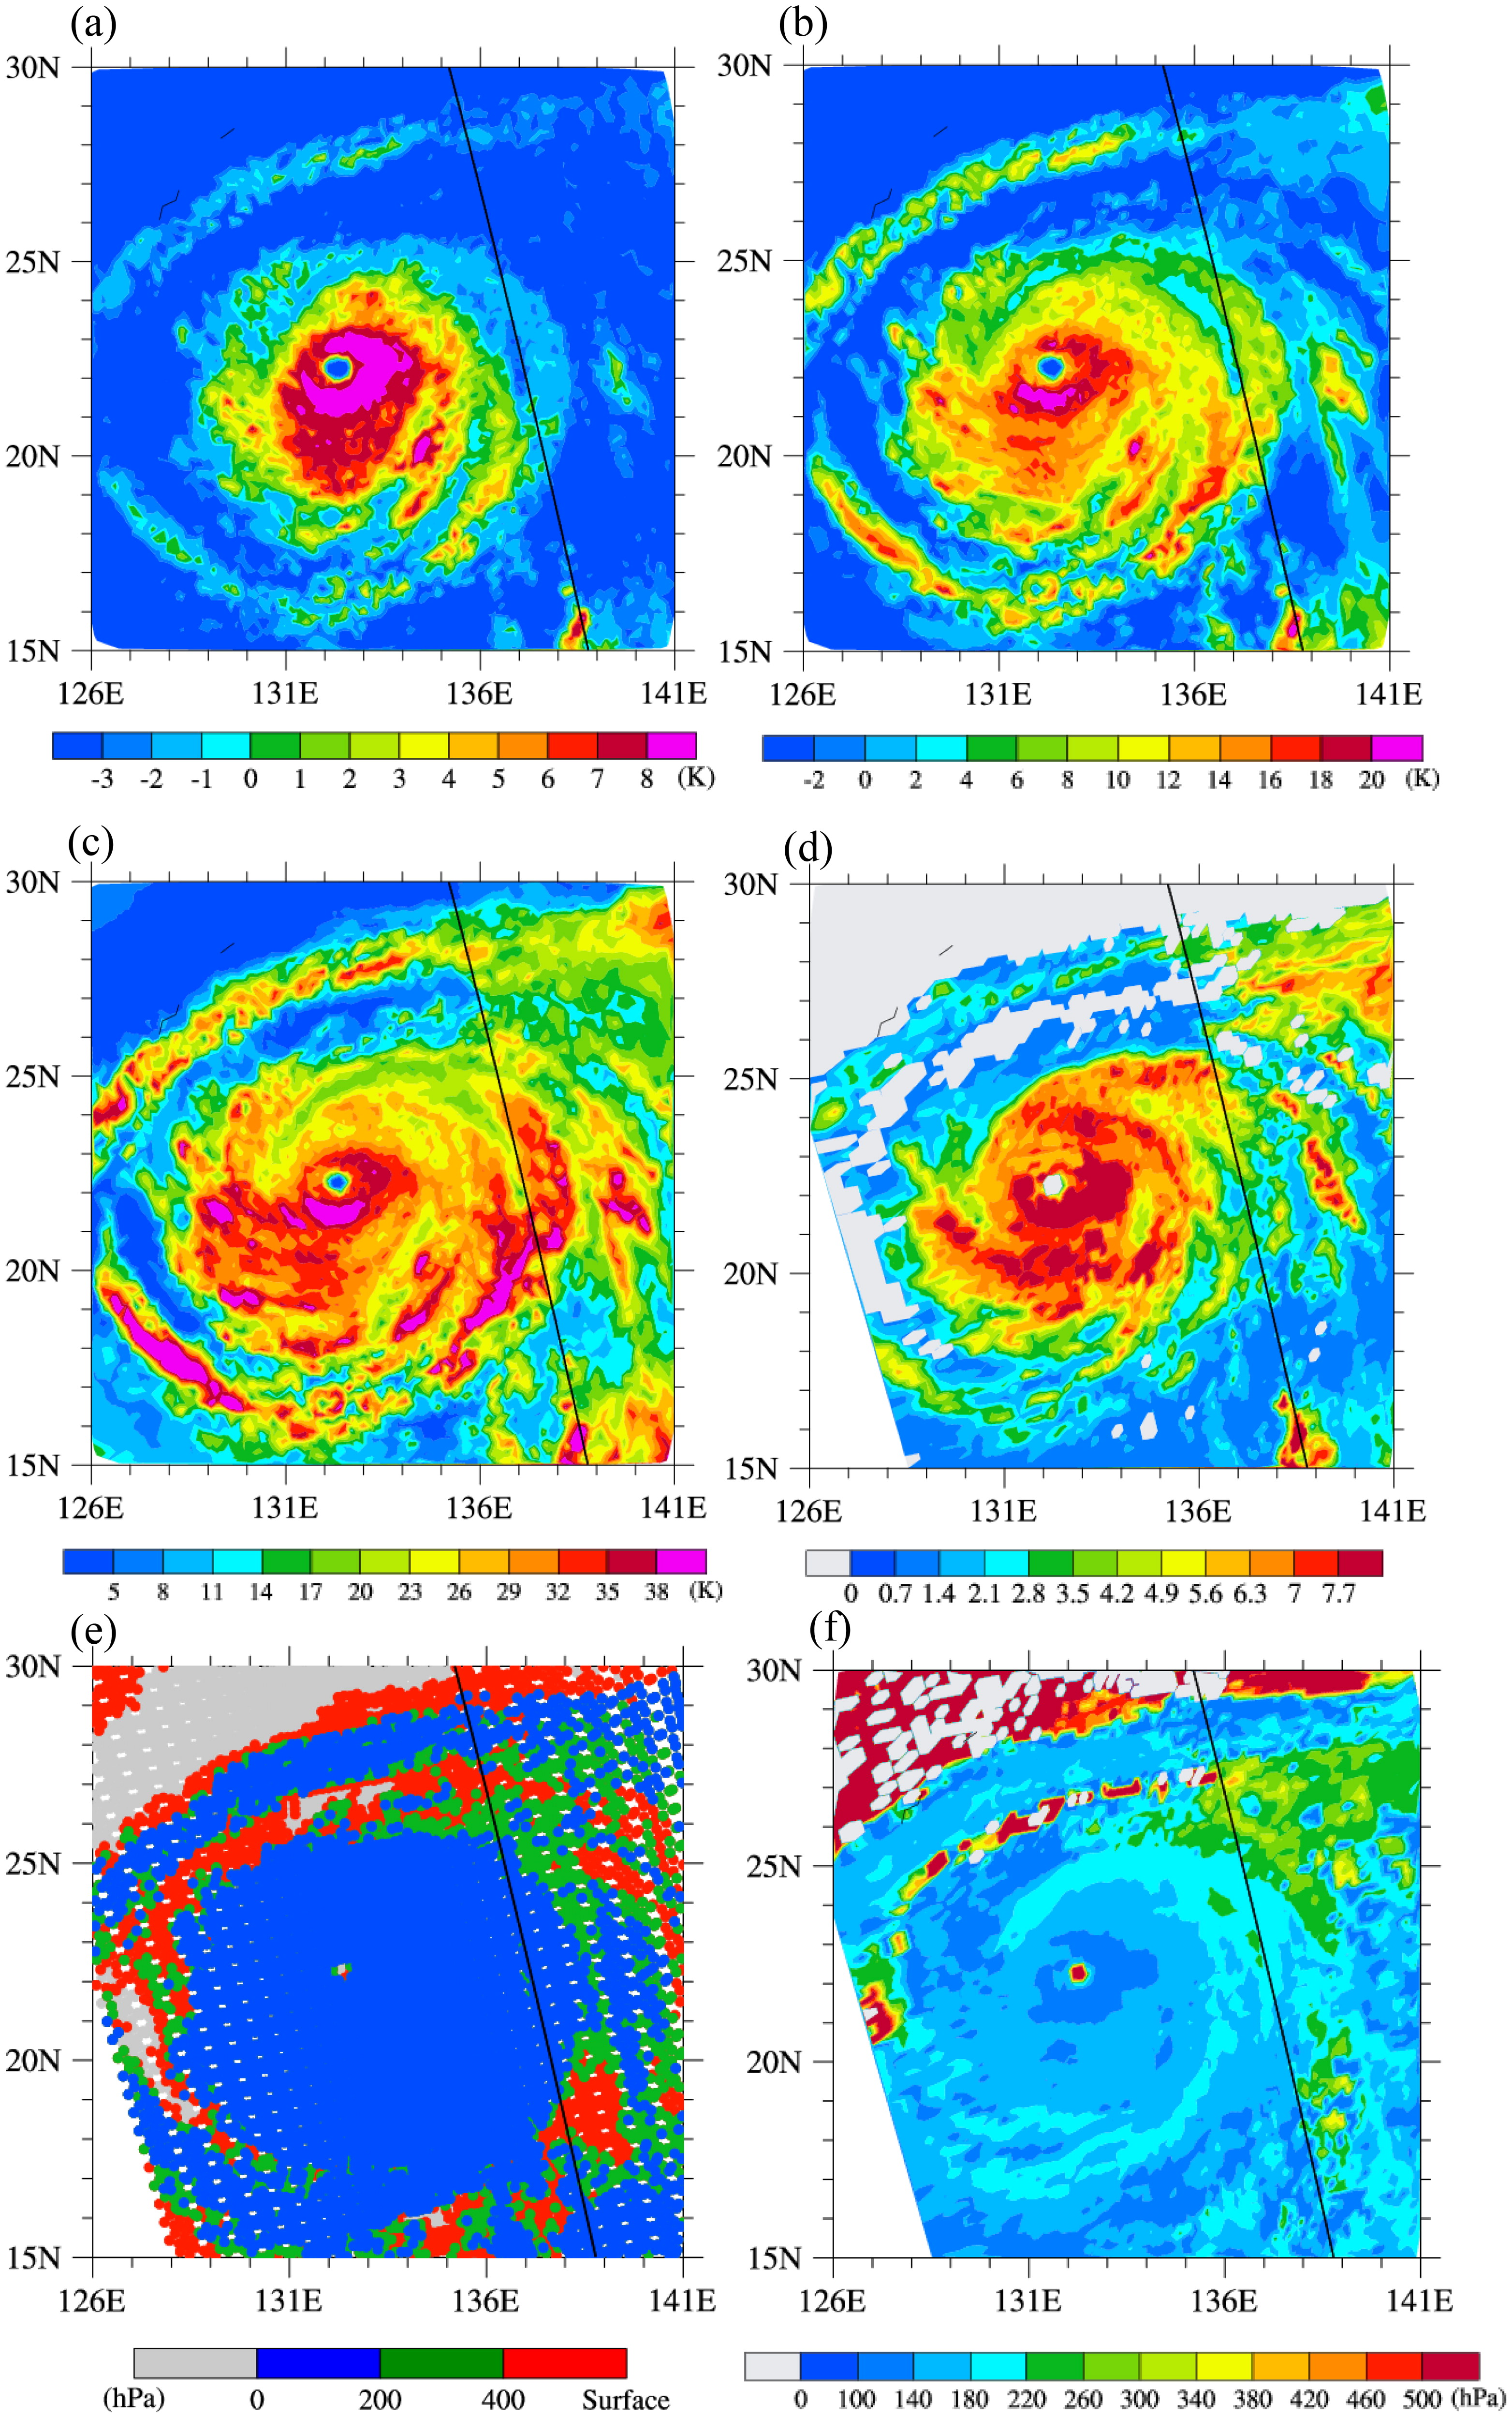
Fig. 16.
Spatial distributions of (a) CESI-5, (b) CESI-9, (c) CESI-19 and (d) AIRS ICOD for Typhoon Maria at 0417 UTC 9 July 2018 at the ascending node. (e) CESI-5 > −3 K (blue, ice cloud above 200 hPa), CESI-9 > −1 K (green, ice cloud between 200 and 400 hPa), CESI-19 > 5 K (red, ice or liquid cloud below 400 hPa), and CESI-19 5 K (grey, clear sky) from the AIRS-CrIS overlapped swath. (f) Cloud-top pressures are from AIRS v6 product. The black lines in (a–f) show the track of the Cloud-Aerosol Lidar with Orthogonal Polarization onboard the Cloud-Aerosol Lidar and Infrared Pathfinder Satellite Observation satellite.
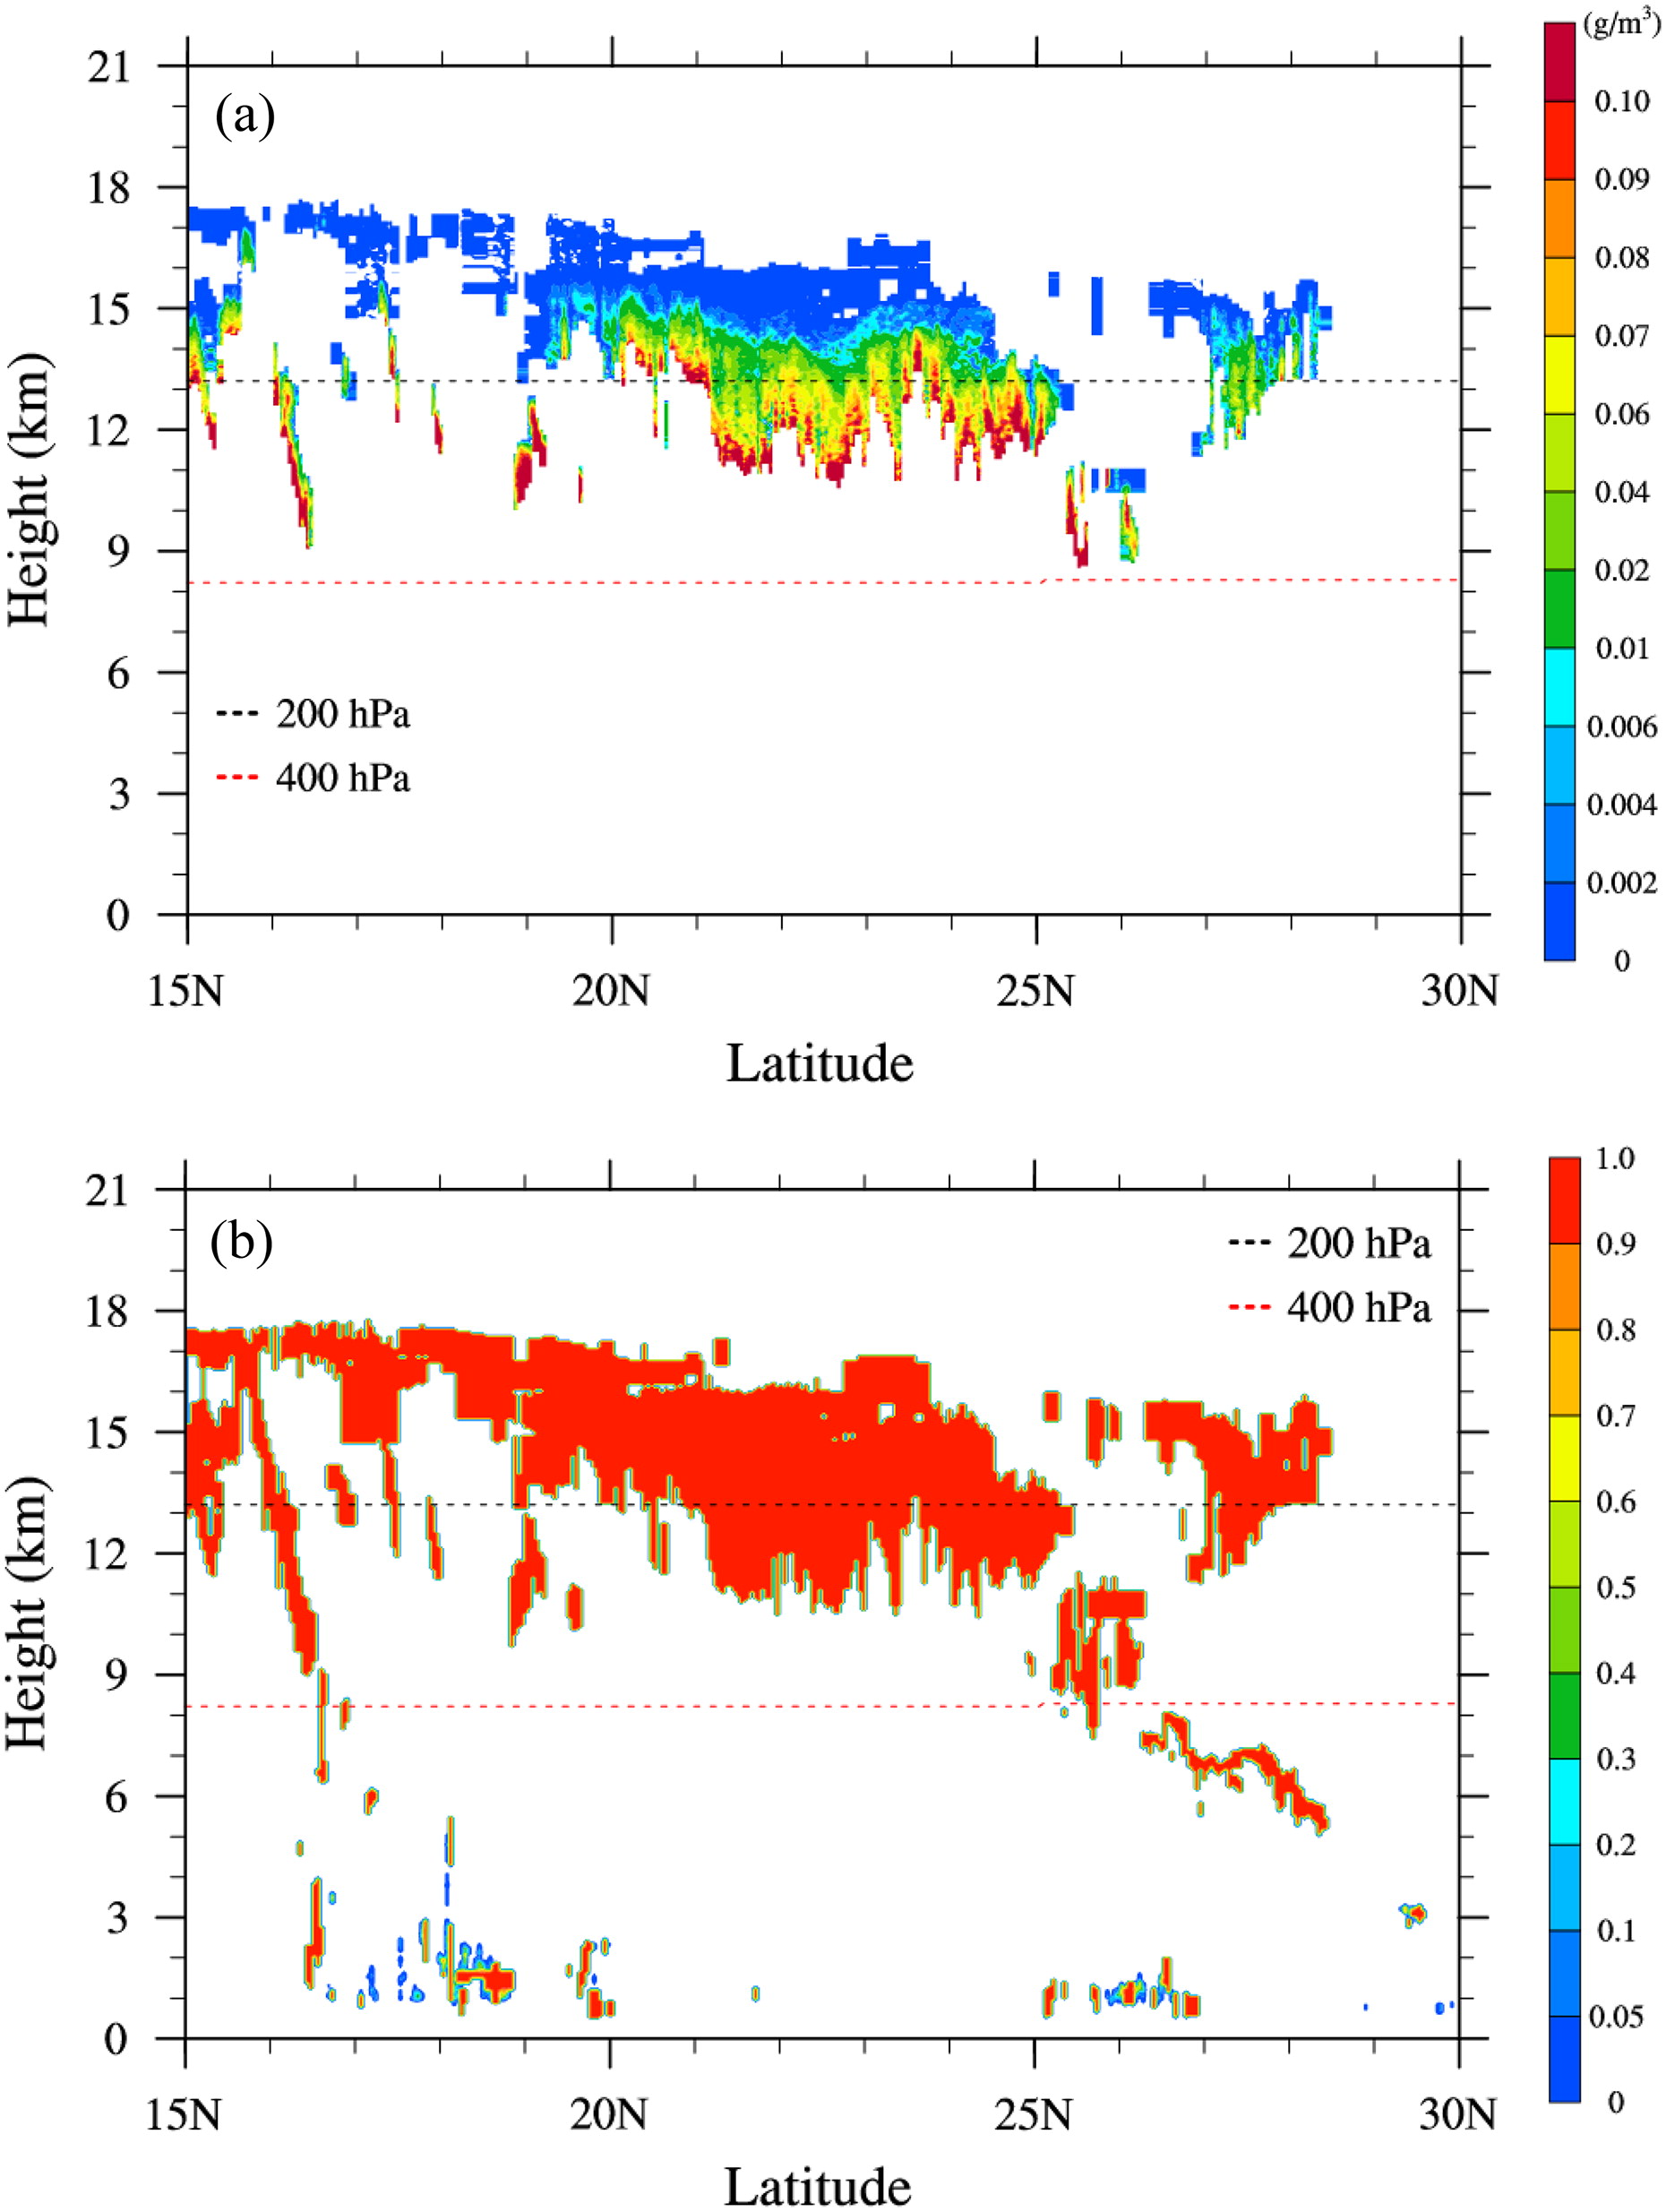
Fig. 17.
The vertical distributions of (a) ice water content (unit: g m−3) and (b) cloud fraction along the CALIOP track shown in Fig. 16.