
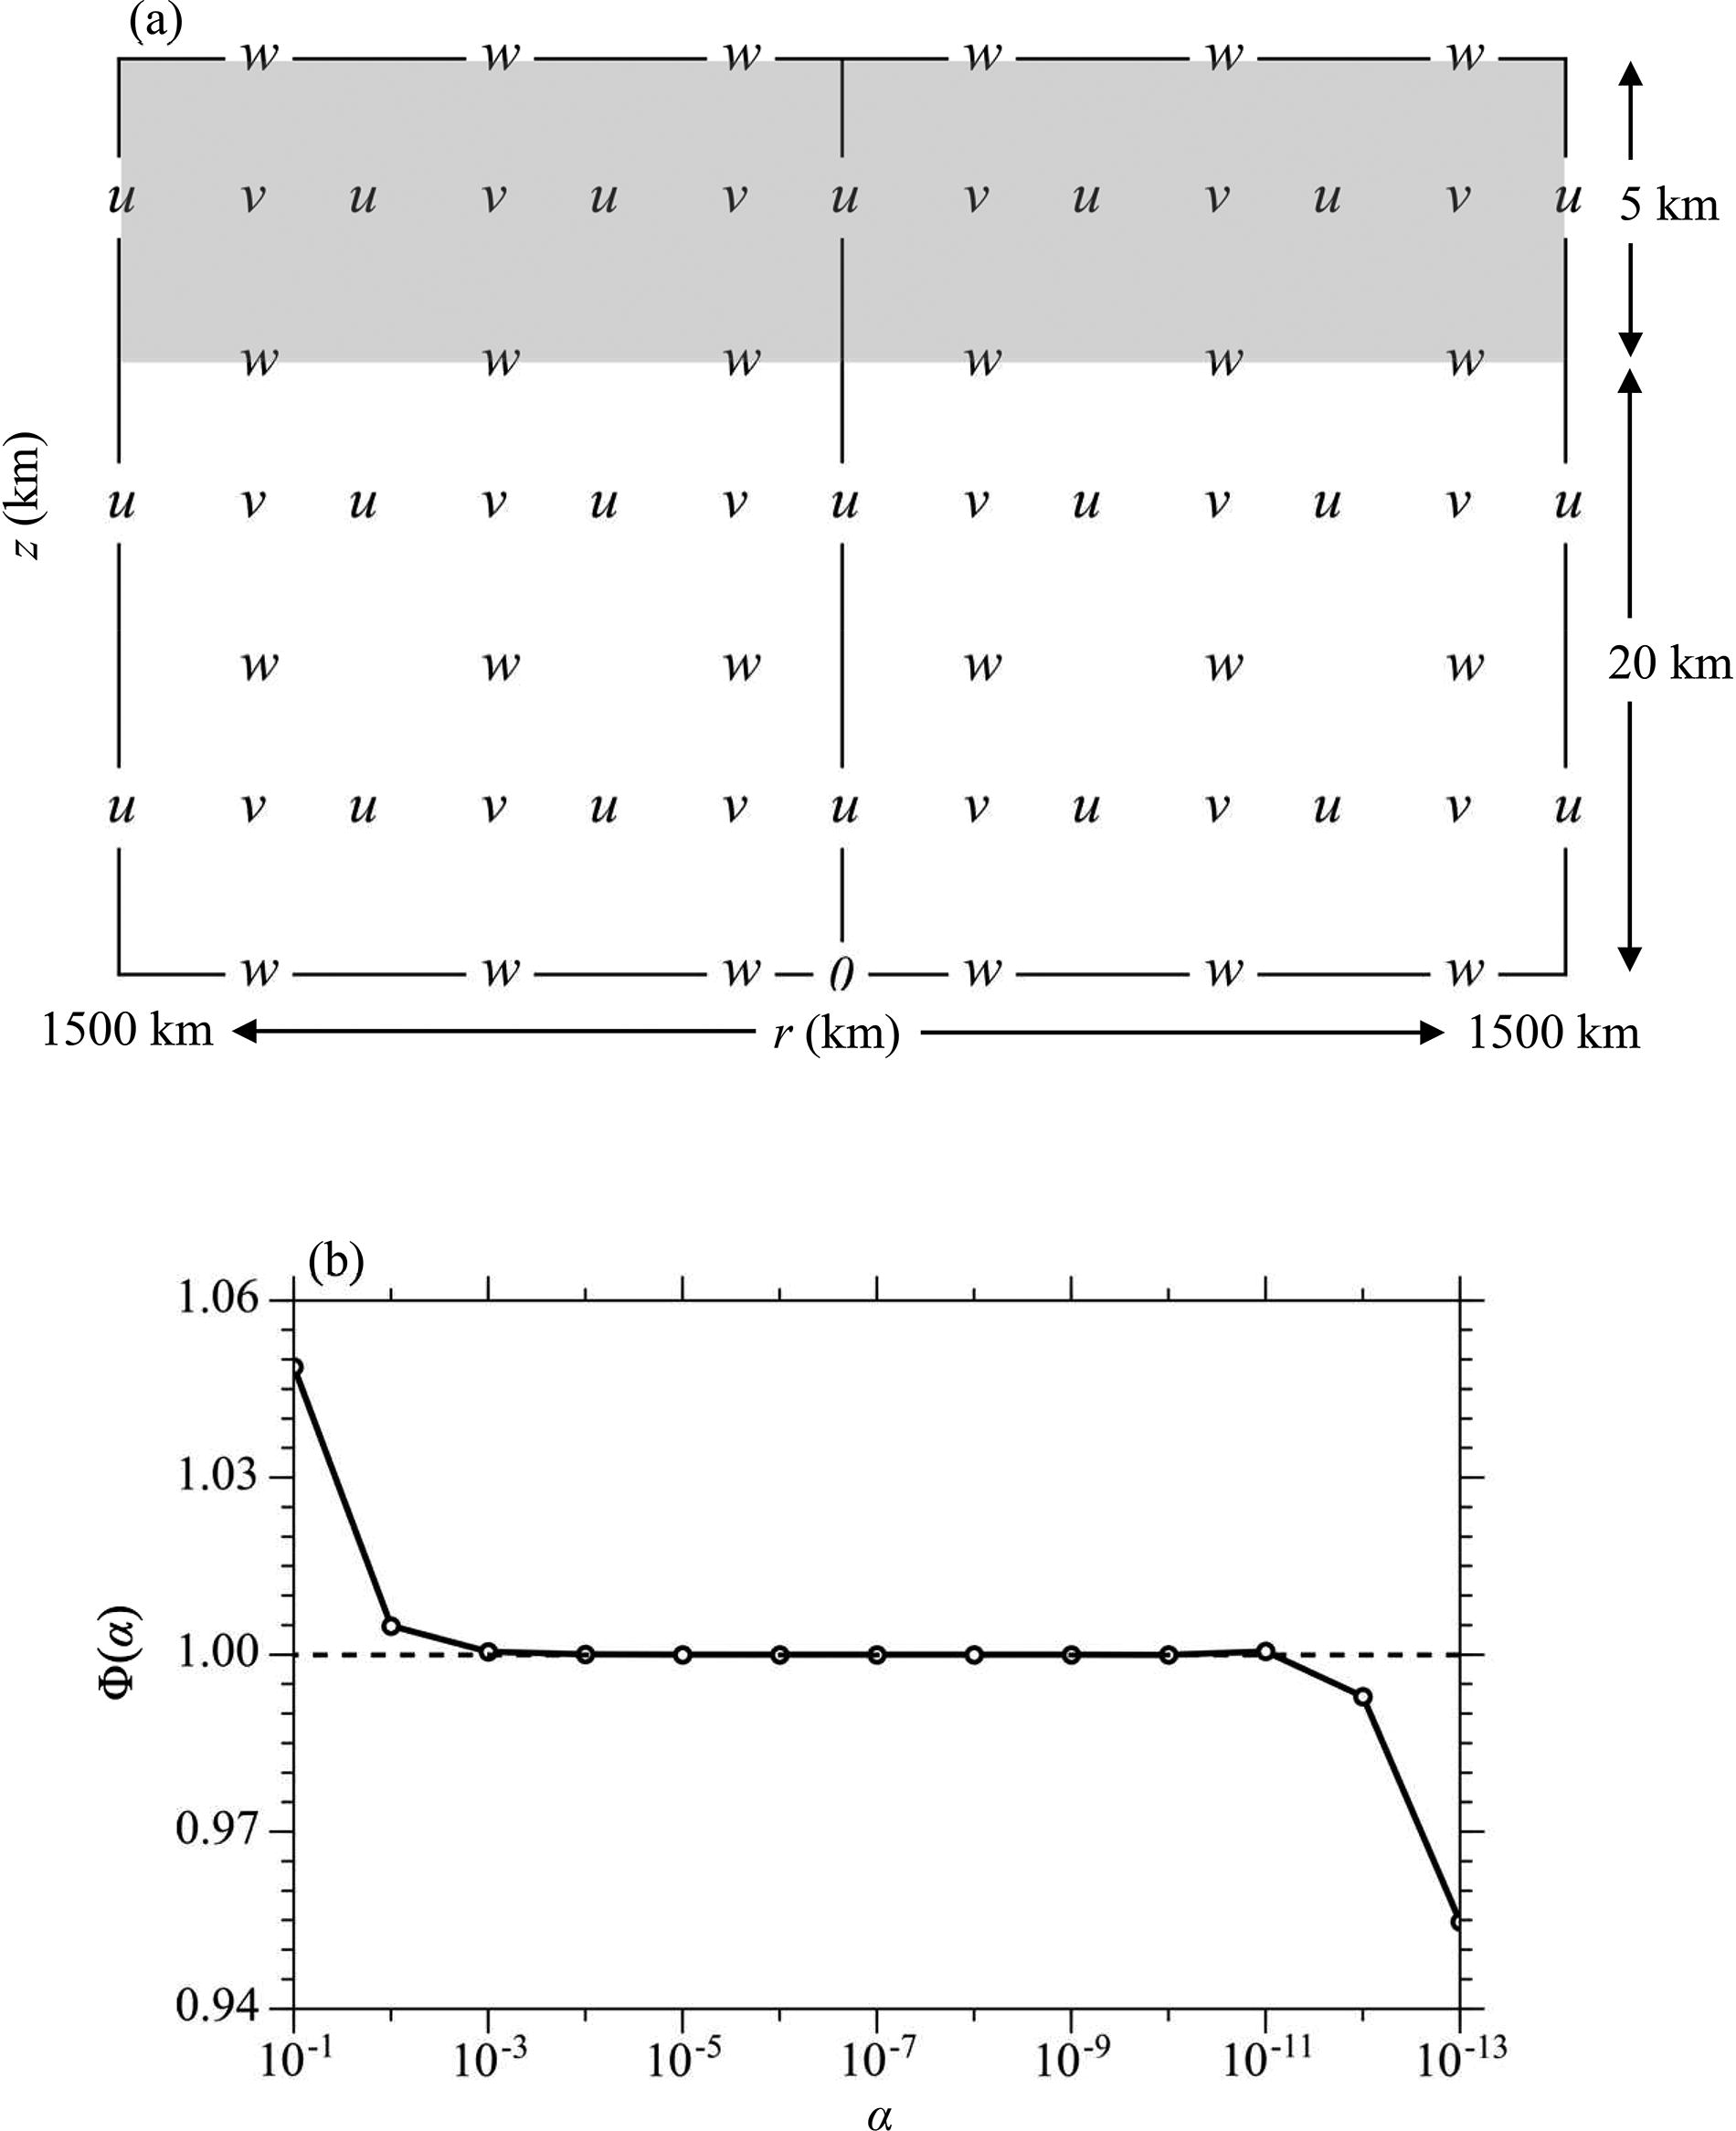
Fig. 1.
The RE model’s staggered grid alignments in (a) horizontal and vertical coordinates. (b) Variations in (α) with respect to α (plotted using a logarithmic scale), used as correctness checks of the TLM of the RE model.
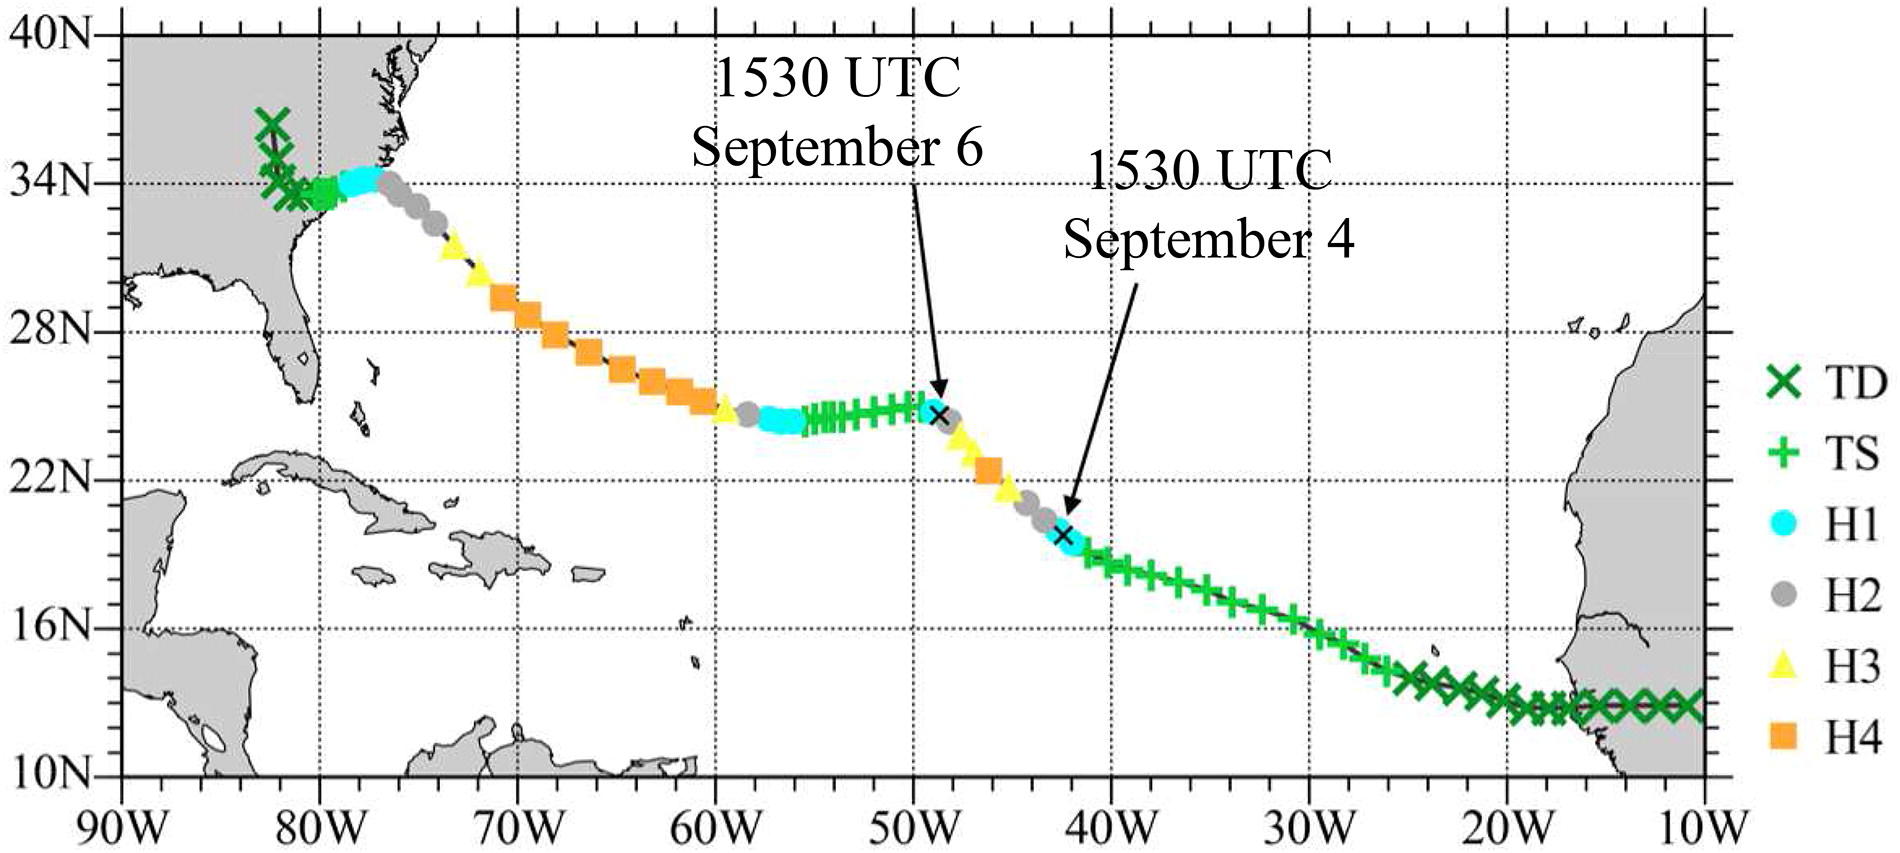
Fig. 2.
The best track of Hurricane Florence (2018) from 29 August to 16 September 2018 at 6-h intervals. The different coloured symbols indicate the intensity category. The two black arrows show the 48-h time window from 1530 UTC 4 September to 1530 UTC 6 September 2018.
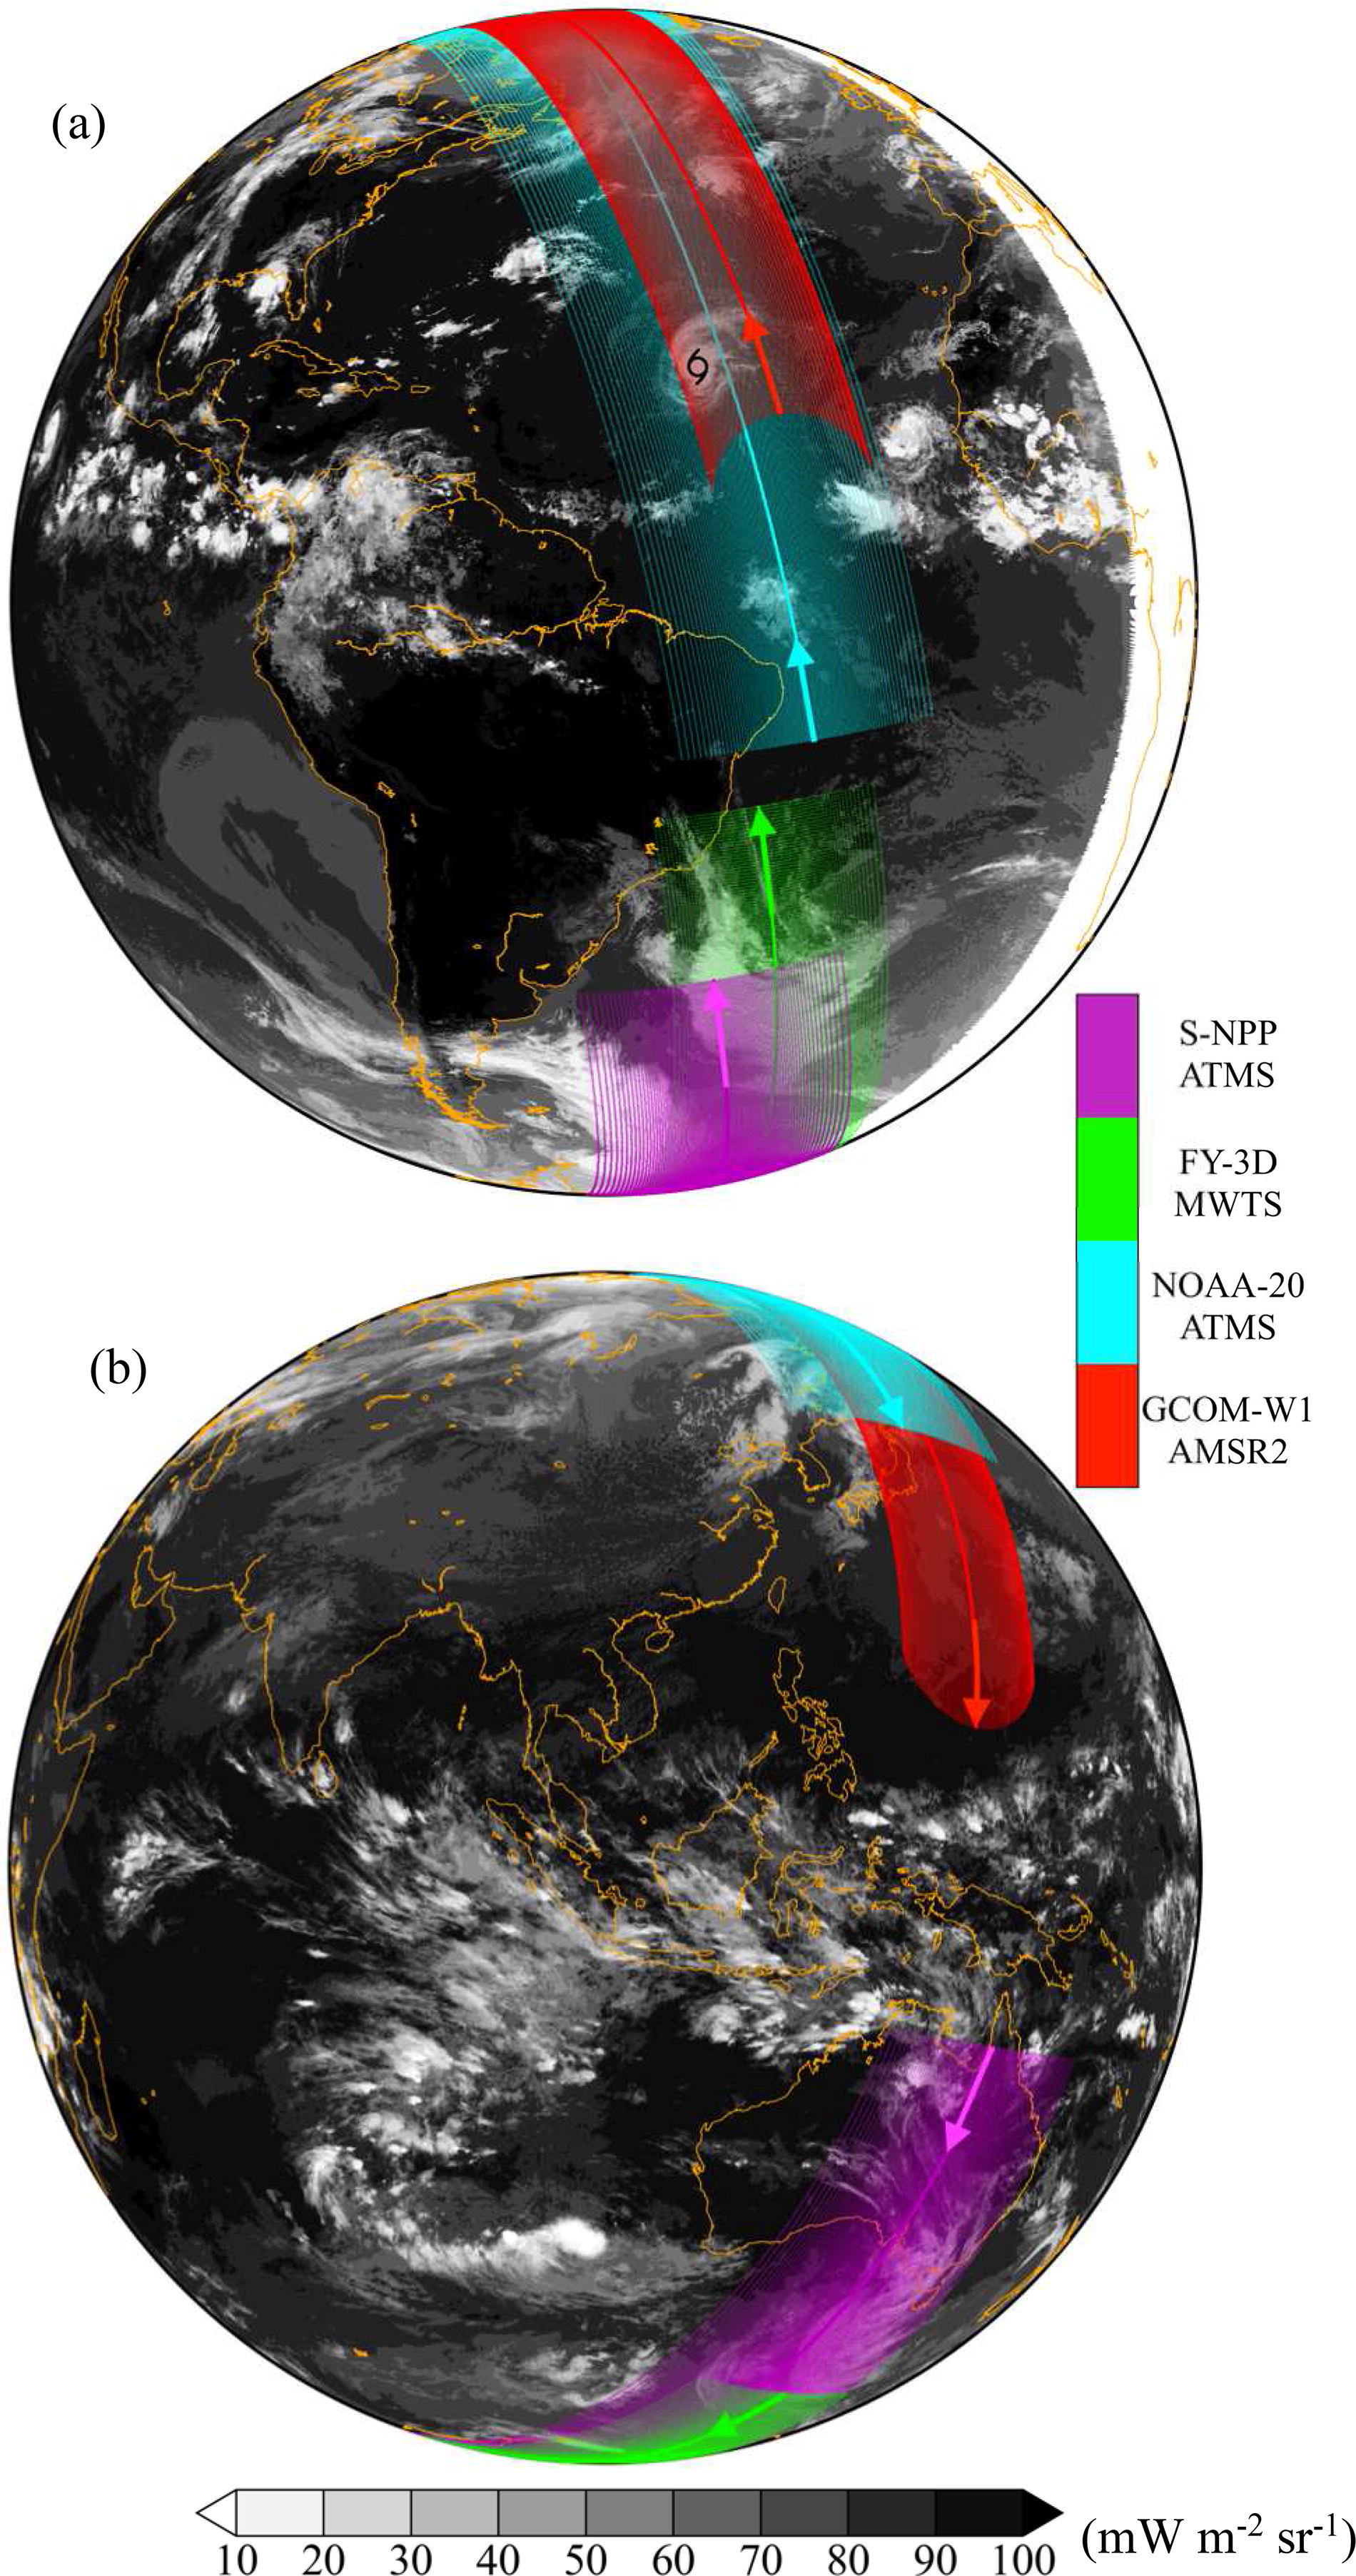
Fig. 3.
The swaths covered by GCOM-W1 AMSR2 (red), NOAA-20 ATMS (cyan), FY-3D MWTS (green), and S-NPP ATMS (magenta) from 1540 UTC to 1620 UTC 4 September 2018 in (a) the western and (b) eastern parts of the globe. The underlying grey-scale backgrounds show GOES-16 Advanced Baseline Imager channel-13 (10.35 μm) and FY-4A Advanced Geosynchronous Radiation Imager channel-12 (10.7 μm) radiance observations at 1500 UTC 4 September 2018 [panels (a) and (b), respectively]. The centre of Hurricane Florence at 1500 UTC is indicated by a black hurricane symbol in (a).
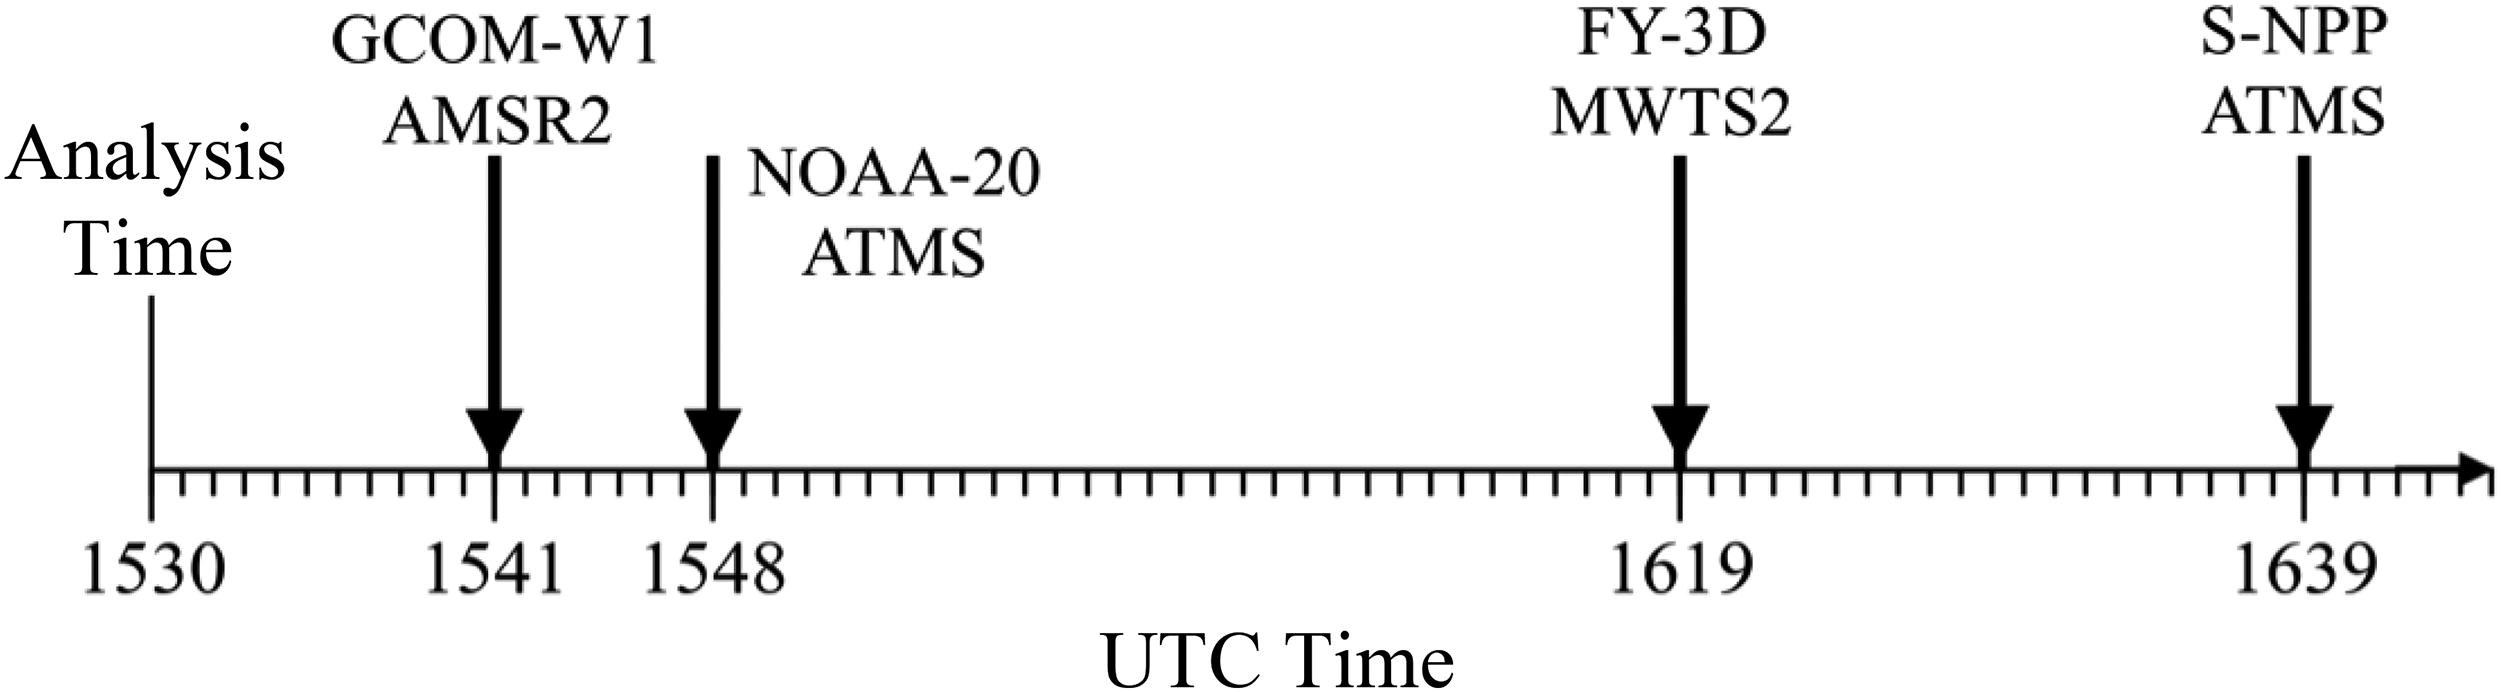
Fig. 4.
A schematic illustration of the TPW observation times and warm-core retrievals that are assimilated in the assimilation window from 1530 to 1639 UTC 4 September 2018. Small ticks are drawn at 1-min intervals on the horizontal axis, which corresponds to three time steps of the RE87 model integration. The AMSR2, NOAA-20 ATMS, MWTS and S-NPP ATMS observed the centre of Hurricane Florence at 1541, 1548, 1619 and 1639 UTC 4 September 2018, respectively.
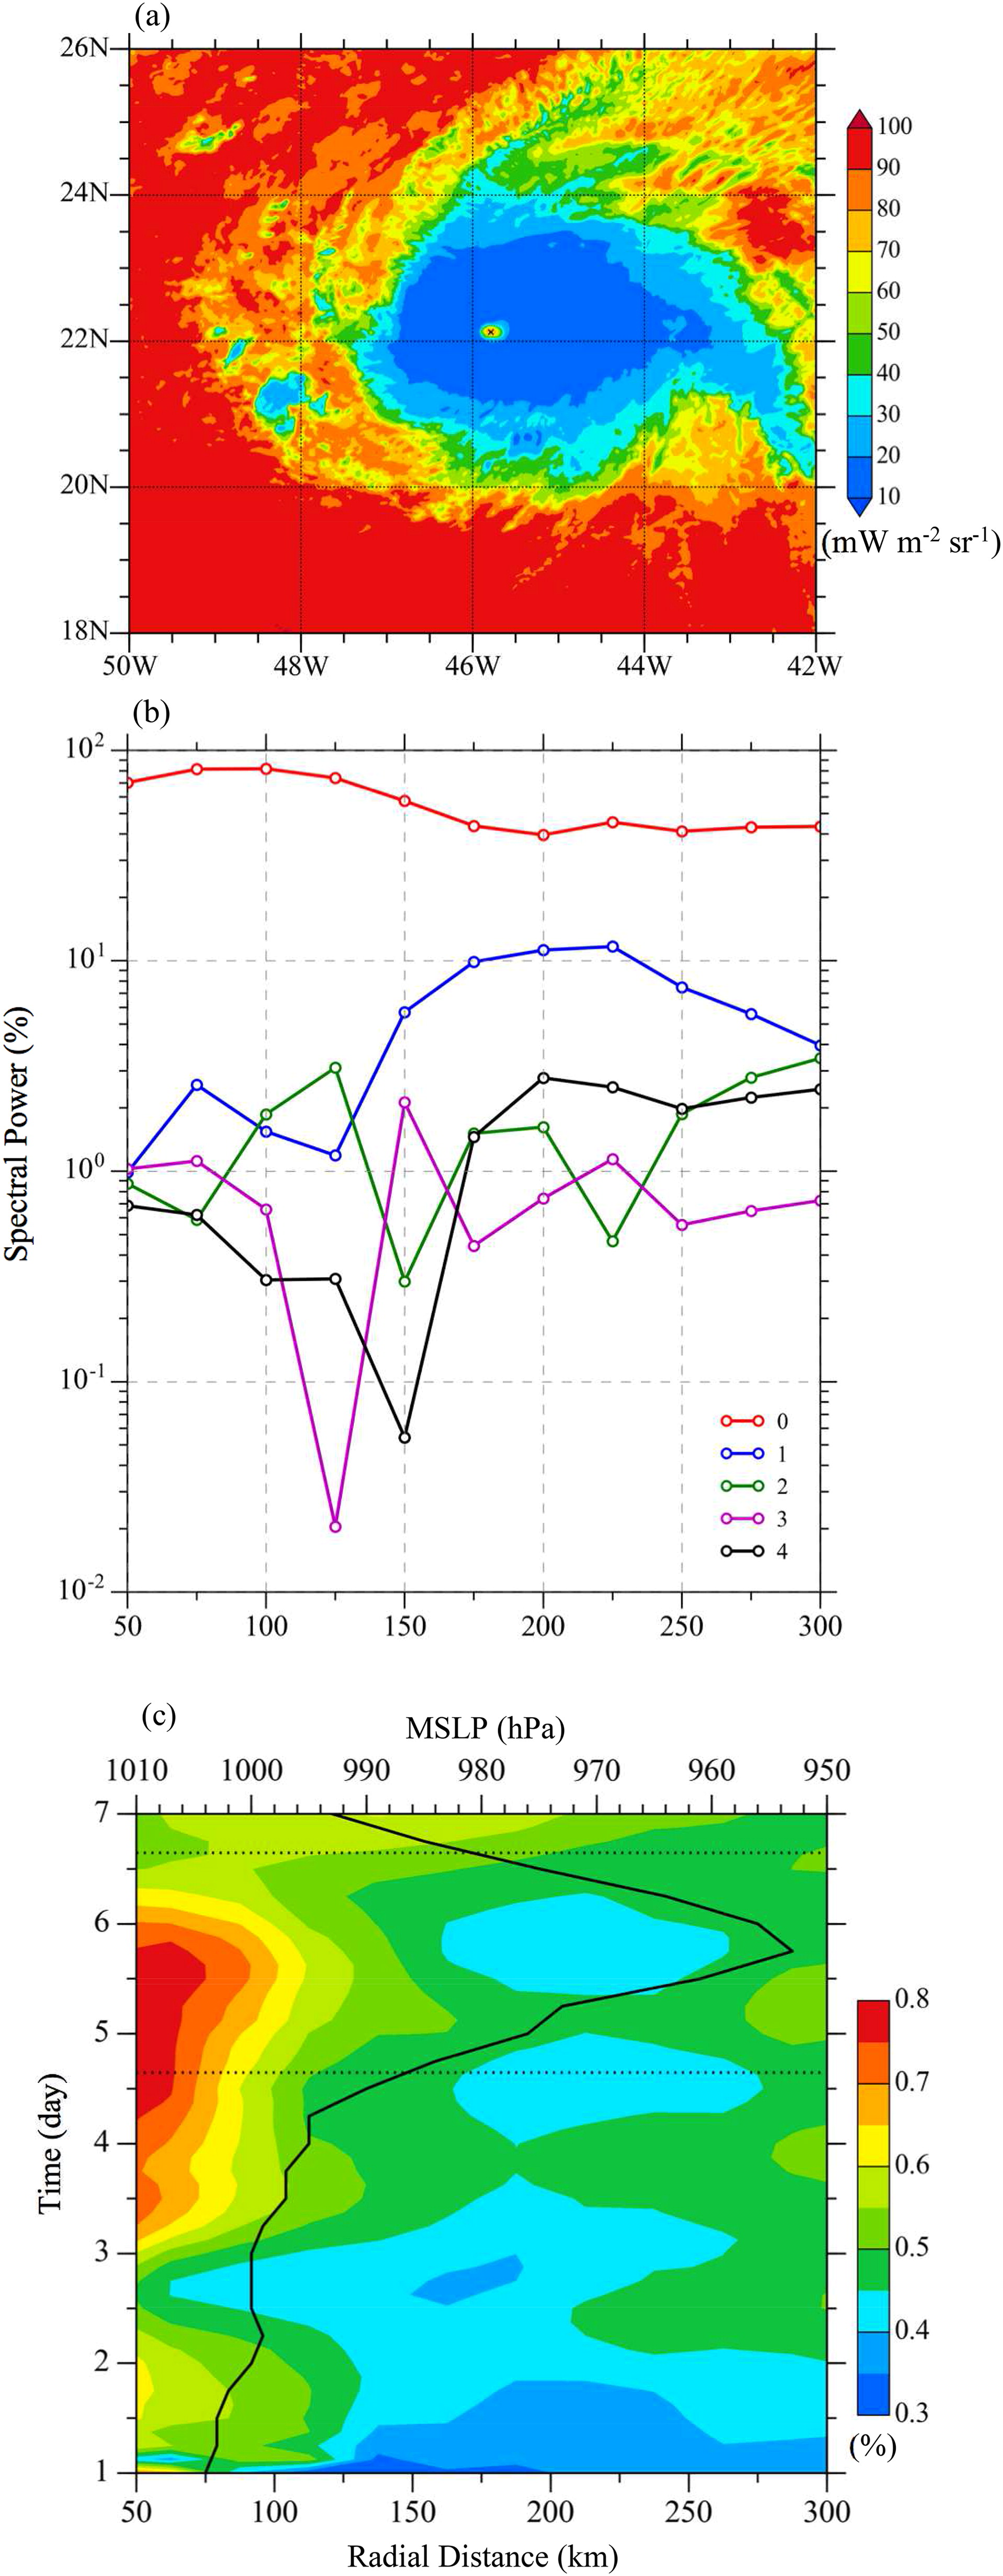
Fig. 5.
(a) Spatial distribution of ABI channel-13 radiance observations at 1500 UTC 5 September 2018 and (b) its radial variations in percentage spectra of the azimuthal wavenumbers 0–4 at a 25-km radial distance and in 2° azimuthal angle intervals. (c) Temporal evolution of the observed central SLP (black curve) and the wavenumber-0 spectrum (i.e. the axisymmetric component) calculated from GOES-16 ABI channel-13 radiance observations during 1–7 September 2018 at 3-hour intervals. Black dashed lines show the analysis time at 1530 UTC 4 September 2018 and the 48-hour forecast time at 1530 UTC 6 September 2018.
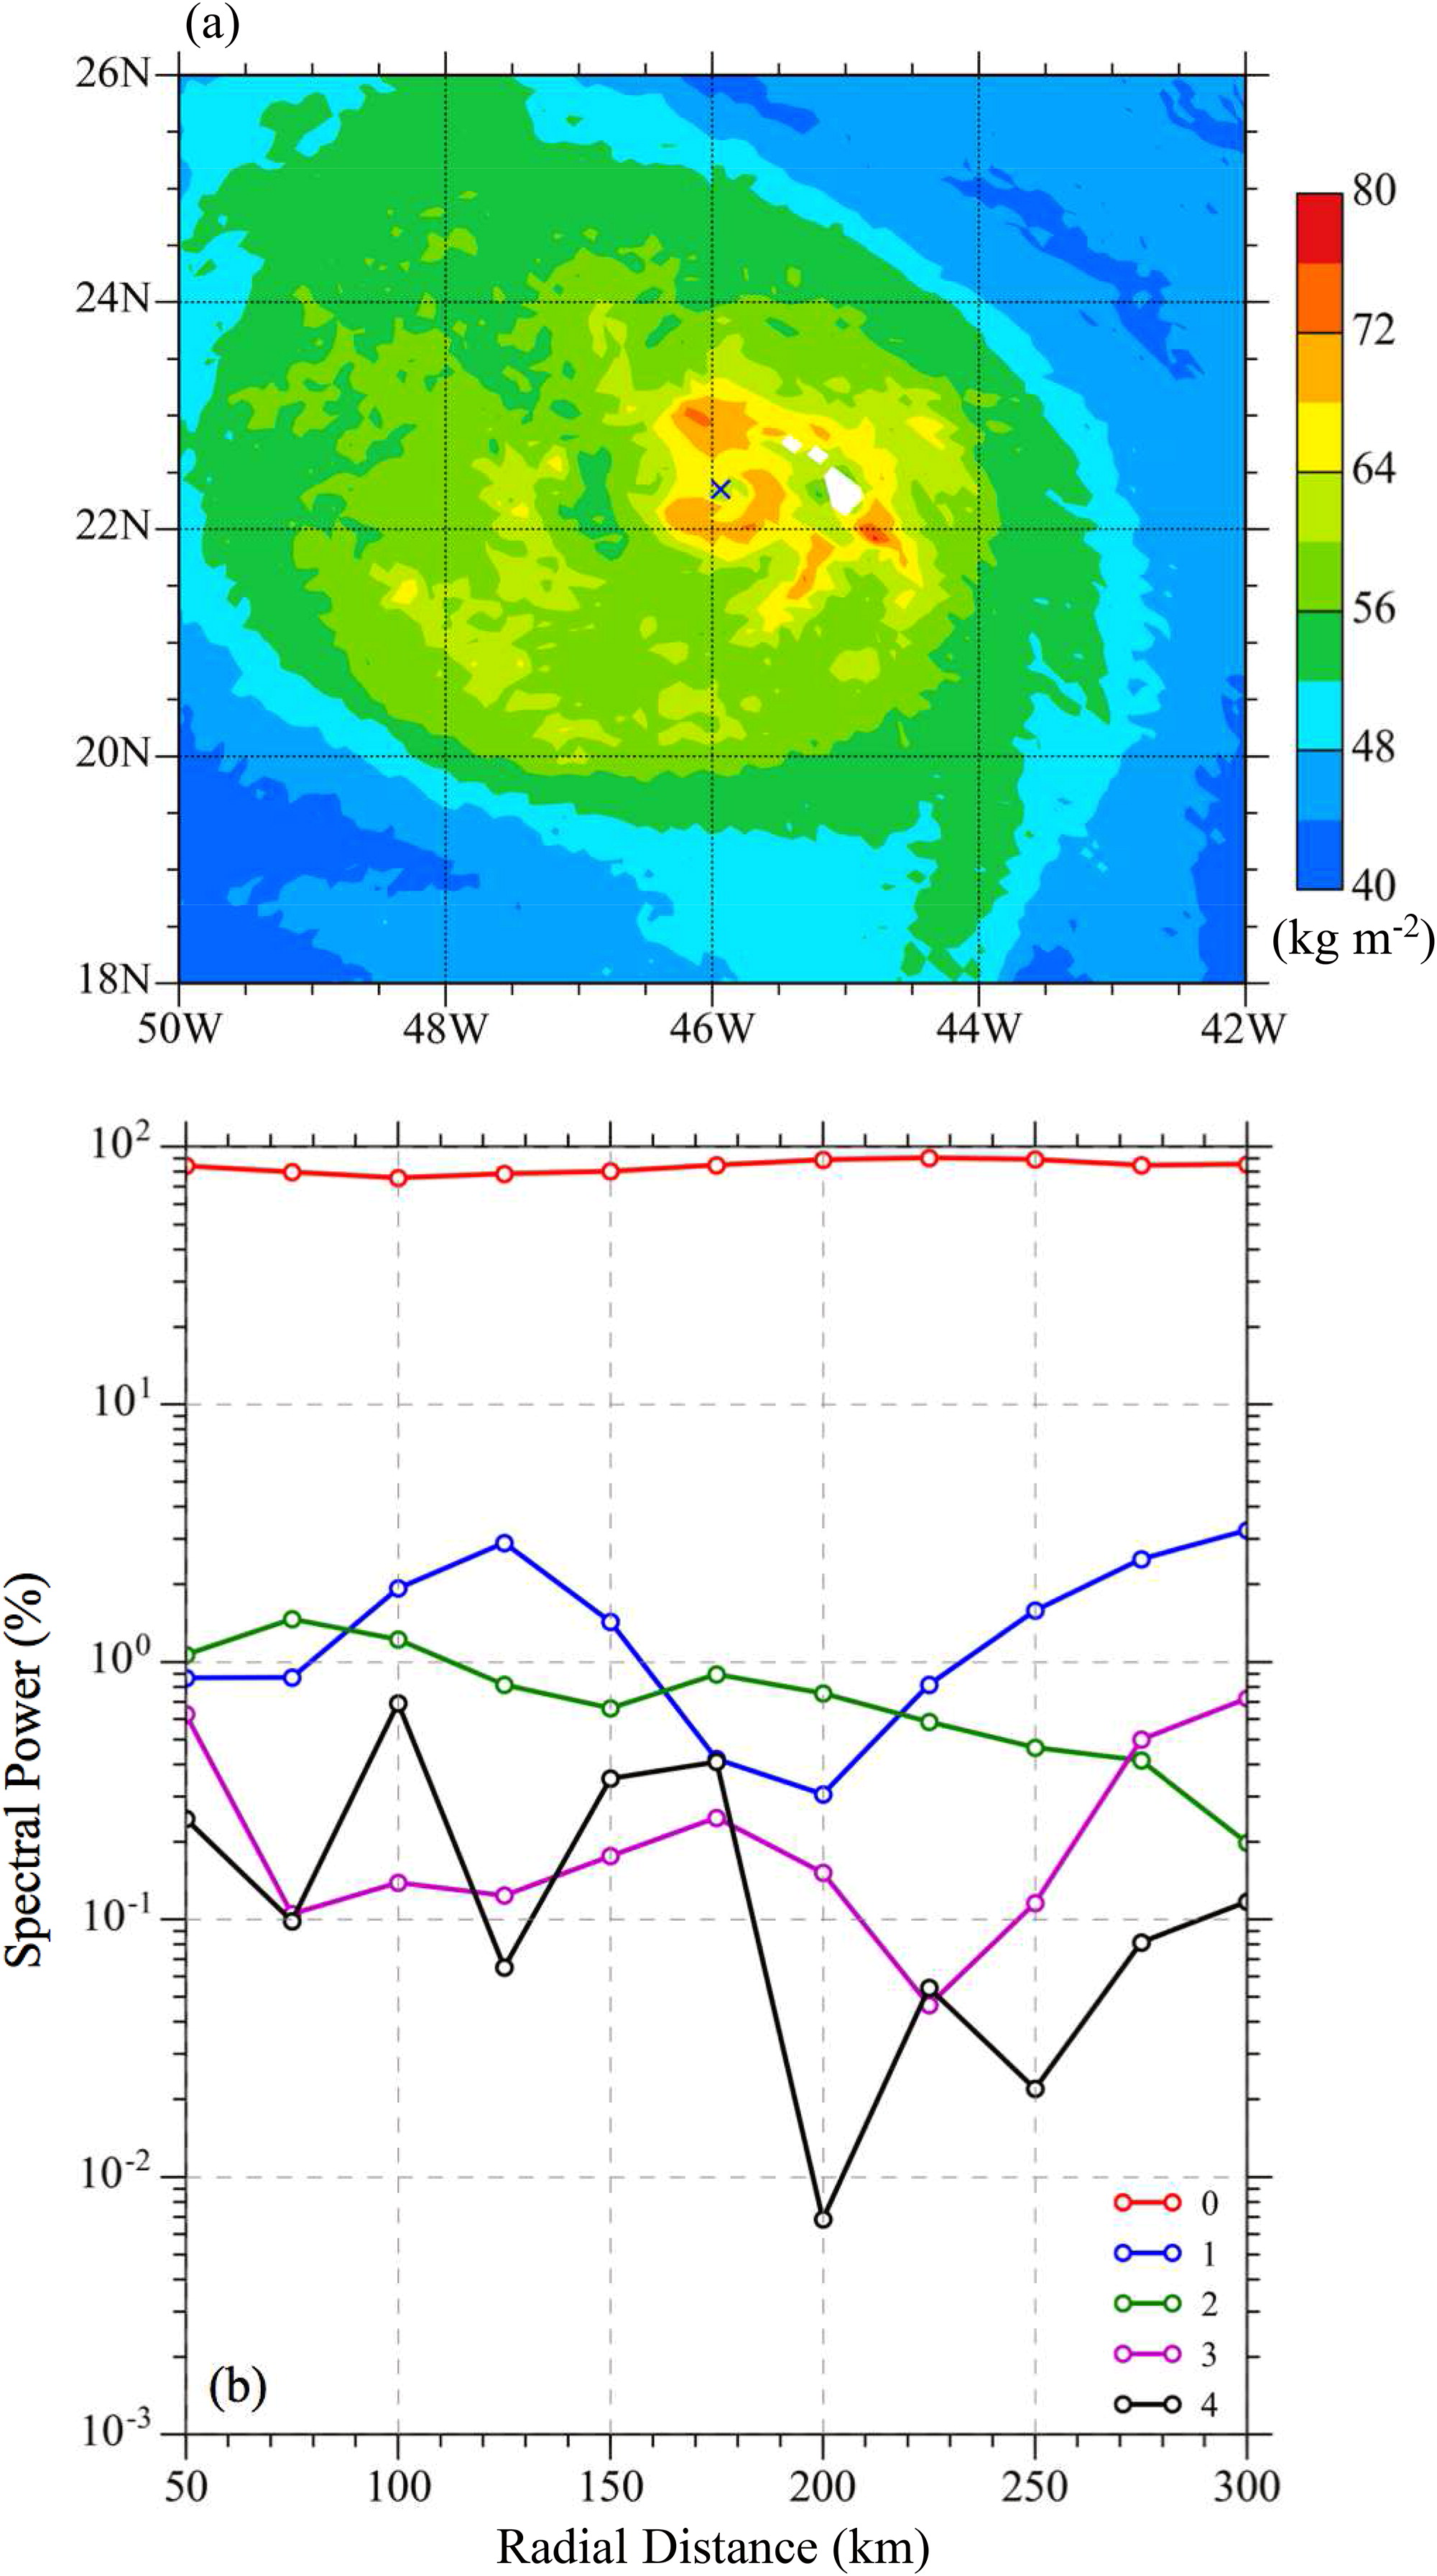
Fig. 6.
(a) TPW (unit: kg m−2) retrieved from AMSR2 observations at 1624 UTC 5 September 2018 and (b) its radial variations in percentage spectra of the azimuthal wavenumbers 0–4. The centre for the azimuthal spectral analysis is indicated by ‘x’ in (a).
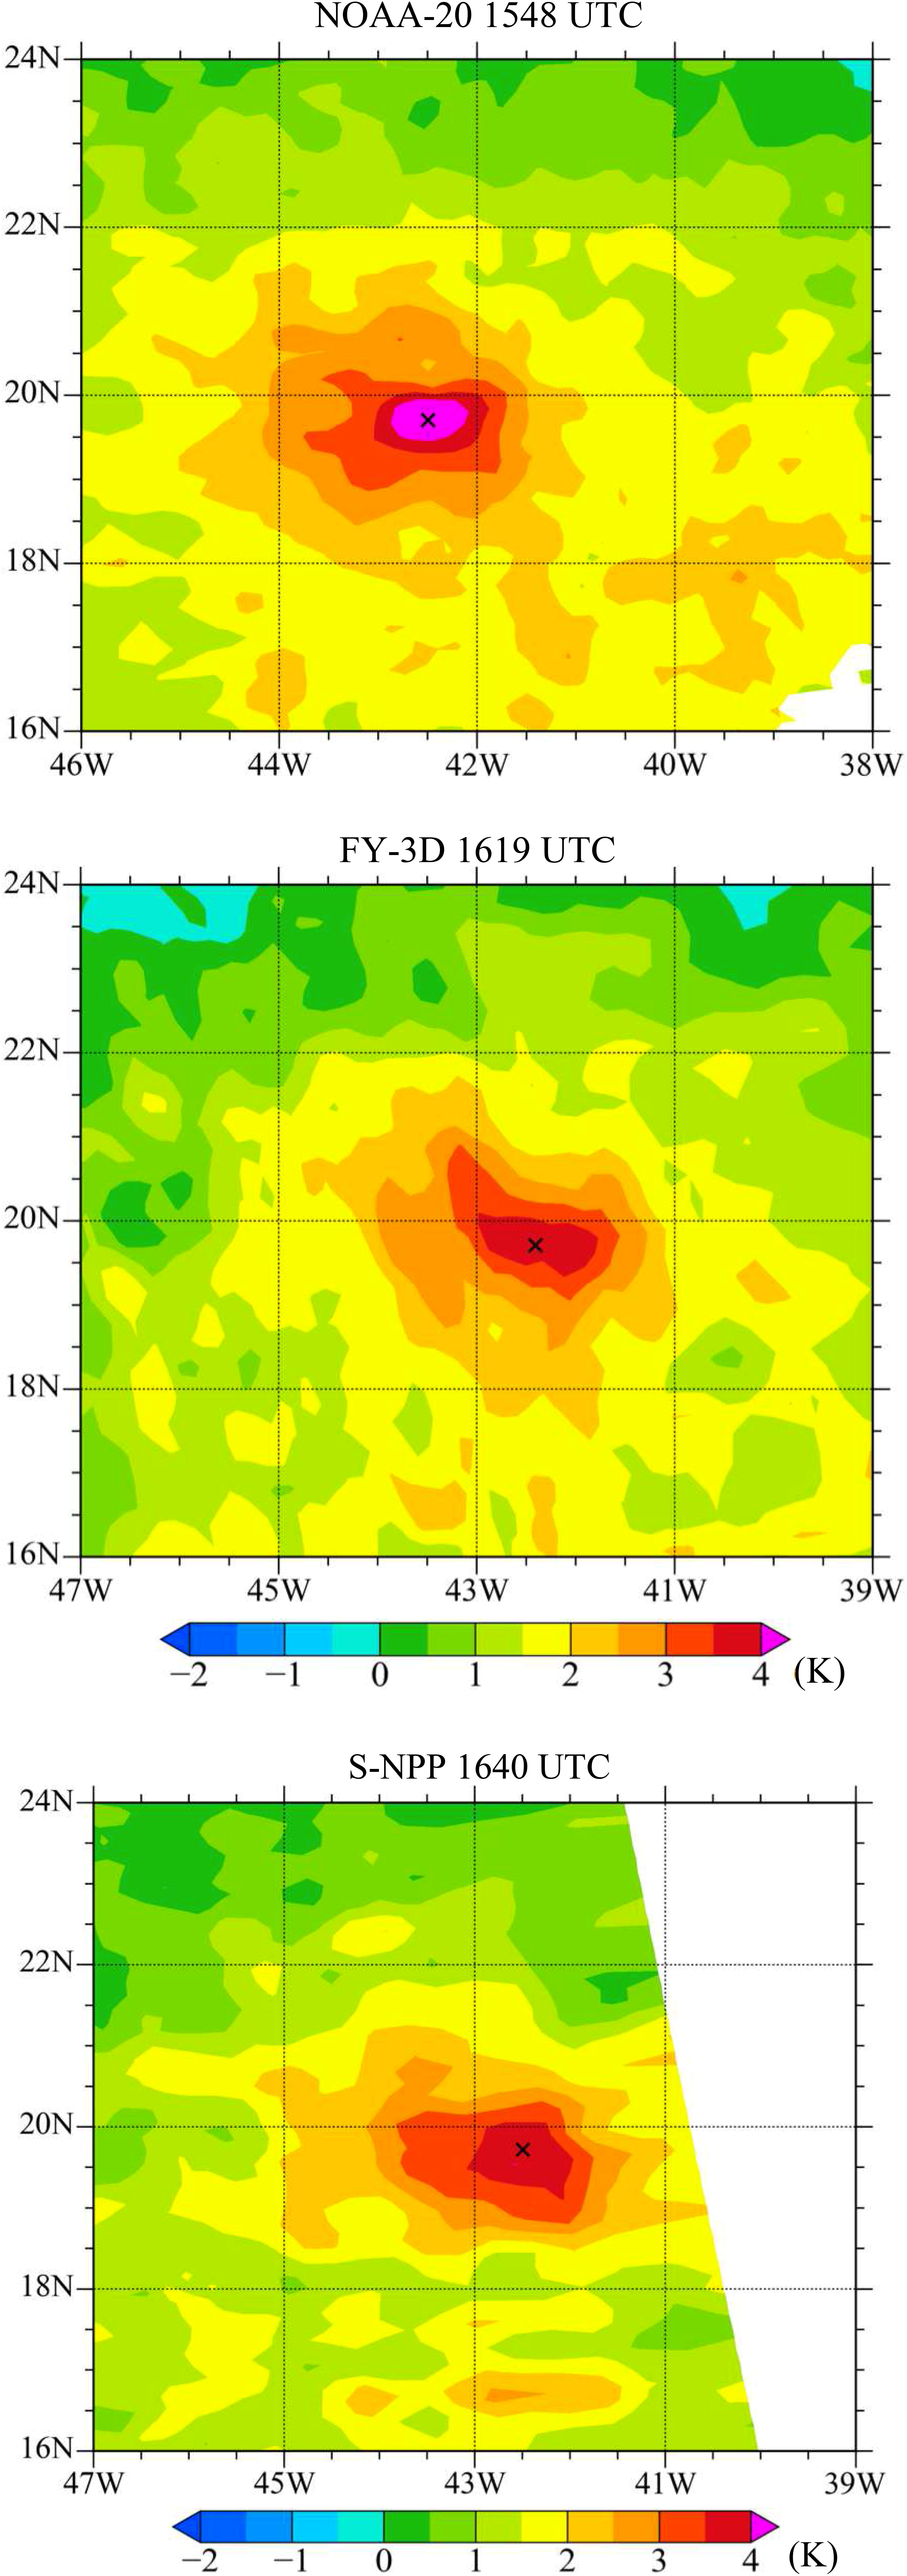
Fig. 7.
Temperature anomalies at 250 hPa (unit: K) retrieved from observations made by the NOAA-20 ATMS at 1548 UTC (top panel), the FY-3D MWTS at 1619 UTC (middle panel), and the S-NPP ATMS at 1640 UTC (bottom panel) 4 September 2018. The centre from the best track data is indicated by the ‘x’ symbol.
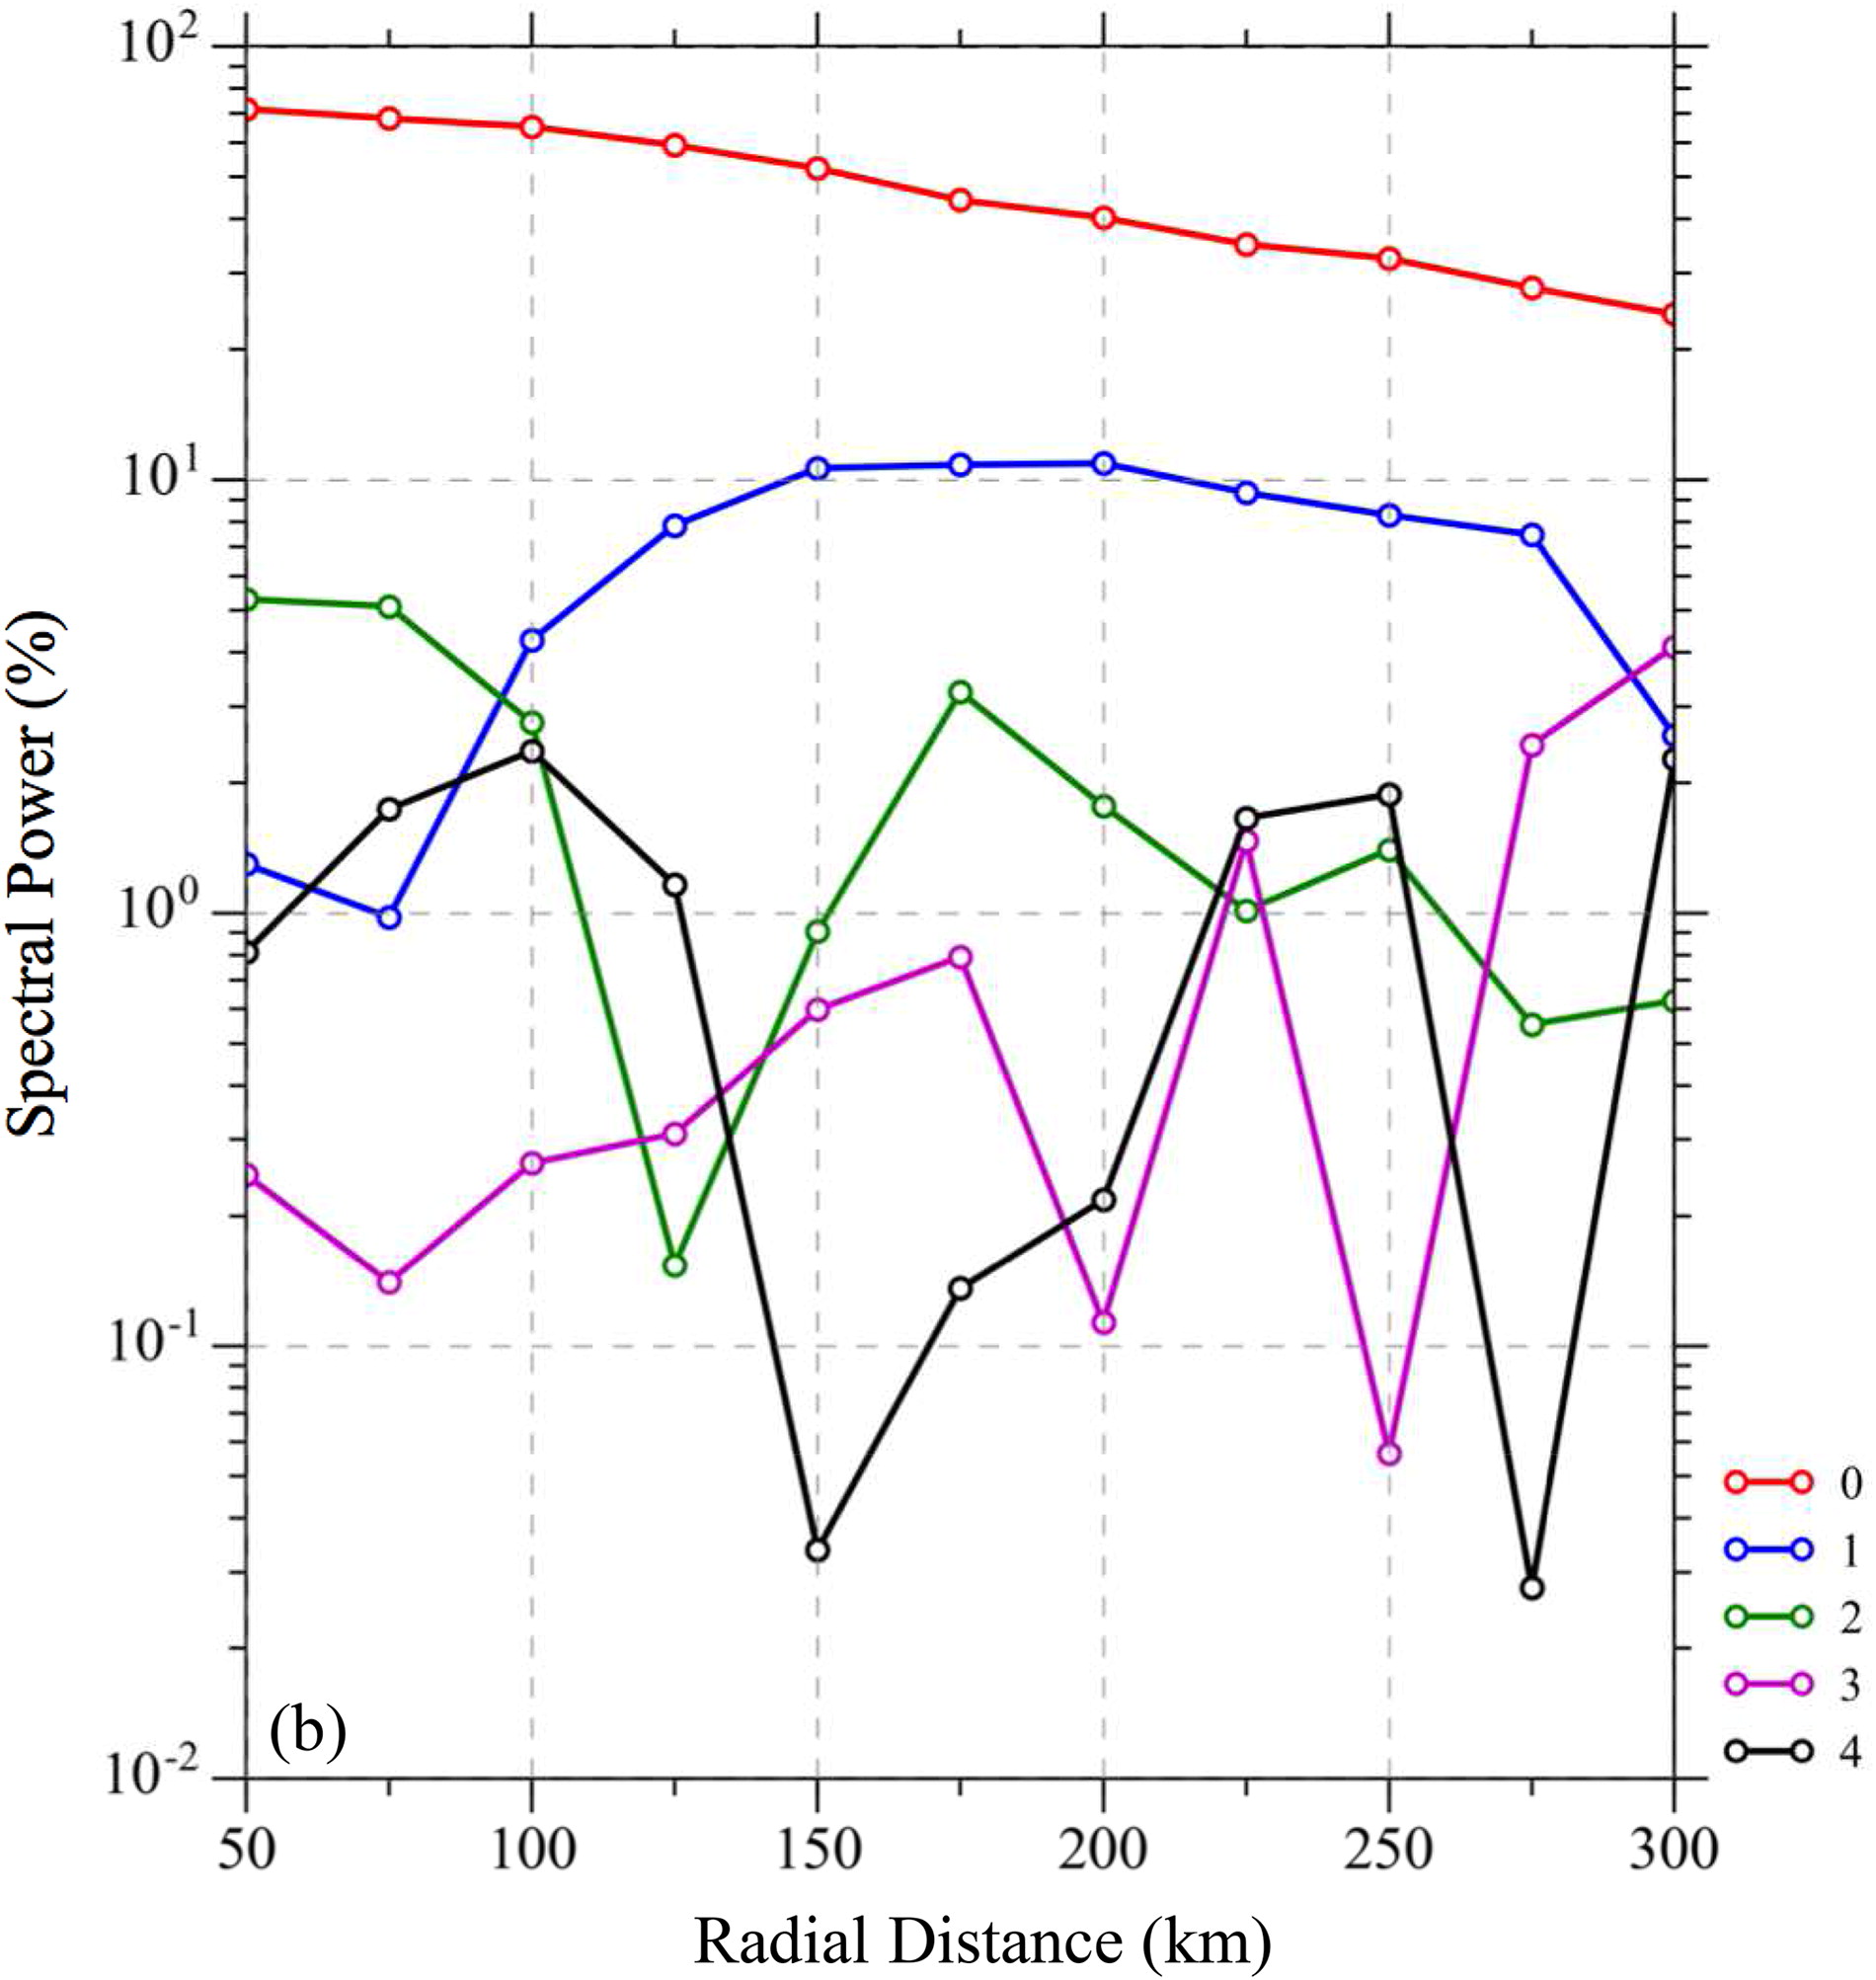
Fig. 8.
Radial variations in percentage spectra of the azimuthal wavenumbers 0–4 for the 250-hPa warm-core anomaly retrieved from NOAA-20 ATMS observations at 1548 UTC 4 September 2018.
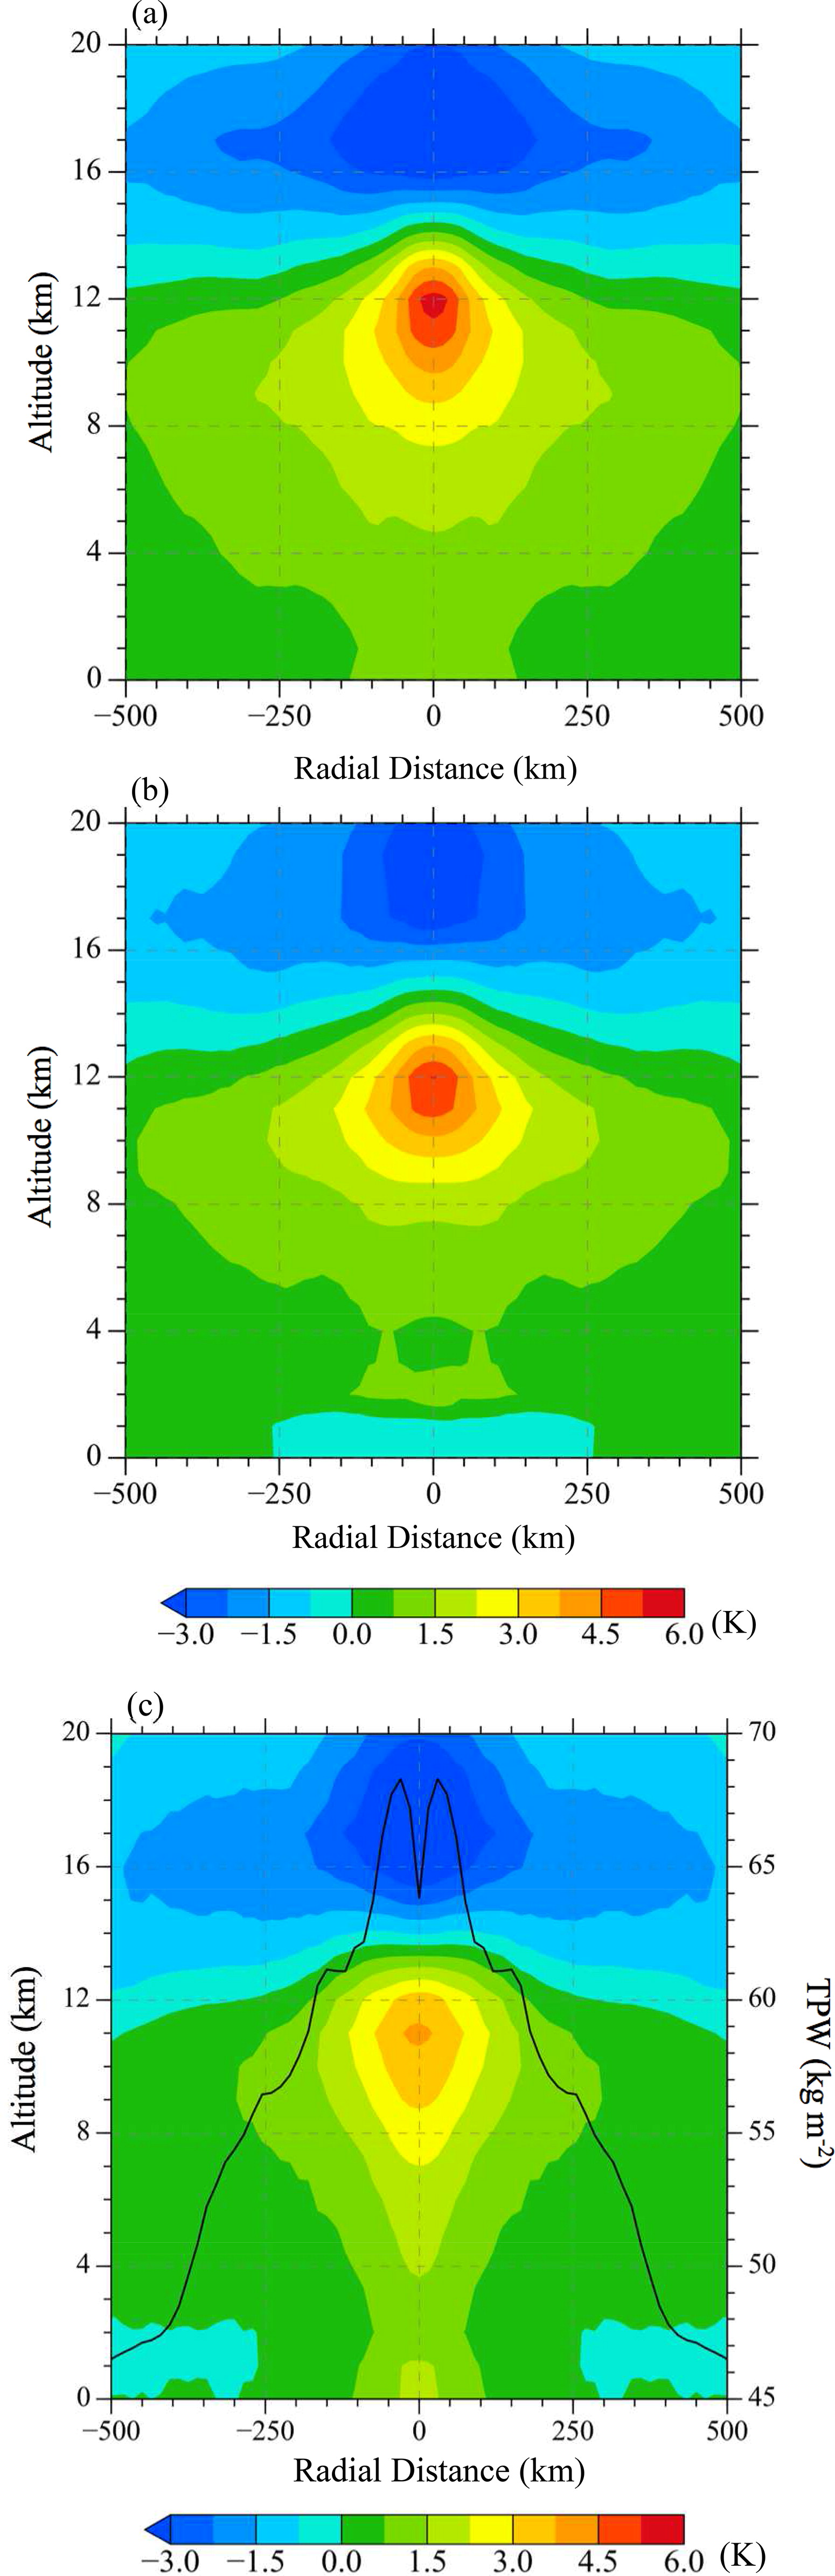
Fig. 9.
Azimuthally averaged potential temperature anomalies (unit: K) calculated at 25-km radial-distance intervals using temperature retrievals from (a) the NOAA-20 ATMS at 1548 UTC, (b) the FY-3D MWTS at 1619 UTC, and (c) the S-NPP ATMS at 1640 UTC 4 September 2018. The AMSR2-retrieved TPW at 1541 UTC 4 September 2018 (black curve, unit: kg m−2) is shown in (c).
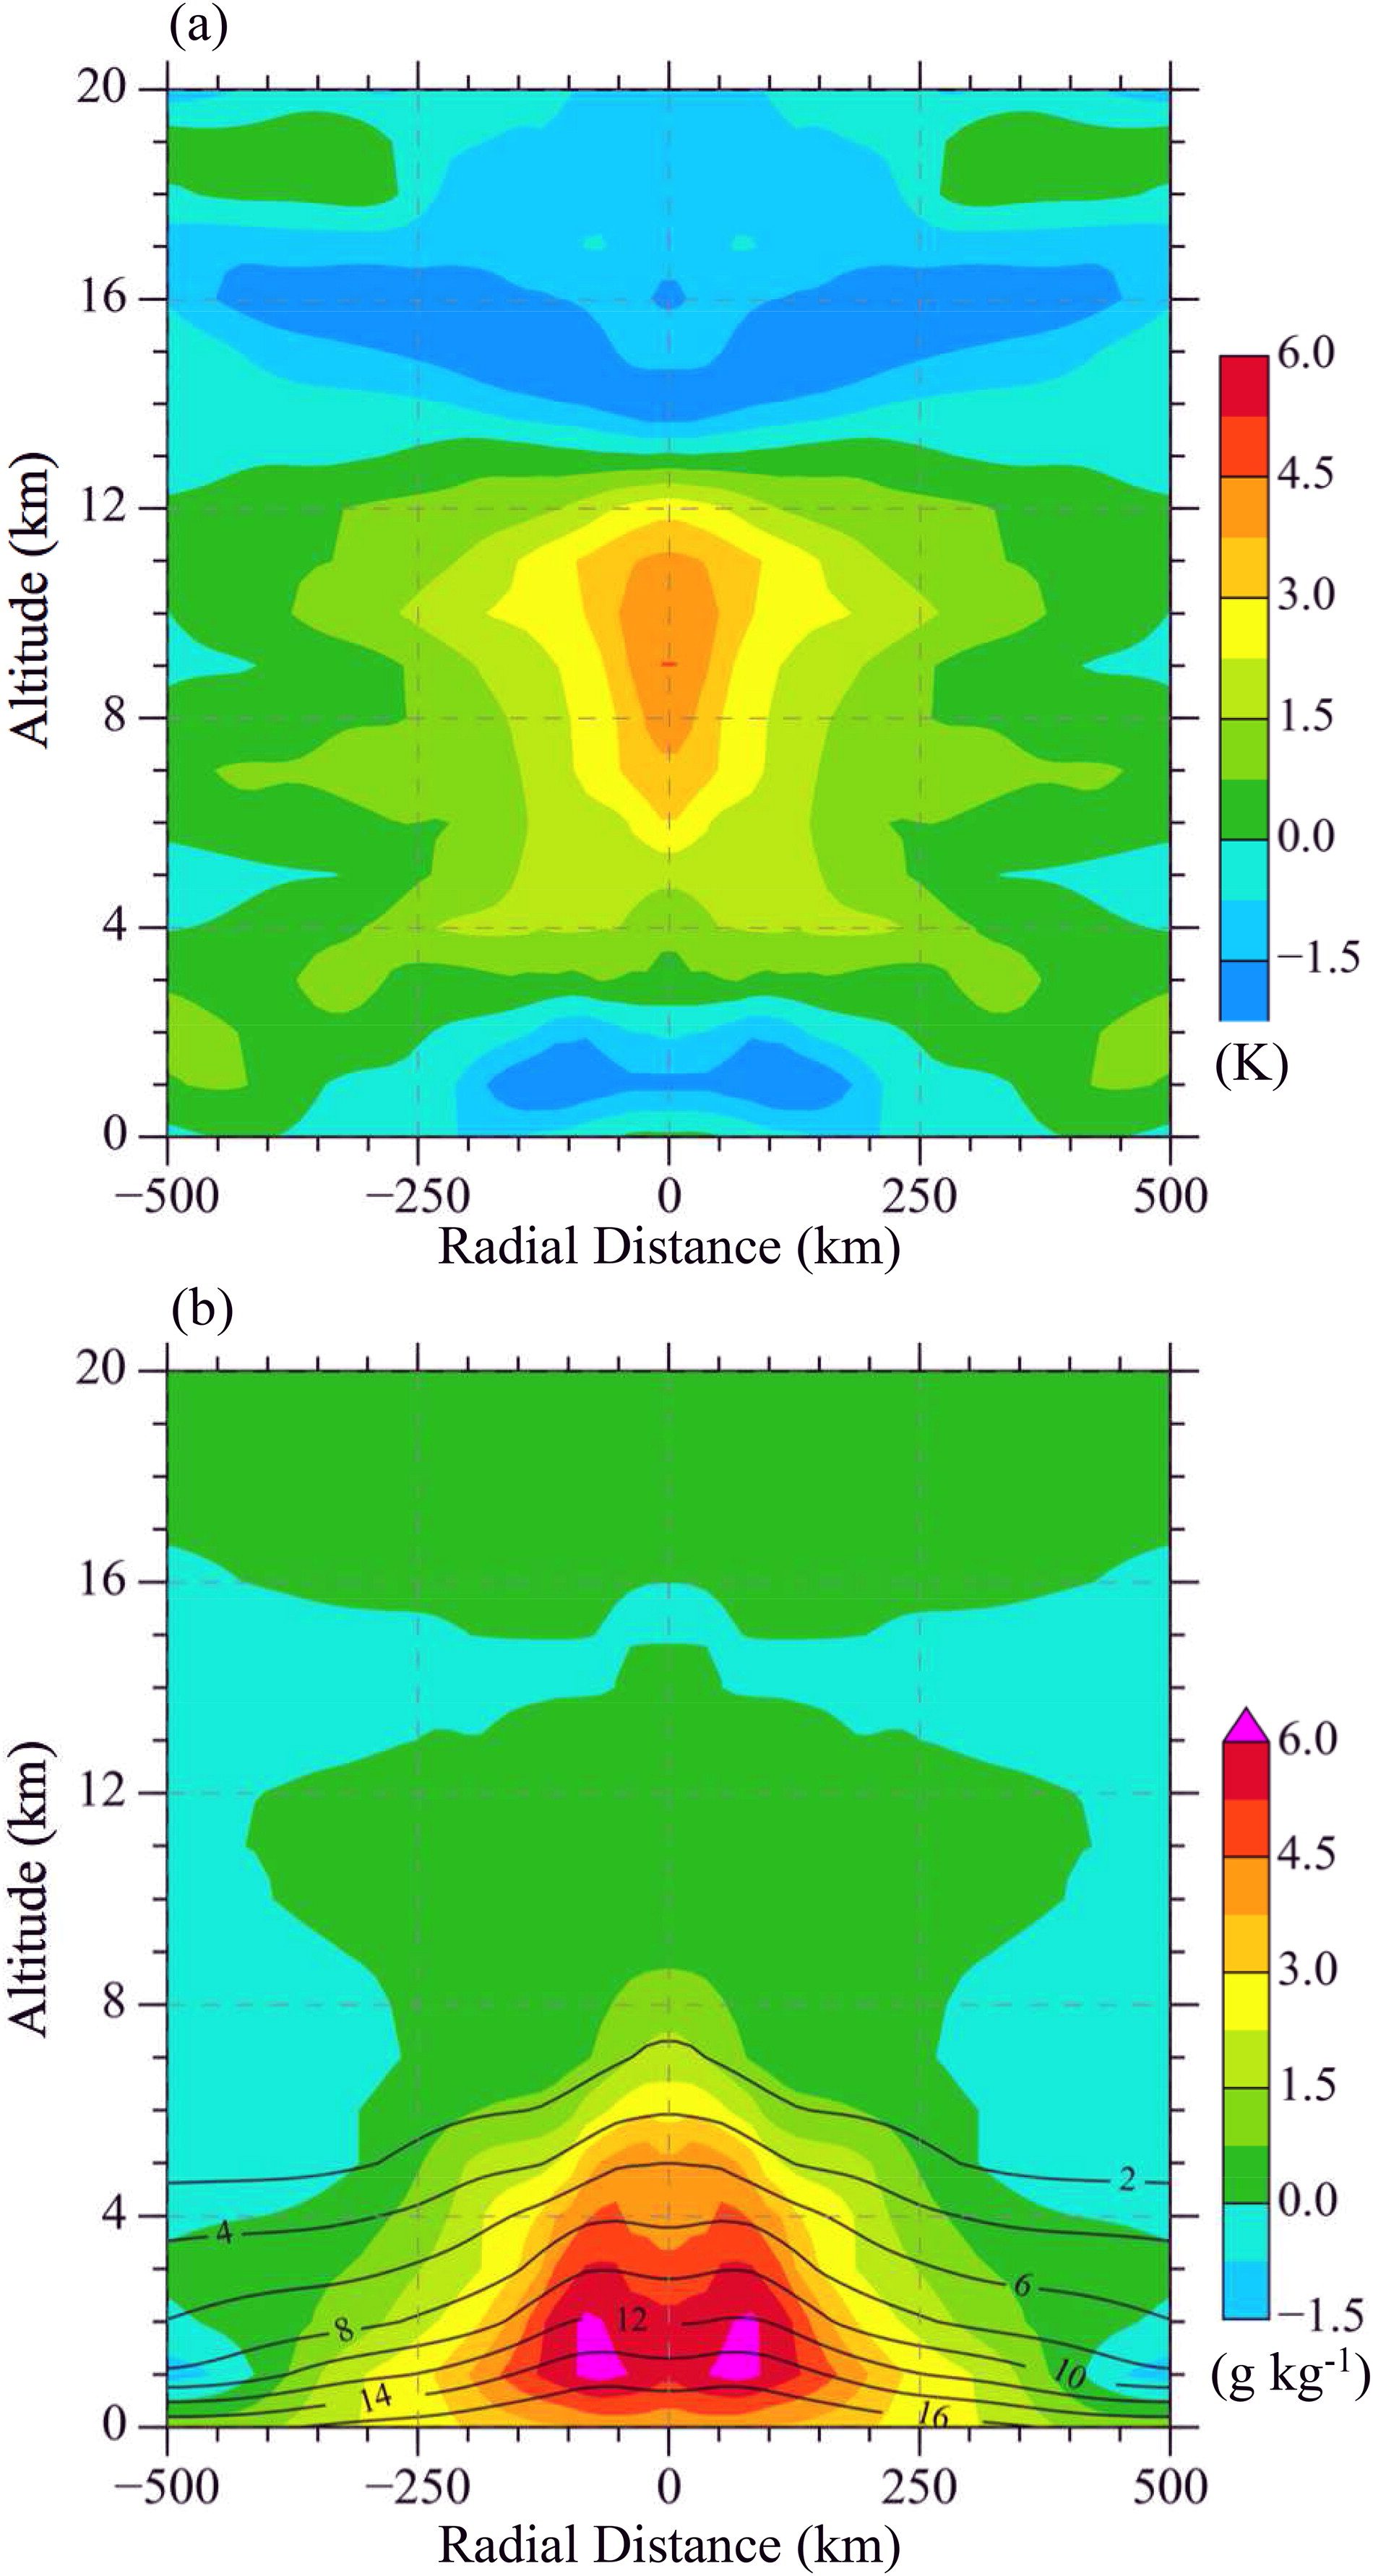
Fig. 10.
(a) Potential temperature anomaly (unit: K) and (b) water vapour mixing ratio anomaly (colour shading, unit: g kg−1) and mixing ratio (contours) of the 3.5-h forecast of the RE87 model initialized by the azimuthally averaged ERA5 reanalysis at 1200 UTC 4 September 2018.
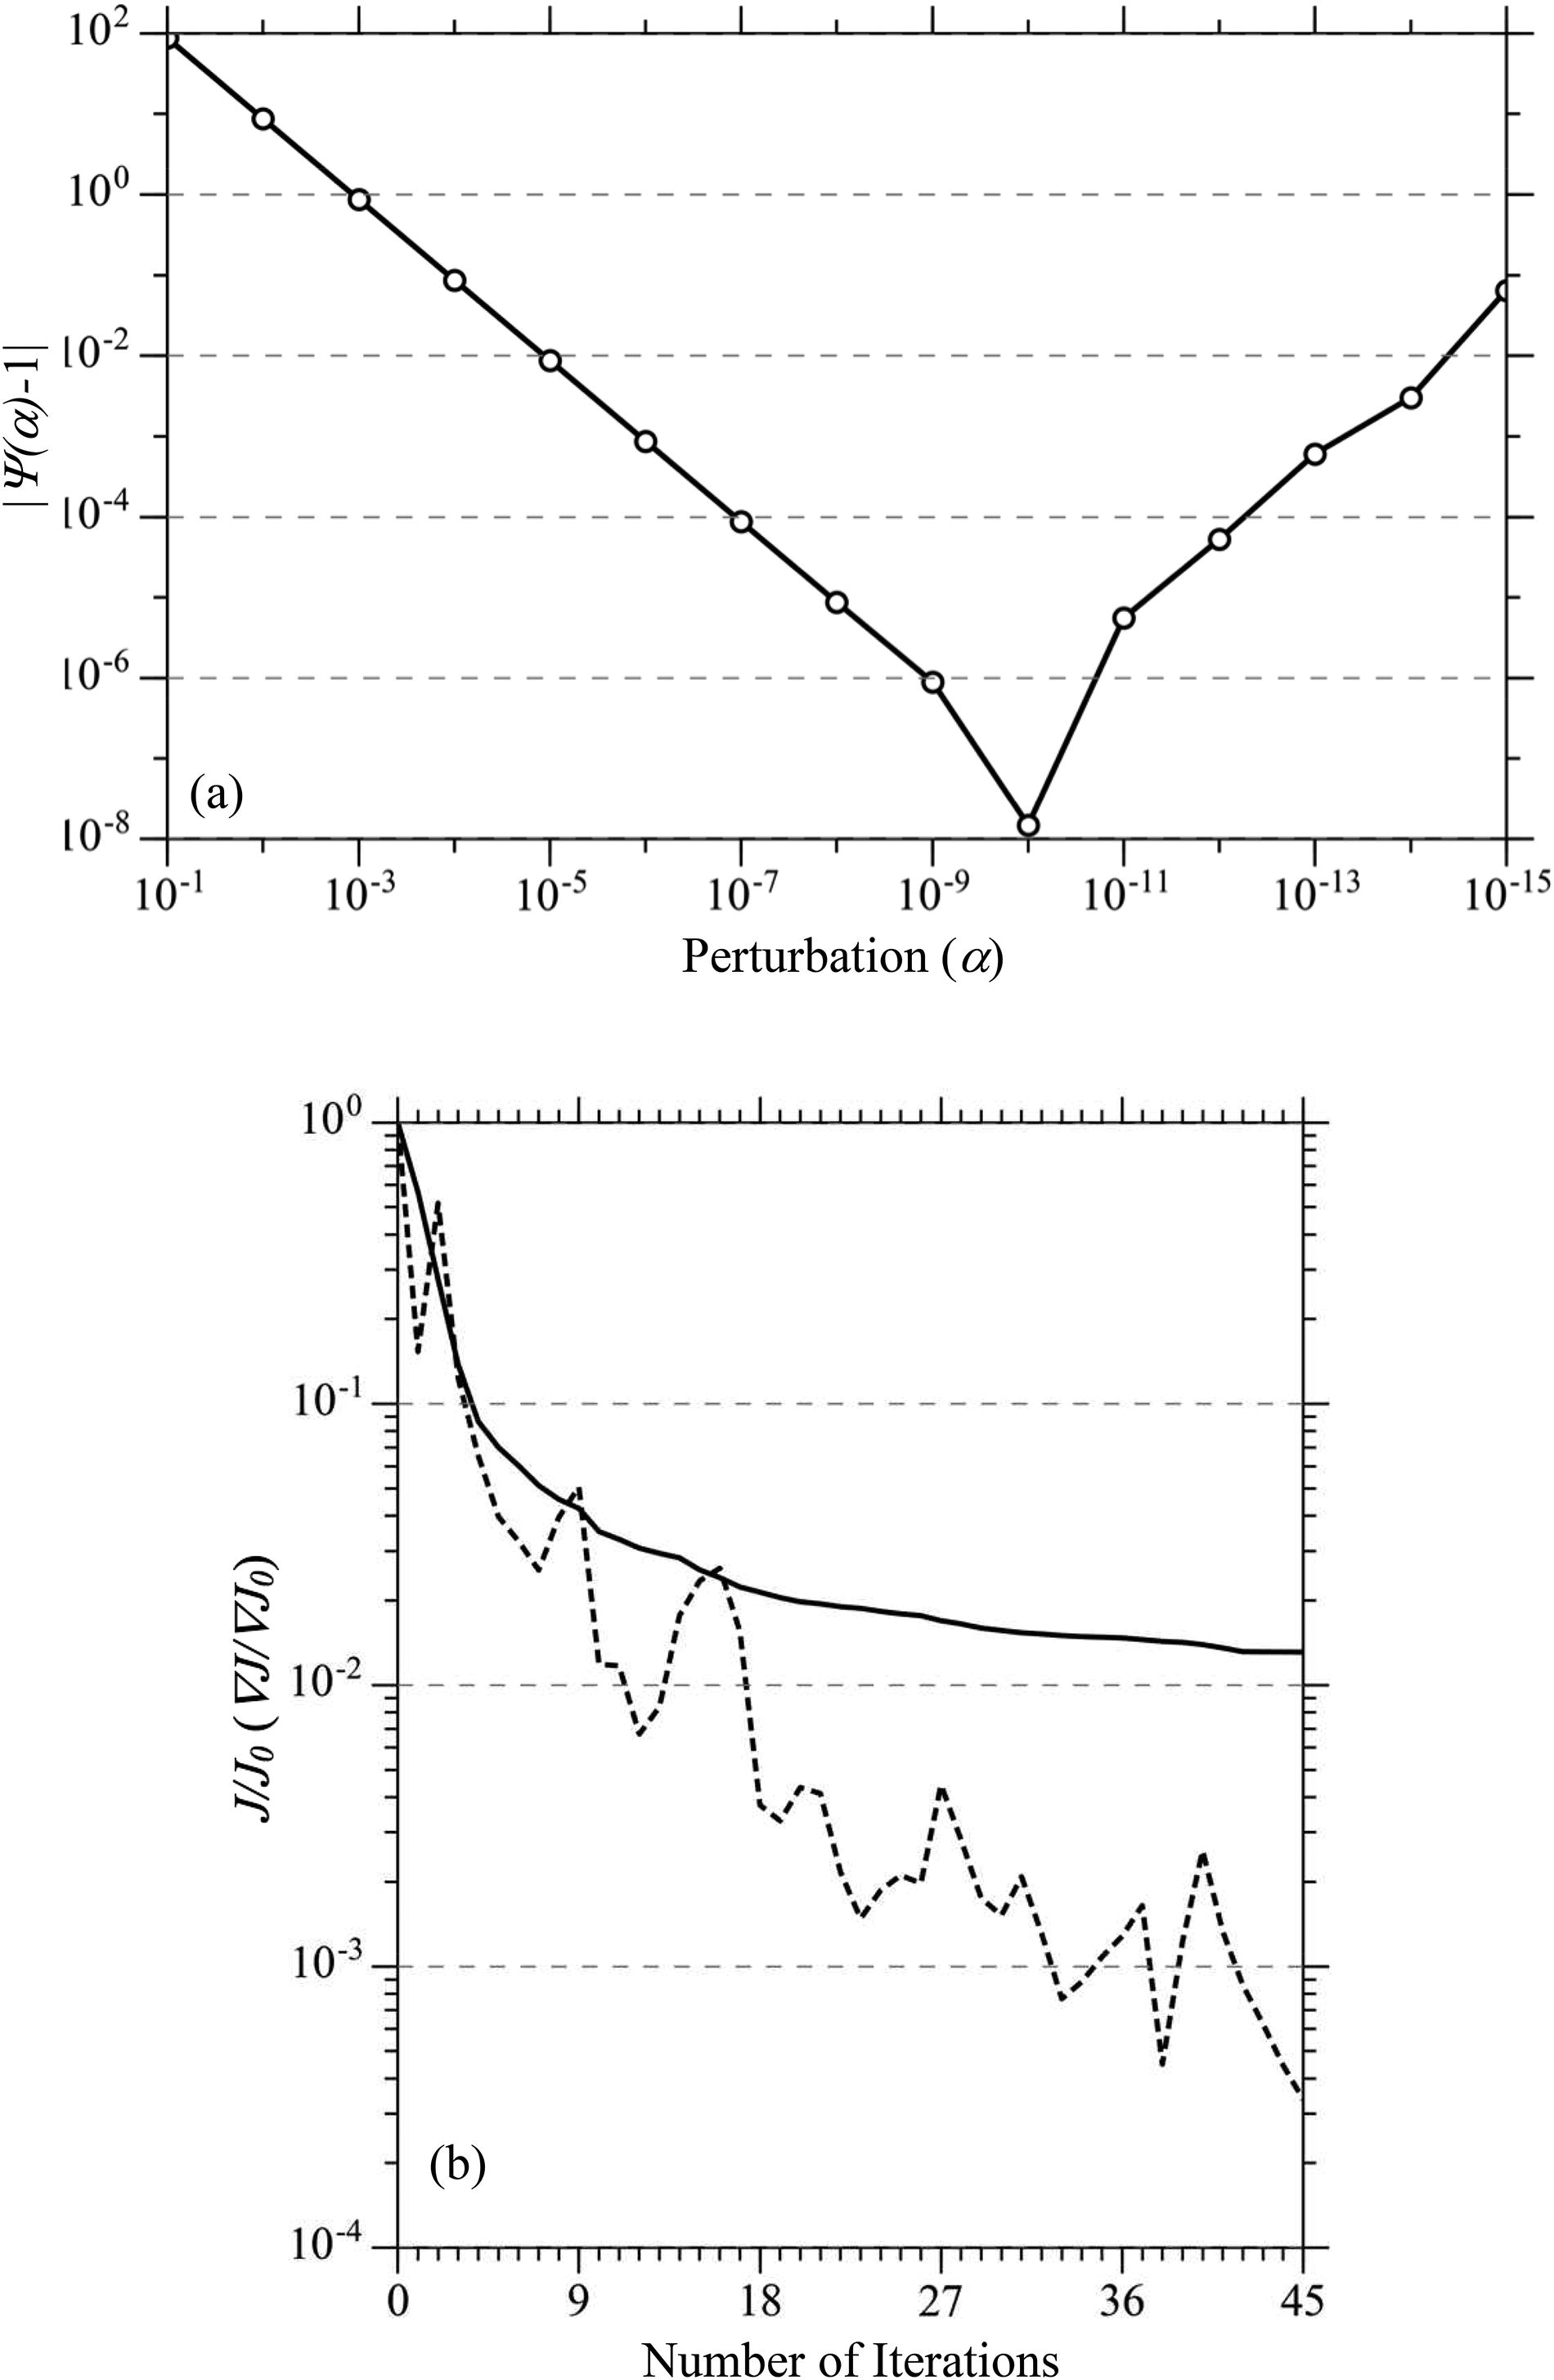
Fig. 11.
(a) Variations in |Ψ(α)−1| with respect to the perturbation magnitude parameter α and (b) the cost function (black curve) and the norm of the gradient of the cost function (dashed curve) with respect to the number of iterations.
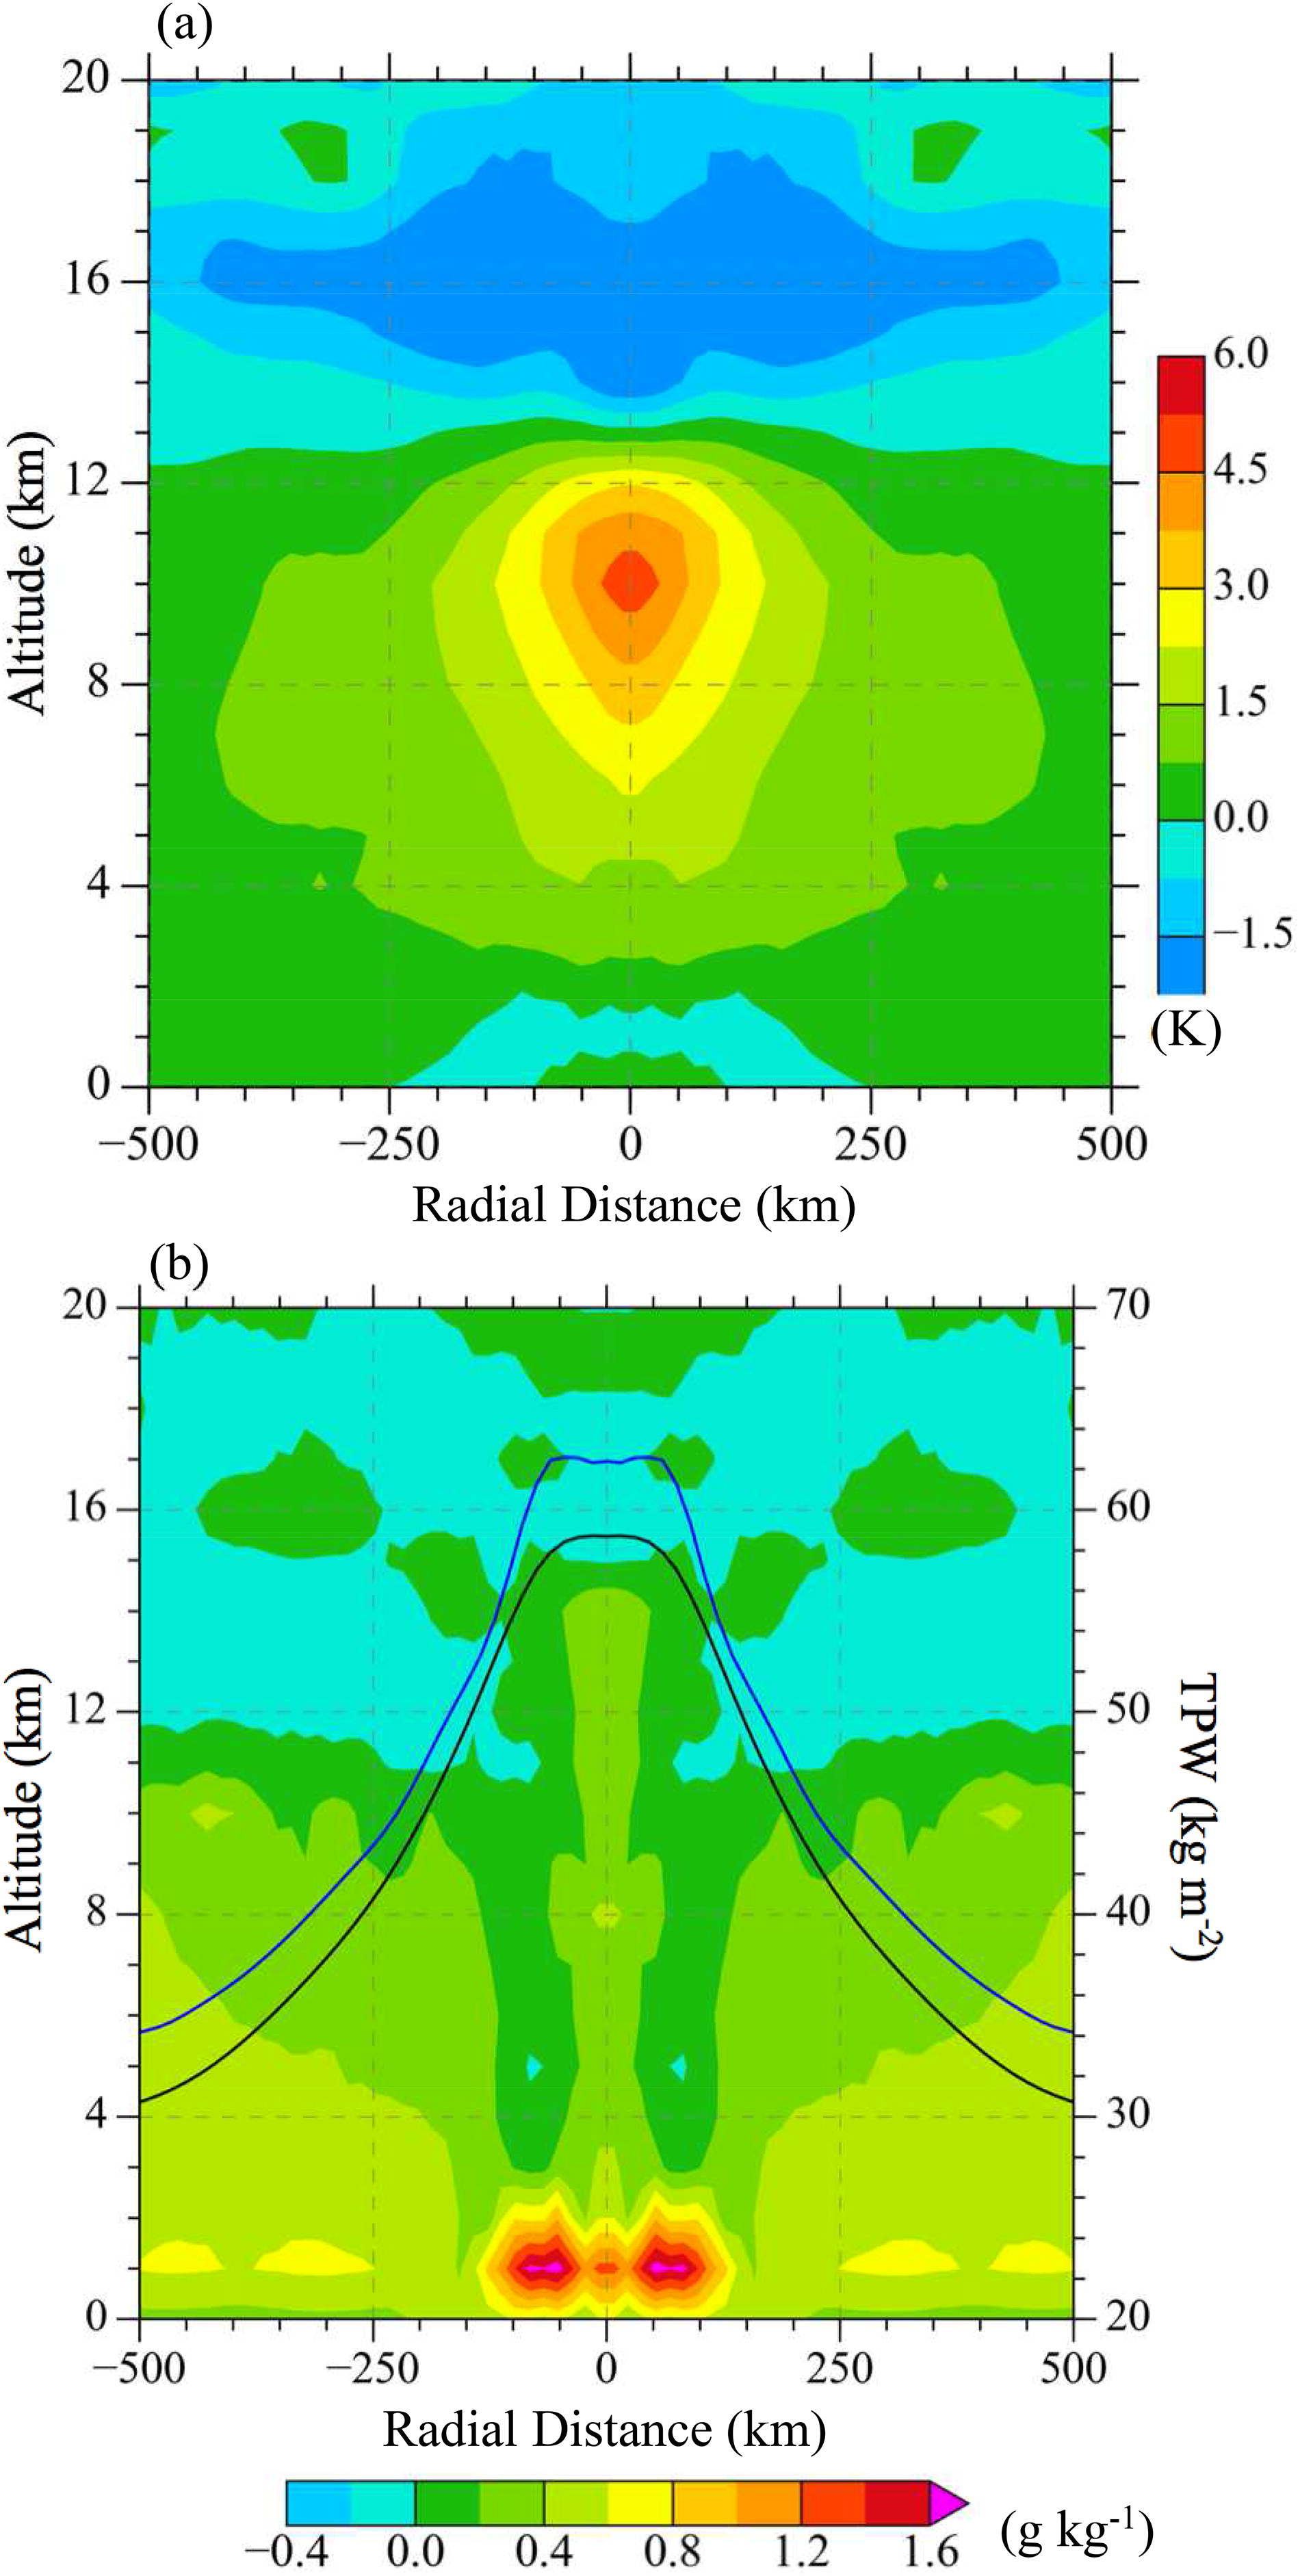
Fig. 12.
(a) Analysis of the potential temperature anomaly (unit: K) and (b) analysis increments of the water vapour mixing ratio (colour shading, unit: g kg−1) and the background (black curve), and analysis of TPW (blue curve, unit: kg m−2) at 1550 UTC 4 September 2018.
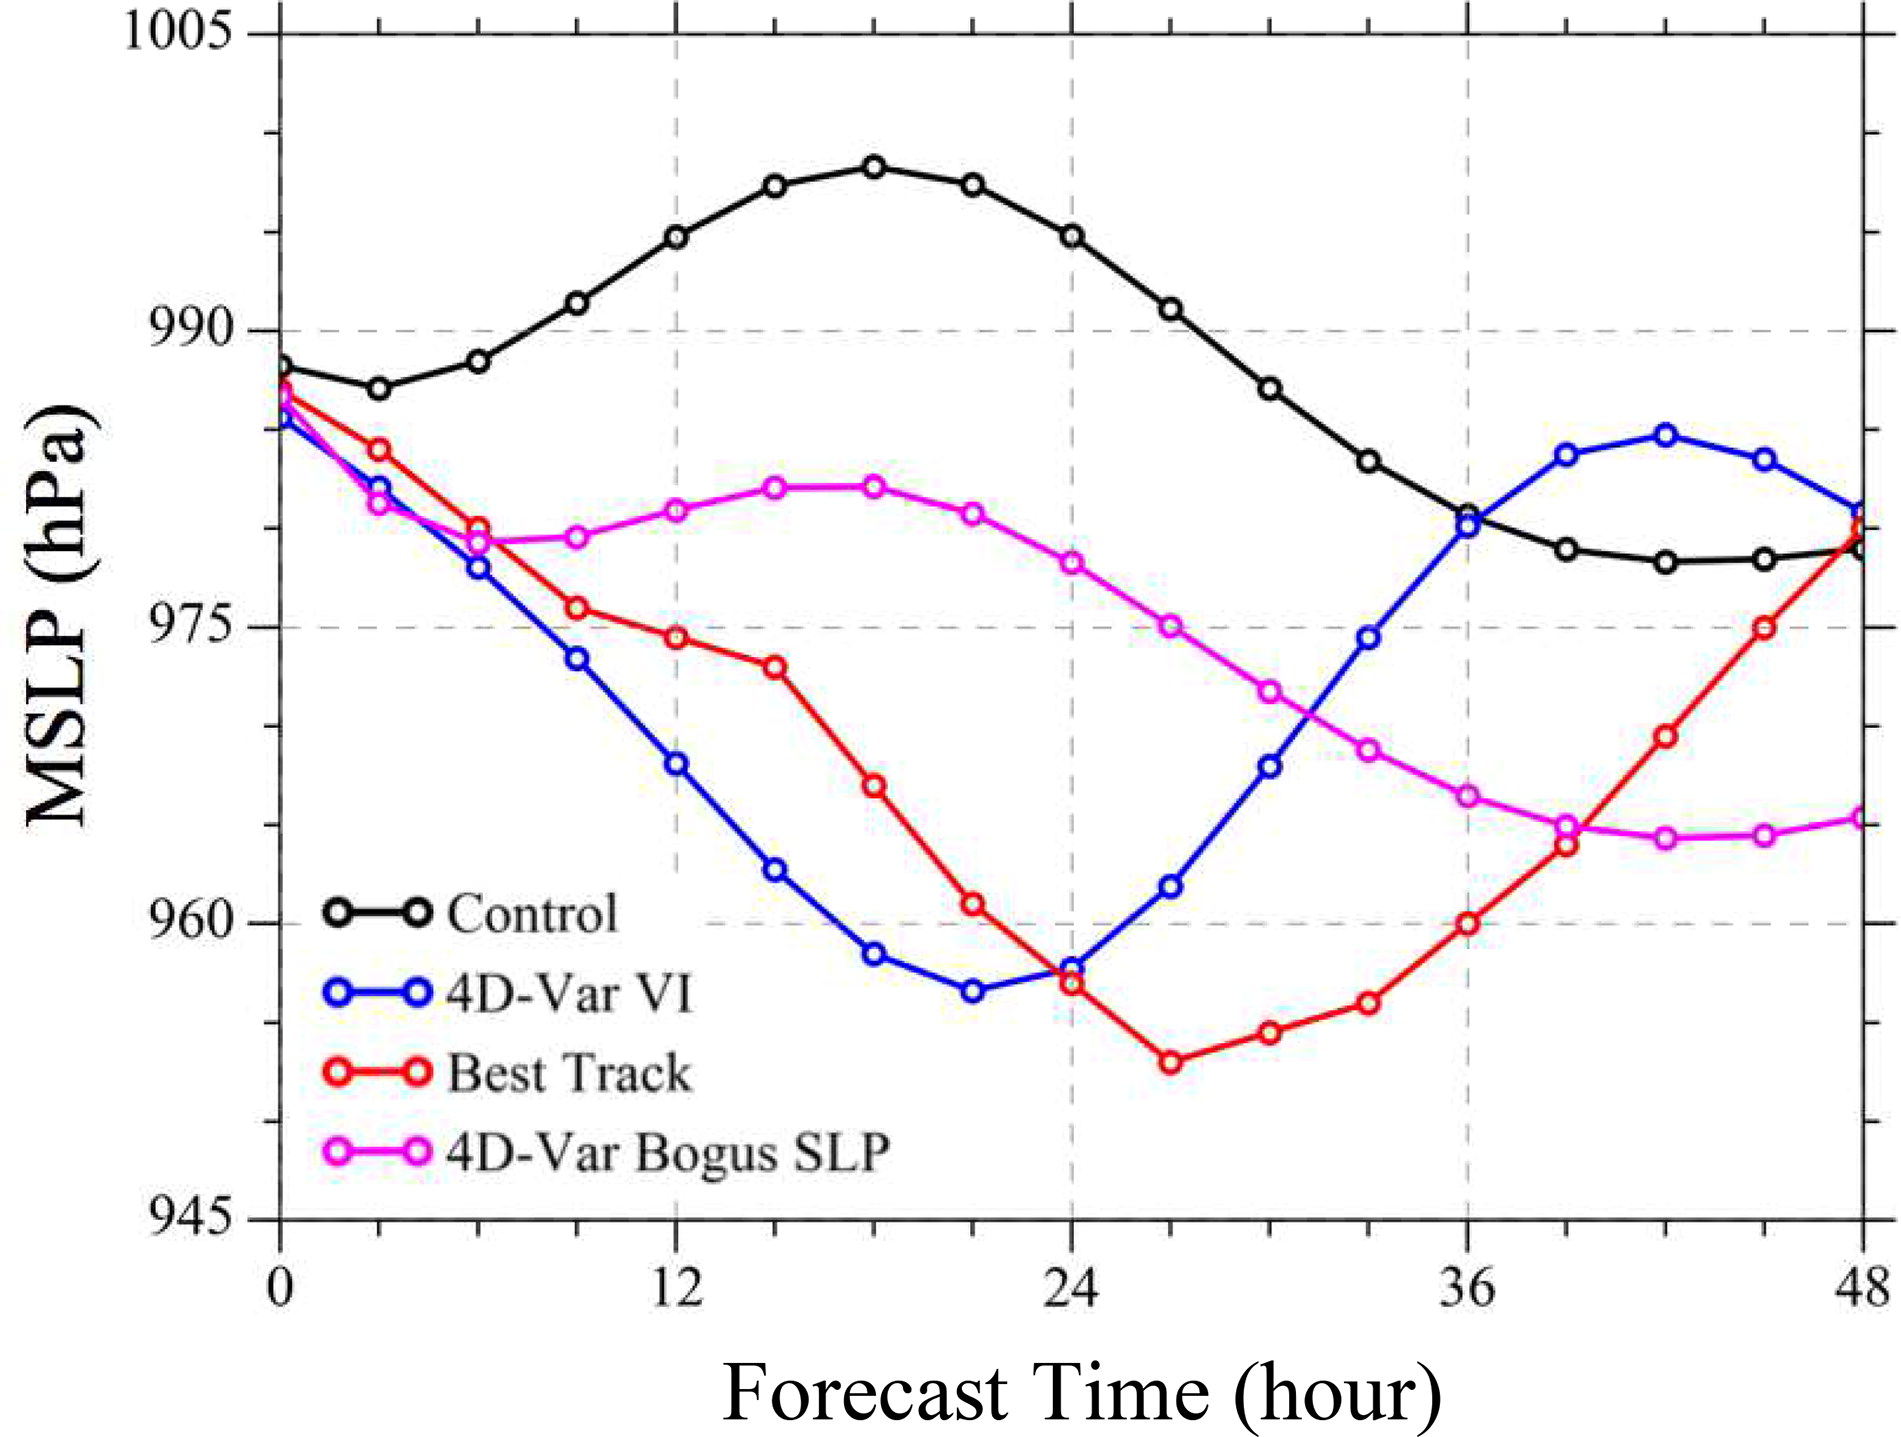
Fig. 13.
Temporal evolutions of the minimum sea level pressure (MSLP) forecasts for Hurricane Florence by the RE87 model initialized by the 4D-Var VI vortex (blue curve) and the background field (black curve) at 1530 UTC 4 September 2018. The best track records are also provided (red curve). The results from assimilating bogus SLP are shown with the magenta curve.
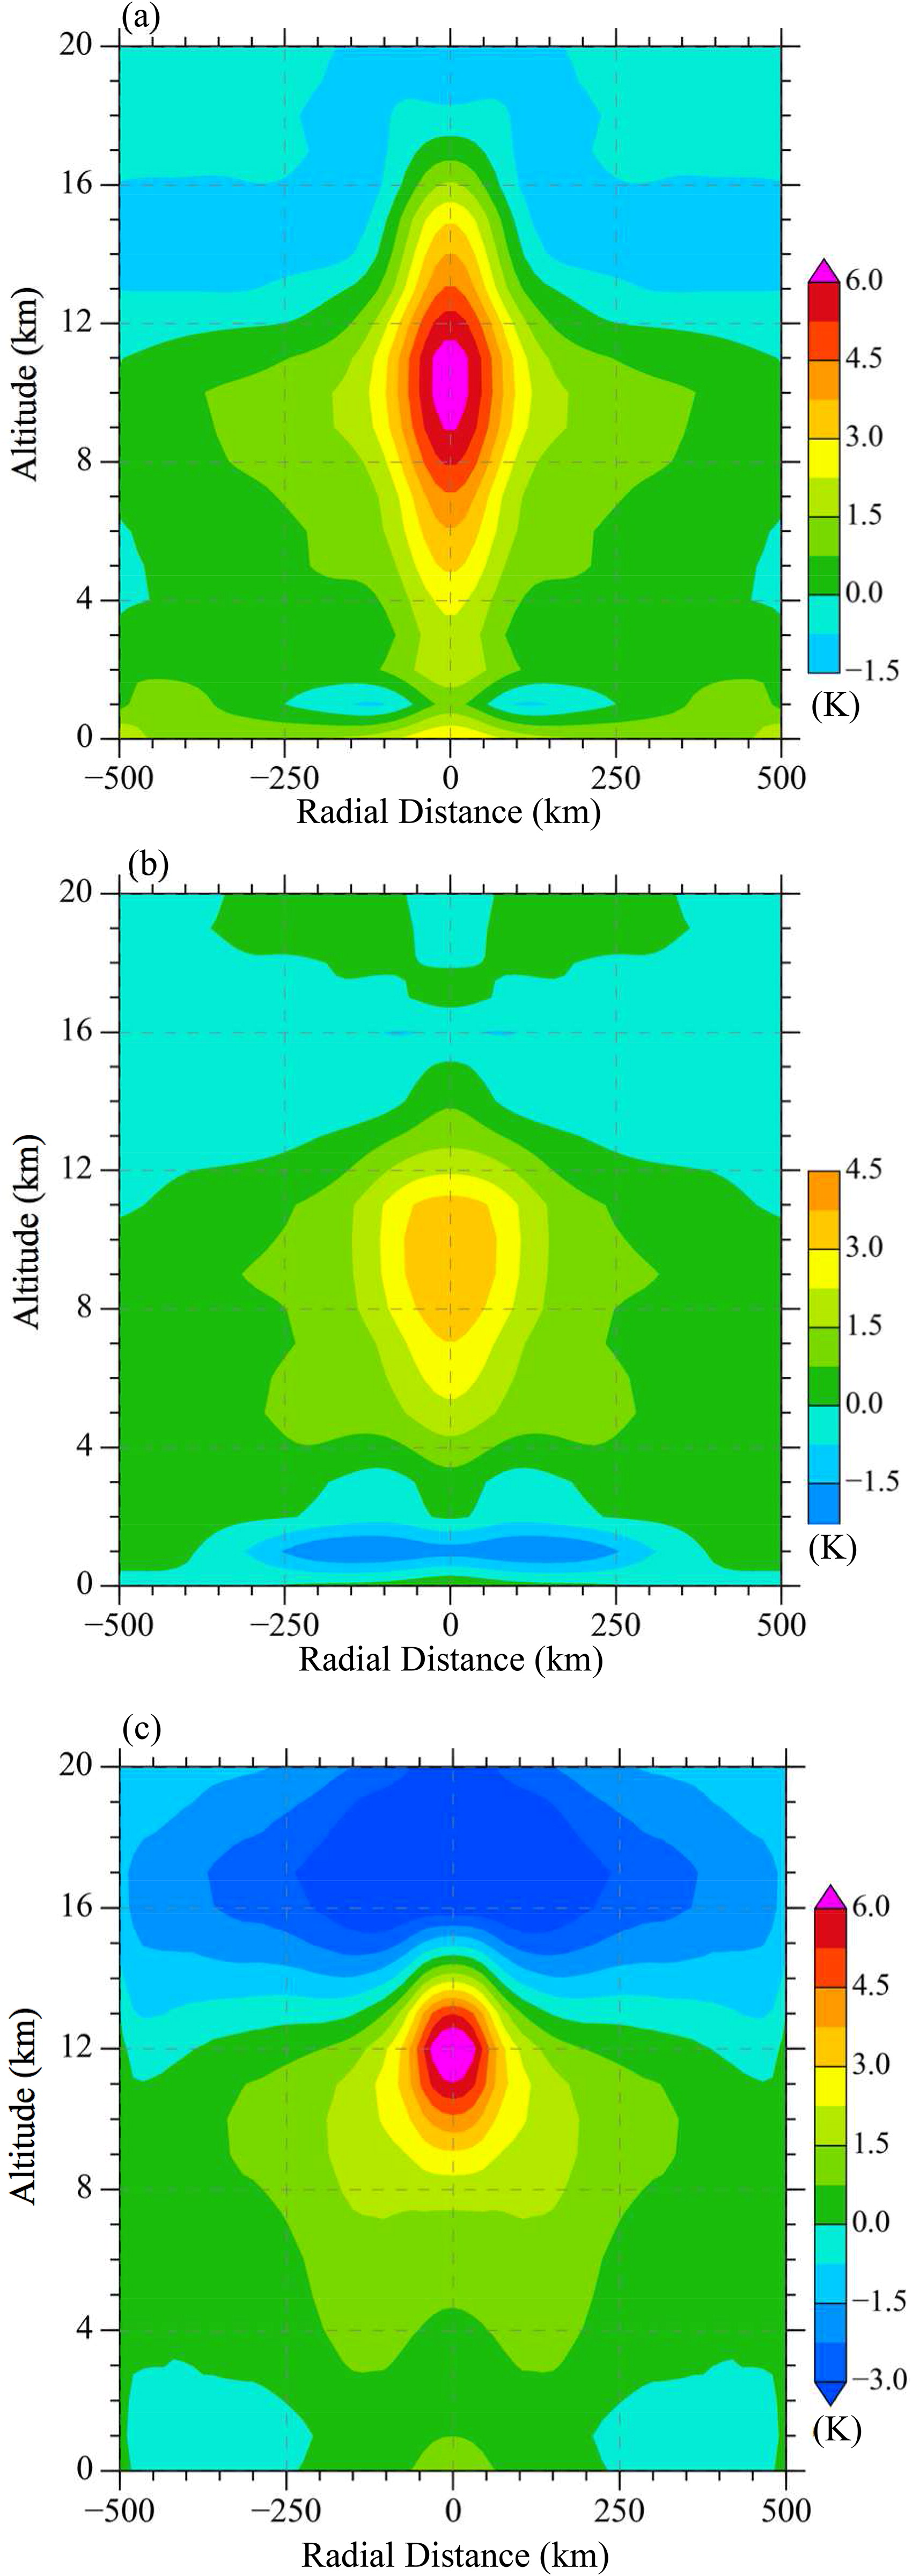
Fig. 14.
Cross-sections of the potential temperature anomalies (unit: K) of the 24-h forecasts from the (a) 4D-Var VI and (b) control experiment. (c) Azimuthally averaged potential temperature anomalies of S-NPP ATMS at 1621 UTC September 5, 2018.
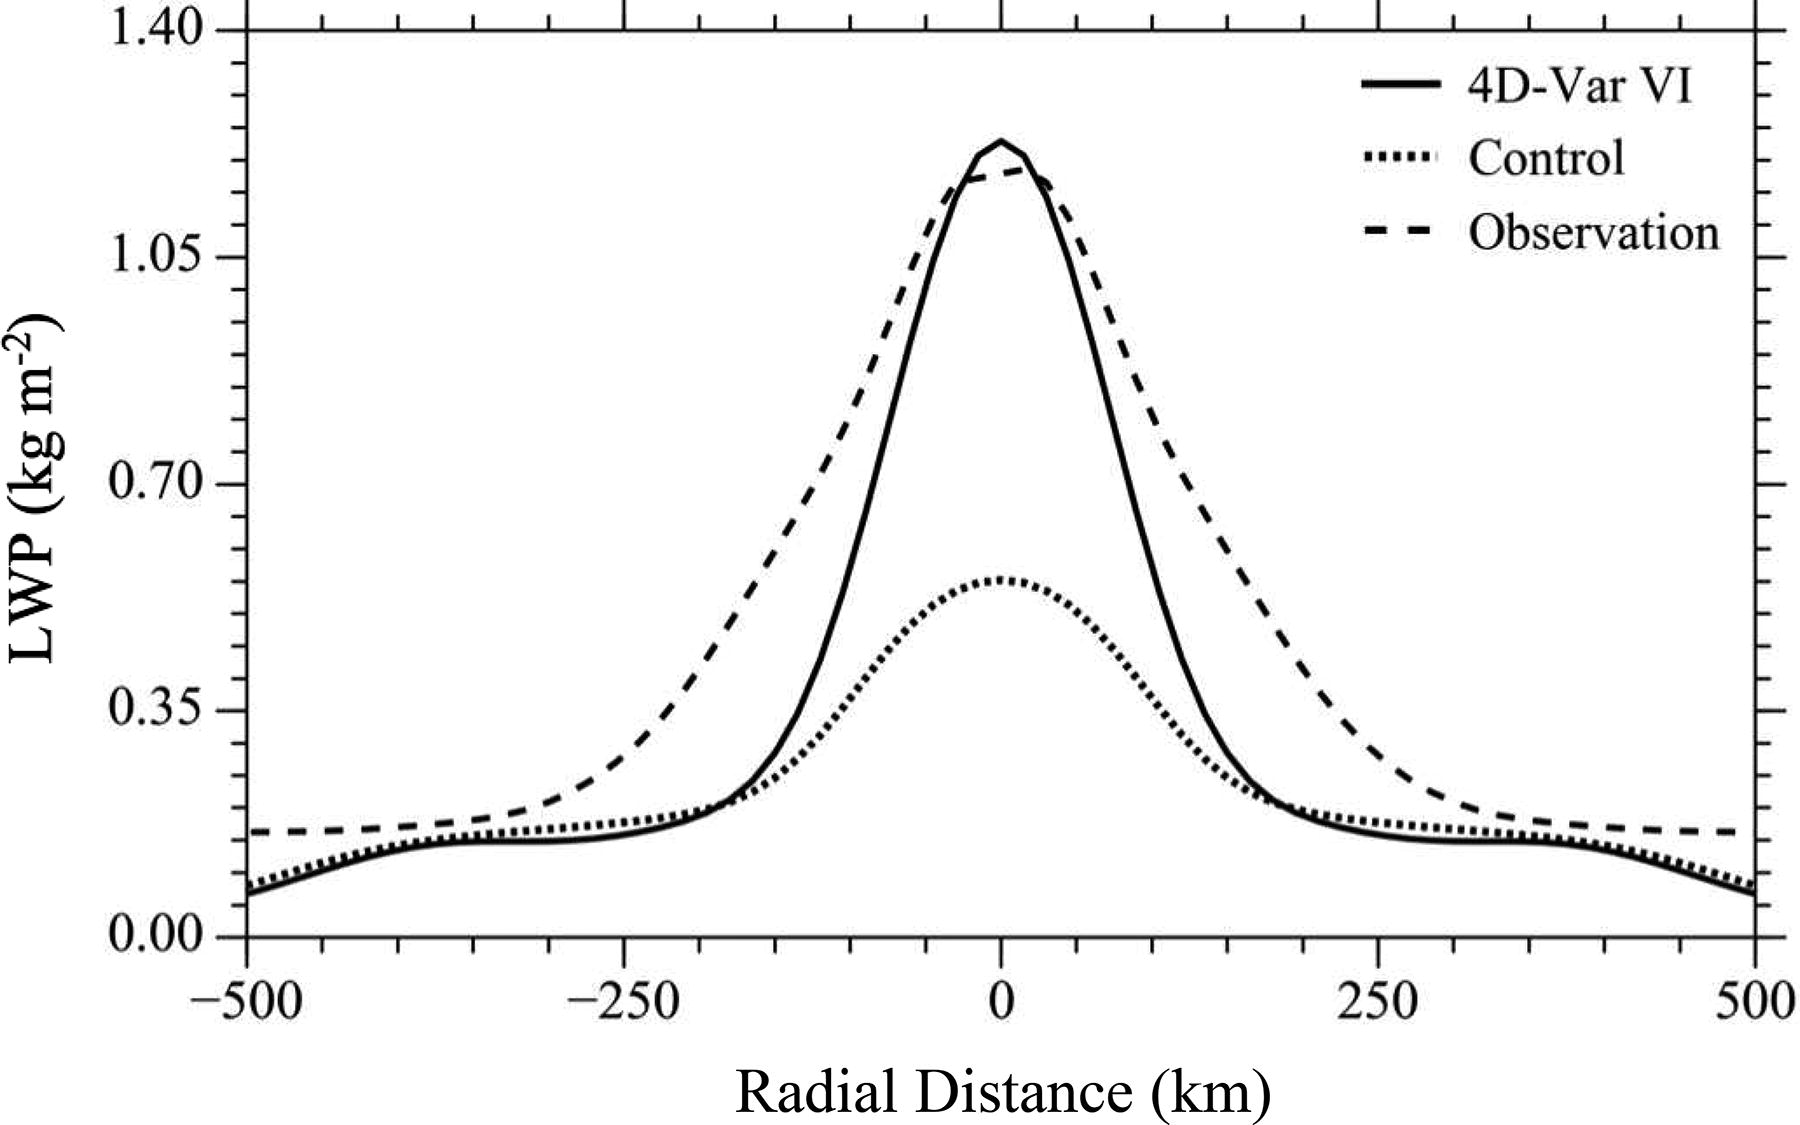
Fig. 15.
Radial variations of LWP from the 24-h RE87 model forecast in 4D-Var VI experiment (solid curve), control experiment (dotted curve), and AMSR2 observations (dashed curve) at 1624 UTC September 6, 2018.
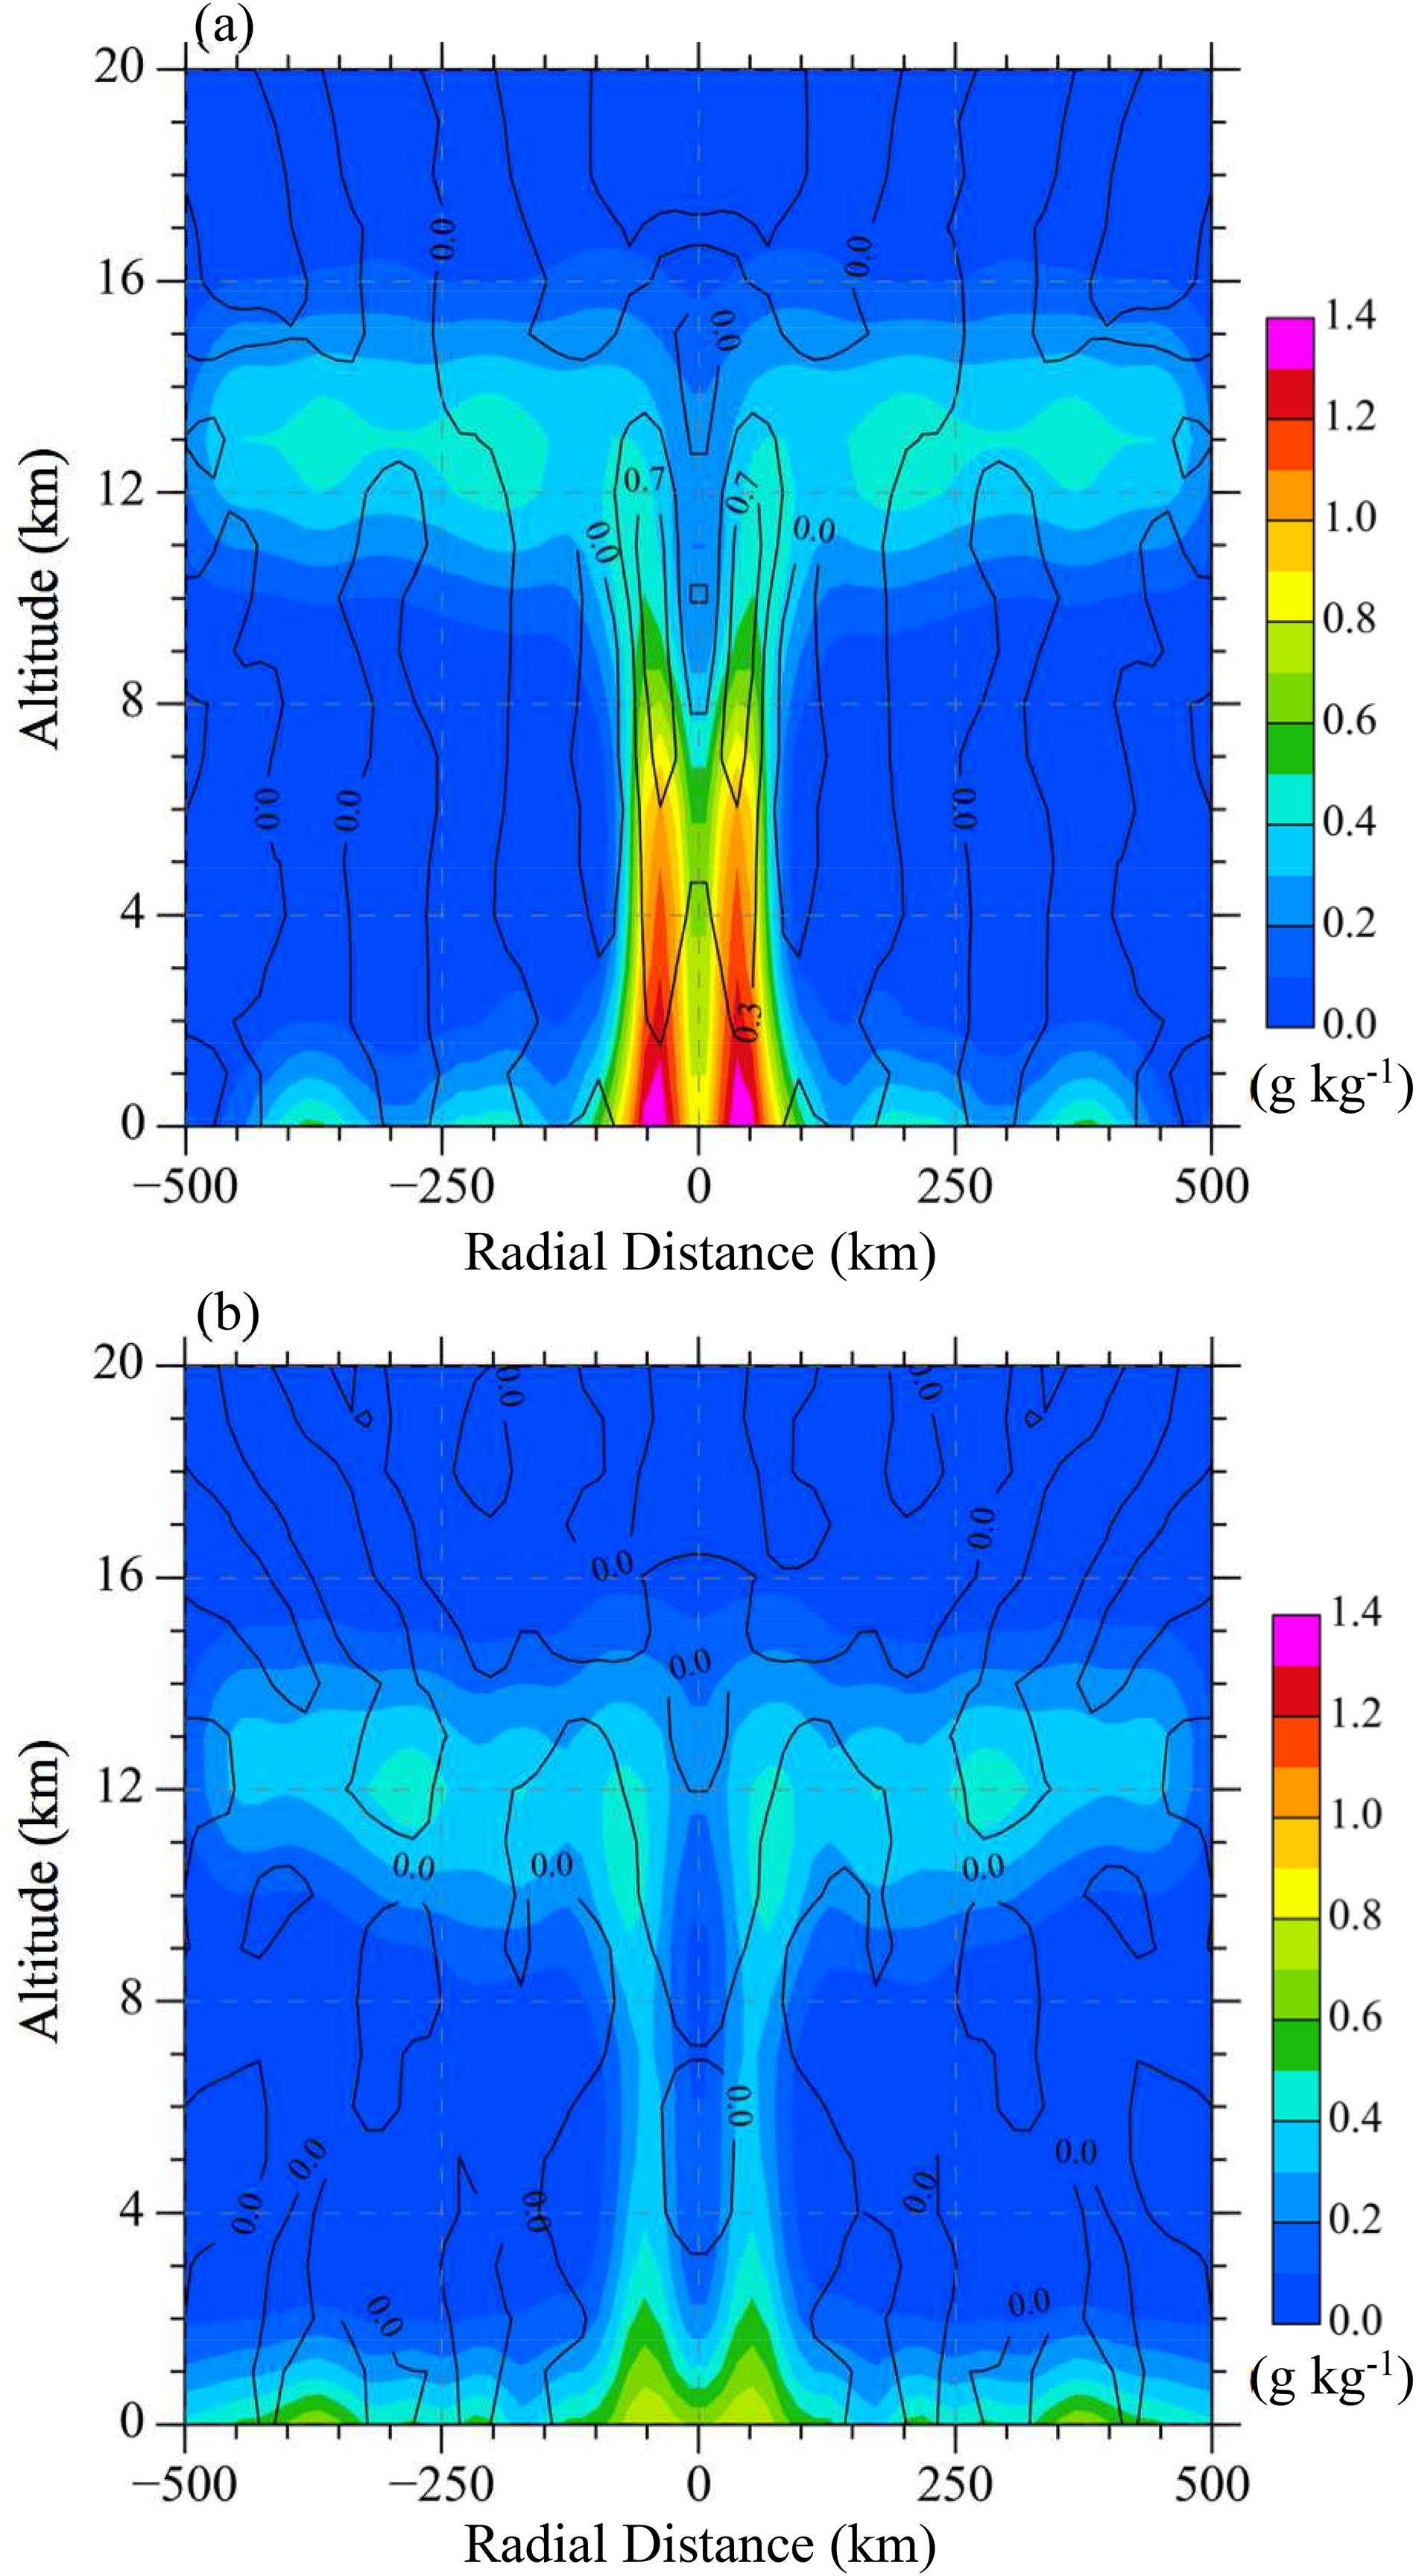
Fig. 16.
Cross-sections of liquid water mixing ratio (colour shading, unit: g kg−1) and vertical wind velocity (contours, unit: m s−1) of the 24-h forecasts from the (a) 4D-Var VI and (b) control experiment.
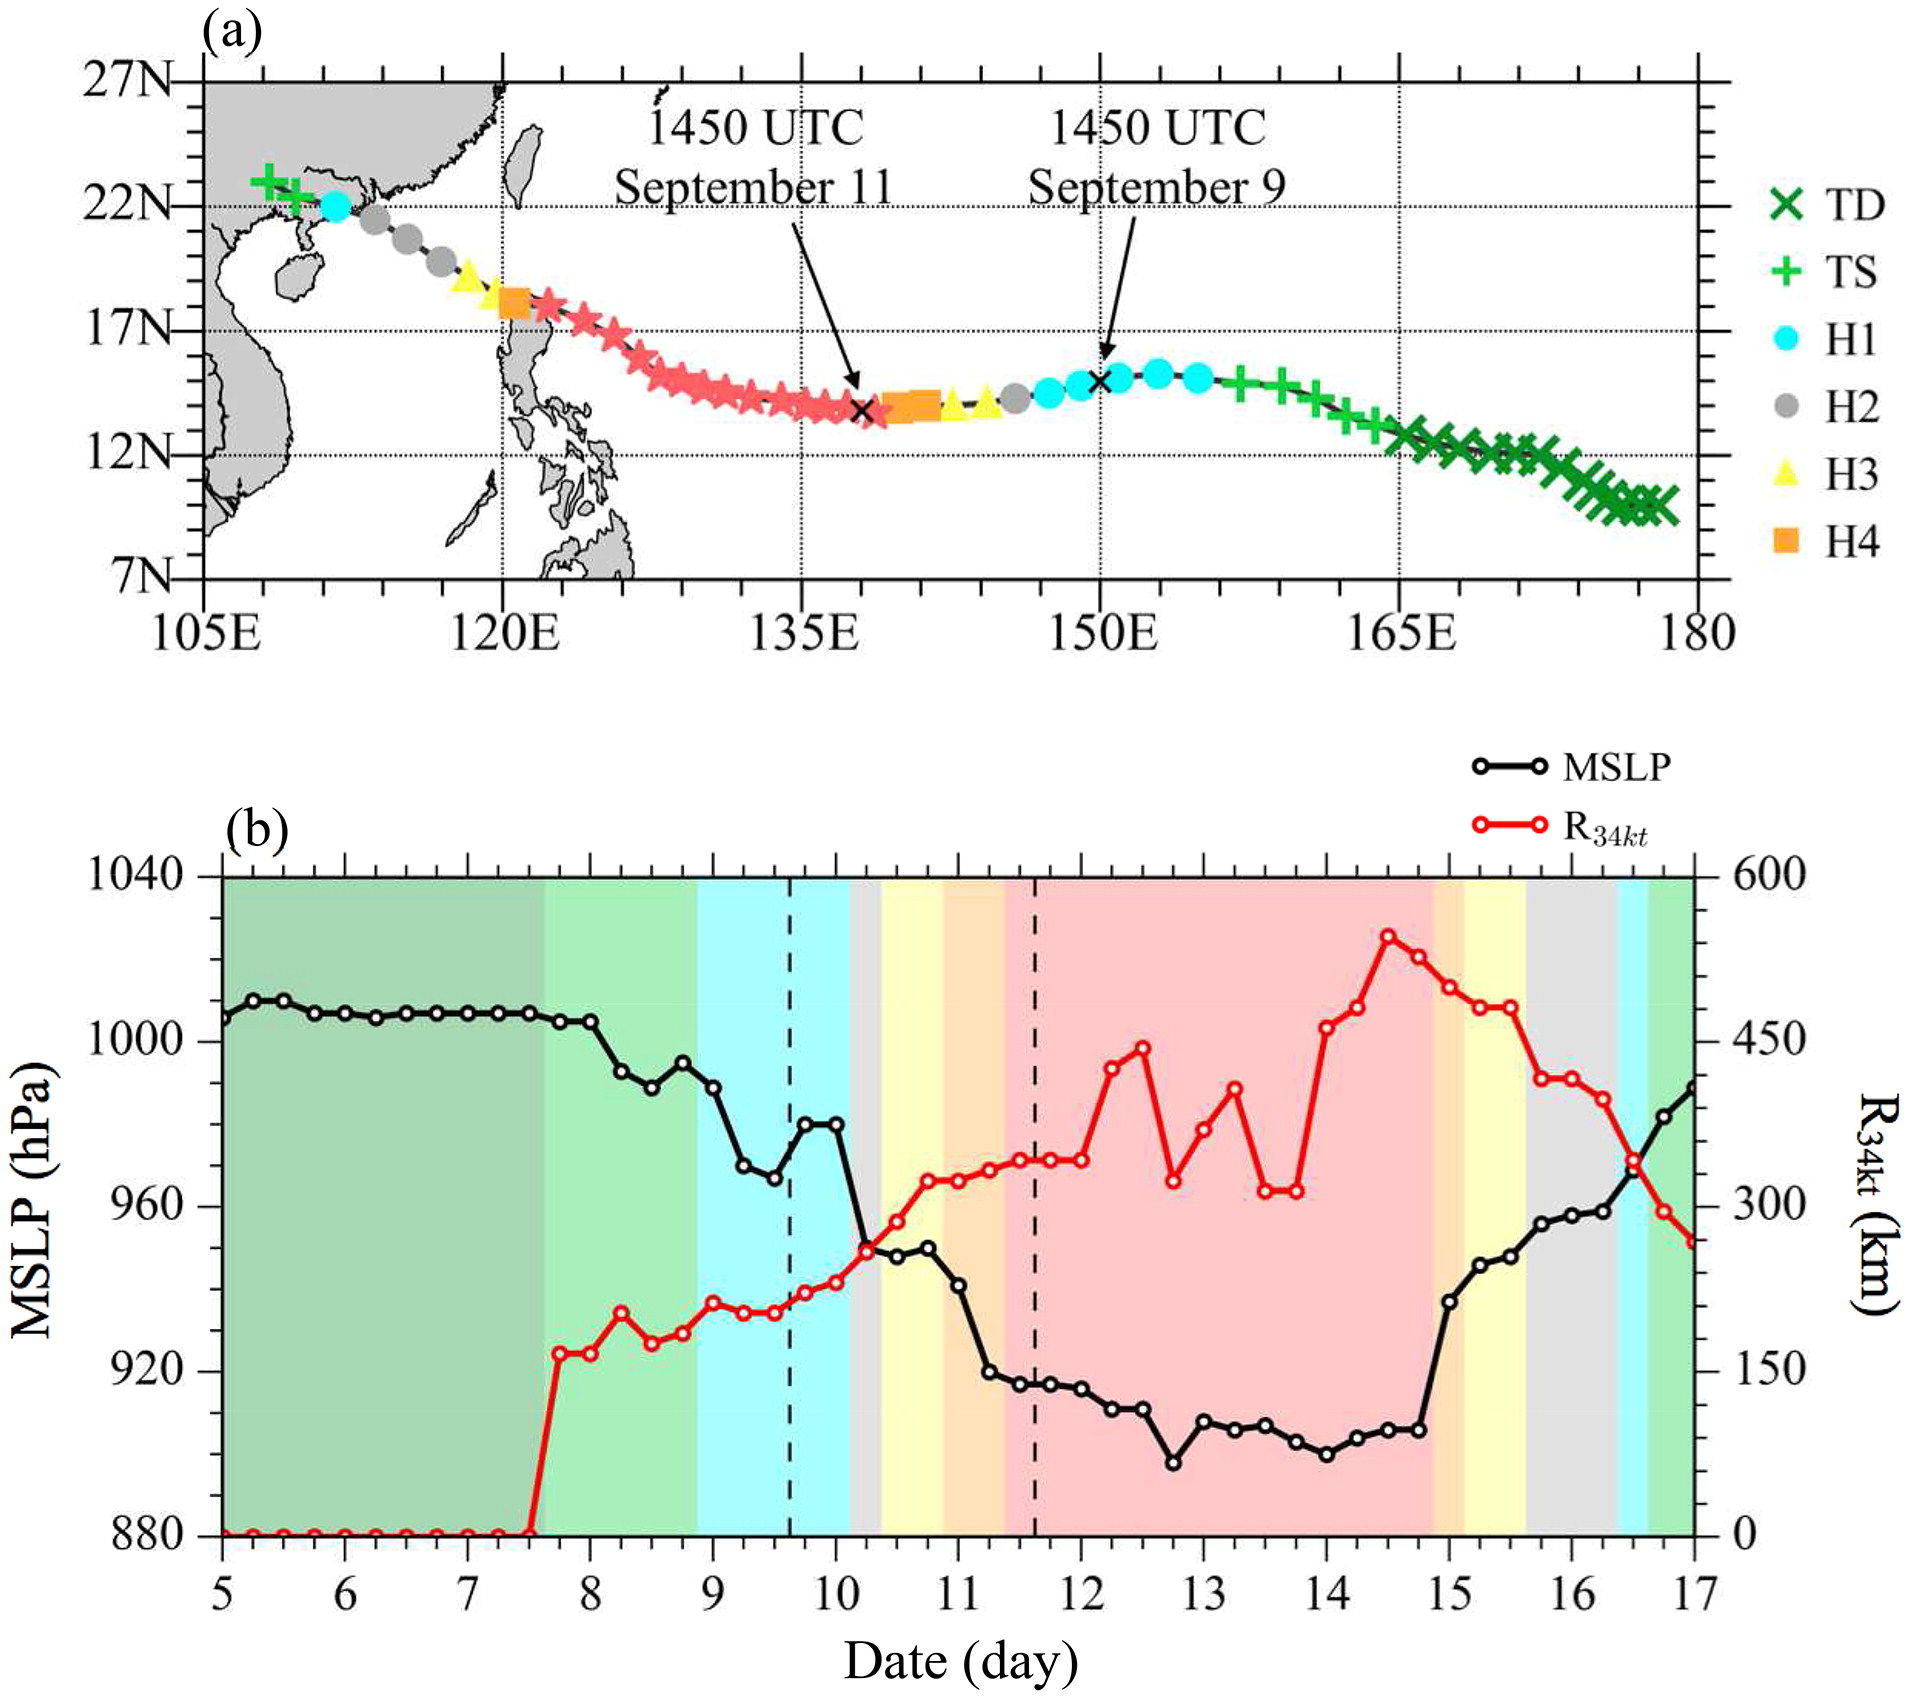
Fig. 17.
(a) The best track of Typhoon Mangkhut (2018) with the intensities marked in different shapes and colours during the time period from 5 to 17 September 2018 at a 6-h interval. (b) The mean sea level pressure (black) and 34-kt wind radius (red) from 5 to 17 September 2018. The analysis time of 1450 UTC is marked with the vertical dashed line.
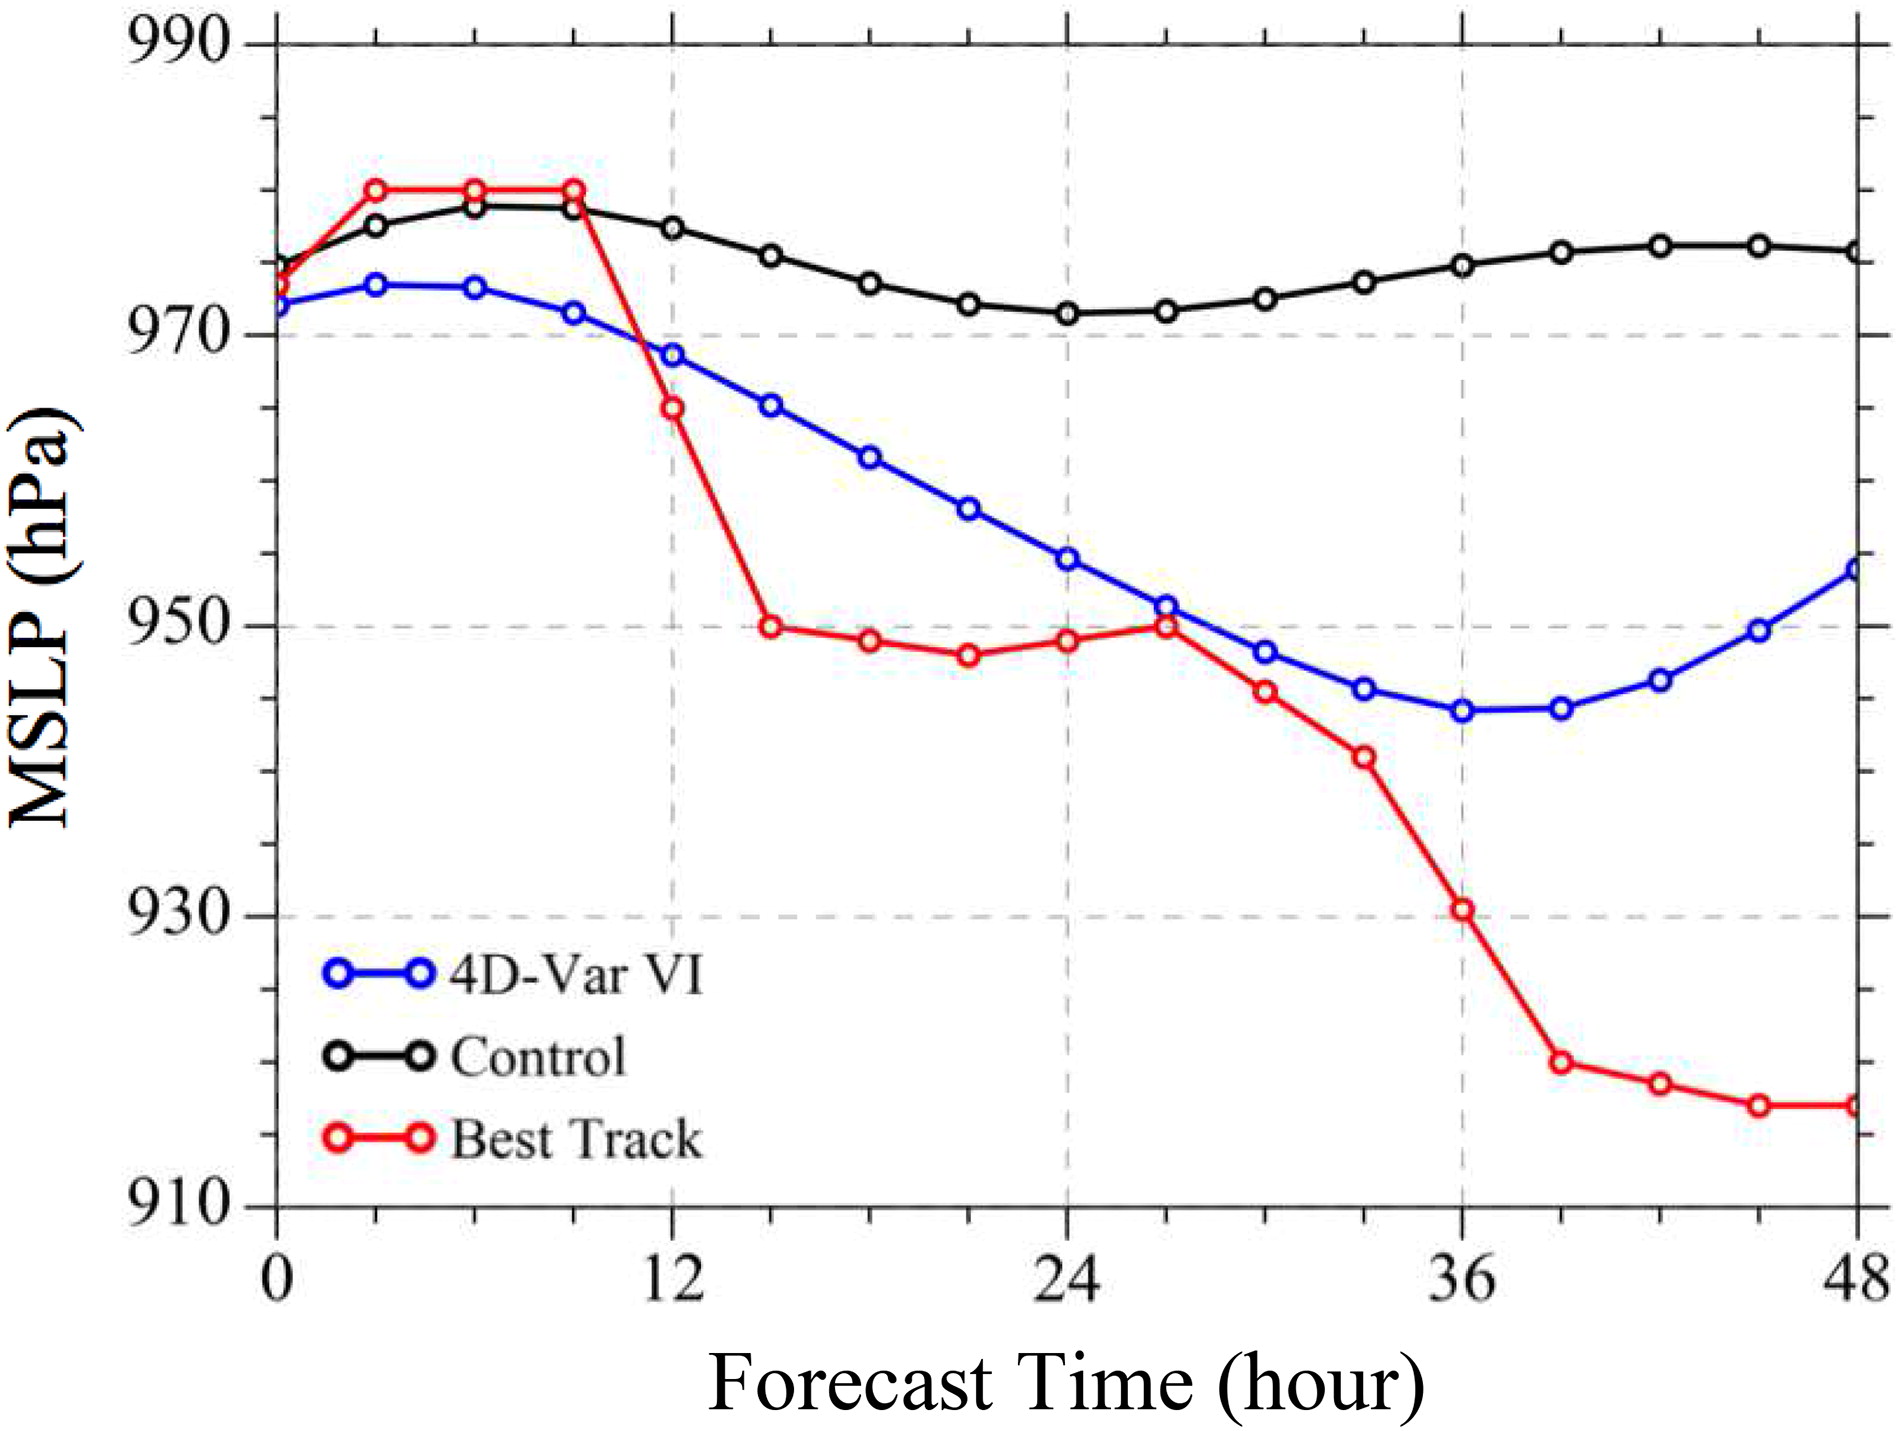
Fig. 18.
The evolution of the minimum sea level pressure in the forecast made with RE87 model in the case of Typhoon Mangkhut taking the 4D-Var initialized vortex (blue curve) as initial conditions and the control experiment (black curve). The MSLP in Best Track records are shown with the red curve.