
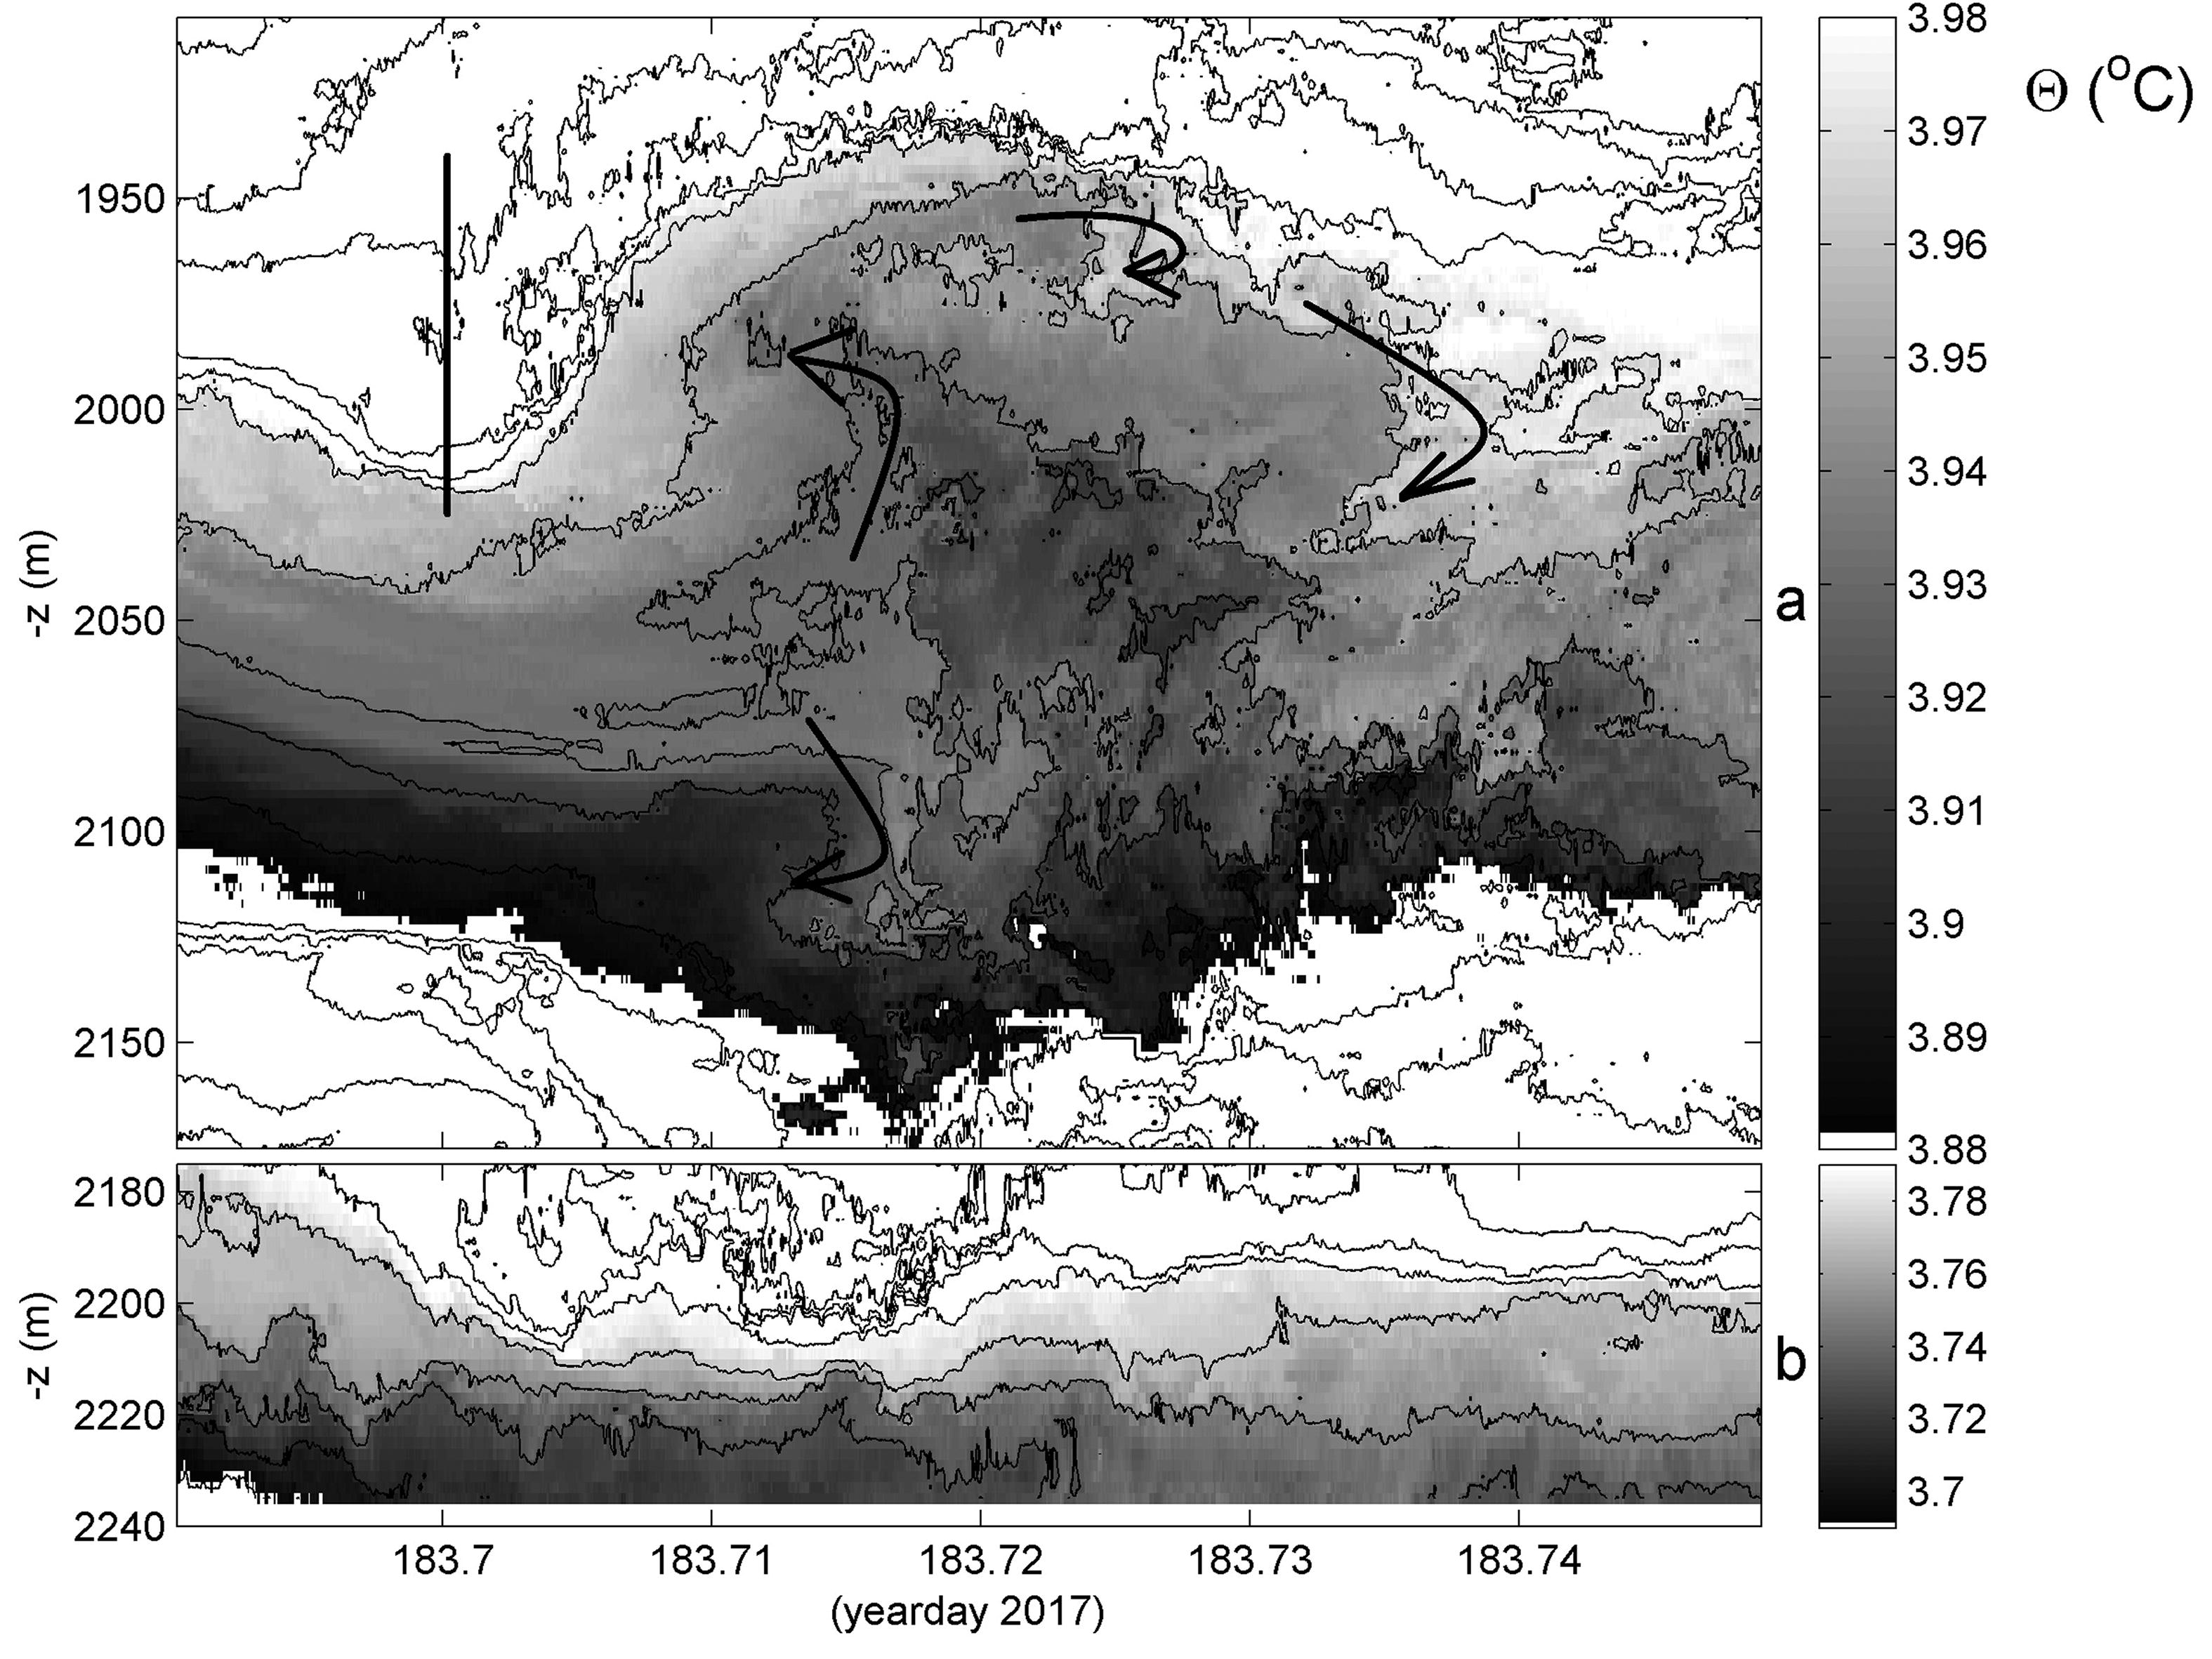
Fig. 1.
Example of detailed off-bottom >100-m tall turbulence expansion burst from 1.5 h of high-resolution conservative (∼potential) temperature data observed on July 2 (yearday 183) between 8 and 405 m above the bottom ‘mab’, with 19 flawed T-sensors interpolated. Black contours are drawn every 0.02 °C. (a) Middle 268 m of the T-sensor range. The black vertical bar indicates the transition moment to supercritical flow, the arrows some overturning interpretations. (b) Lower 65 m above the bottom (seafloor = horizontal axis) with different colour ranges.
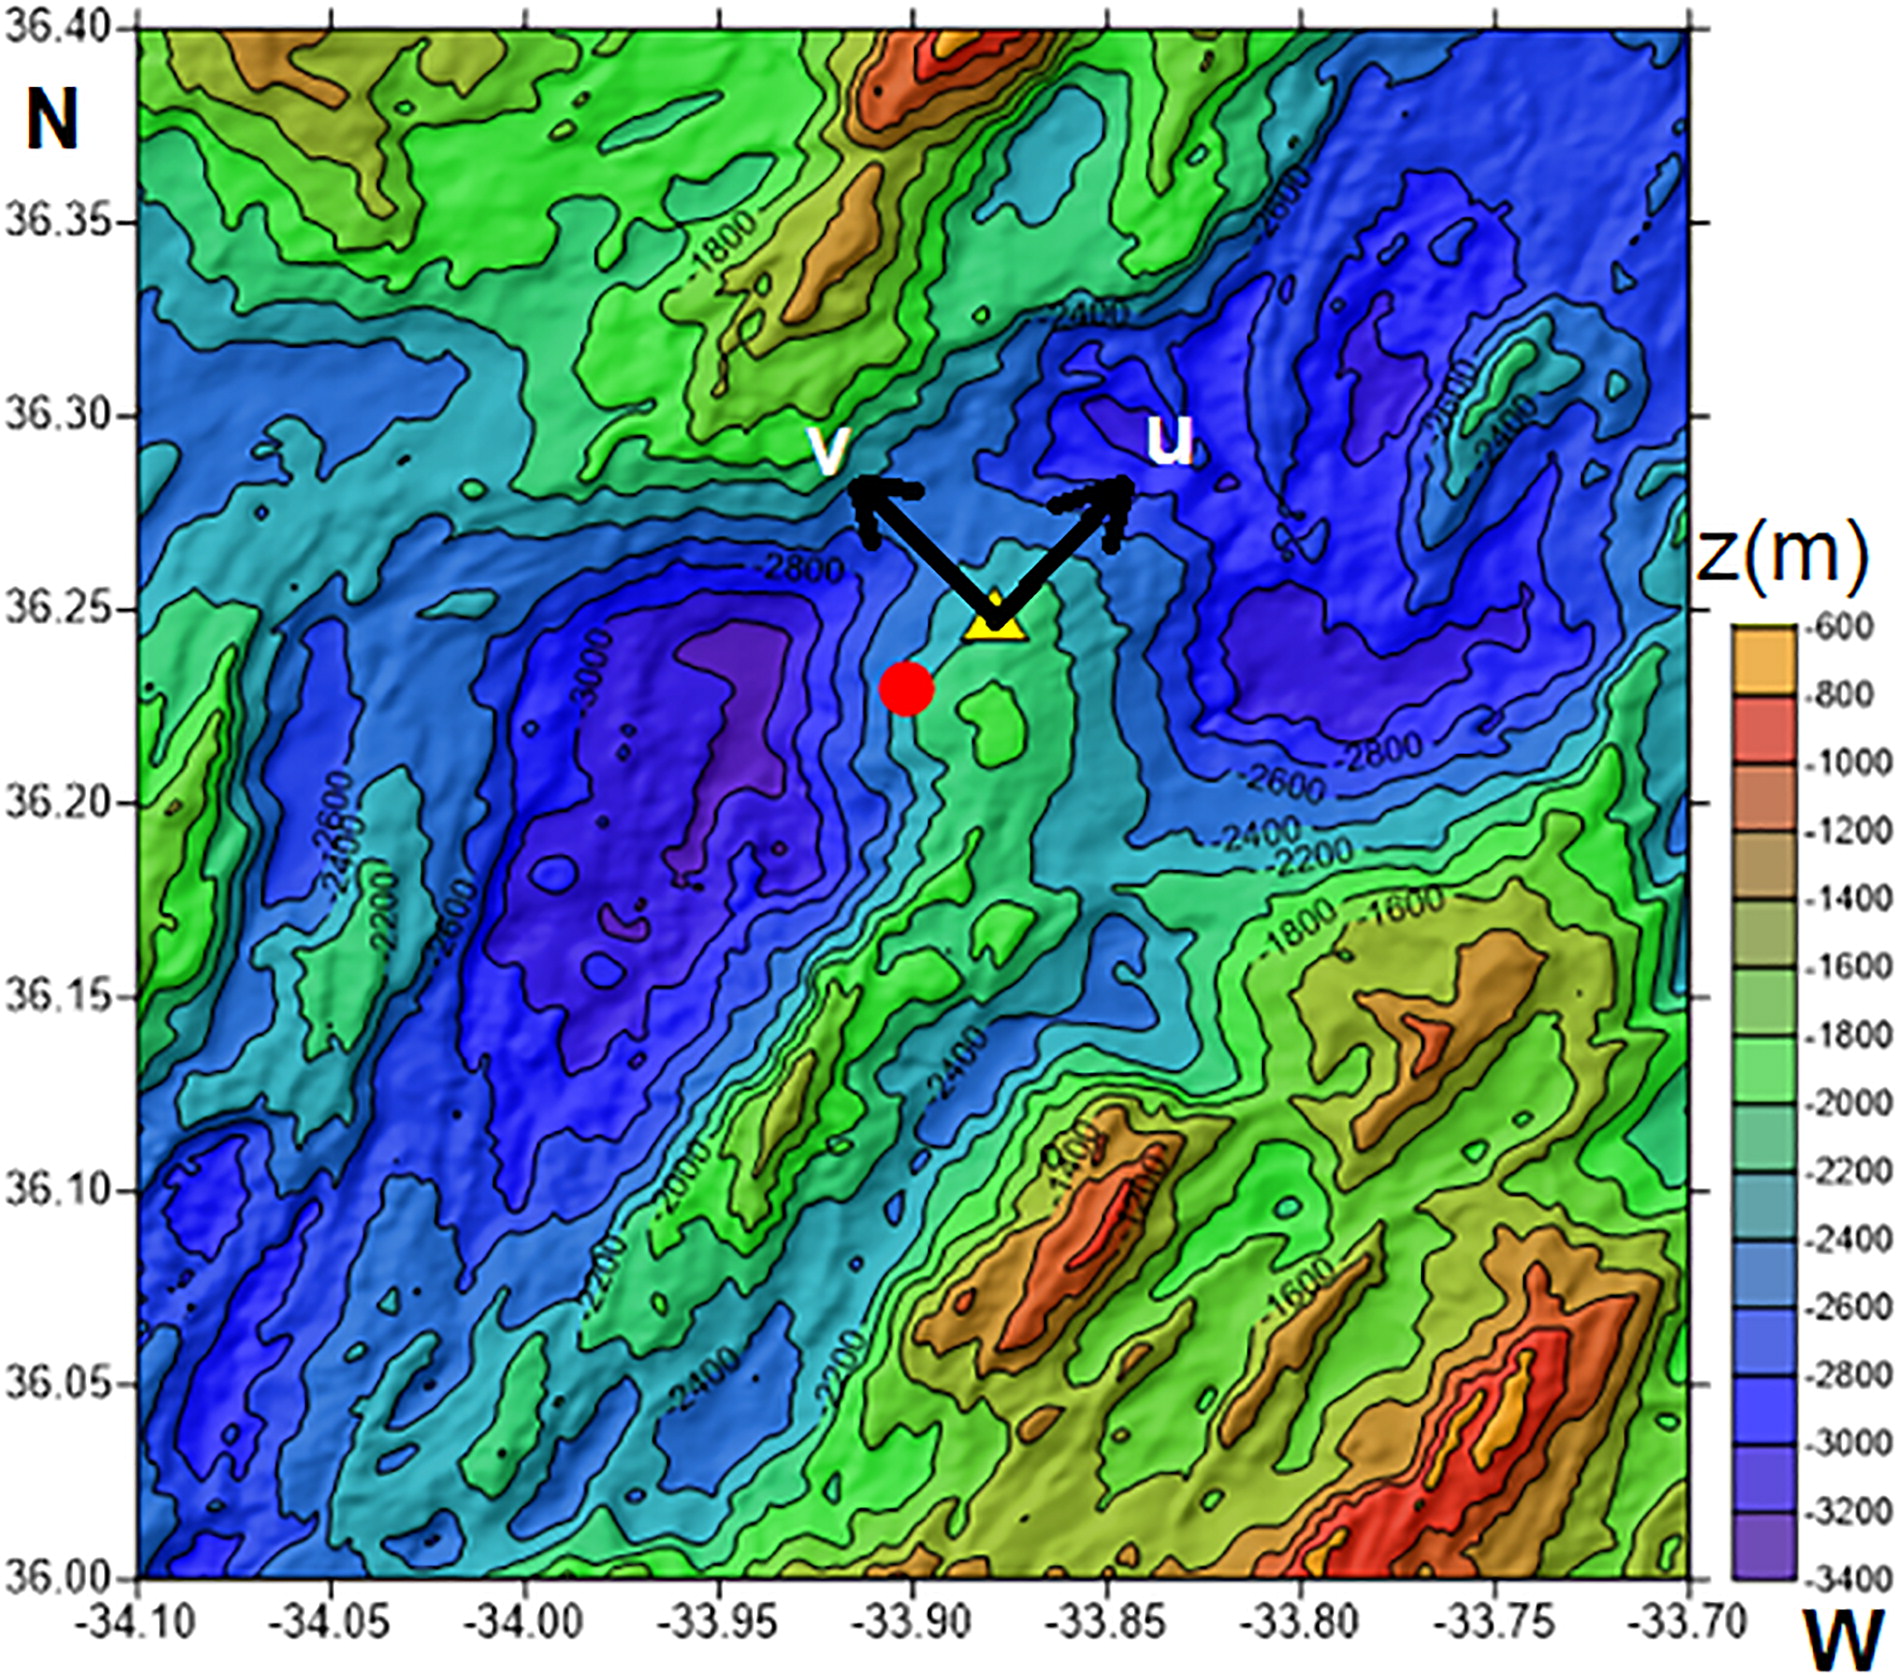
Fig. 2.
Bathymetric map part of the Mid-Atlantic Ridge, southwest of the Azores (P). The site of the mooring is indicated by the yellow triangle centring the positive directions of the local along- and cross-slope current components on the north-slope of Rainbow crest. The red dot indicates Rainbow’s main hydrothermal vent. Multibeam data, 100 × 100 m grid.
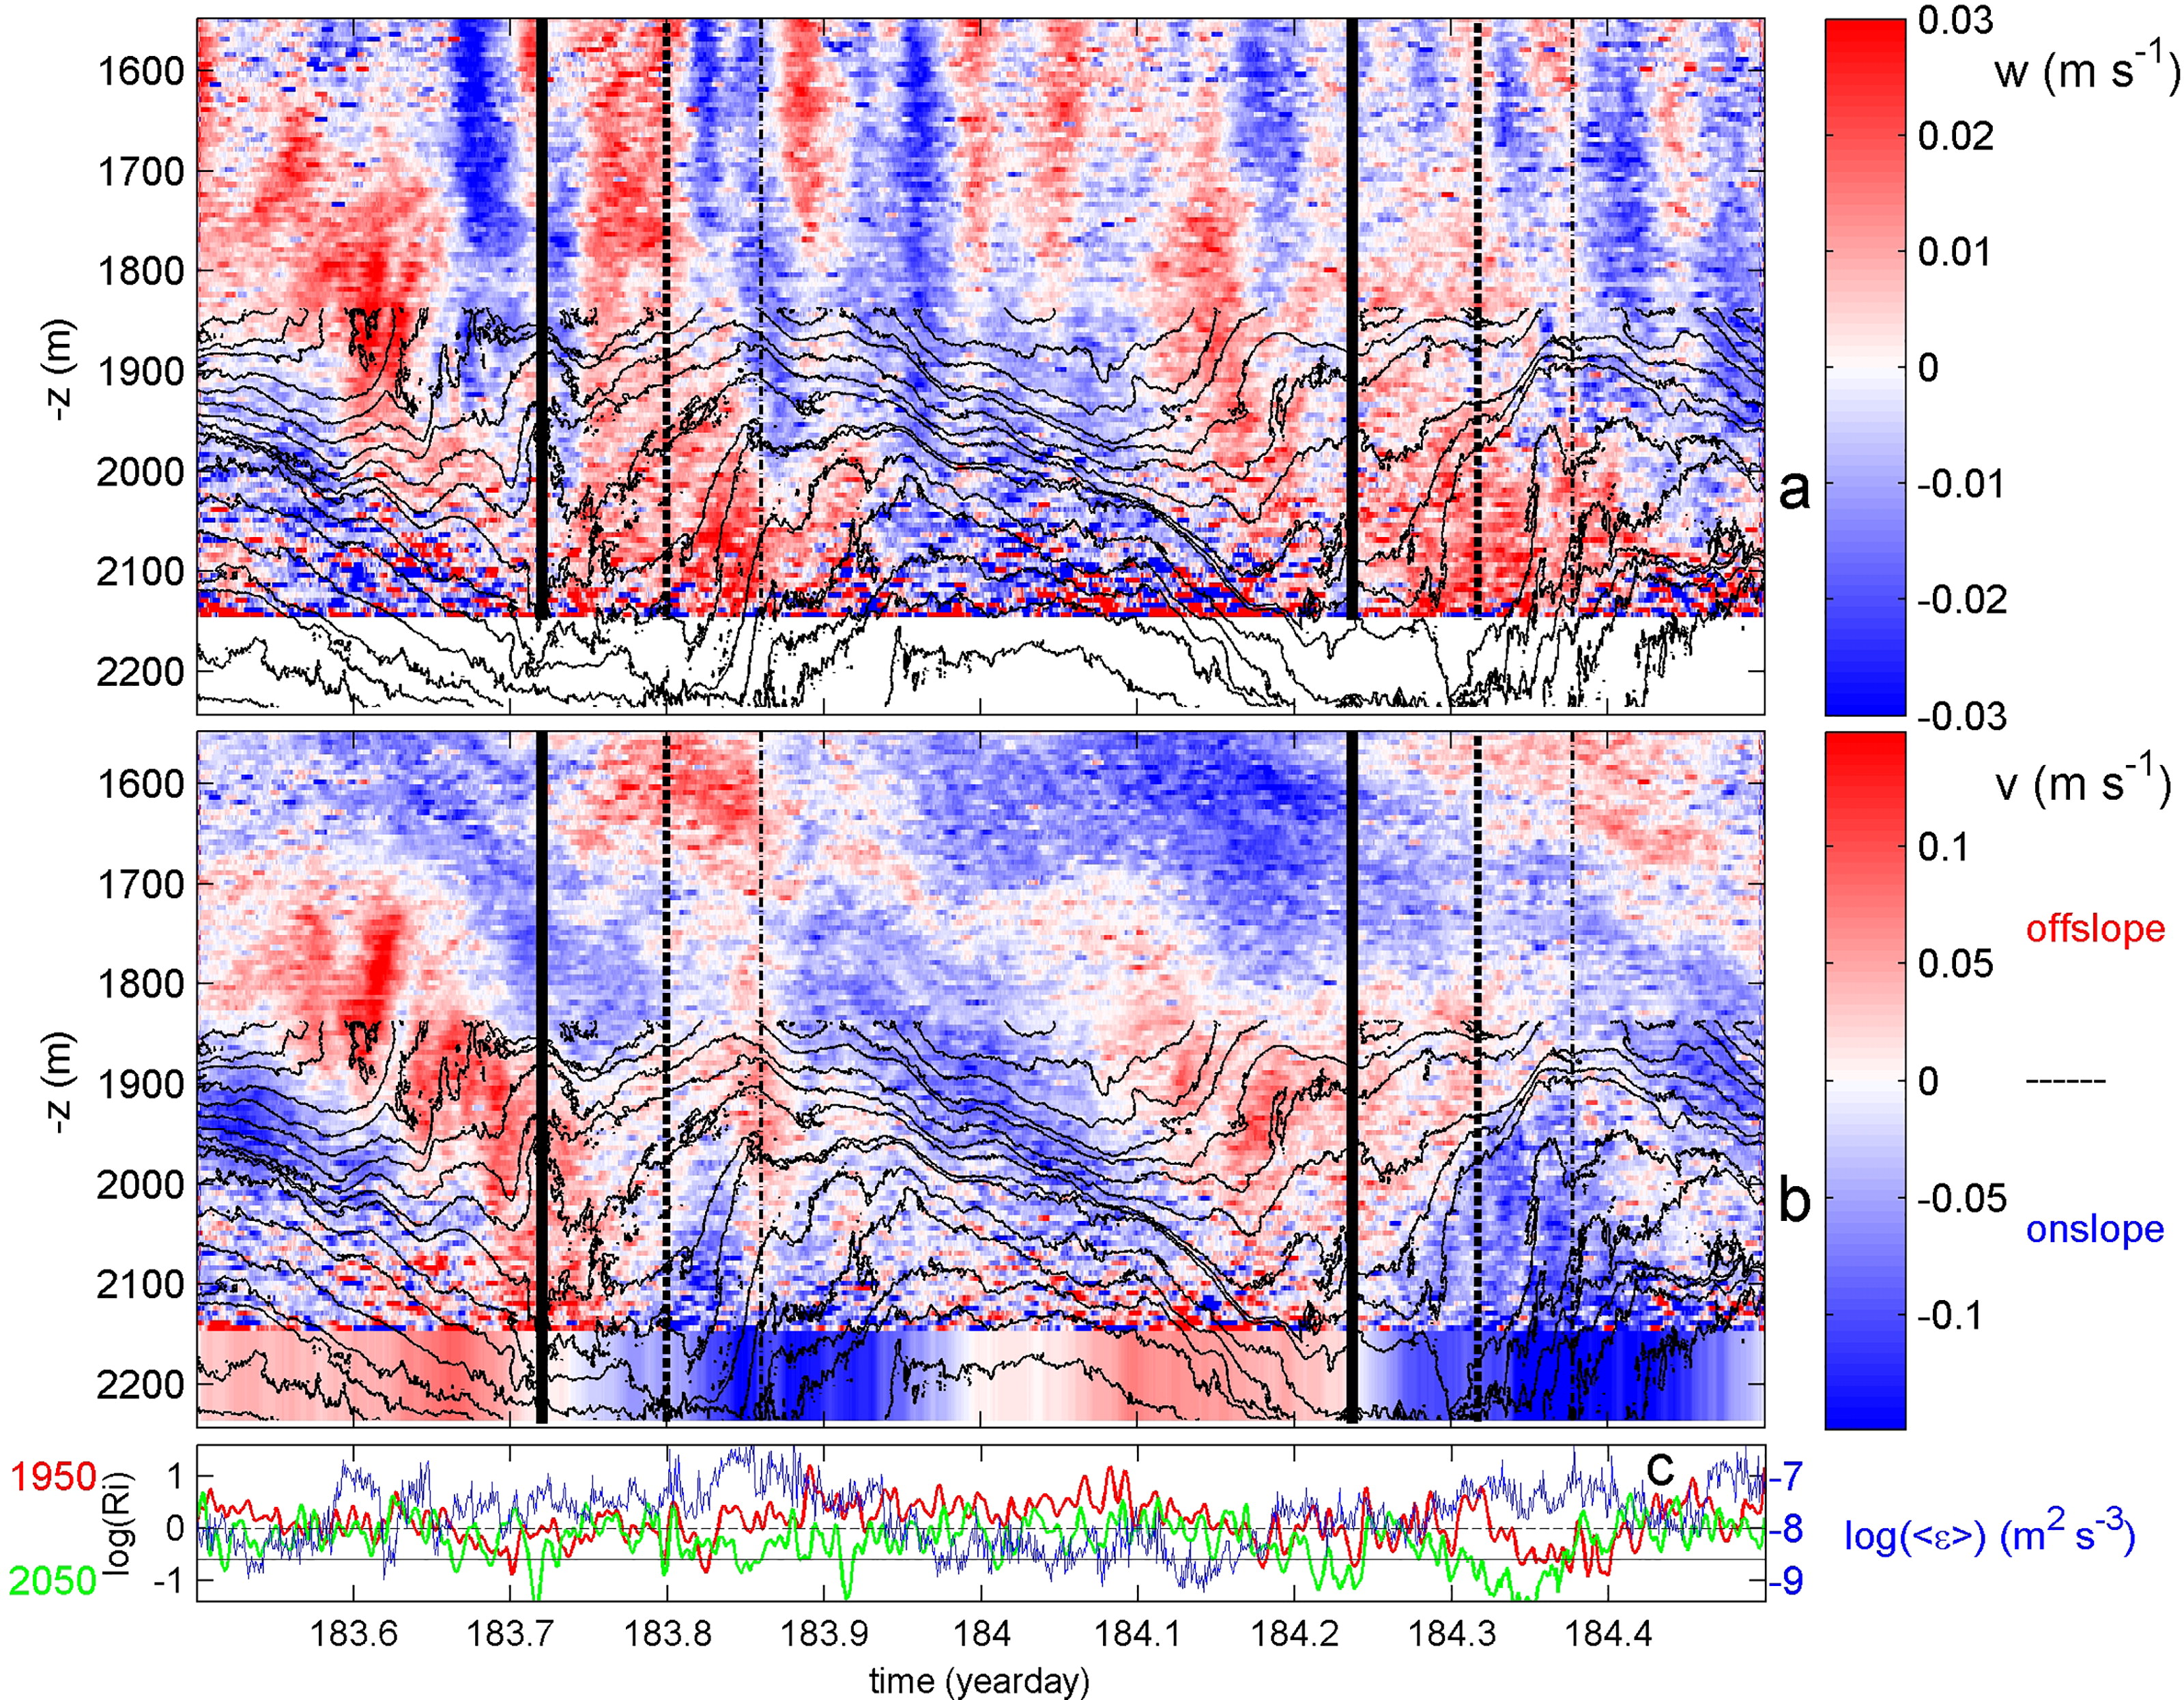
Fig. 3.
One day of data around Fig. 1 of high-resolution 398-m range T-observations superposed on low-resolution 600-m range ADCP observations. (a) Vertical current component, smoothed over 600 s intervals. Black contours indicate Θ every 0.05 °C. The seafloor is at the horizontal axis. The black-solid vertical bars indicate approximate times of internal turbulence expansion, the thick dashed lines those of pre-frontal mixing (van Haren et al., 2017) and the dash-dotted lines those of near-bottom frontal bore. Each set of lines is shifted an exact multiple of the semidiurnal lunar tidal period. (b) Cross-slope current component with the lower 95-m thick bar coloured by the current meter data at 7 mab (up to the lowest bin of good ADCP-data at 100 mab). Black contours are copied from a. for reference. (c) Logarithm of gradient Richardson number for hourly smoothed 100-m-averaged values around z = −1950 m (red) and z = −2050 m (green), with horizontal black lines indicating (in)stability transition values of 0.25 (solid; Miles and Howard, 1964) and 1.0 (dashed; Abarbanel et al., 1984). Additionally, the logarithm is given of the record of vertically 8–405 mab-mean dissipation rate (in blue, scale to right).
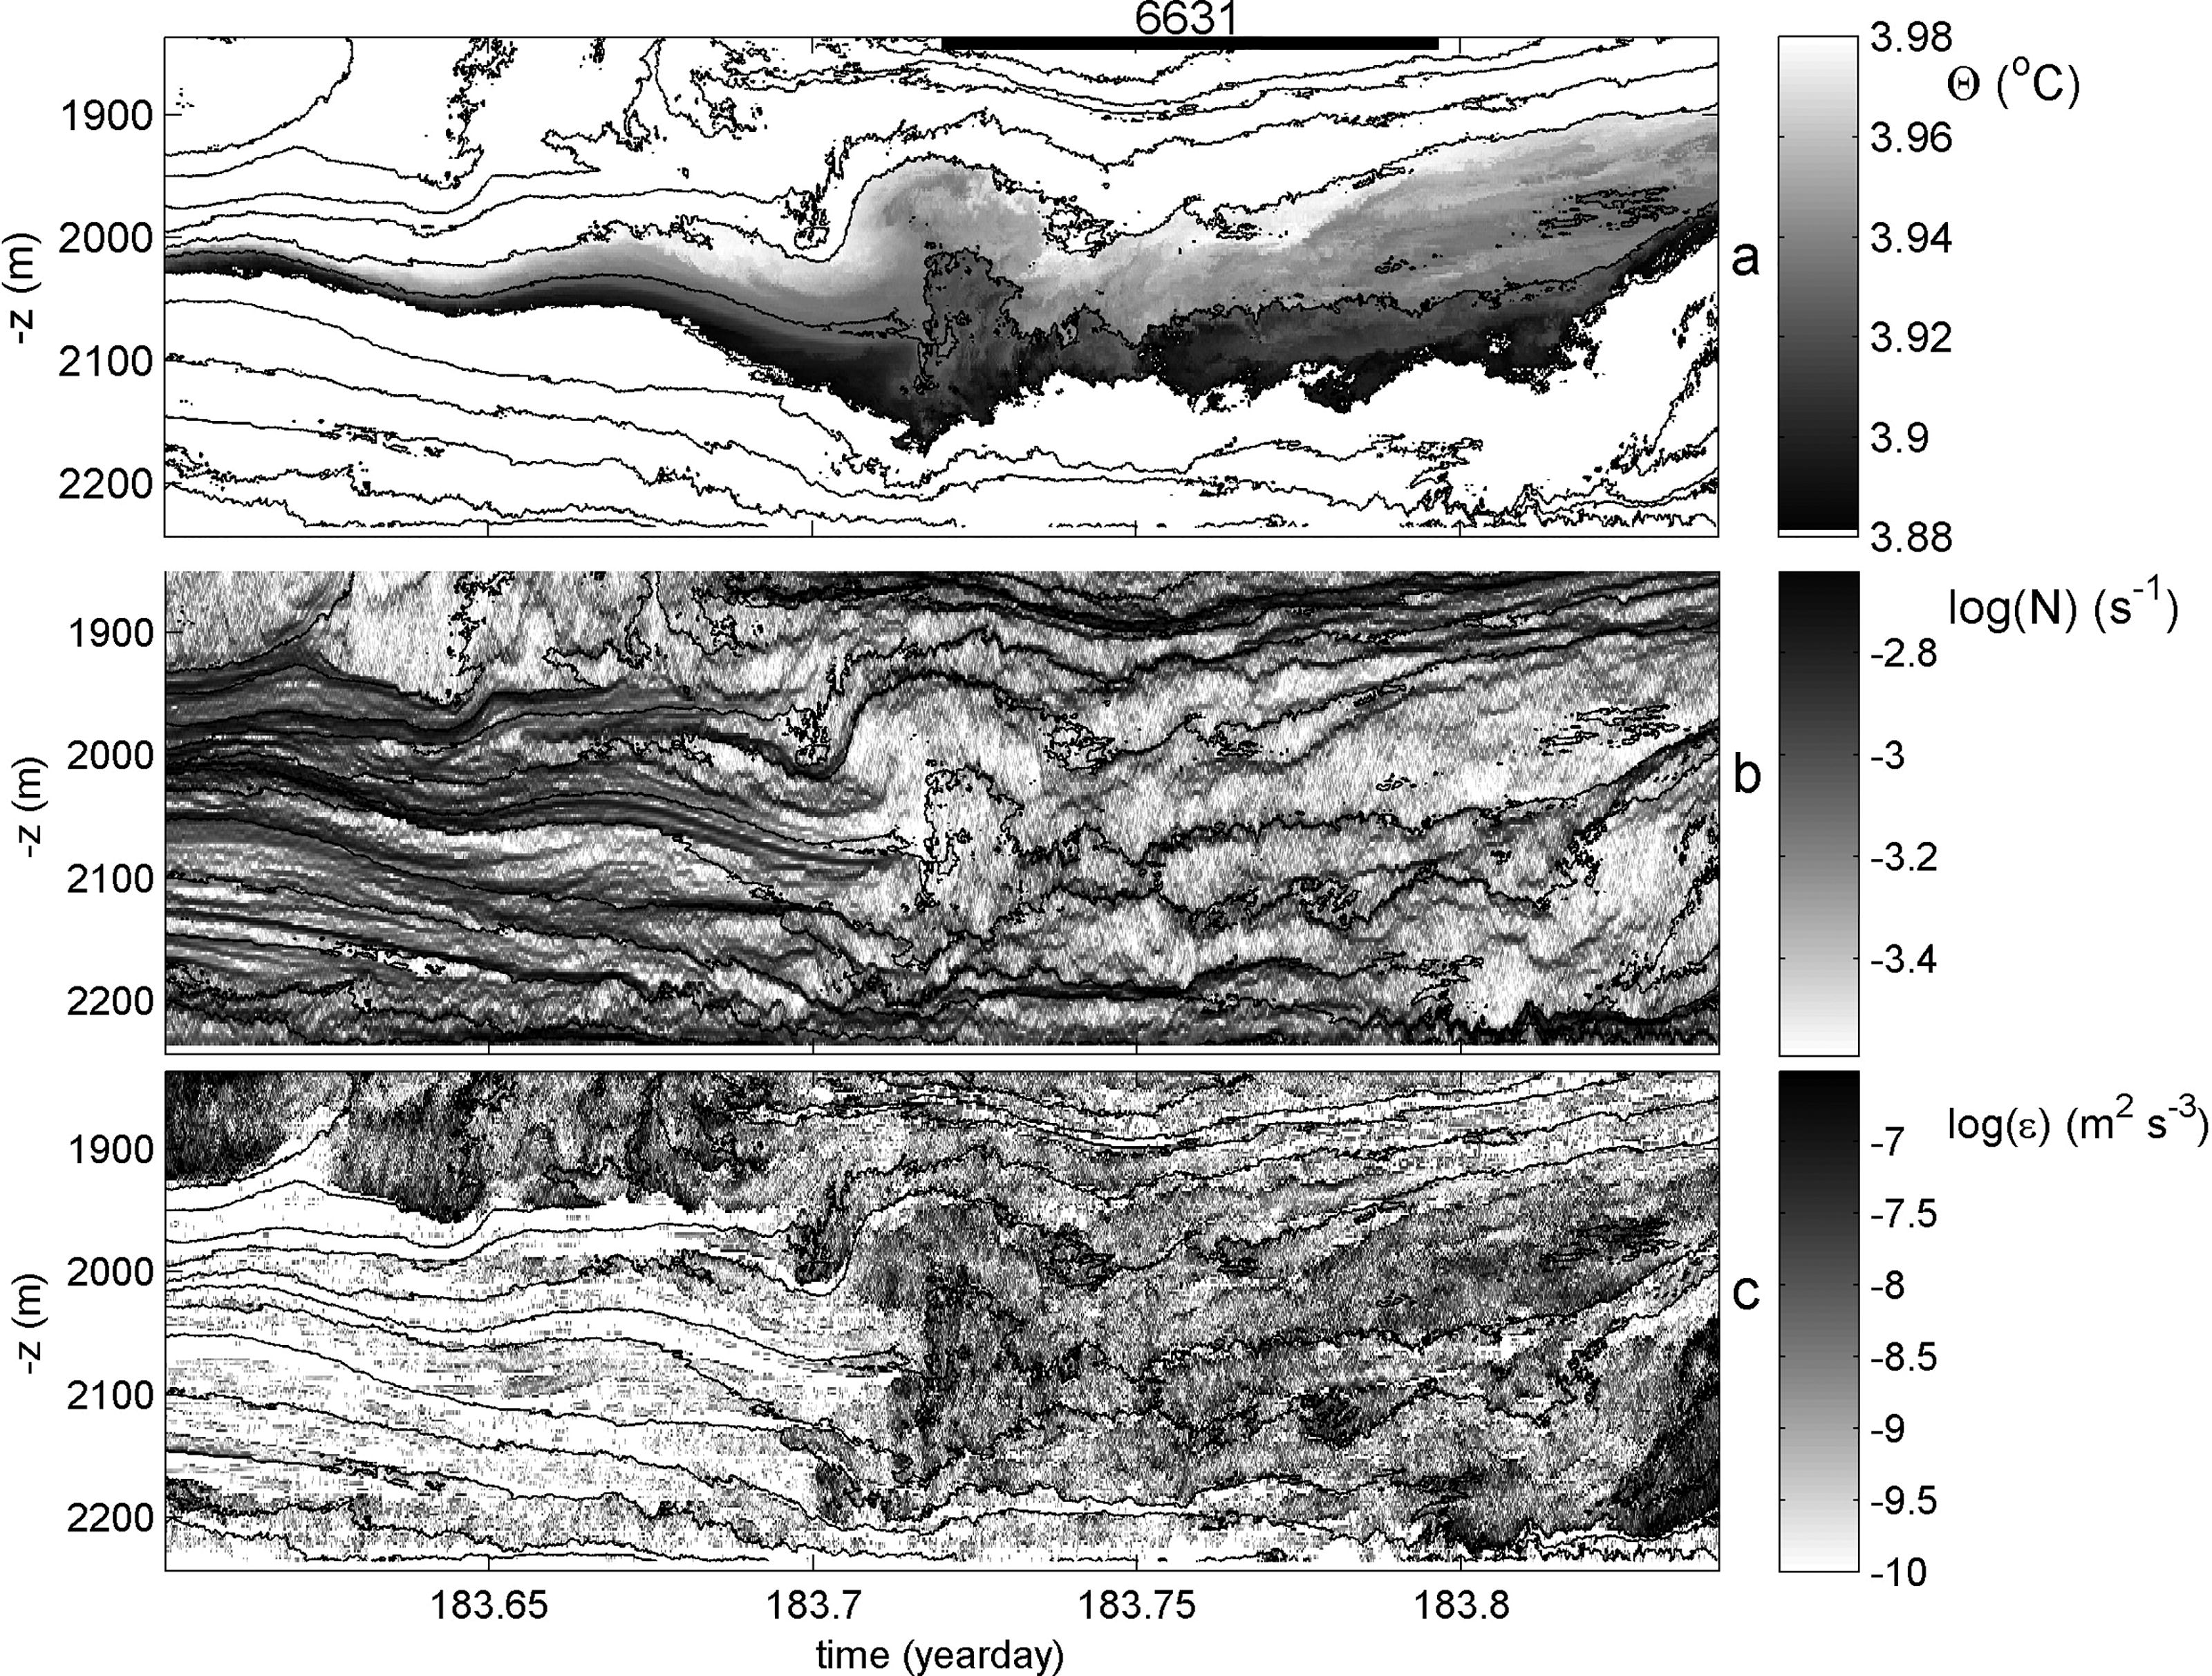
Fig. 4.
Six hours of data around Fig. 1 from high-resolution T-sensor data. (a) Conservative Temperature. Black contours are drawn every 0.05 °C. The horizontal bar indicates the mean buoyancy period (in s) for the entire panel. The seafloor is at the horizontal axis. (b) Logarithm of buoyancy frequency from reordered Θ, with black contours copied from a. for reference. (c) Logarithm of un-averaged dissipation rate from data in a. using the method of Thorpe (1977), with black contours copied from a. for reference.
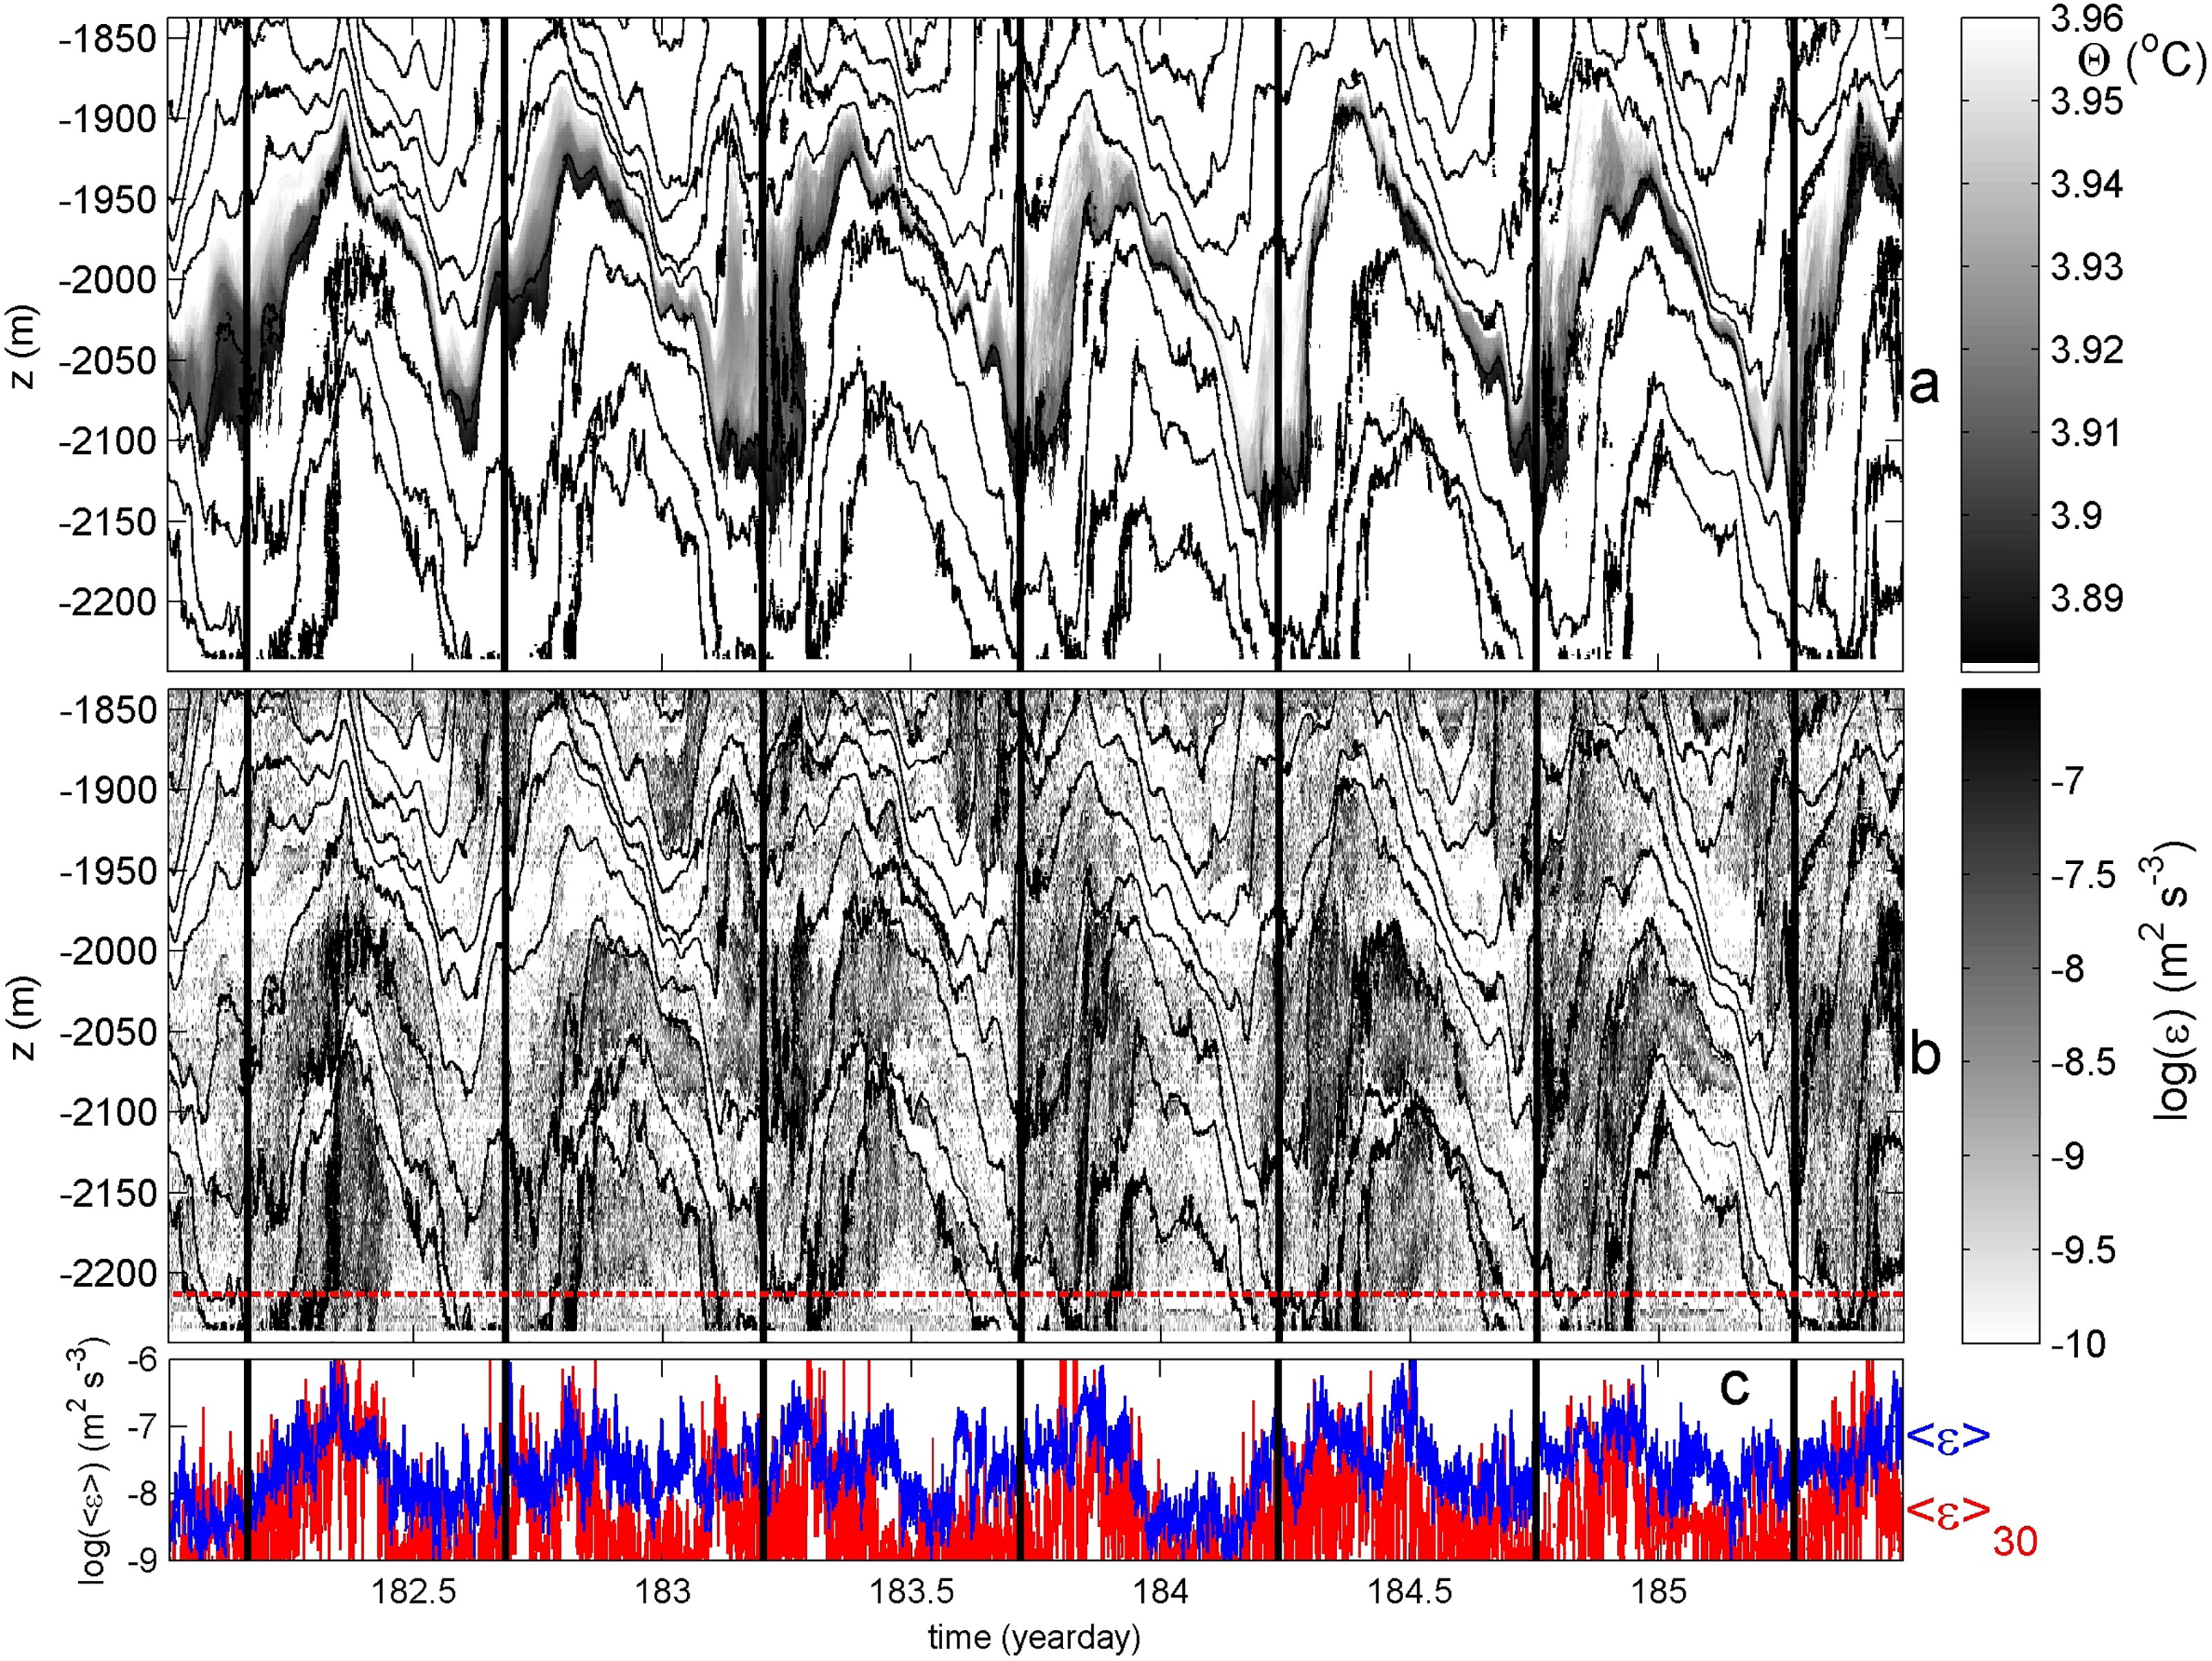
Fig. 5.
Three-and-a-half days of data around Fig. 1 demonstrating the straining and off-bottom turbulent bursting varying every tidal period. (a) Conservative temperature. Black contours are drawn every 0.09 °C. The seafloor is at the horizontal axis. The black-solid vertical lines indicate approximate times of internal turbulence expansion. The lines are shifted by an exact multiple of the semidiurnal lunar tidal period. (b) Logarithm of un-averaged dissipation rate from data in a. using the method of Thorpe (1977), with black contours copied from a. for reference. The red horizontal dashed line is at 30 mab. (c) Logarithm of vertically averaged dissipation rate, in blue for the entire temperature sensor range between 8 and 405 mab, in red for near-bottom 8 to 30 mab.
Table 1.
Turbulence dissipation rates averaged over 1 h and 270 m between −2175 < z < −1905 m for seven internal turbulence expansions of Fig. 5. In the table, the observed start-times of the depression immediate before expansion are indicated, which are not necessarily separated by a multiple of the semidiurnal lunar tide (period of 0.5175 day).