
Fig. 1.
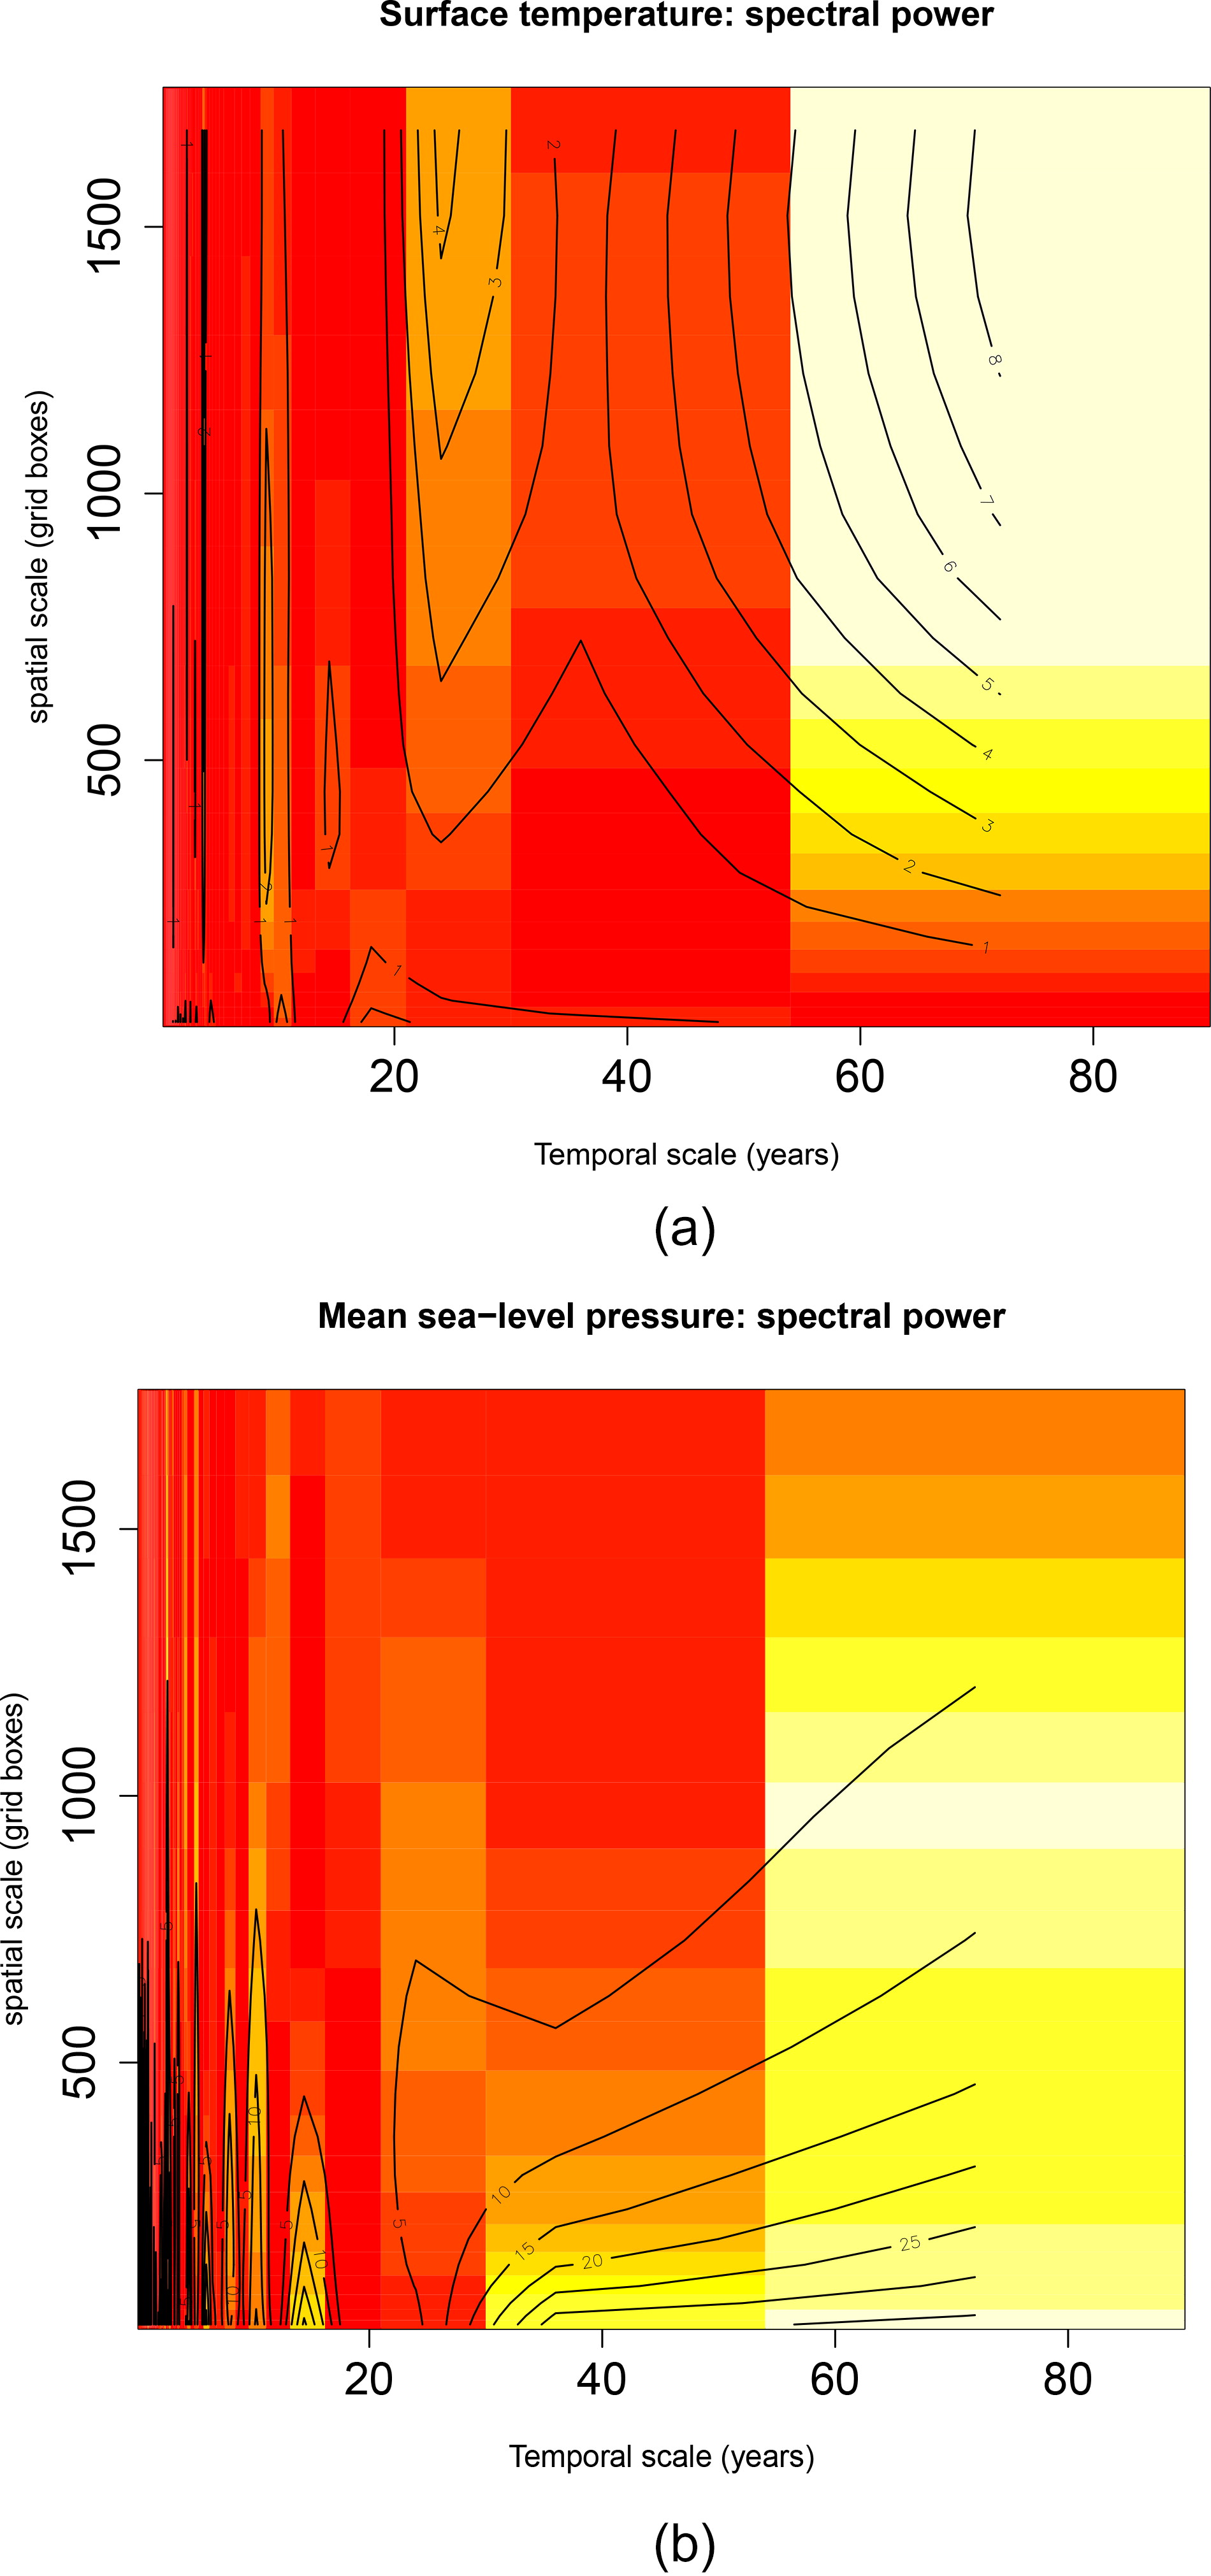
Heat maps showing power spectra along the x-axis for different spatial scales along the y-axis for TAS (a) and SLP (b). Yellow colour signifies high and red low power. The temporal scales are given as months and the area as number of grid boxes. The contours give a smoother representation of the colour scaling. Data: NCEP/NCAR reanalysis 1.
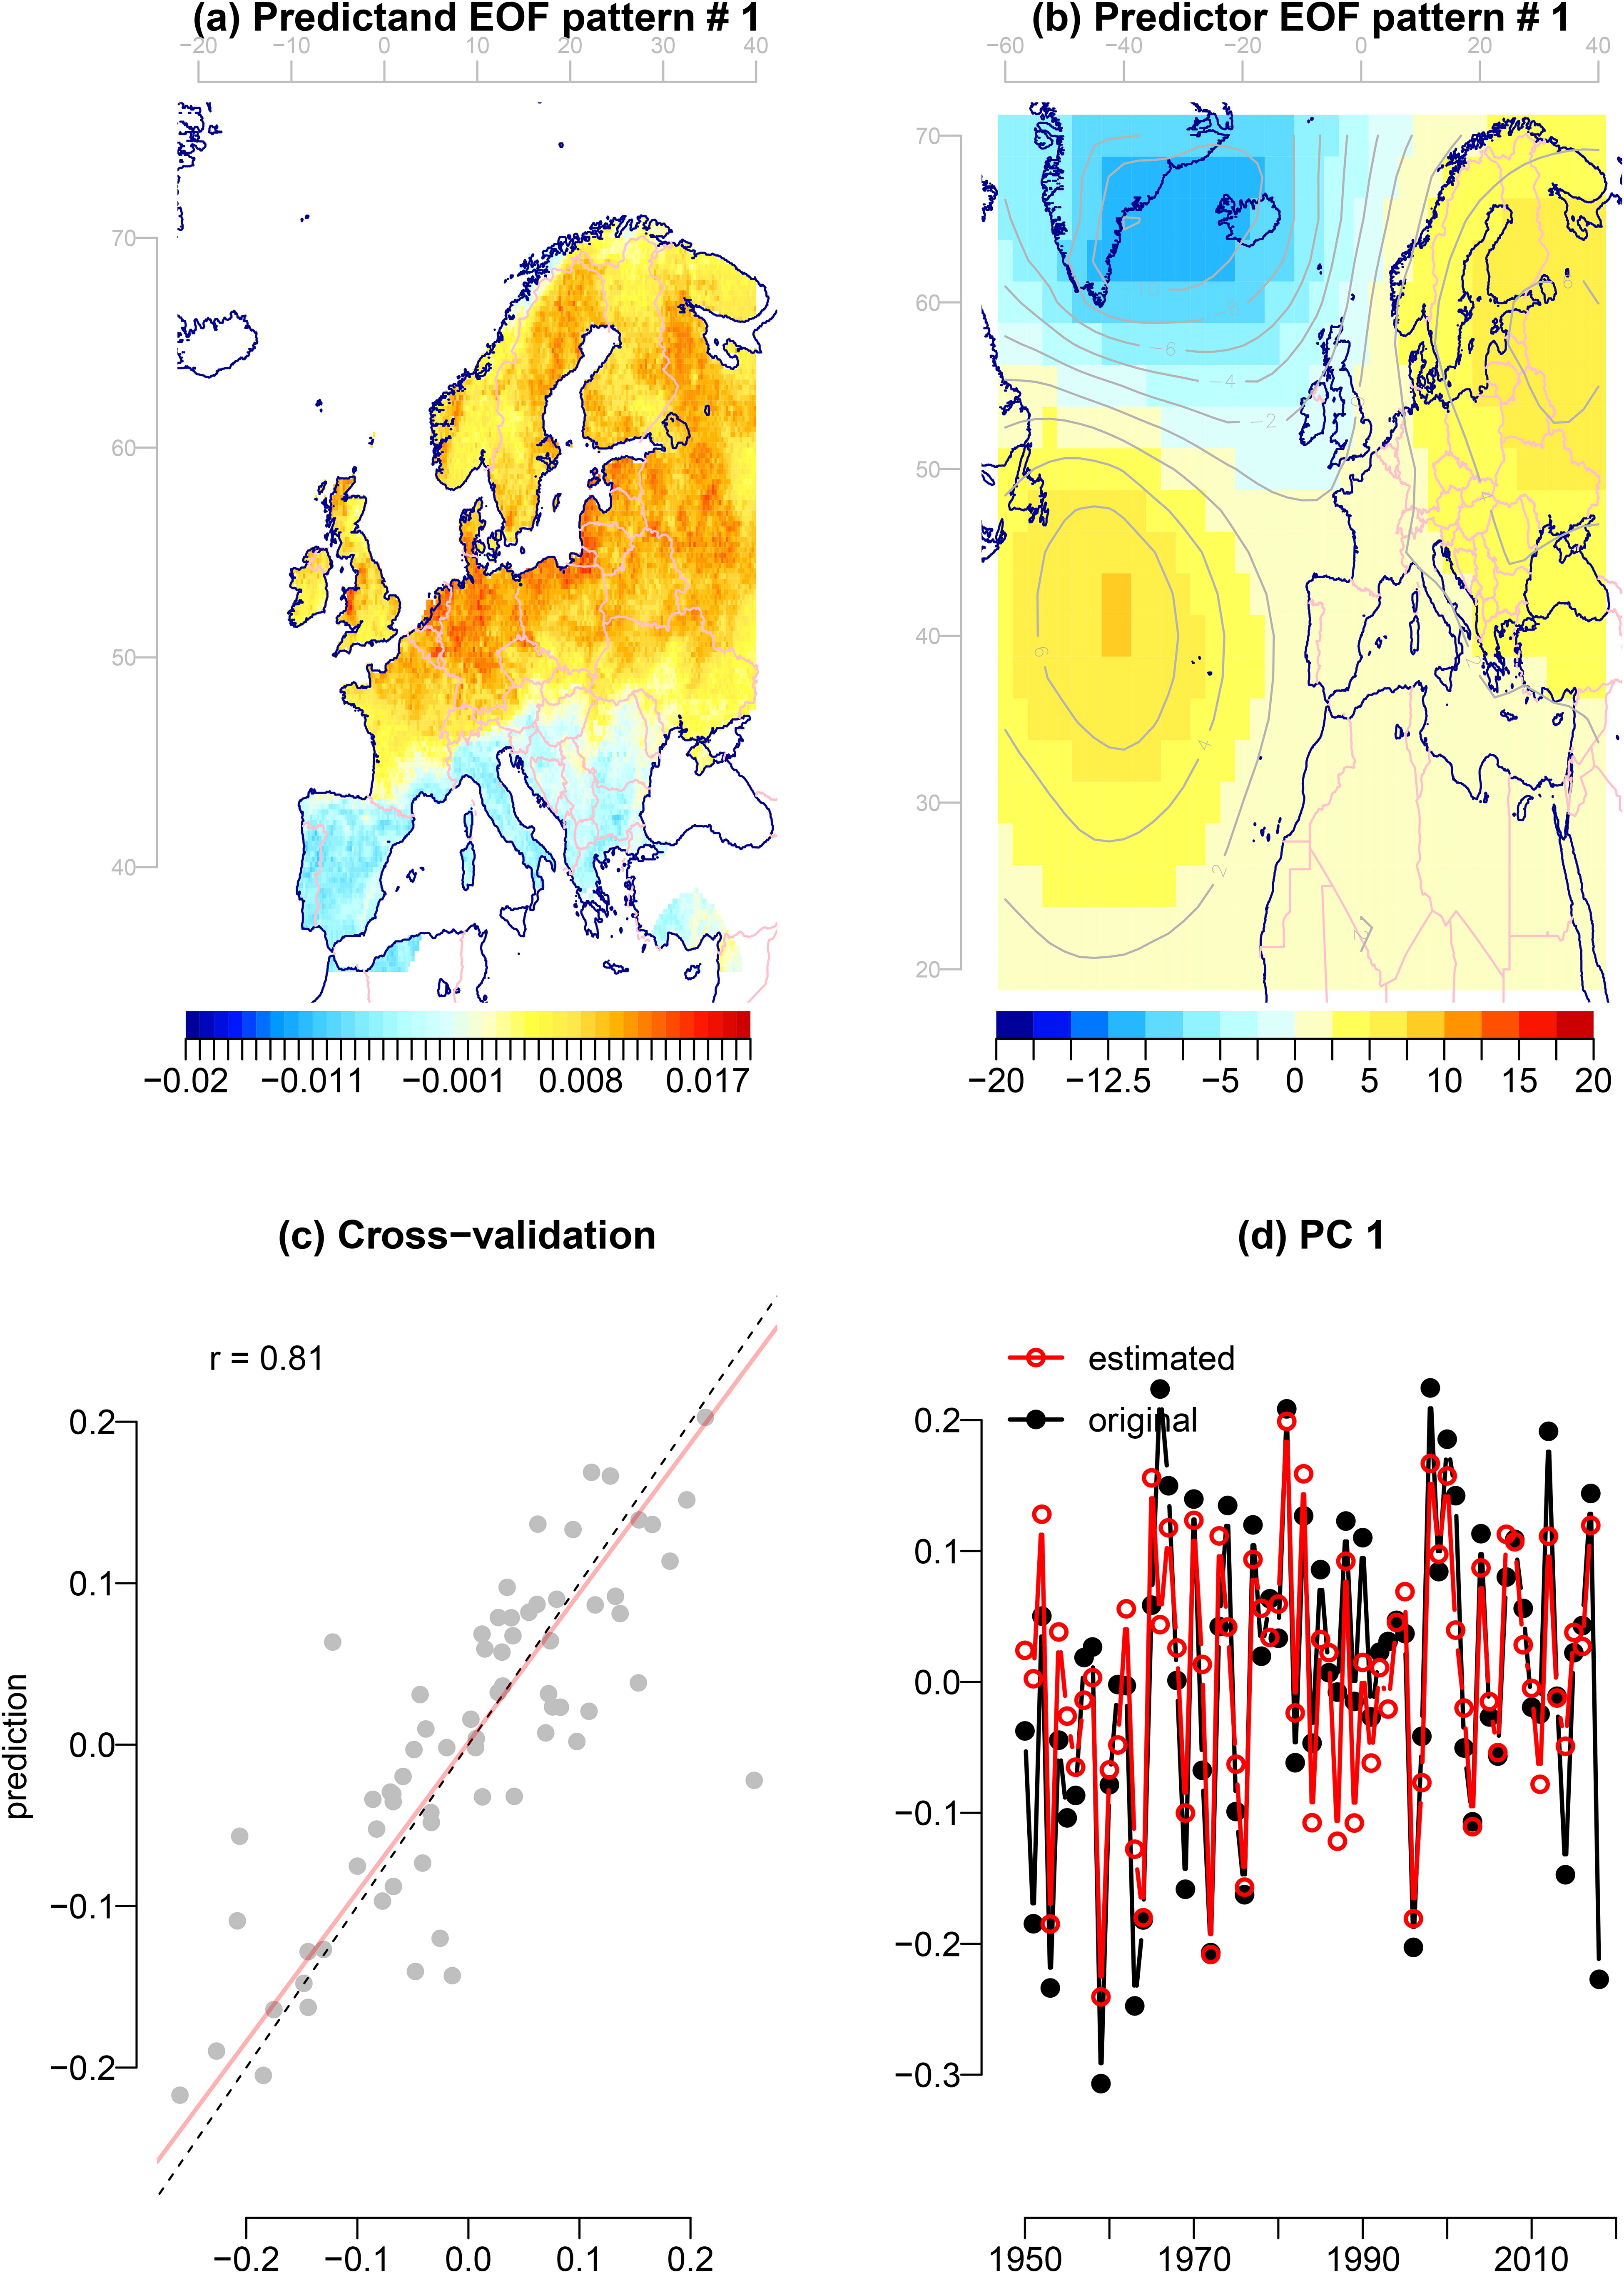
Fig. 2.
Results from downscaling wet-day frequency indicated a close association between large-scale annual mean SLP anomalies and variations in the leading EOF of the annual fw. The upper left panel shows the pattern of the leading EOF estimated for the annual fw, upper right shows the SLP anomalies which are associated with variations in the leading PC (combination of spatial weights from a stepwise multiple regression) derived from NCAR/NCEP reanalysis 1 SLP, lower left shows a scatter plot between the original PC and predictions in terms of LOO cross-validation, and the lower right shows the original time series (black) and the calibrated results (red).
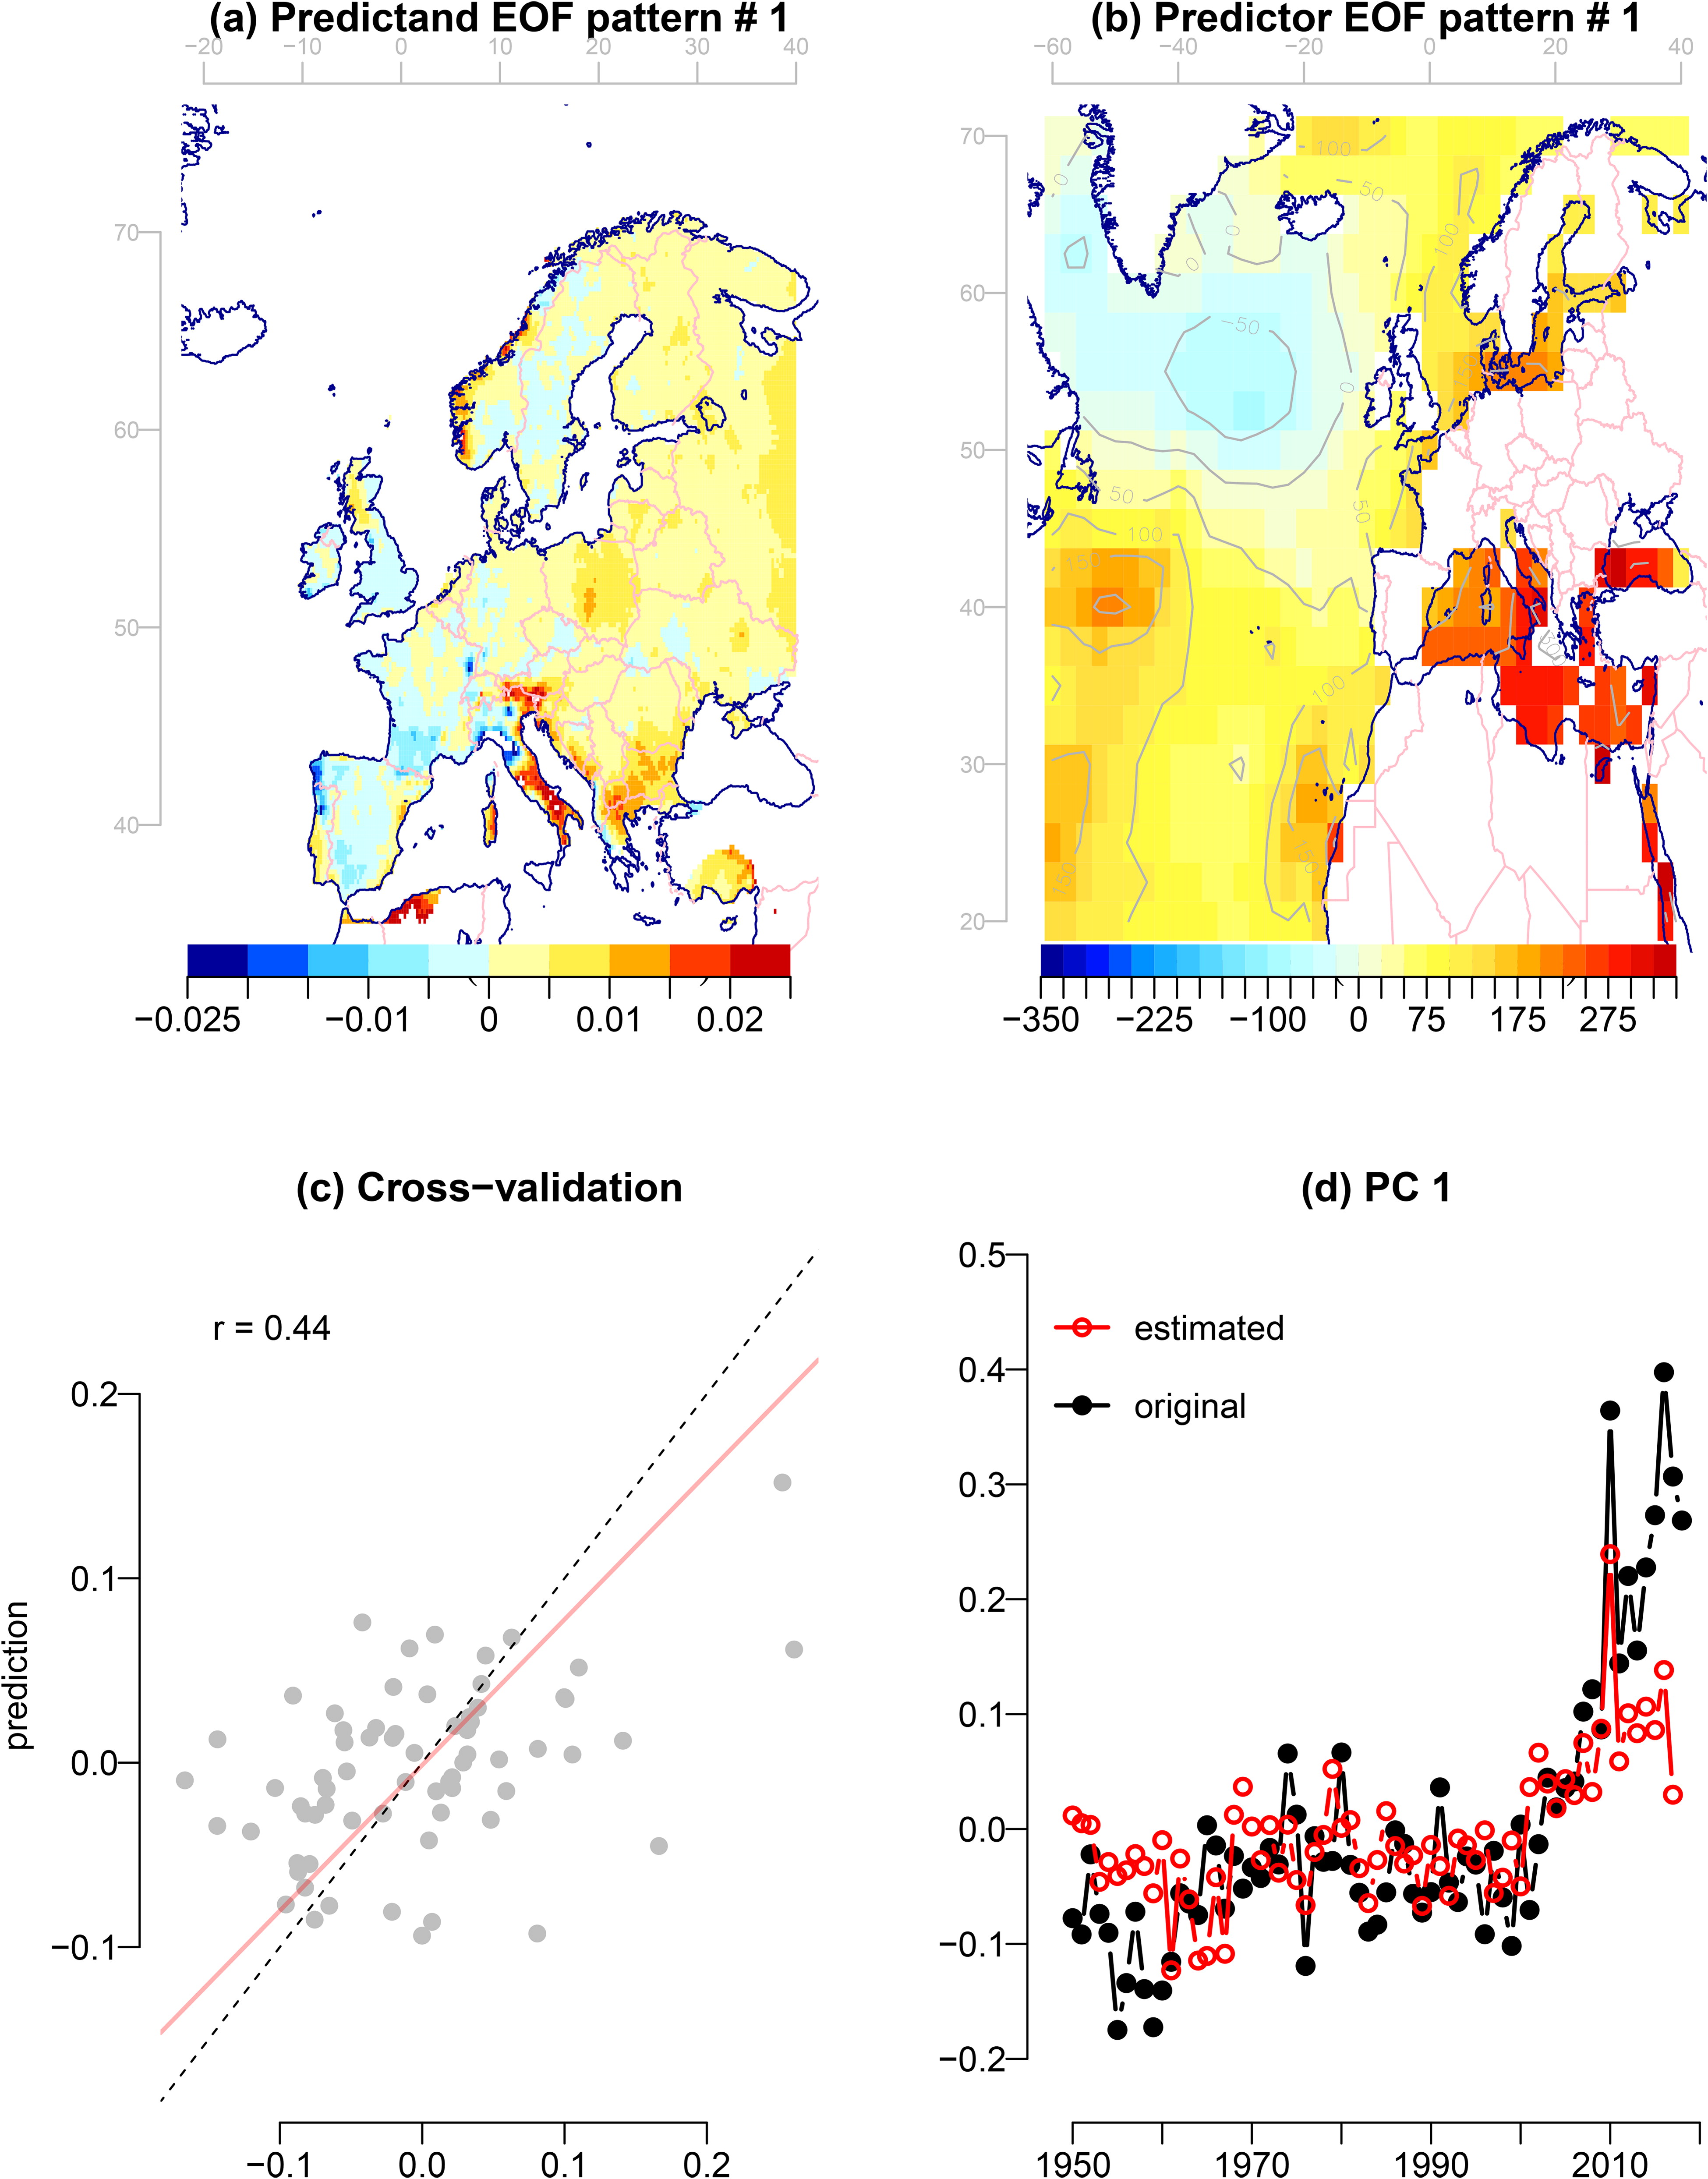
Fig. 3.
Results from downscaling wet-day mean precipitation indicated a weak link between large-scale annual mean es anomalies derived from NCAR/NCEP reanalysis 1 TAS and variations in the leading EOF of the annual μ. The upper left panel shows the pattern of the leading EOF estimated for the annual μ, upper right shows the es anomalies, which are associated with variations in the leading PC derived from NCAR/NCEP reanalysis 1 TAS, lower left shows a scatter plot between the original PC and predictions in terms of LOO cross-validation, and the lower right shows the original time series (black) and the calibrated results (red).
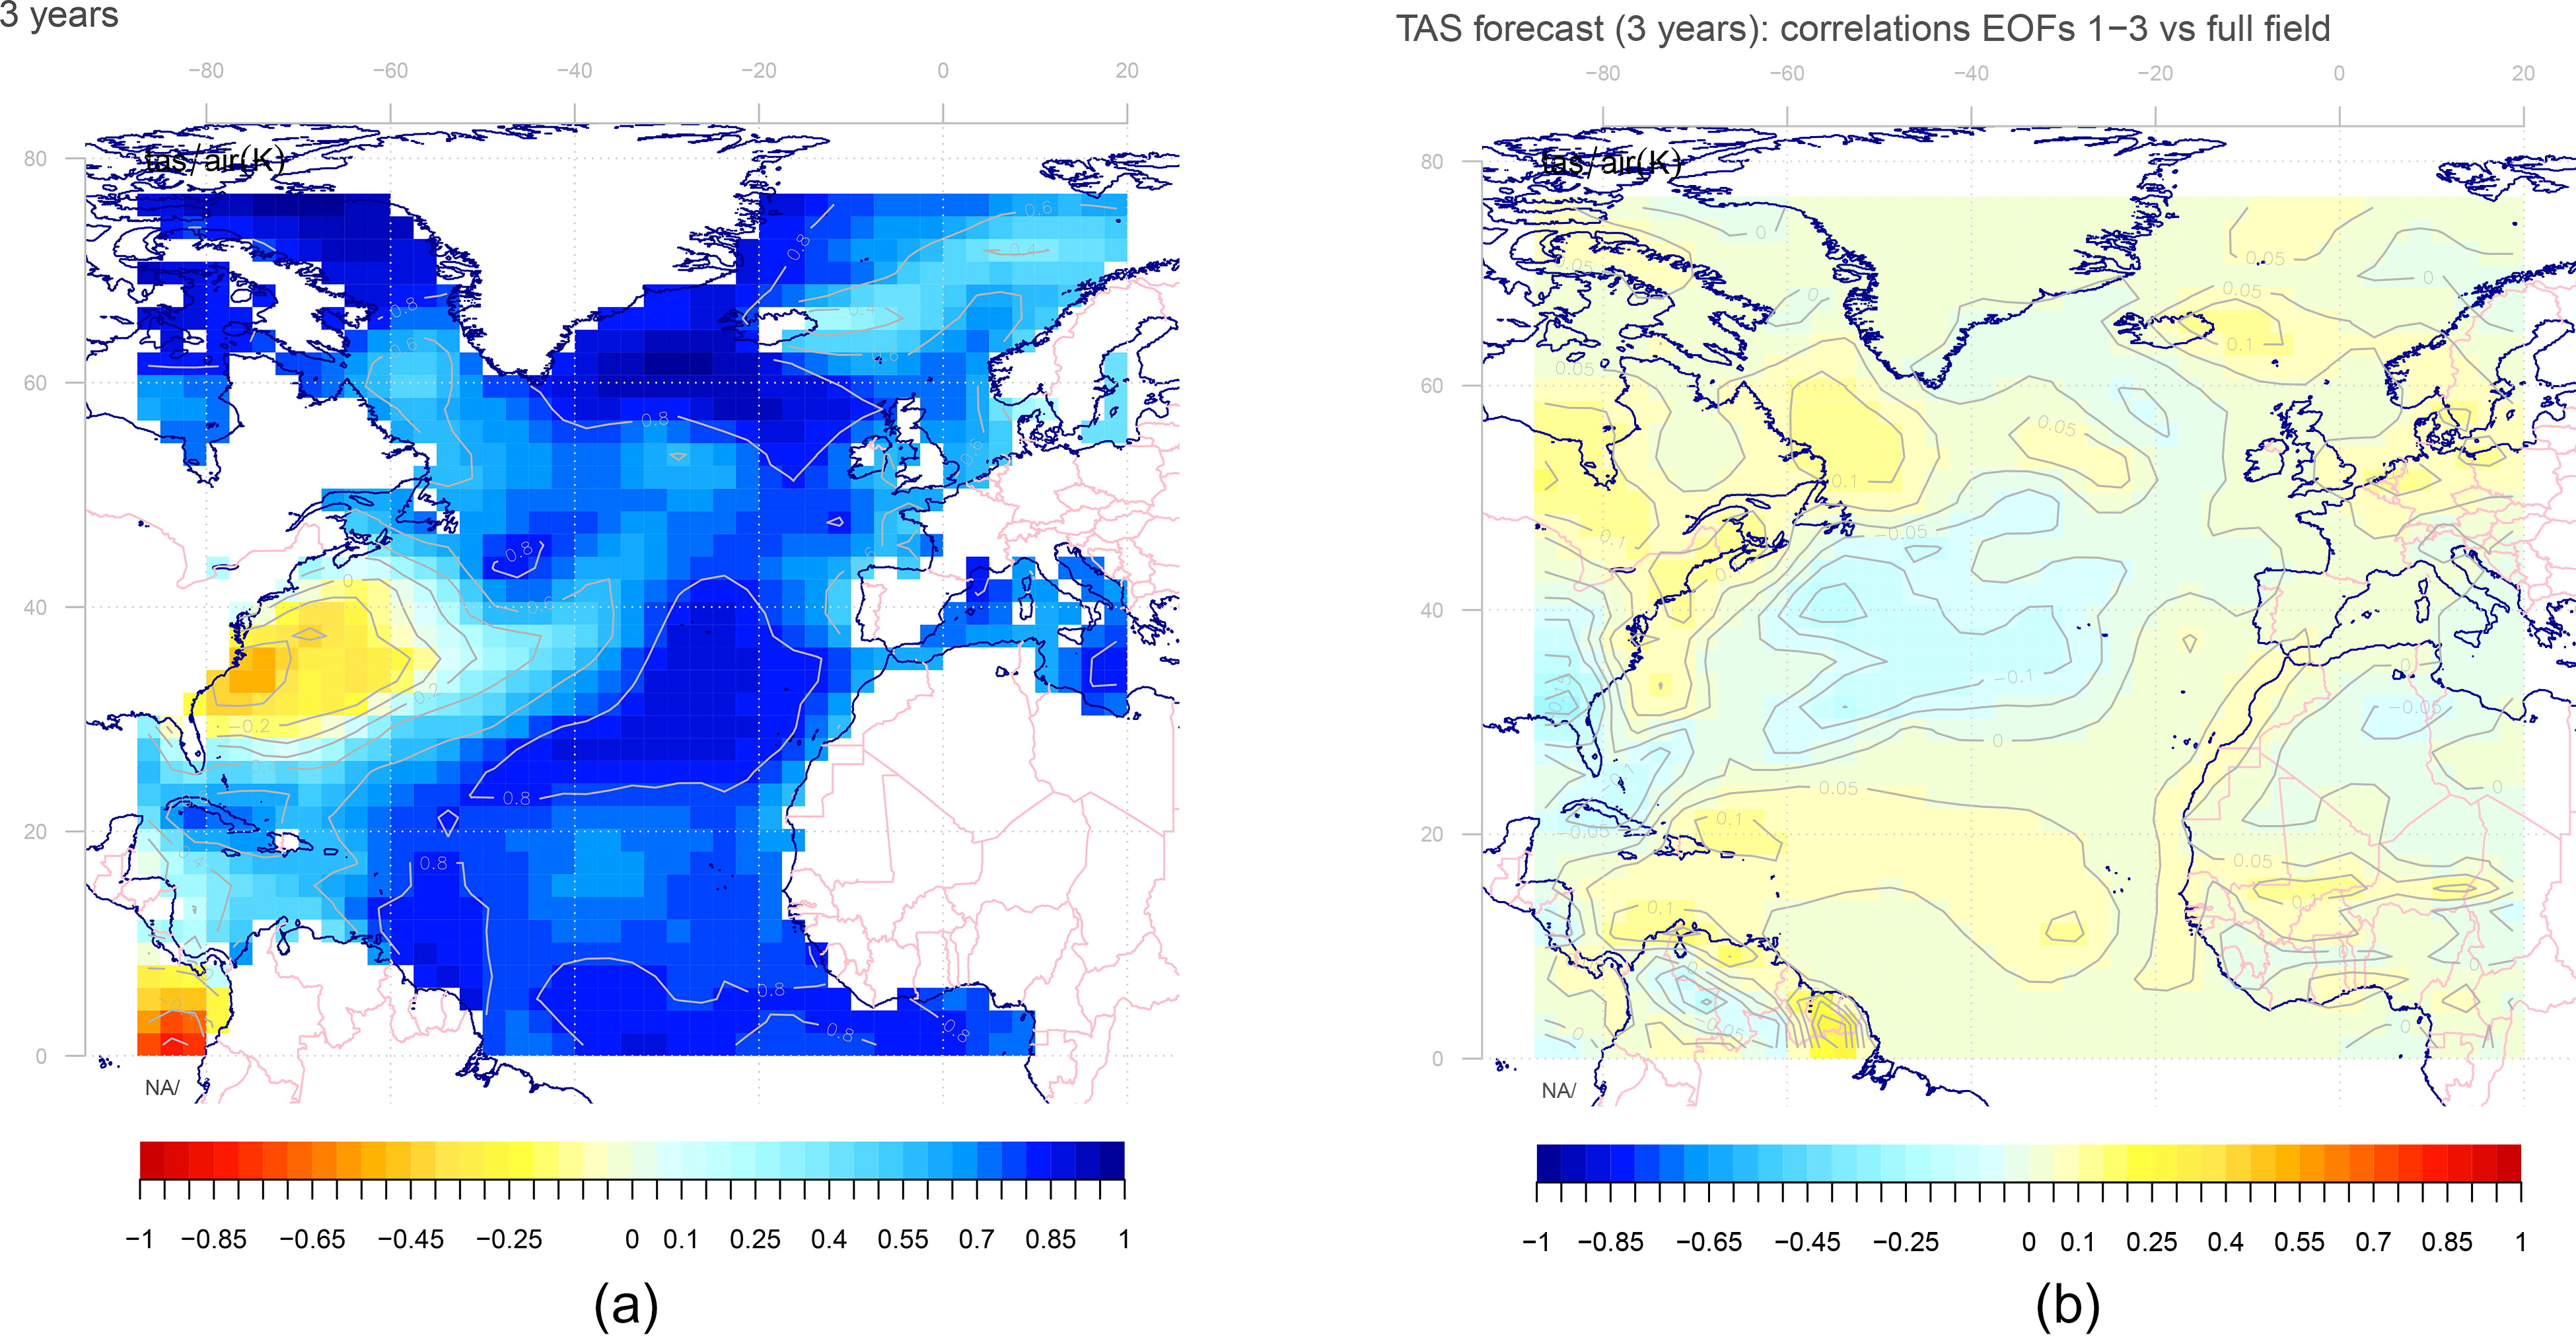
Fig. 4.
Correlation maps between three-year mean TAS from the NCEP/NCAR reanalysis 1 and corresponding quantities from the decadal ensemble mean forecast, both filtered through 3 EOFs. The results indicated that the three-year temperature in the west off the east coast of the USA has a low correlation with the ensemble mean of the forecast, but there were high correlations in the east Fig. 4a. Figure 4b, map of correlation differences between forecast filtered through the three leading EOFs and unfiltered forecasts to assess the degree predictability of associated with the leading EOF modes (large scales).
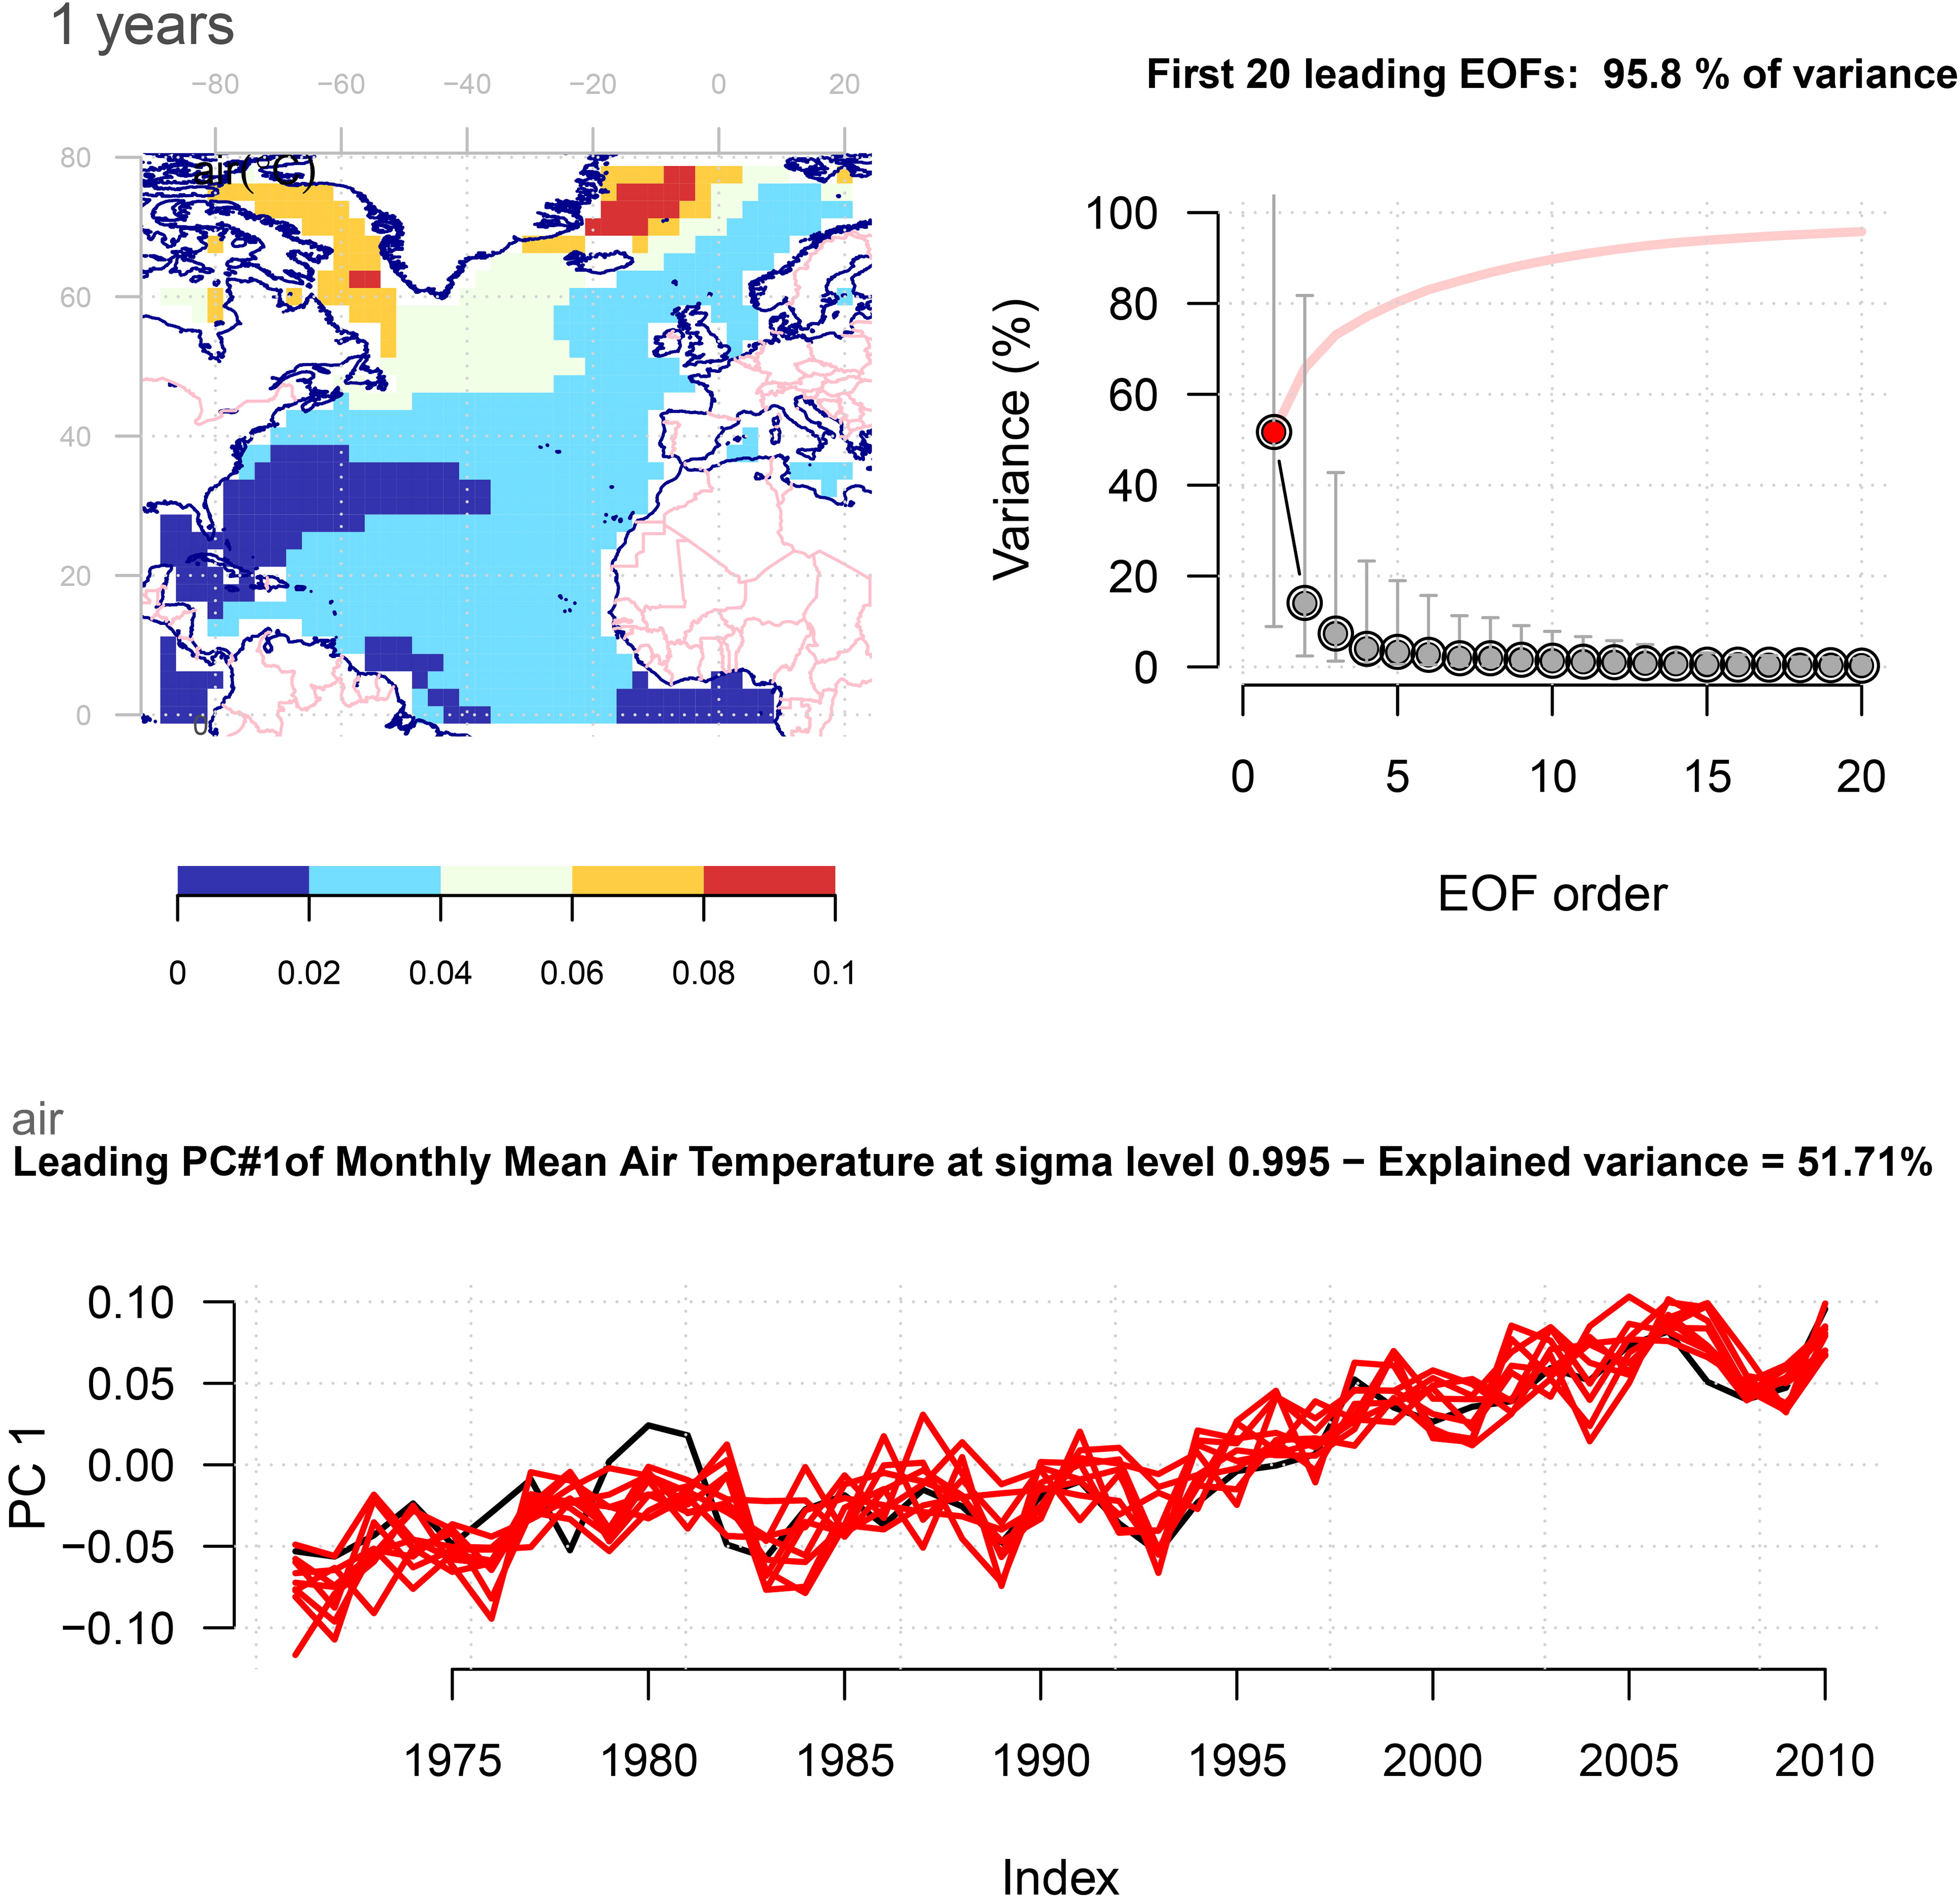
Fig. 5.
Common EOFs estimated for the joint annual mean TAS NCEP/NCAR reanalysis and the forecasts. The upper left panel shows the common spatial anomaly structure common for the reanalysis and all ensemble members, the upper right shows the variance associated with each EOF (singular values) with cumulated variance (red), and the lower panel shows the PC where the black curve represents the reanalysis and the red curves indicate the ten ensemble members. The leading EOF accounted for more than 50% of the variance, and stood out as the most important mode. The PCs suggested that there was a weak-to-moderate scatter (with respect to the decadal variations) between the ensemble members, and hence some indication of predictive skill.
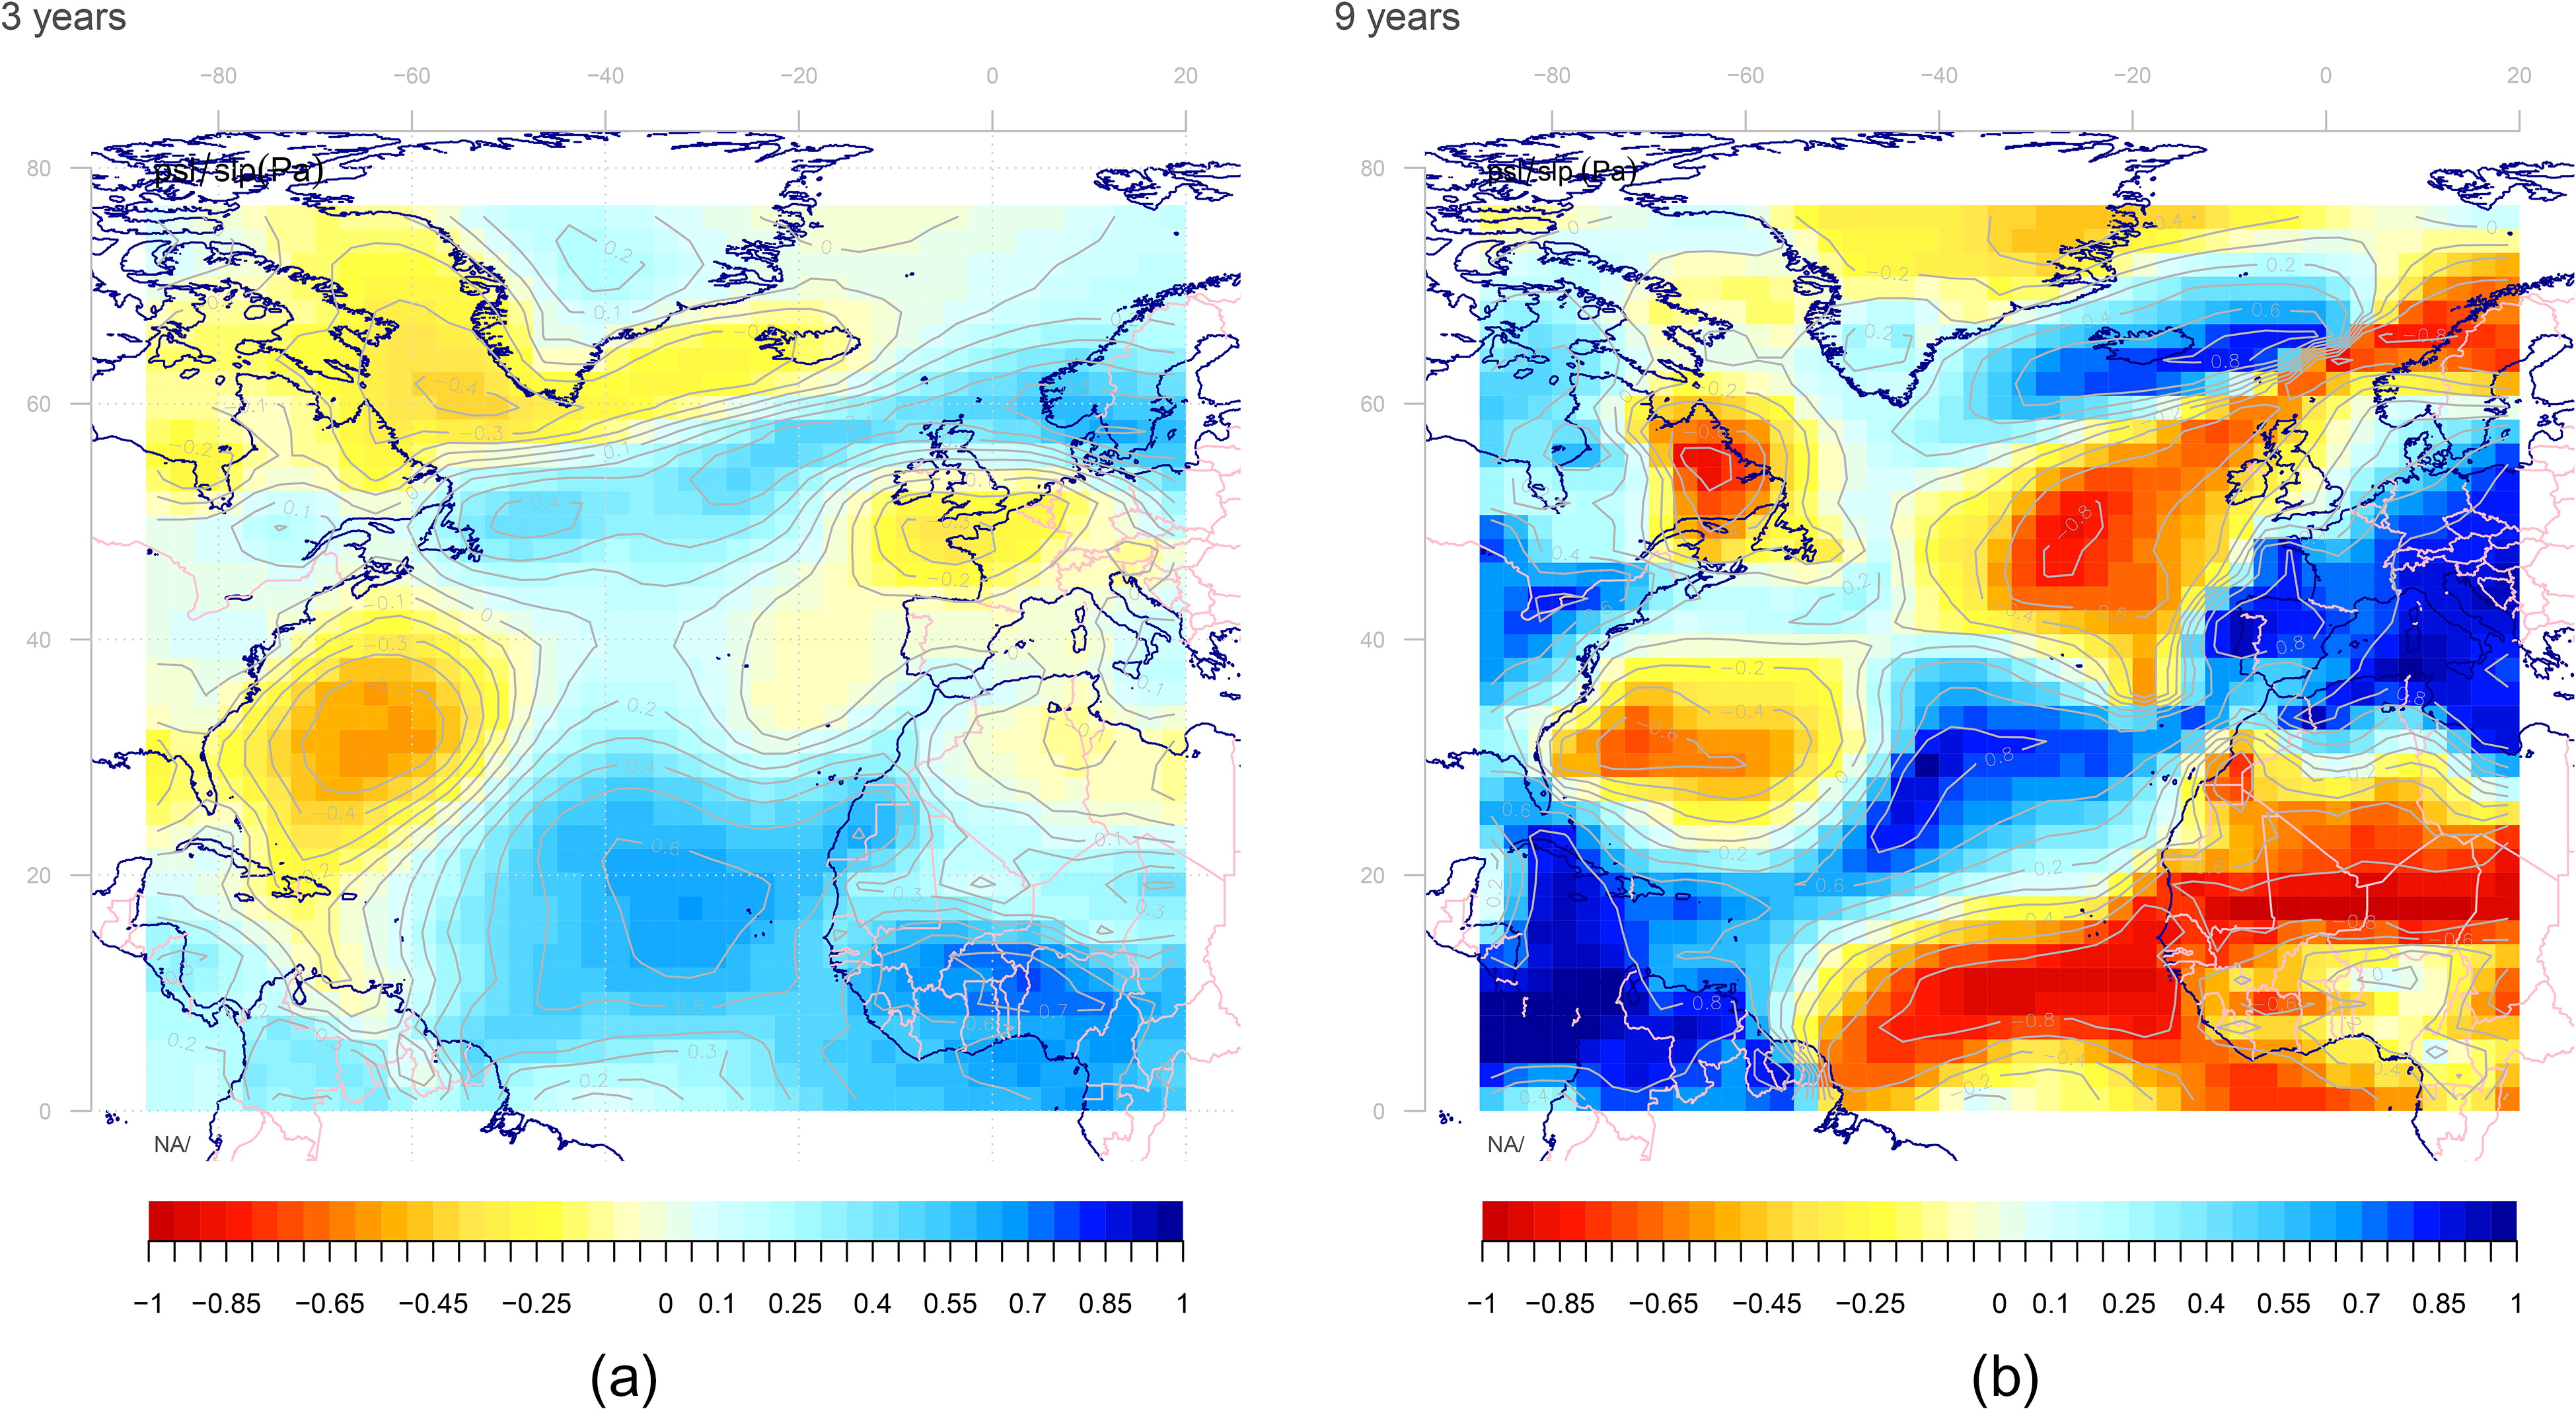
Fig. 6.
(a) Same as Fig. 4a, but showing correlation maps for NCAR/NCEP reanalysis 1 and forecasted three-year mean SLP. The correlations were substantially lower than for TAS, suggesting less skillful forecasts when it comes to atmospheric circulation patterns. (b) Correlation maps for observed and forecasted nine-year mean SLP.
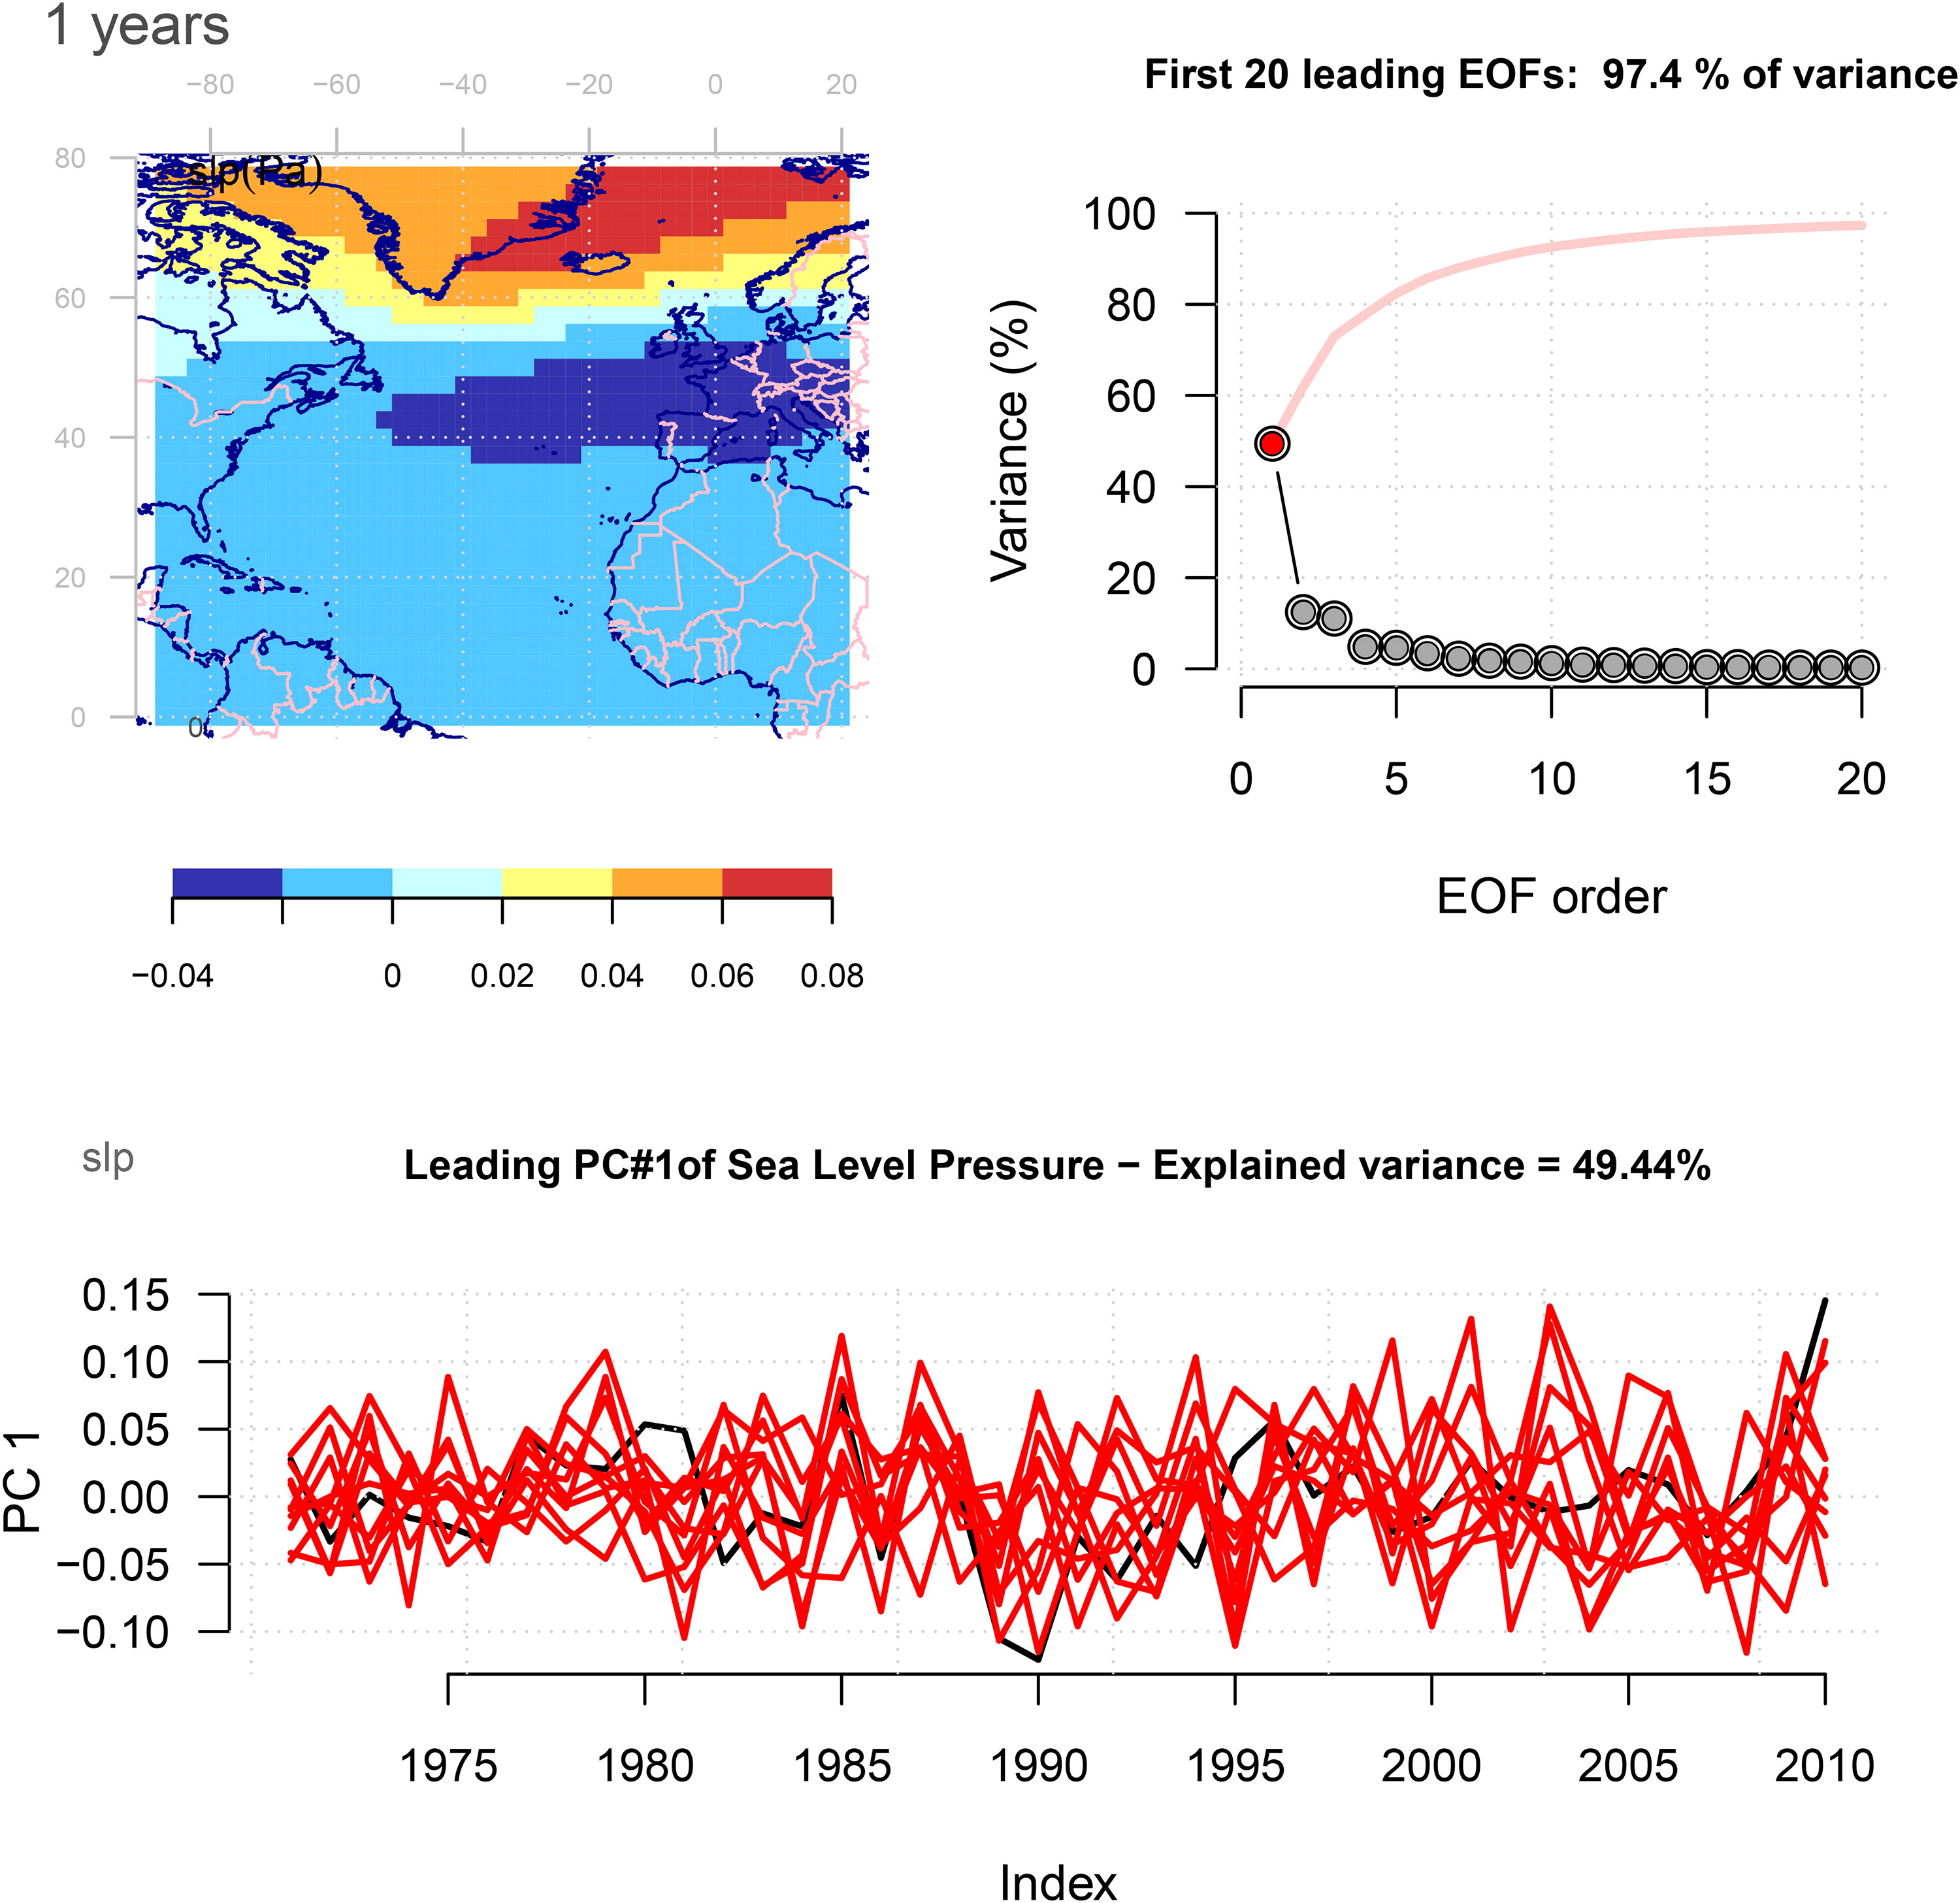
Fig. 7.
Common EOFs estimated for the joint annual SLP NCEP/NCAR reanalysis and the forecasts. The upper left panel shows the common spatial anomaly structure common for the reanalysis and all ensemble members, the upper right shows the variance associated with each EOF (singular values) with cumulated variance (red), and the lower panel shows the PC where the black curve represents the reanalysis and the red curves indicate the ten ensemble members. The leading EOF accounted for about 50% of the variance, and stood out as the most important mode. There was a substantial spread in way the PC was captured by the ensemble members.
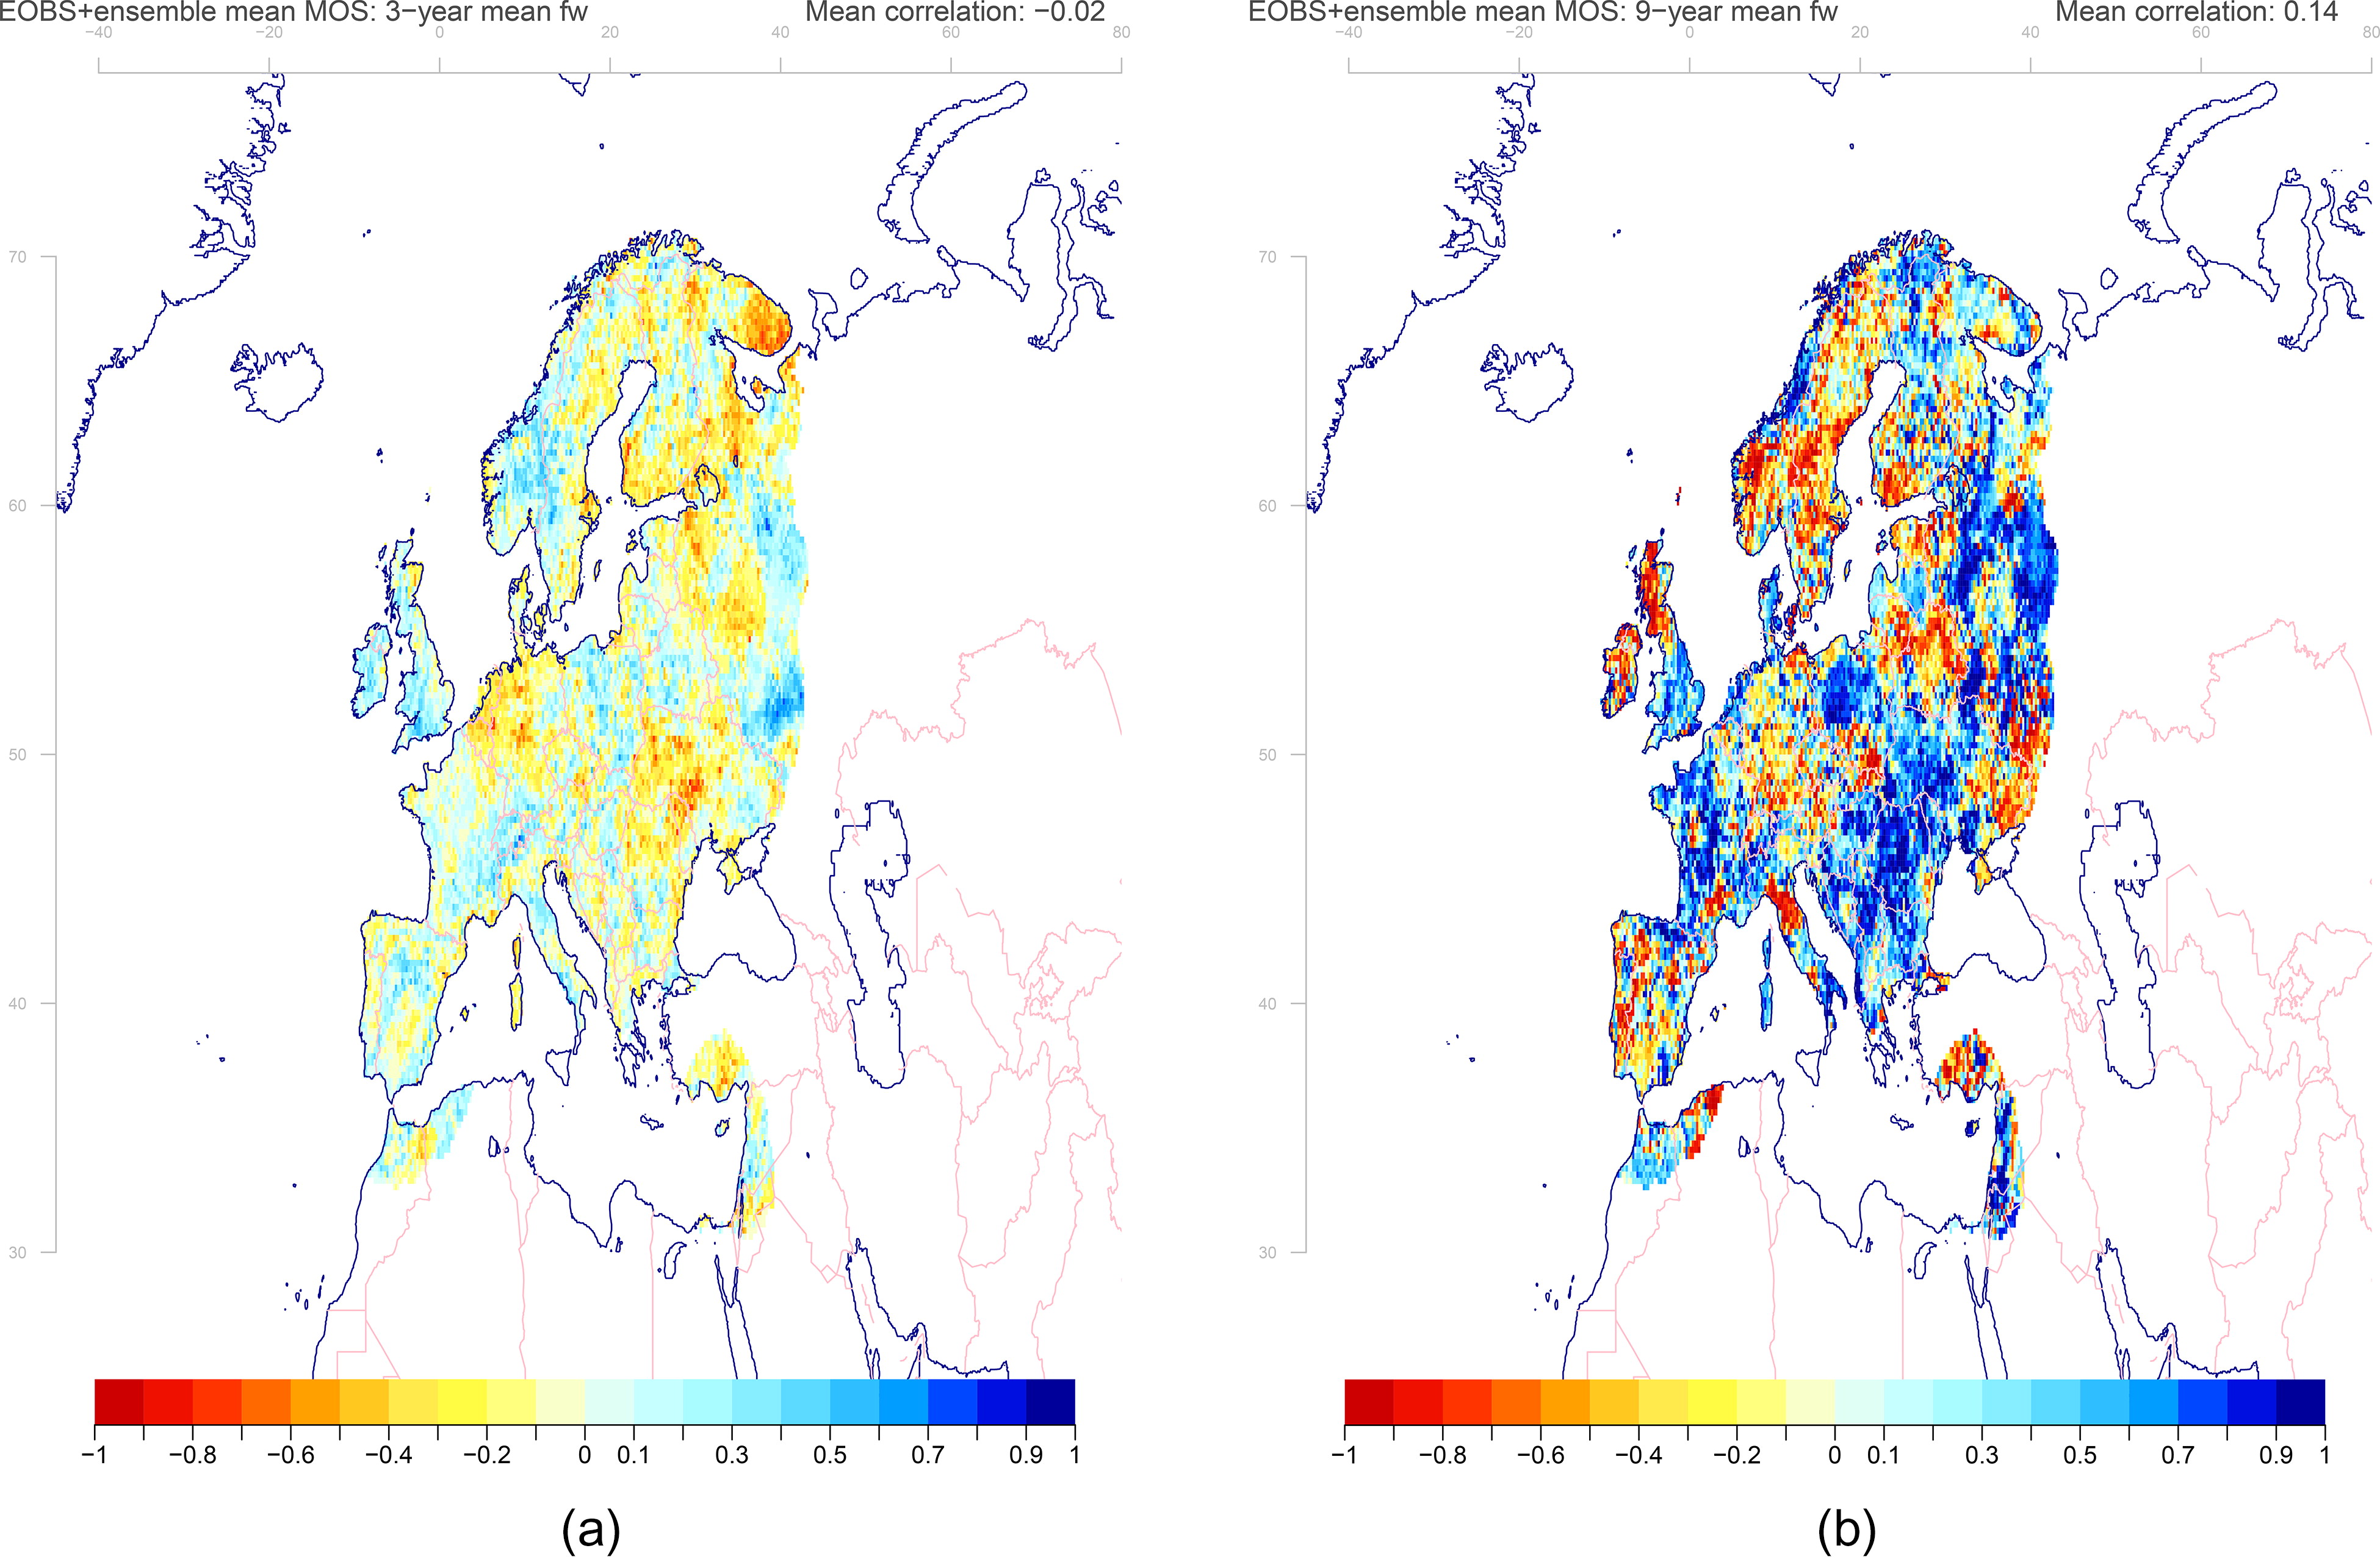
Fig. 8.
The correlation between (a) the three-year and (b) nine-year wet-day frequency estimated from the EOBS data and the mean MOS results taken over the entire ensemble. The results indicated low skill for the prediction of three-year fw.
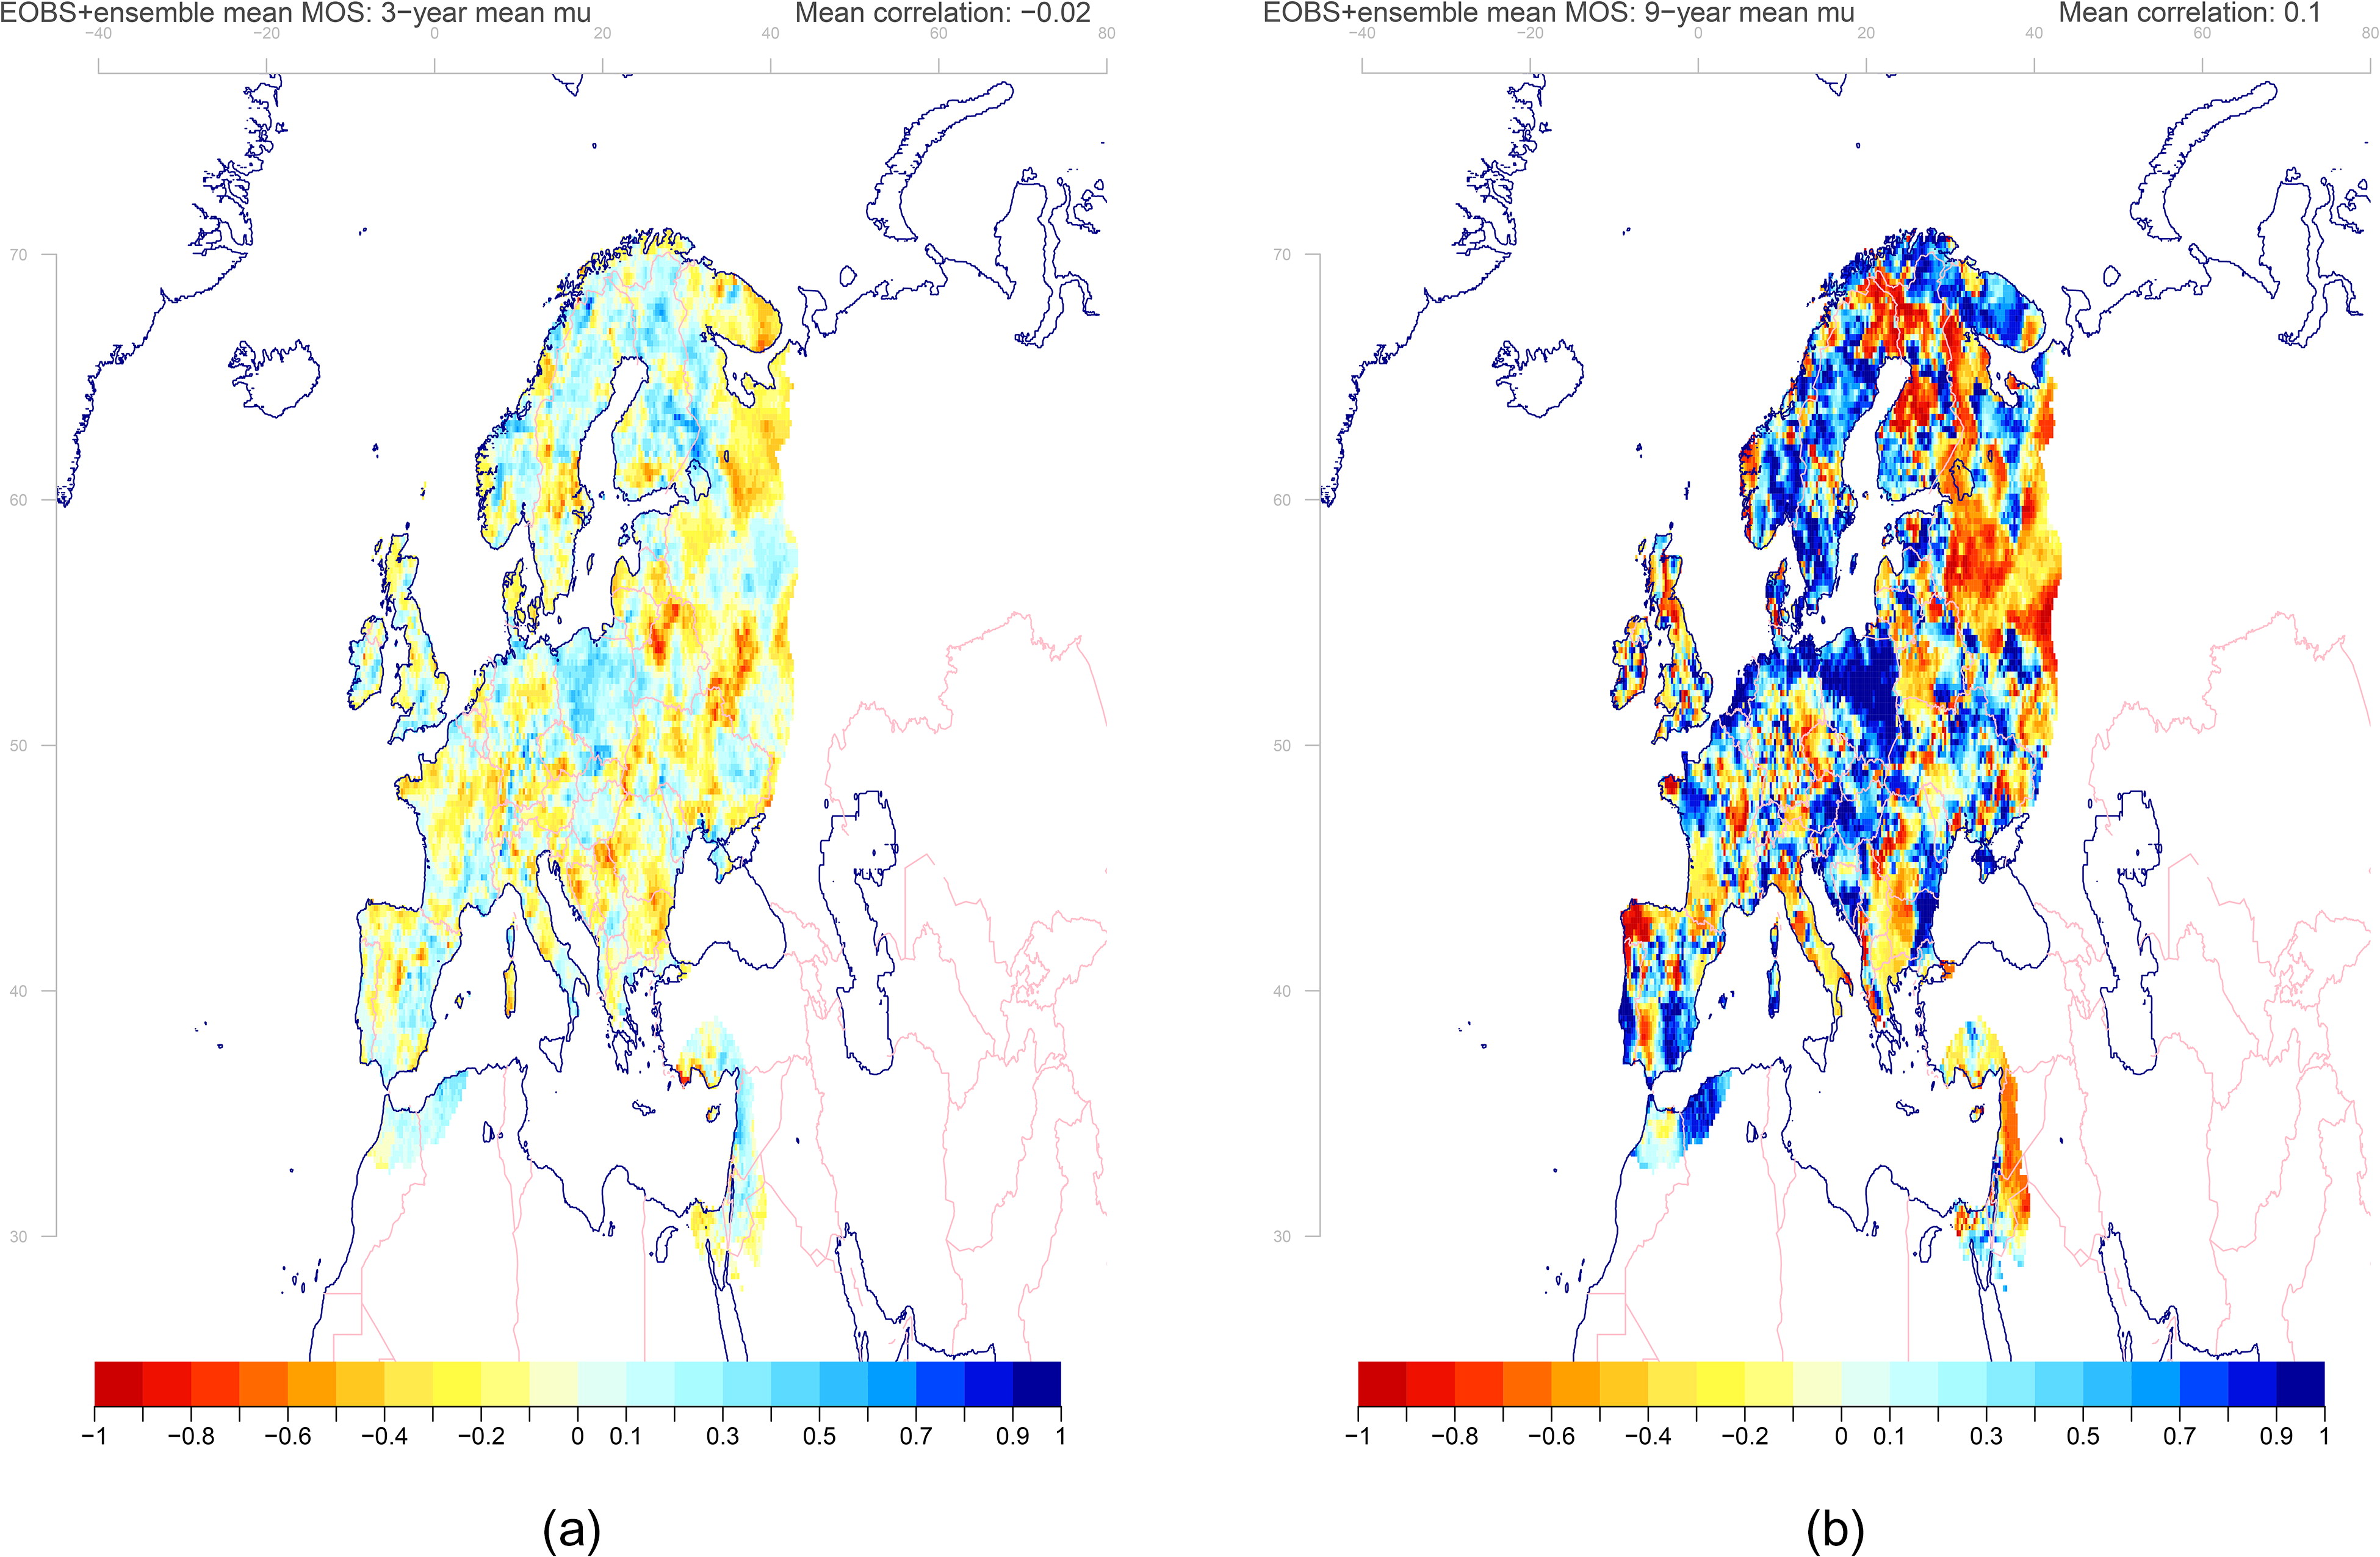
Fig. 9.
The correlation between the (a) three-year and (b) nine-year wet-day mean precipitation estimated from the EOBS data and the mean MOS results taken over the entire ensemble. The correlations were more heterogeneous for μ than for fw, with several regions that had higher values. However, there were also regions with weak scores.
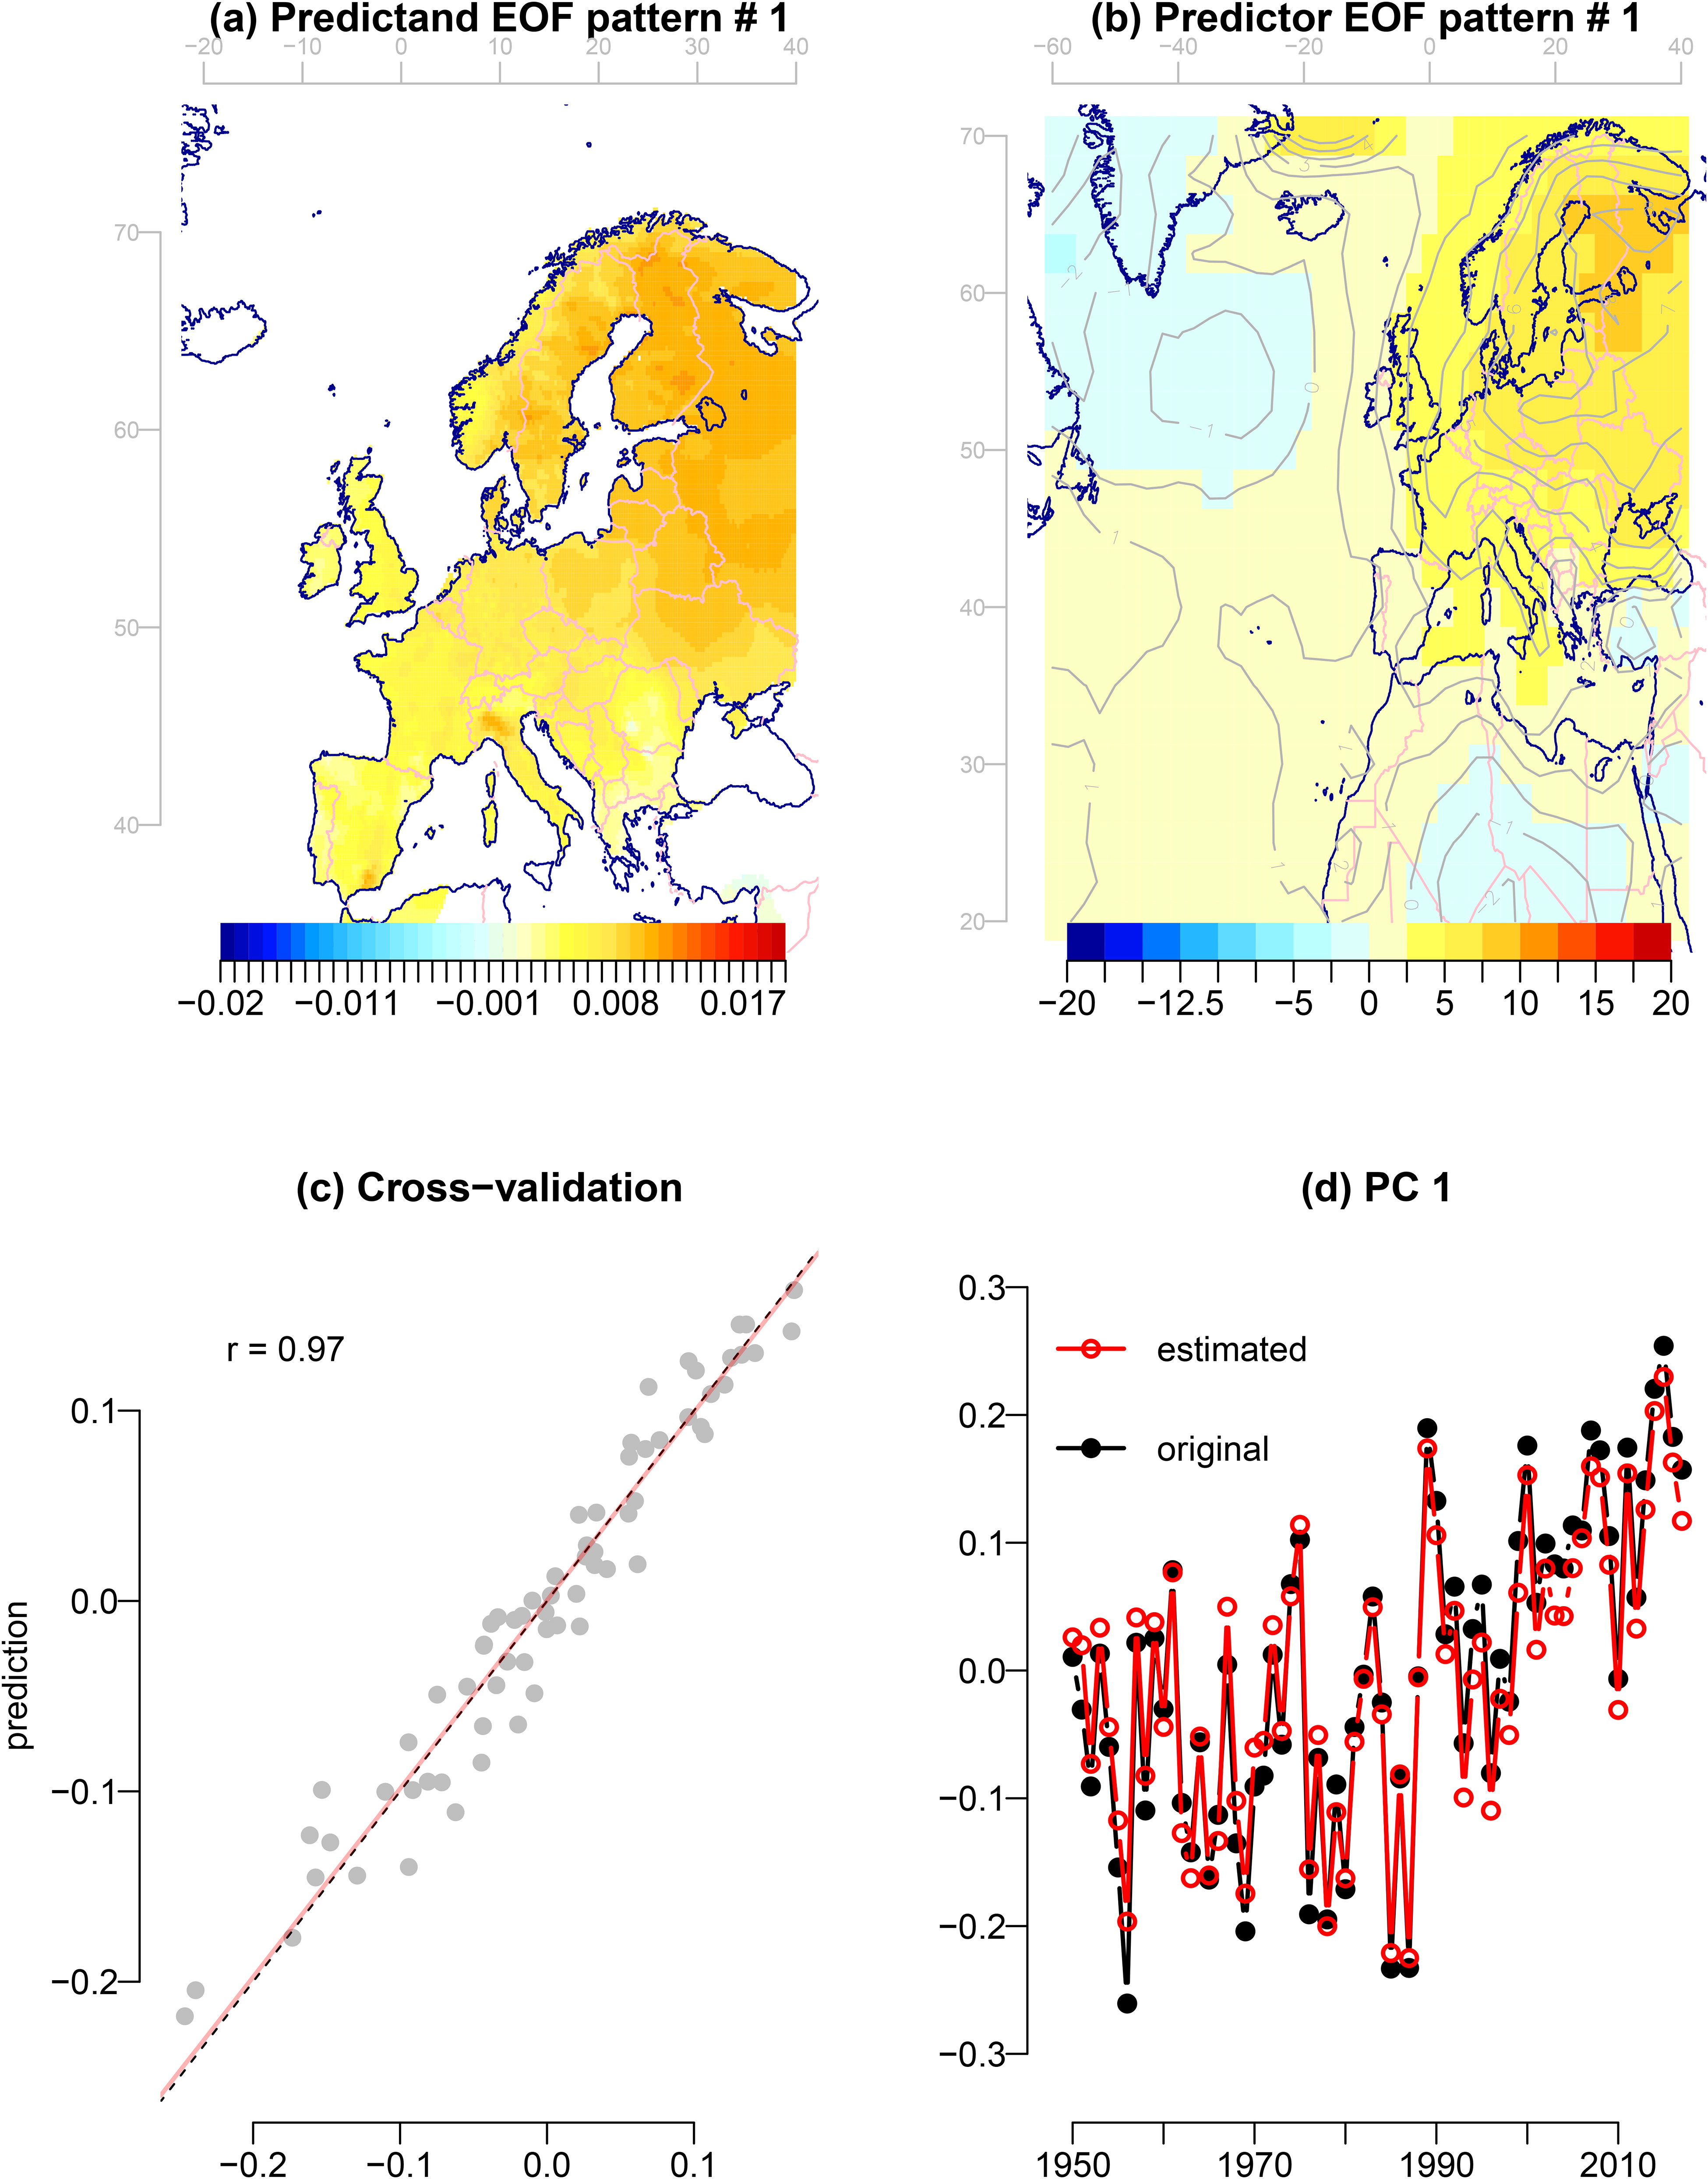
Fig. 10.
Results from the ESD experiment indicated a strong link between large-scale and local annual mean TAS anomalies. The upper left panel shows the pattern of the leading EOF estimated for the annual TAS from EOBS, upper right shows the TAS anomalies from the NCEP/NCAR reanalysis 1 associated with variations in the leading PC, lower left shows a scatter plot between the original PC and predictions in terms of LOO cross-validation, and the lower right shows the original time series (black) and the calibrated results (red).
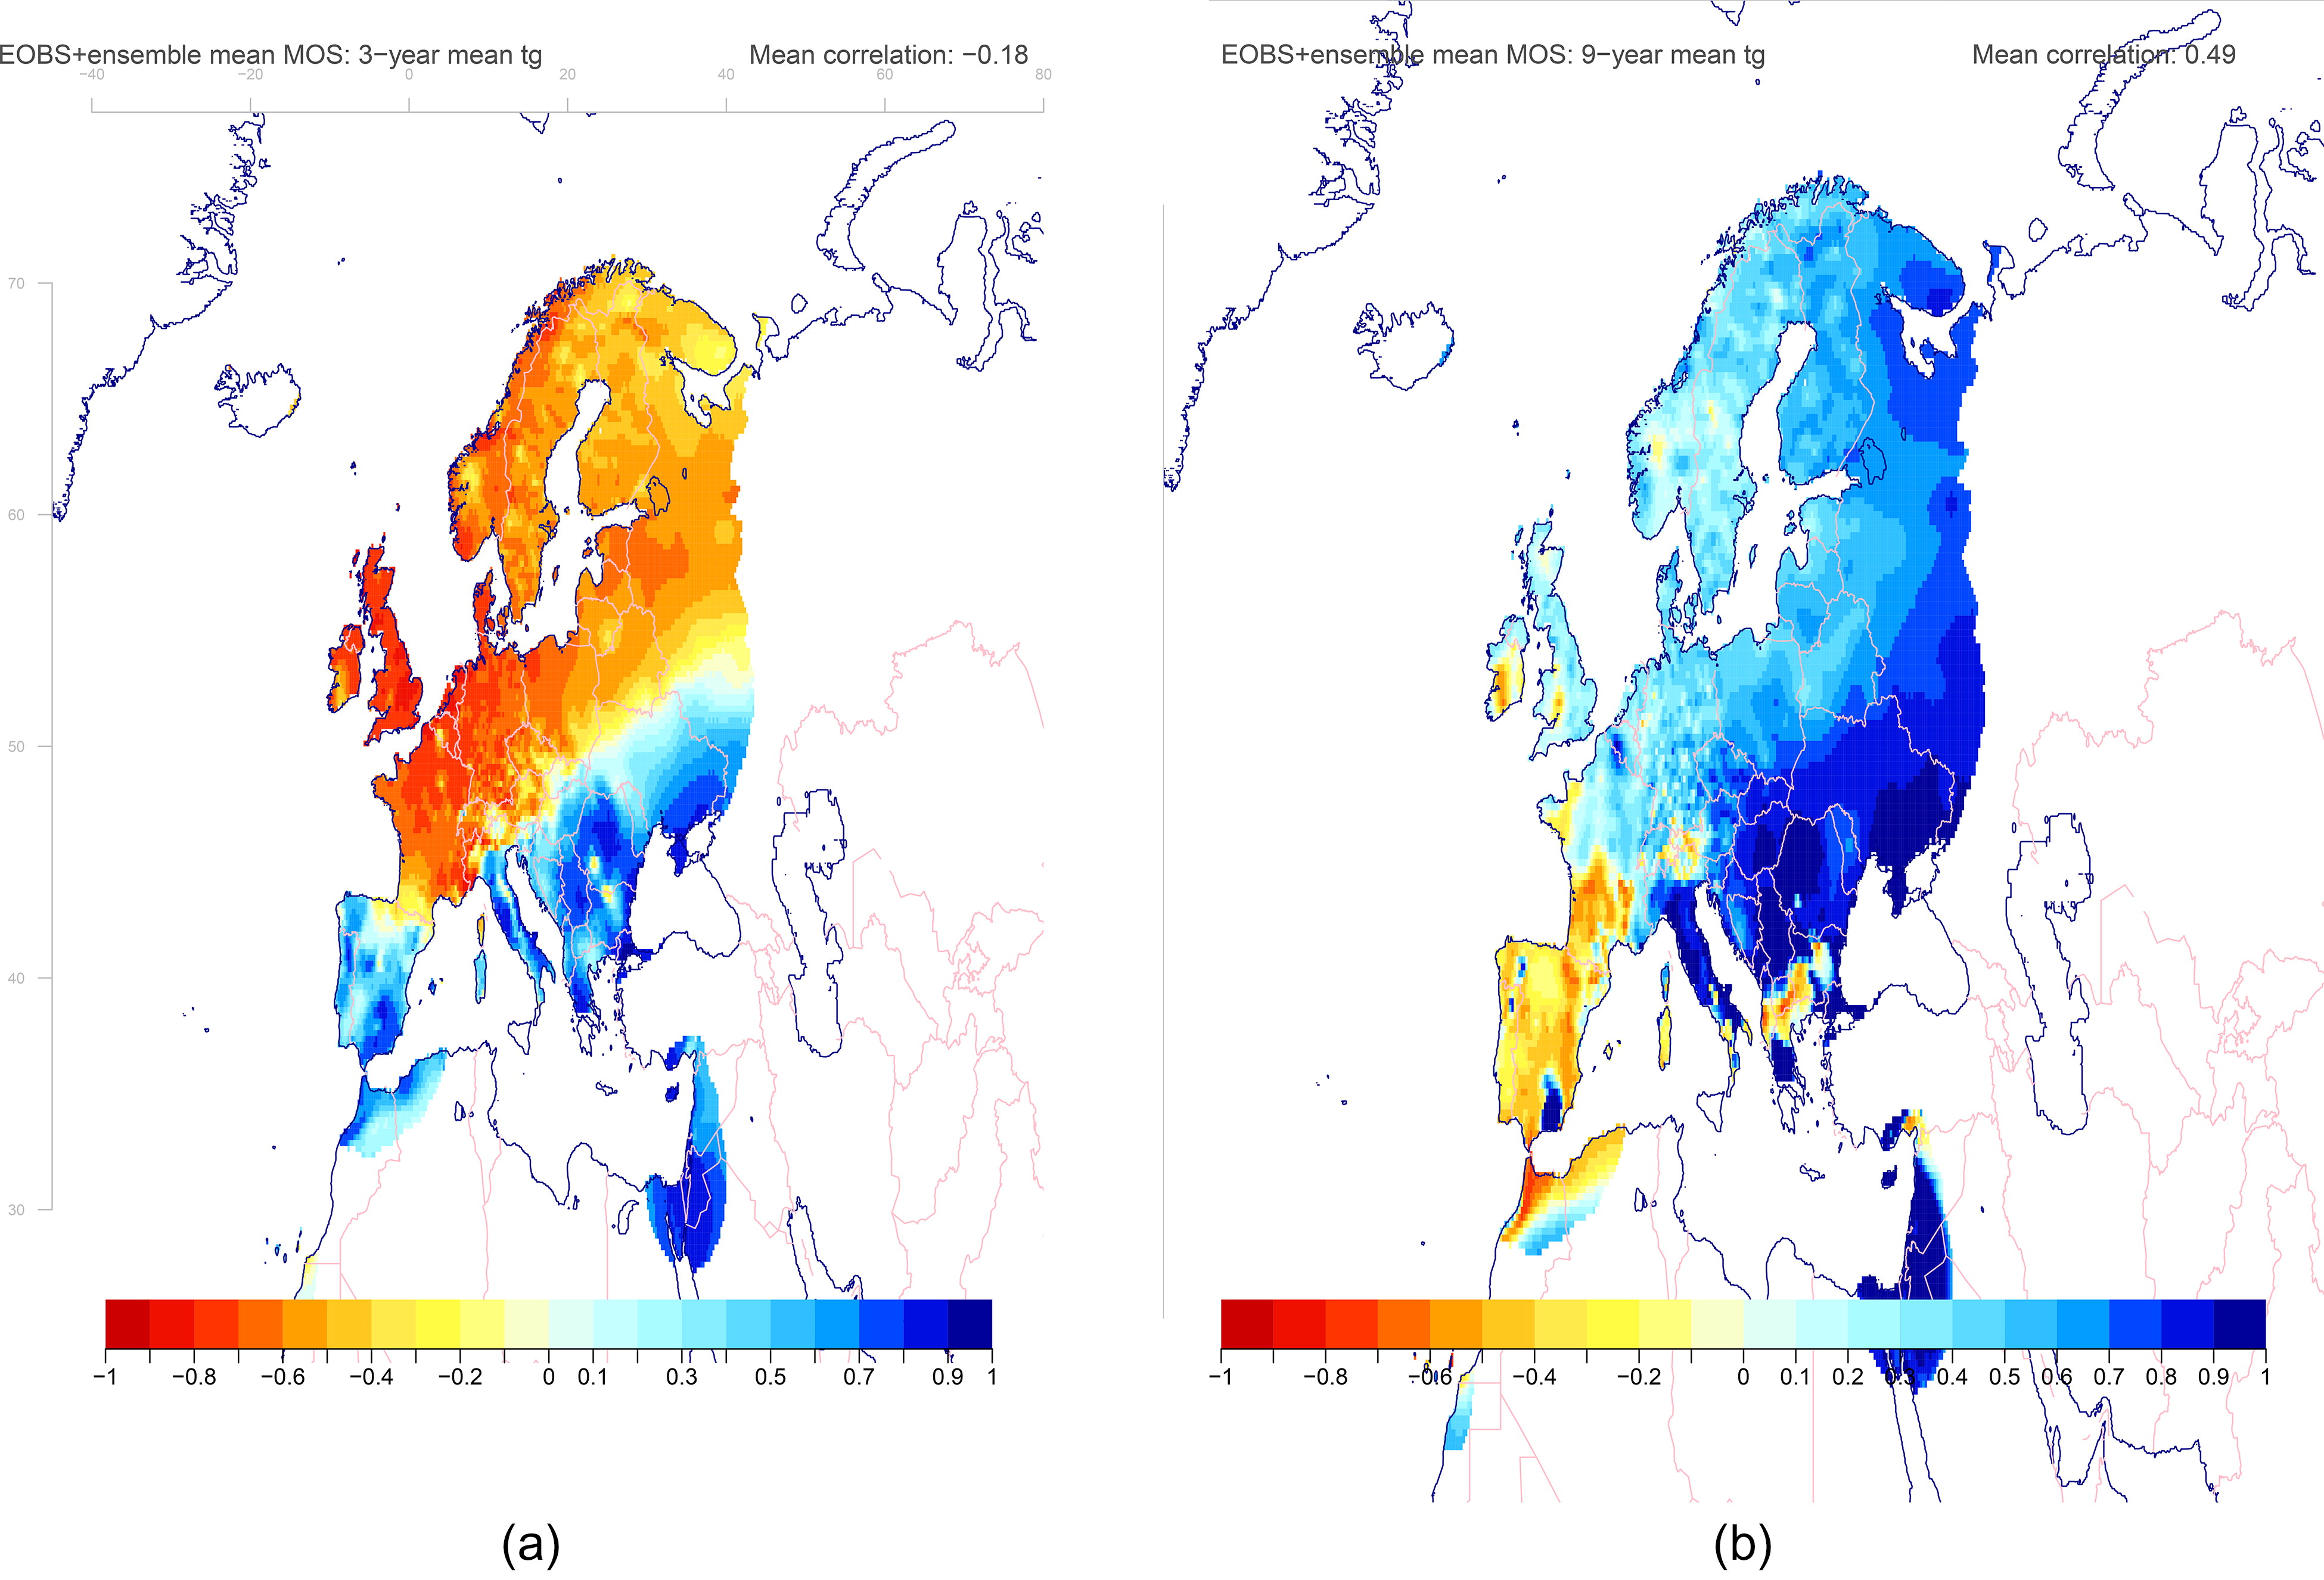
Fig. 11.
The correlation between the (a) three-year and (b) nine-year mean TAS estimated from the EOBS data and the mean MOS results taken over the entire ensemble. The results indicated low skill for the prediction of three-year TAS. Only the maritime air temperatures from the decadal predictions were used to downscale the gridded temperature over Europe.