
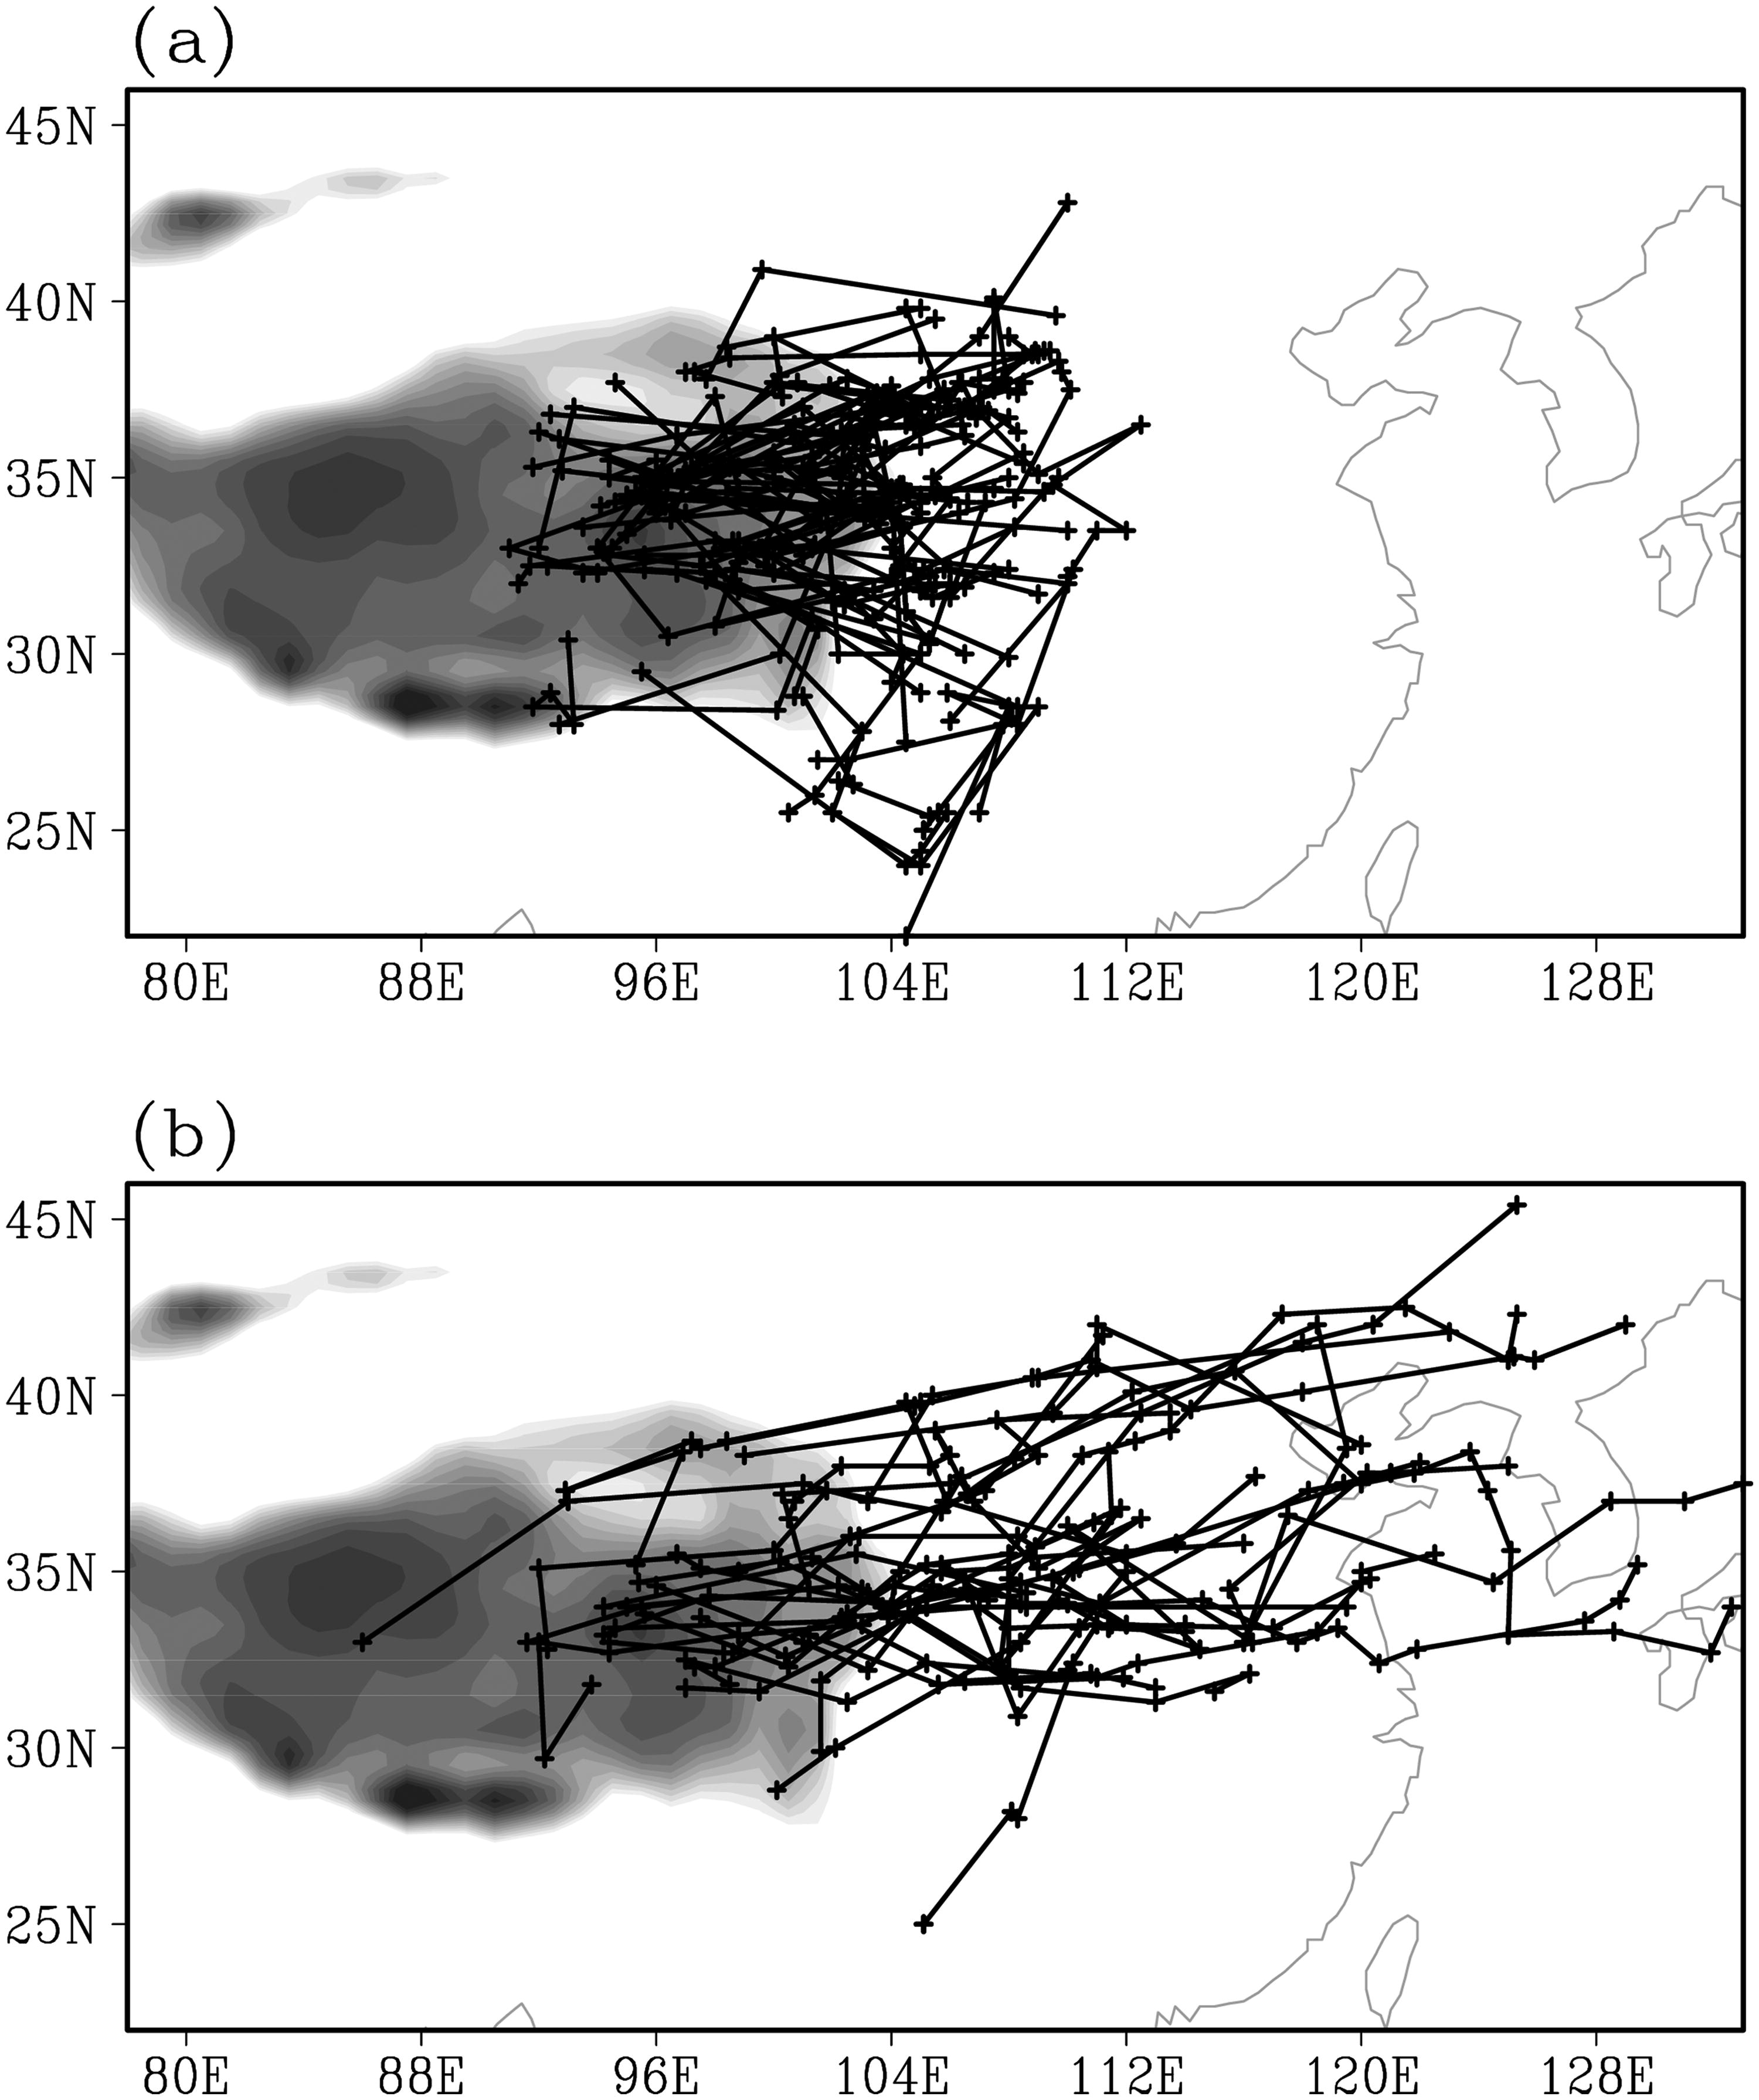
Fig. 1.
Tracks of the two groups of moving-off TPVs classified according to the EPDs. The upper (a) and lower (b) panels correspond to situation W and situation E, respectively. Shading indicates areas with altitude over 3000 m. The cross (+) in each track denotes the centre position of the vortex at a time interval of 12 h.
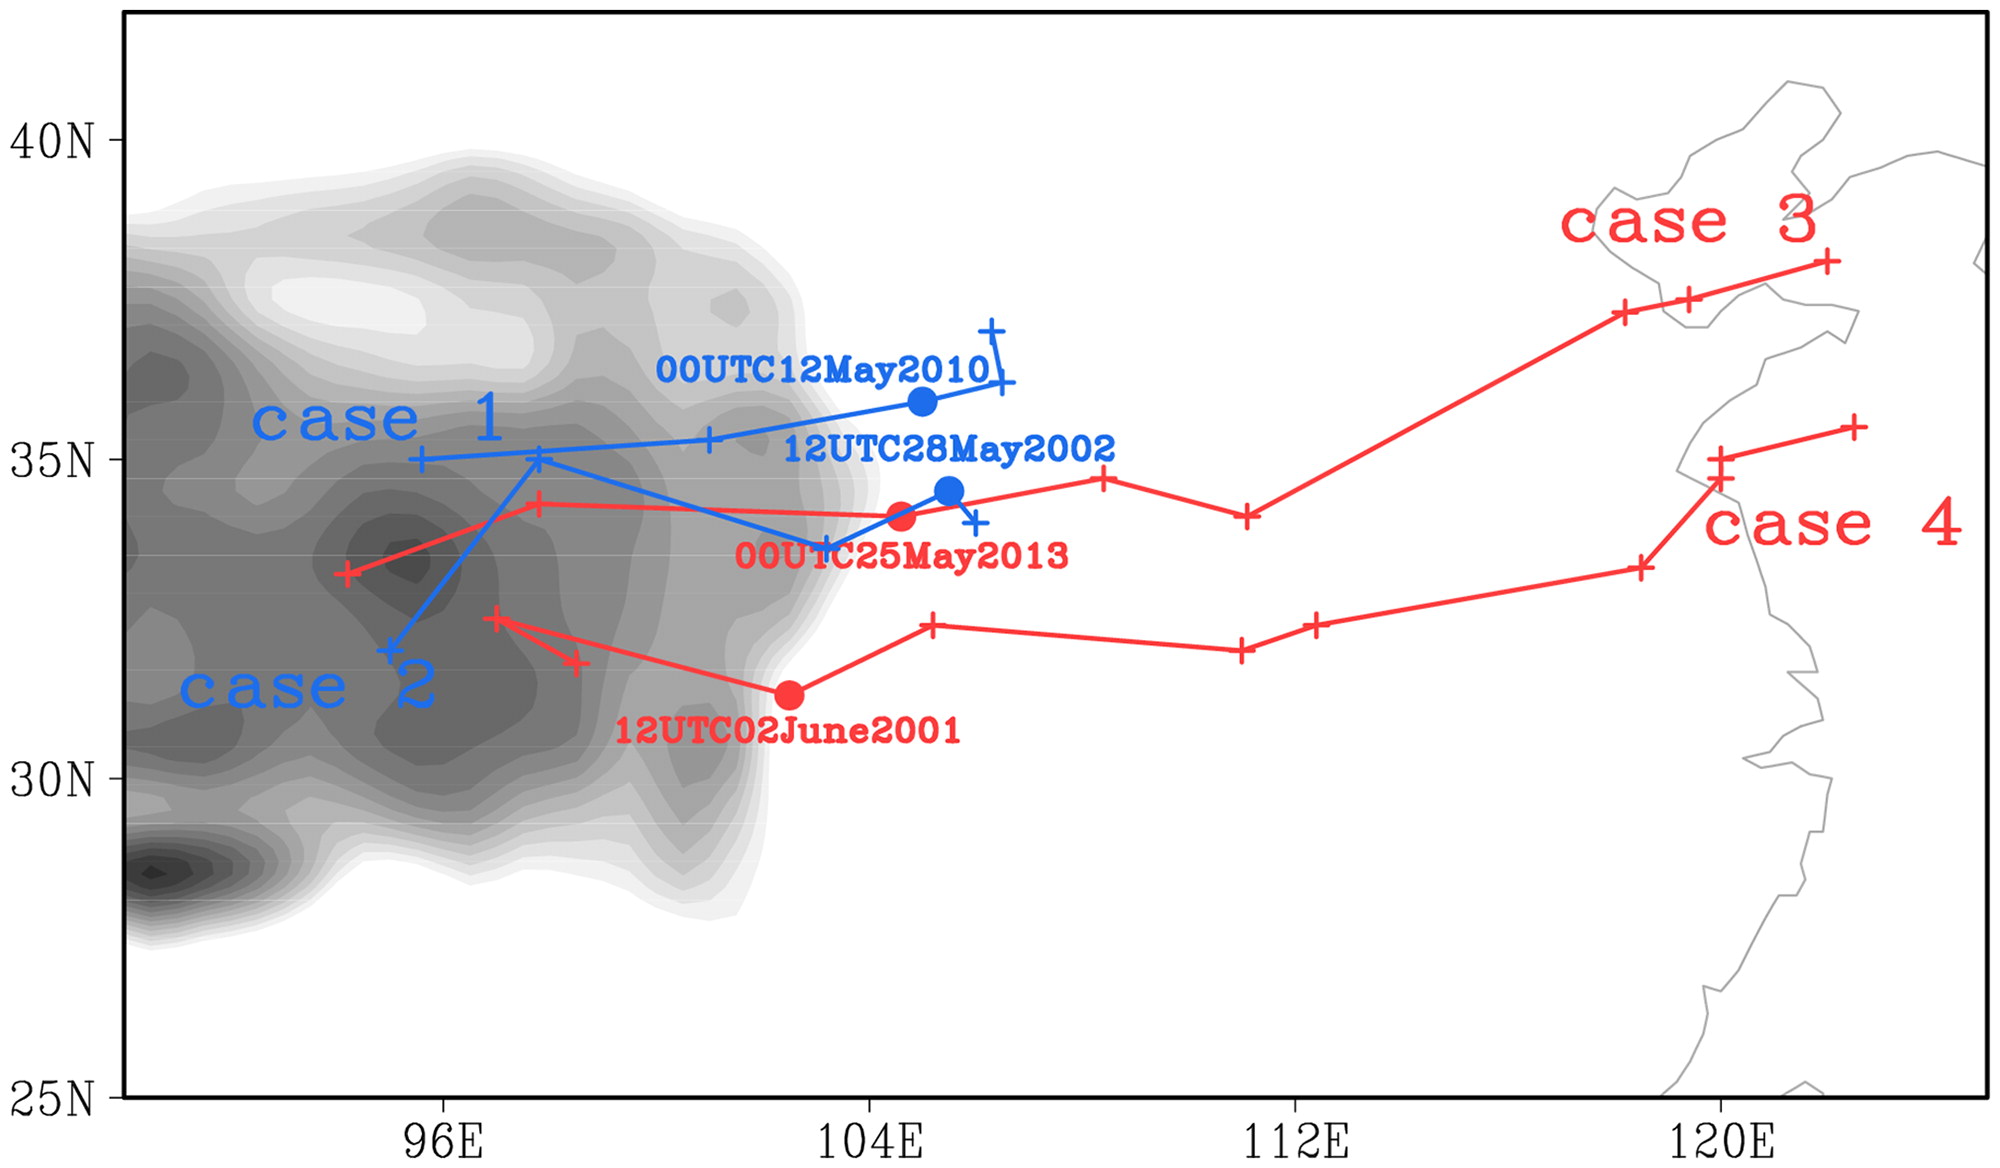
Fig. 2.
Two TPVs with short EPDs (case 1 and case 2) and two TPVs with long EPDs (case 3 and case 4). The cross (+) in each track denotes the centre position of the vortex at a time interval of 12 h. The locations of TPVs at the moving-off times are dotted. Shading indicates areas with altitude over 3000 m.
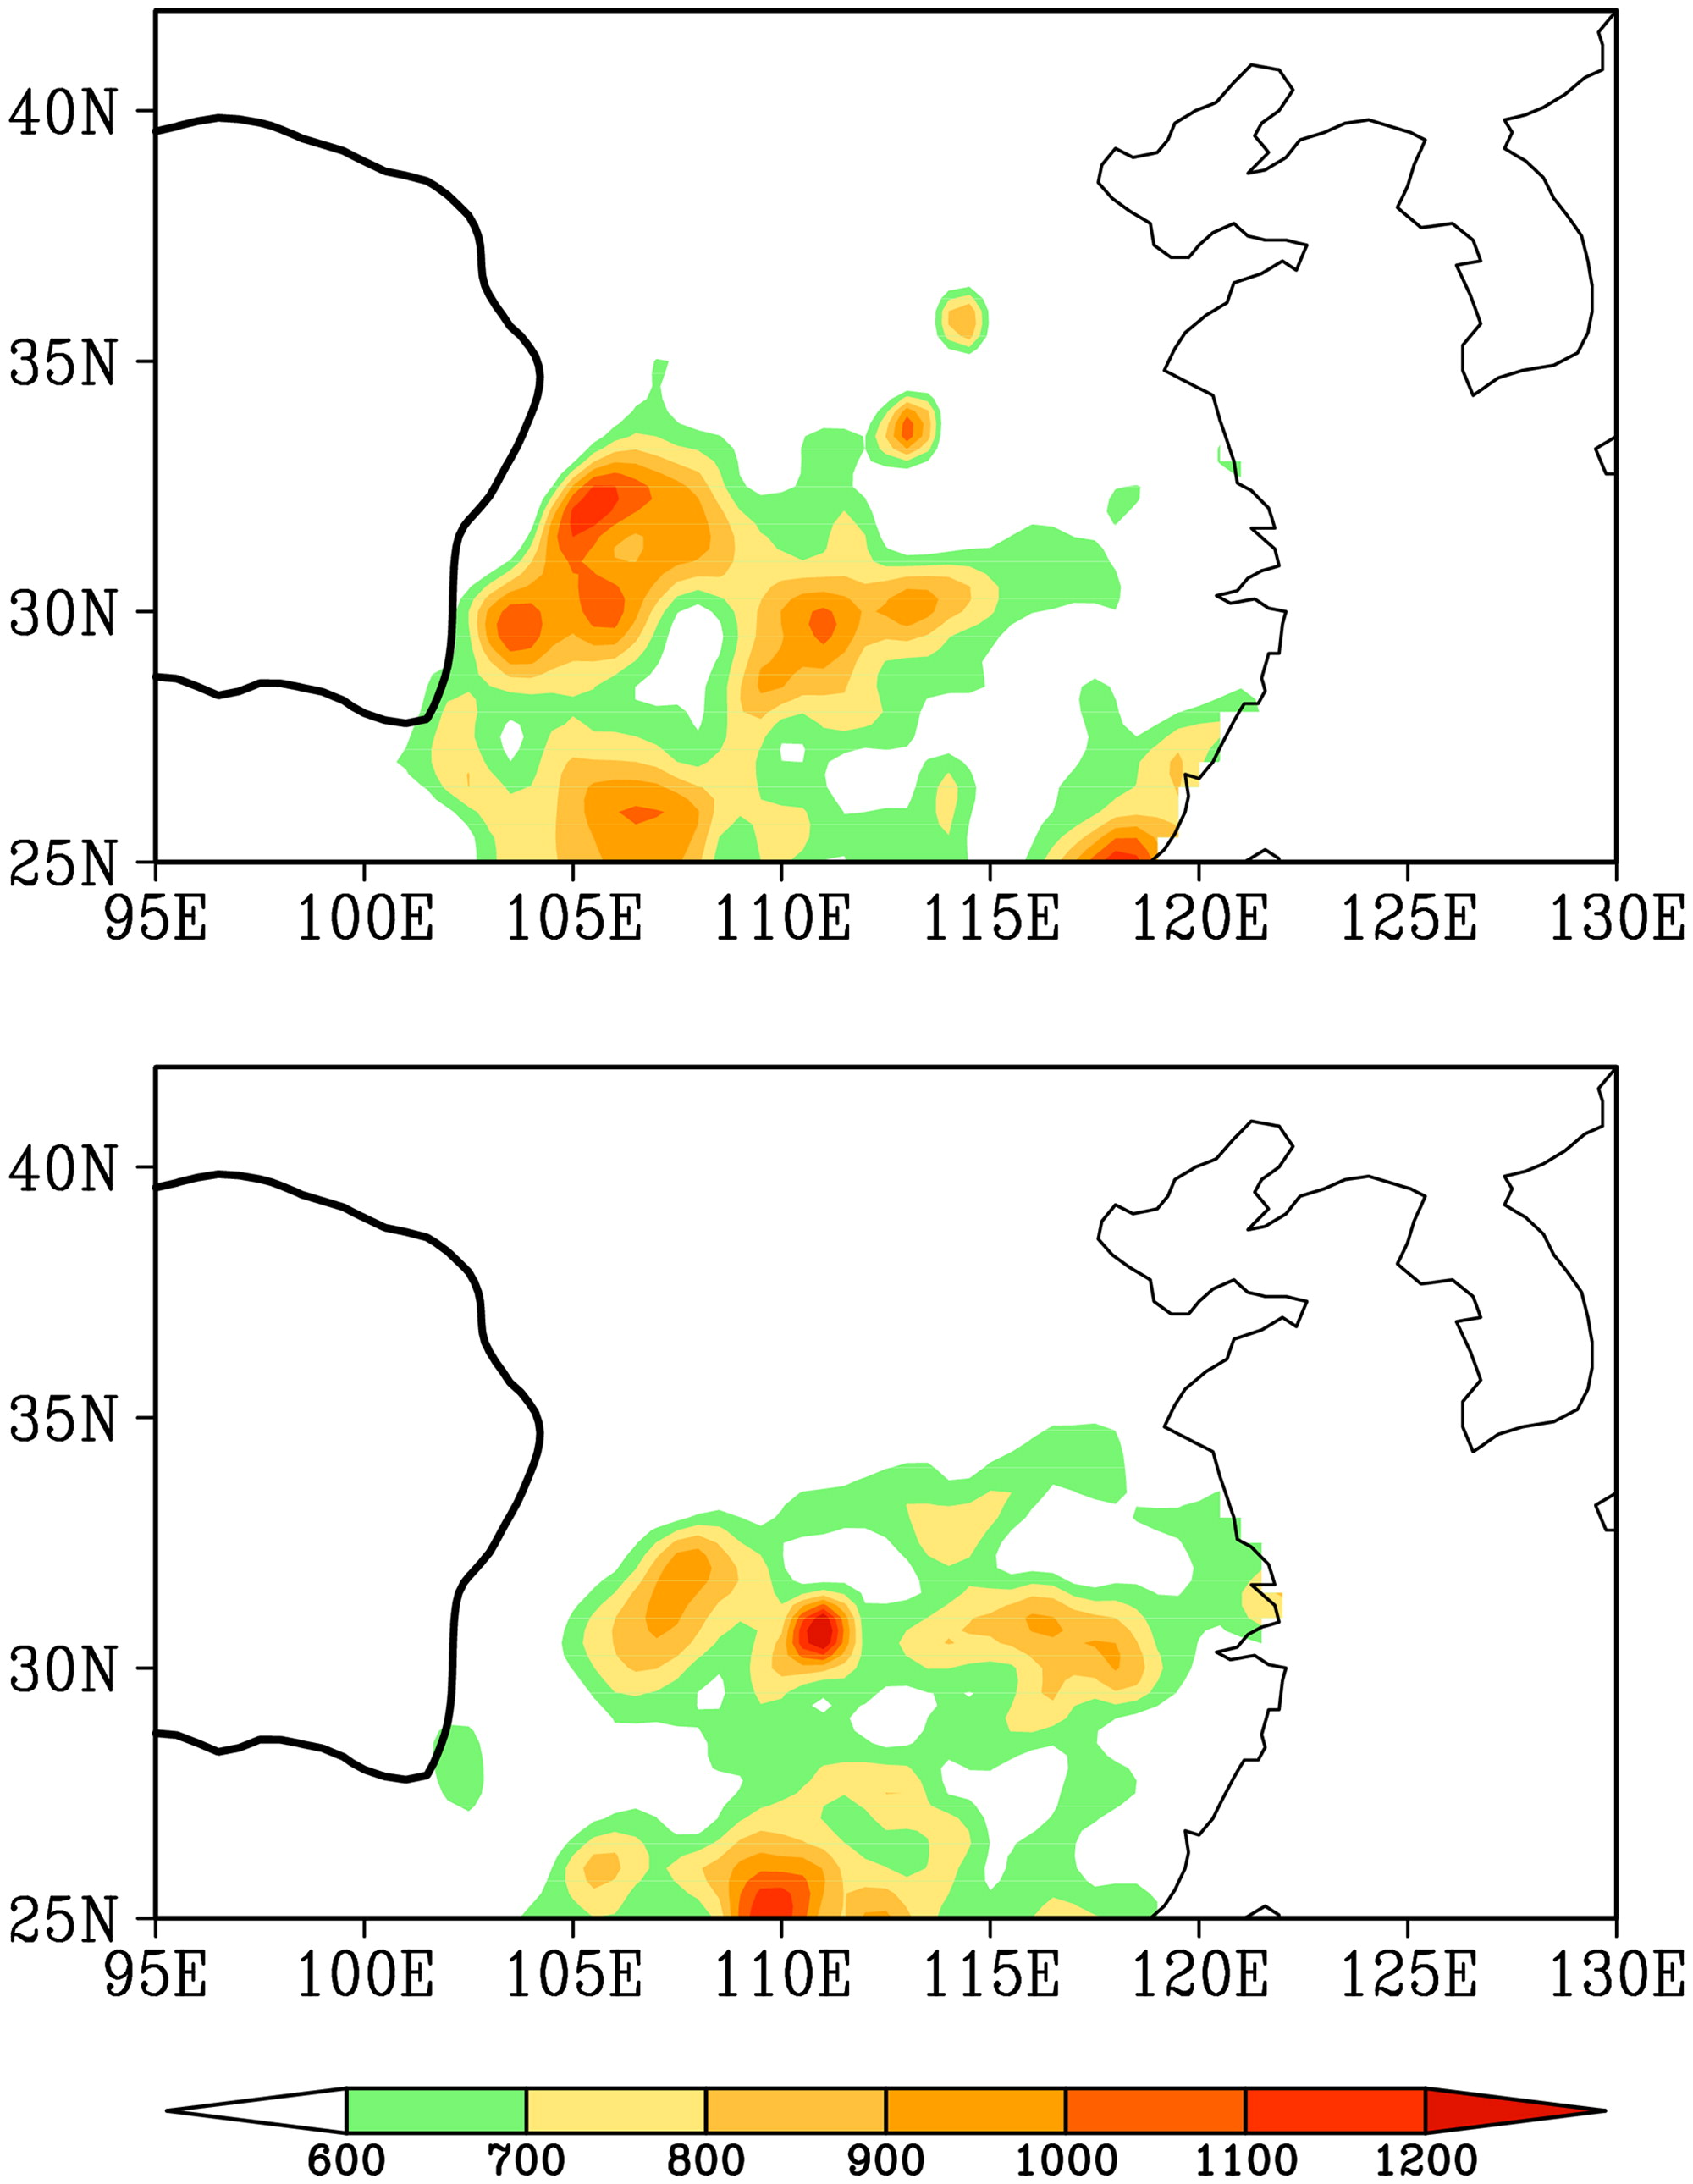
Fig. 3.
Accumulated rainfall after the TPVs move off the plateau in (a) situation W and (b) situation E (unit: cm). The black line represents the topographic contour of 3000 m.
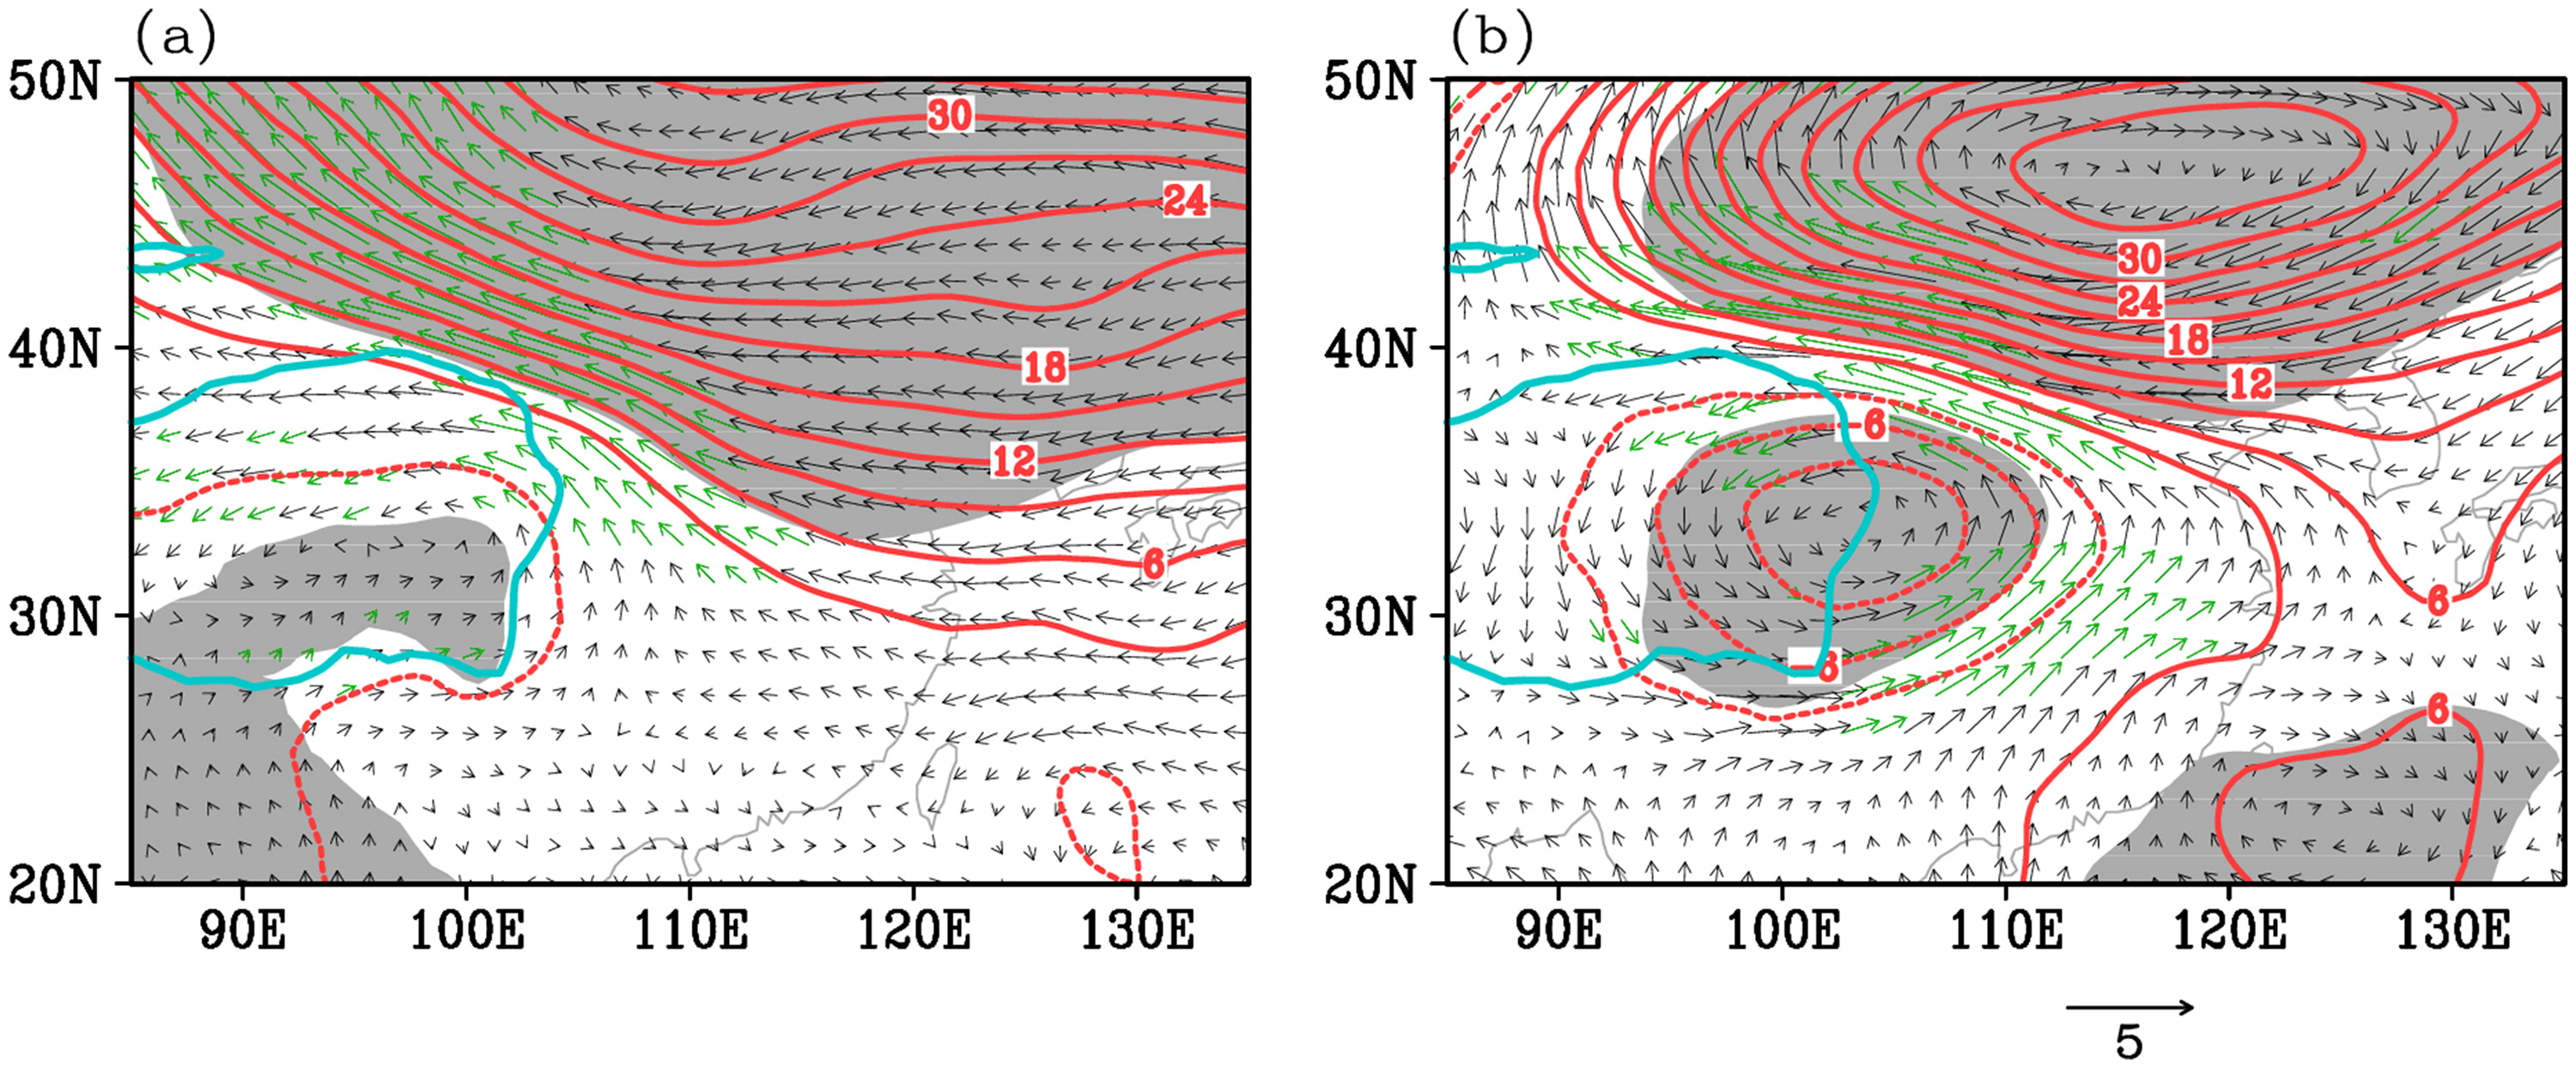
Fig. 4.
Composites of the 500 hPa anomalous winds (vectors; unit: m s−1) and geopotential height (contours; unit: gpm) in (a) situation W and (b) situation E. The cyan line represents the topographic contour of 3000 m. The geopotential height anomalies with statistical significance exceeding the 90% confidence level are shaded, and winds exceeding the 90% confidence level are coloured with green.
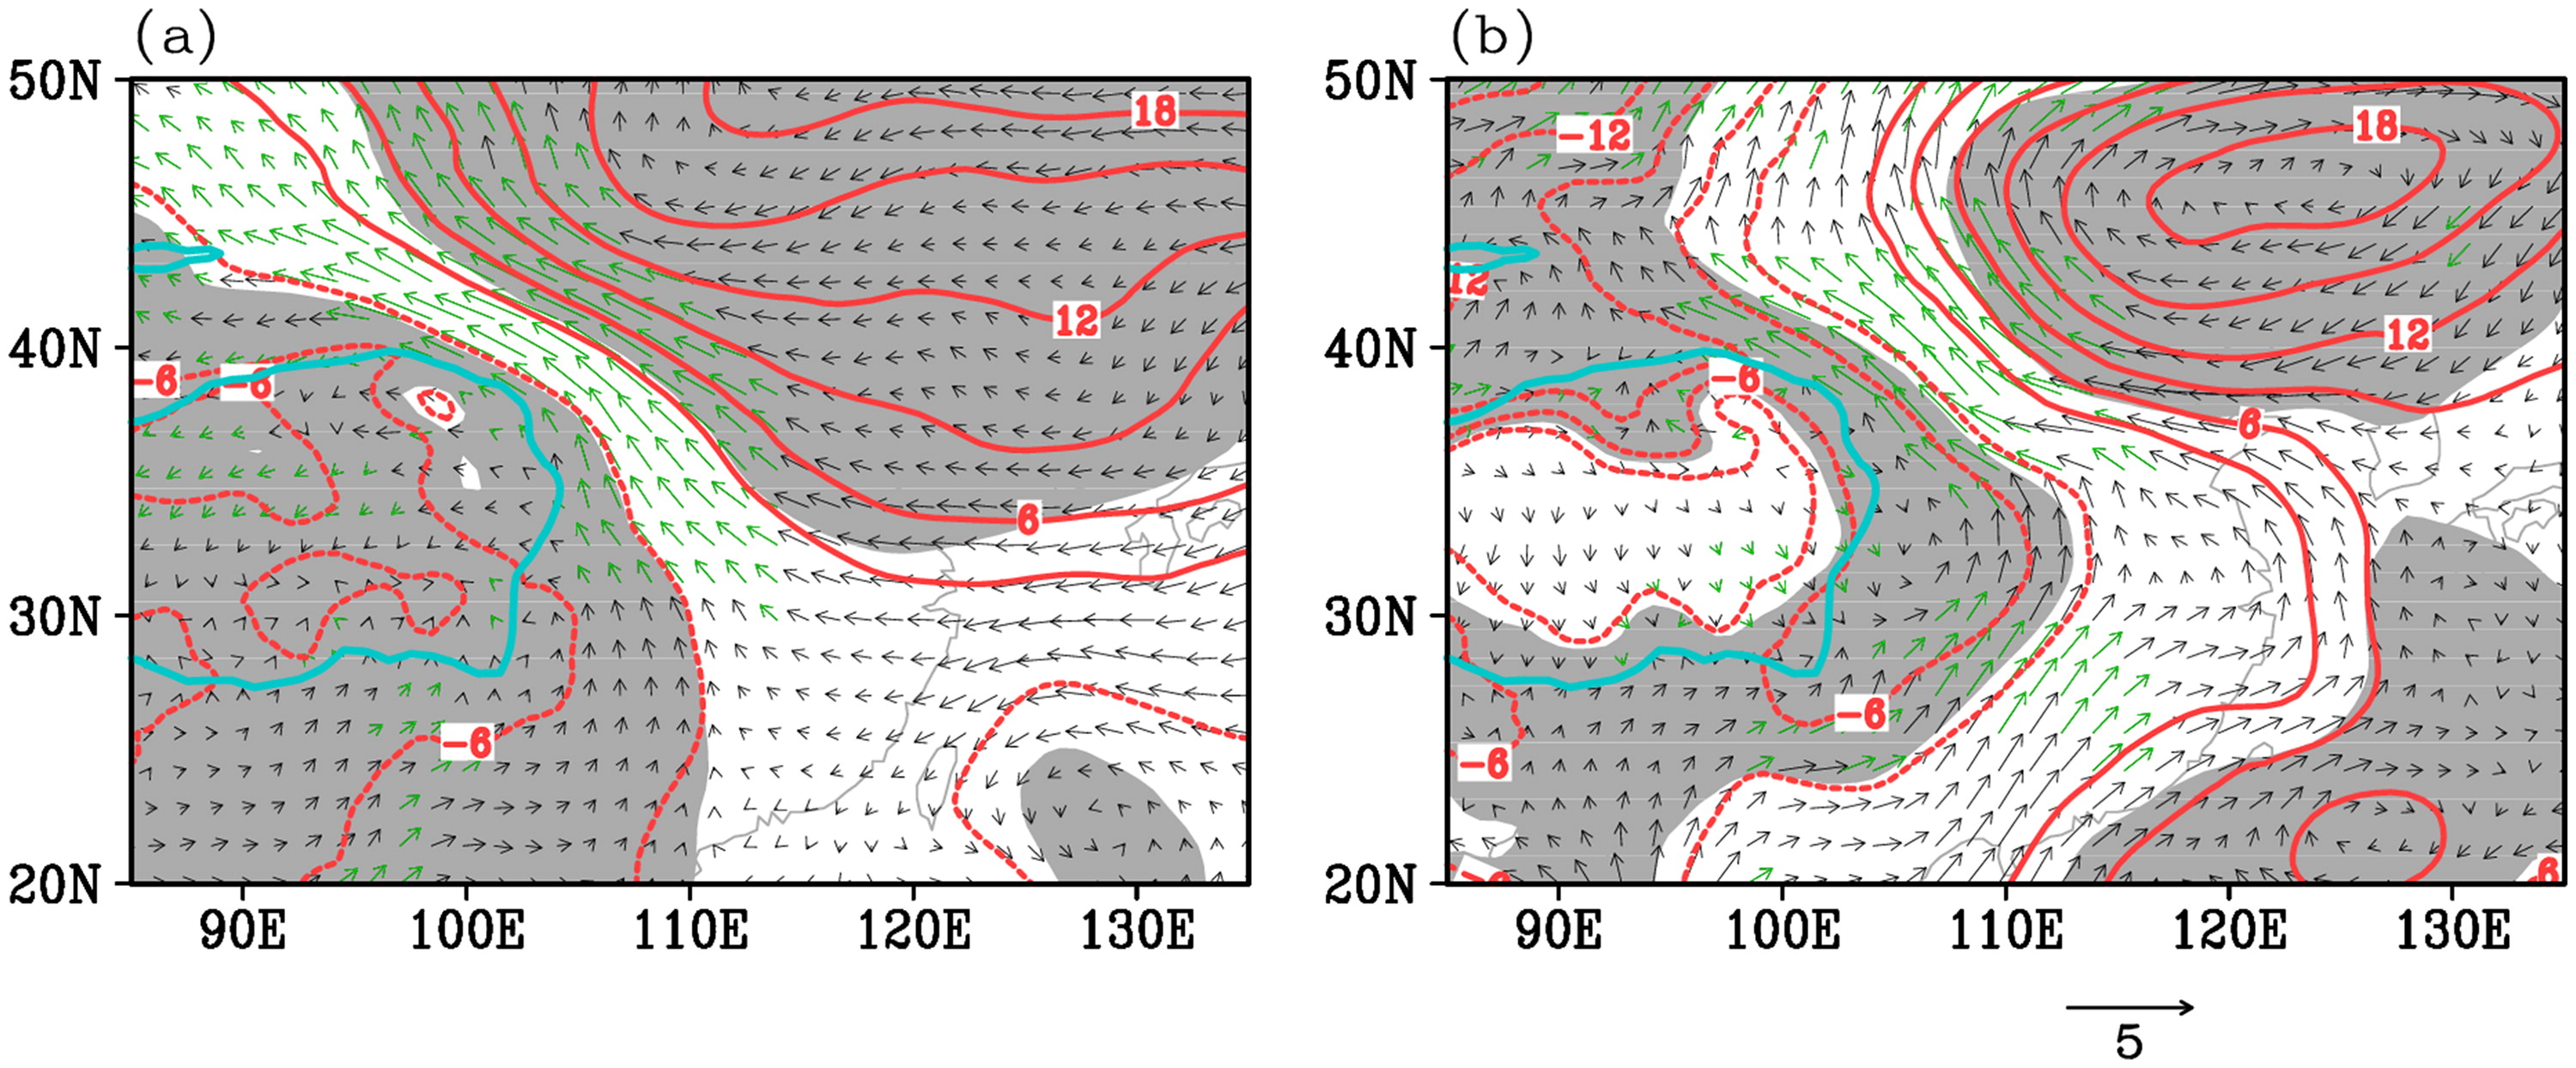
Fig. 5.
Same as Fig. 4 but for 700 hPa.
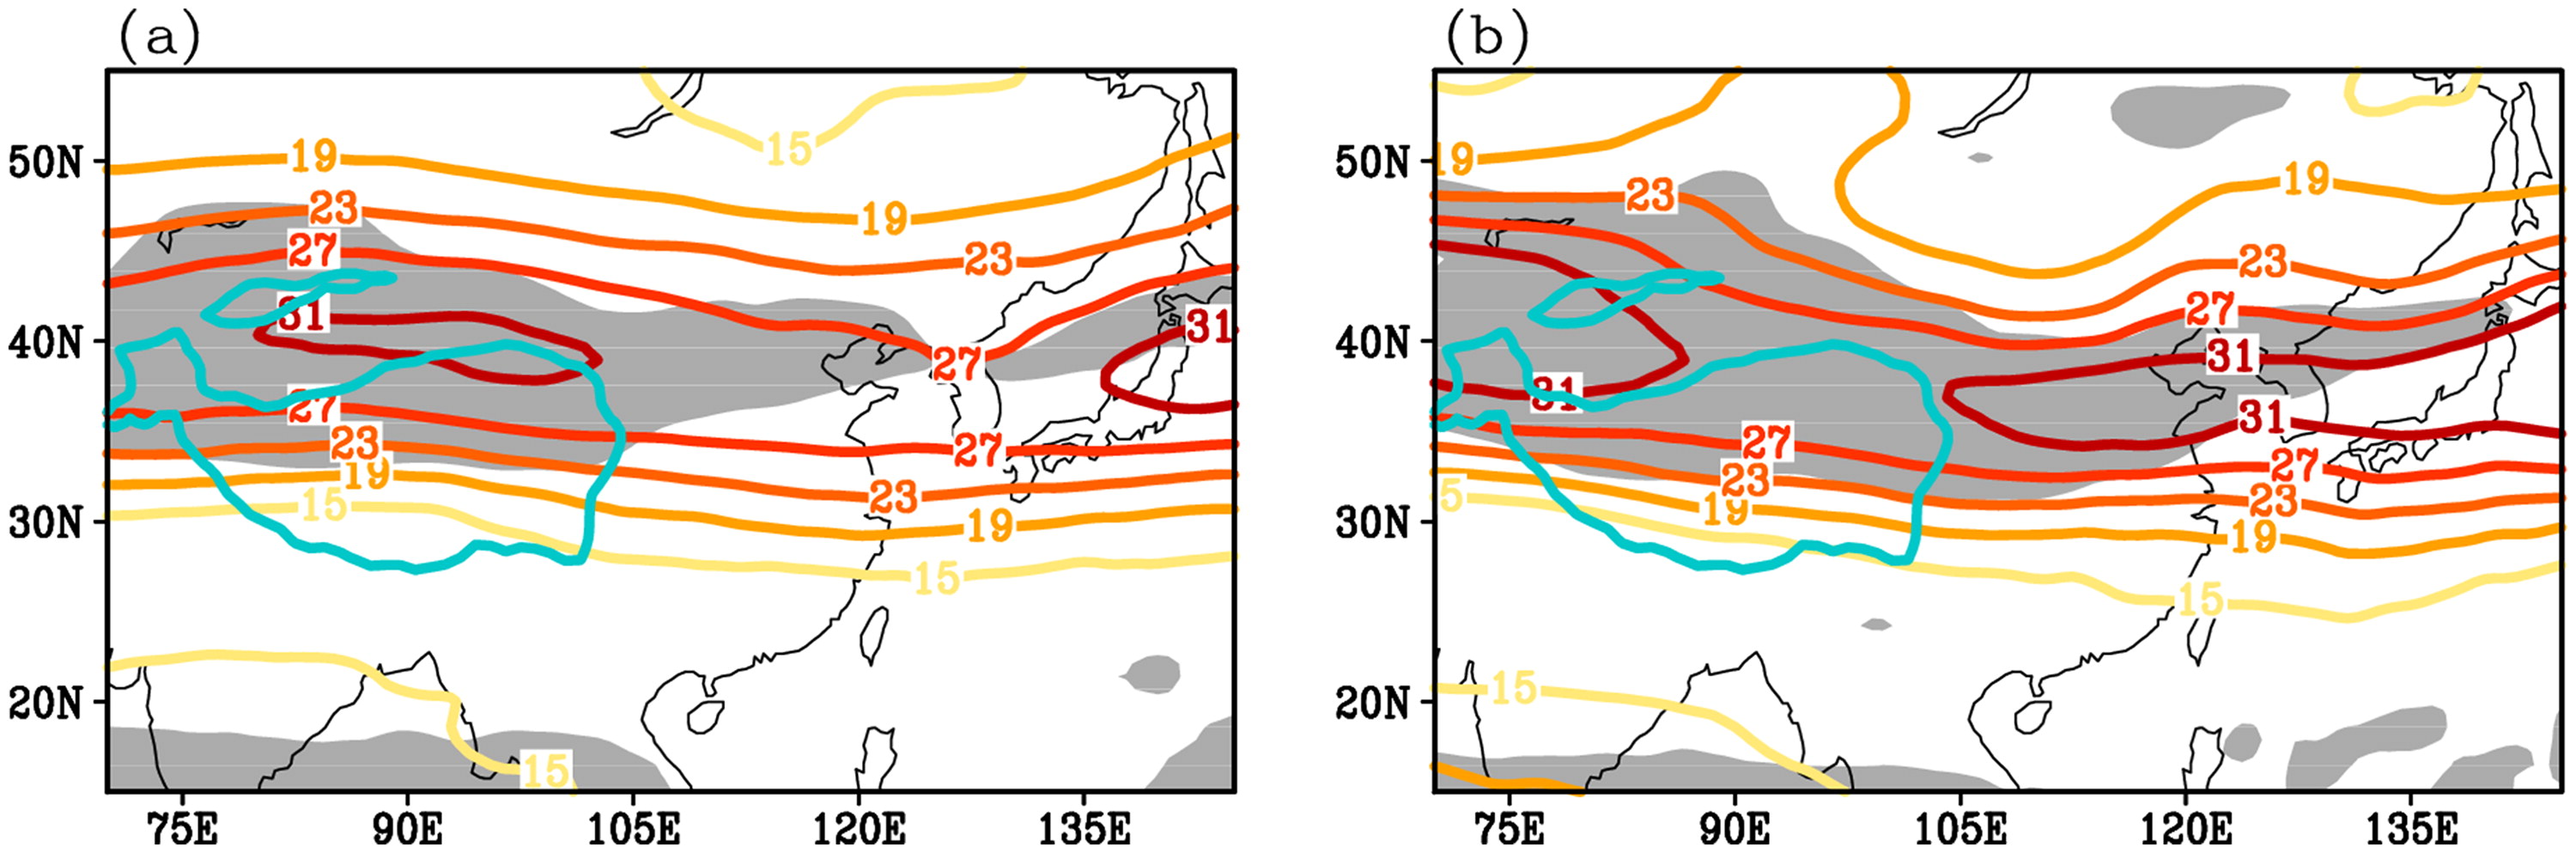
Fig. 6.
Same as Fig. 4 but for wind speed (contours; unit: m s−1) at 200 hPa. The wind speed exceeding the 90% confidence level is shaded.
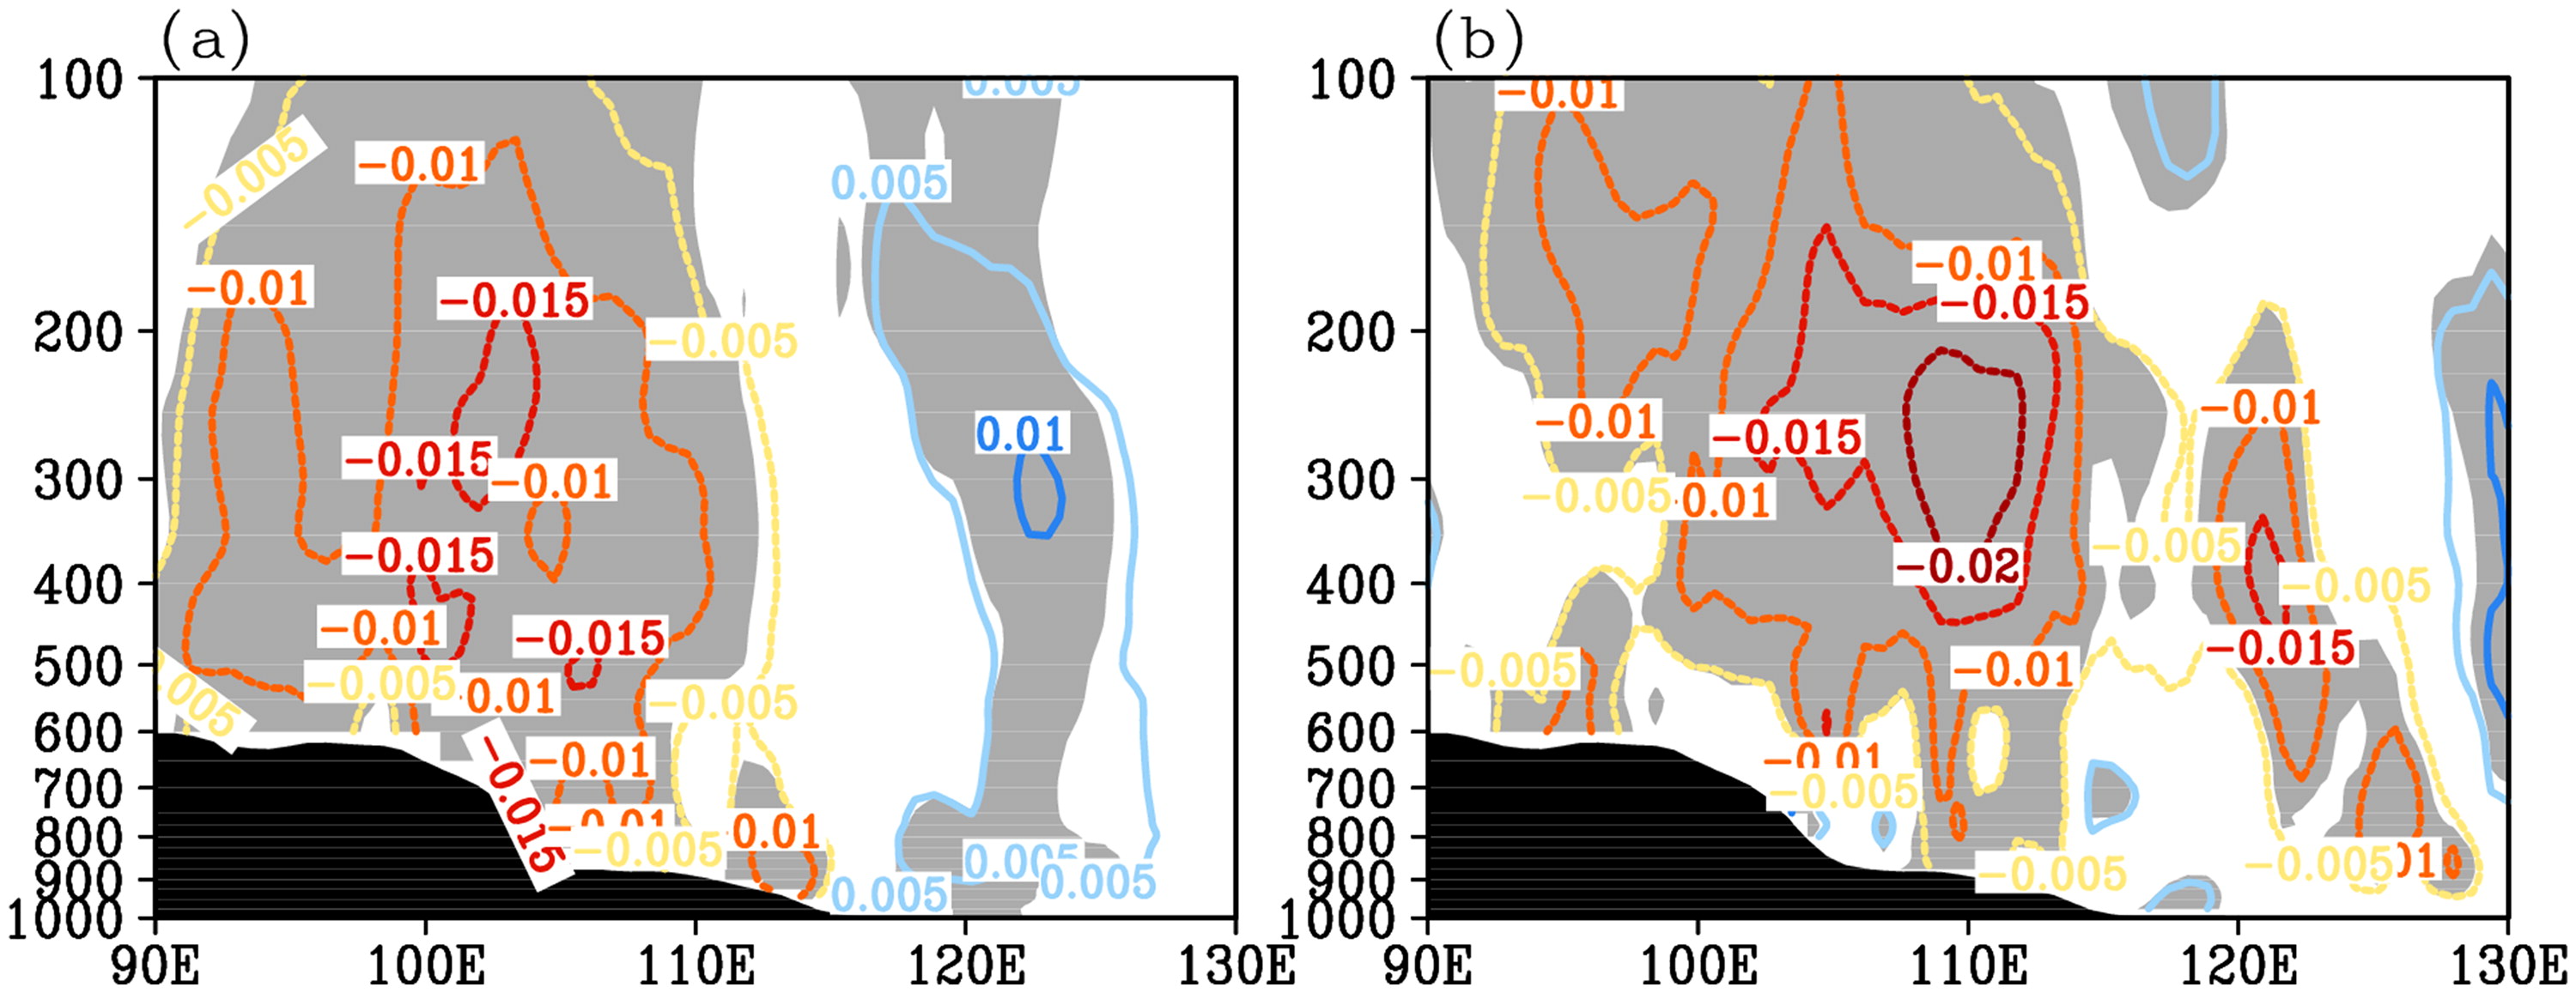
Fig. 7.
Height-longitudinal cross-sections of the anomalous vertical velocity (contours; unit: pa s−1) averaged between 30°N and 40°N in (a) situation W and (b) situation E. The grey shadings represent the areas where the vertical velocity exceeds the 90% confidence level. Black shadings indicate the topography of the Tibetan Plateau.
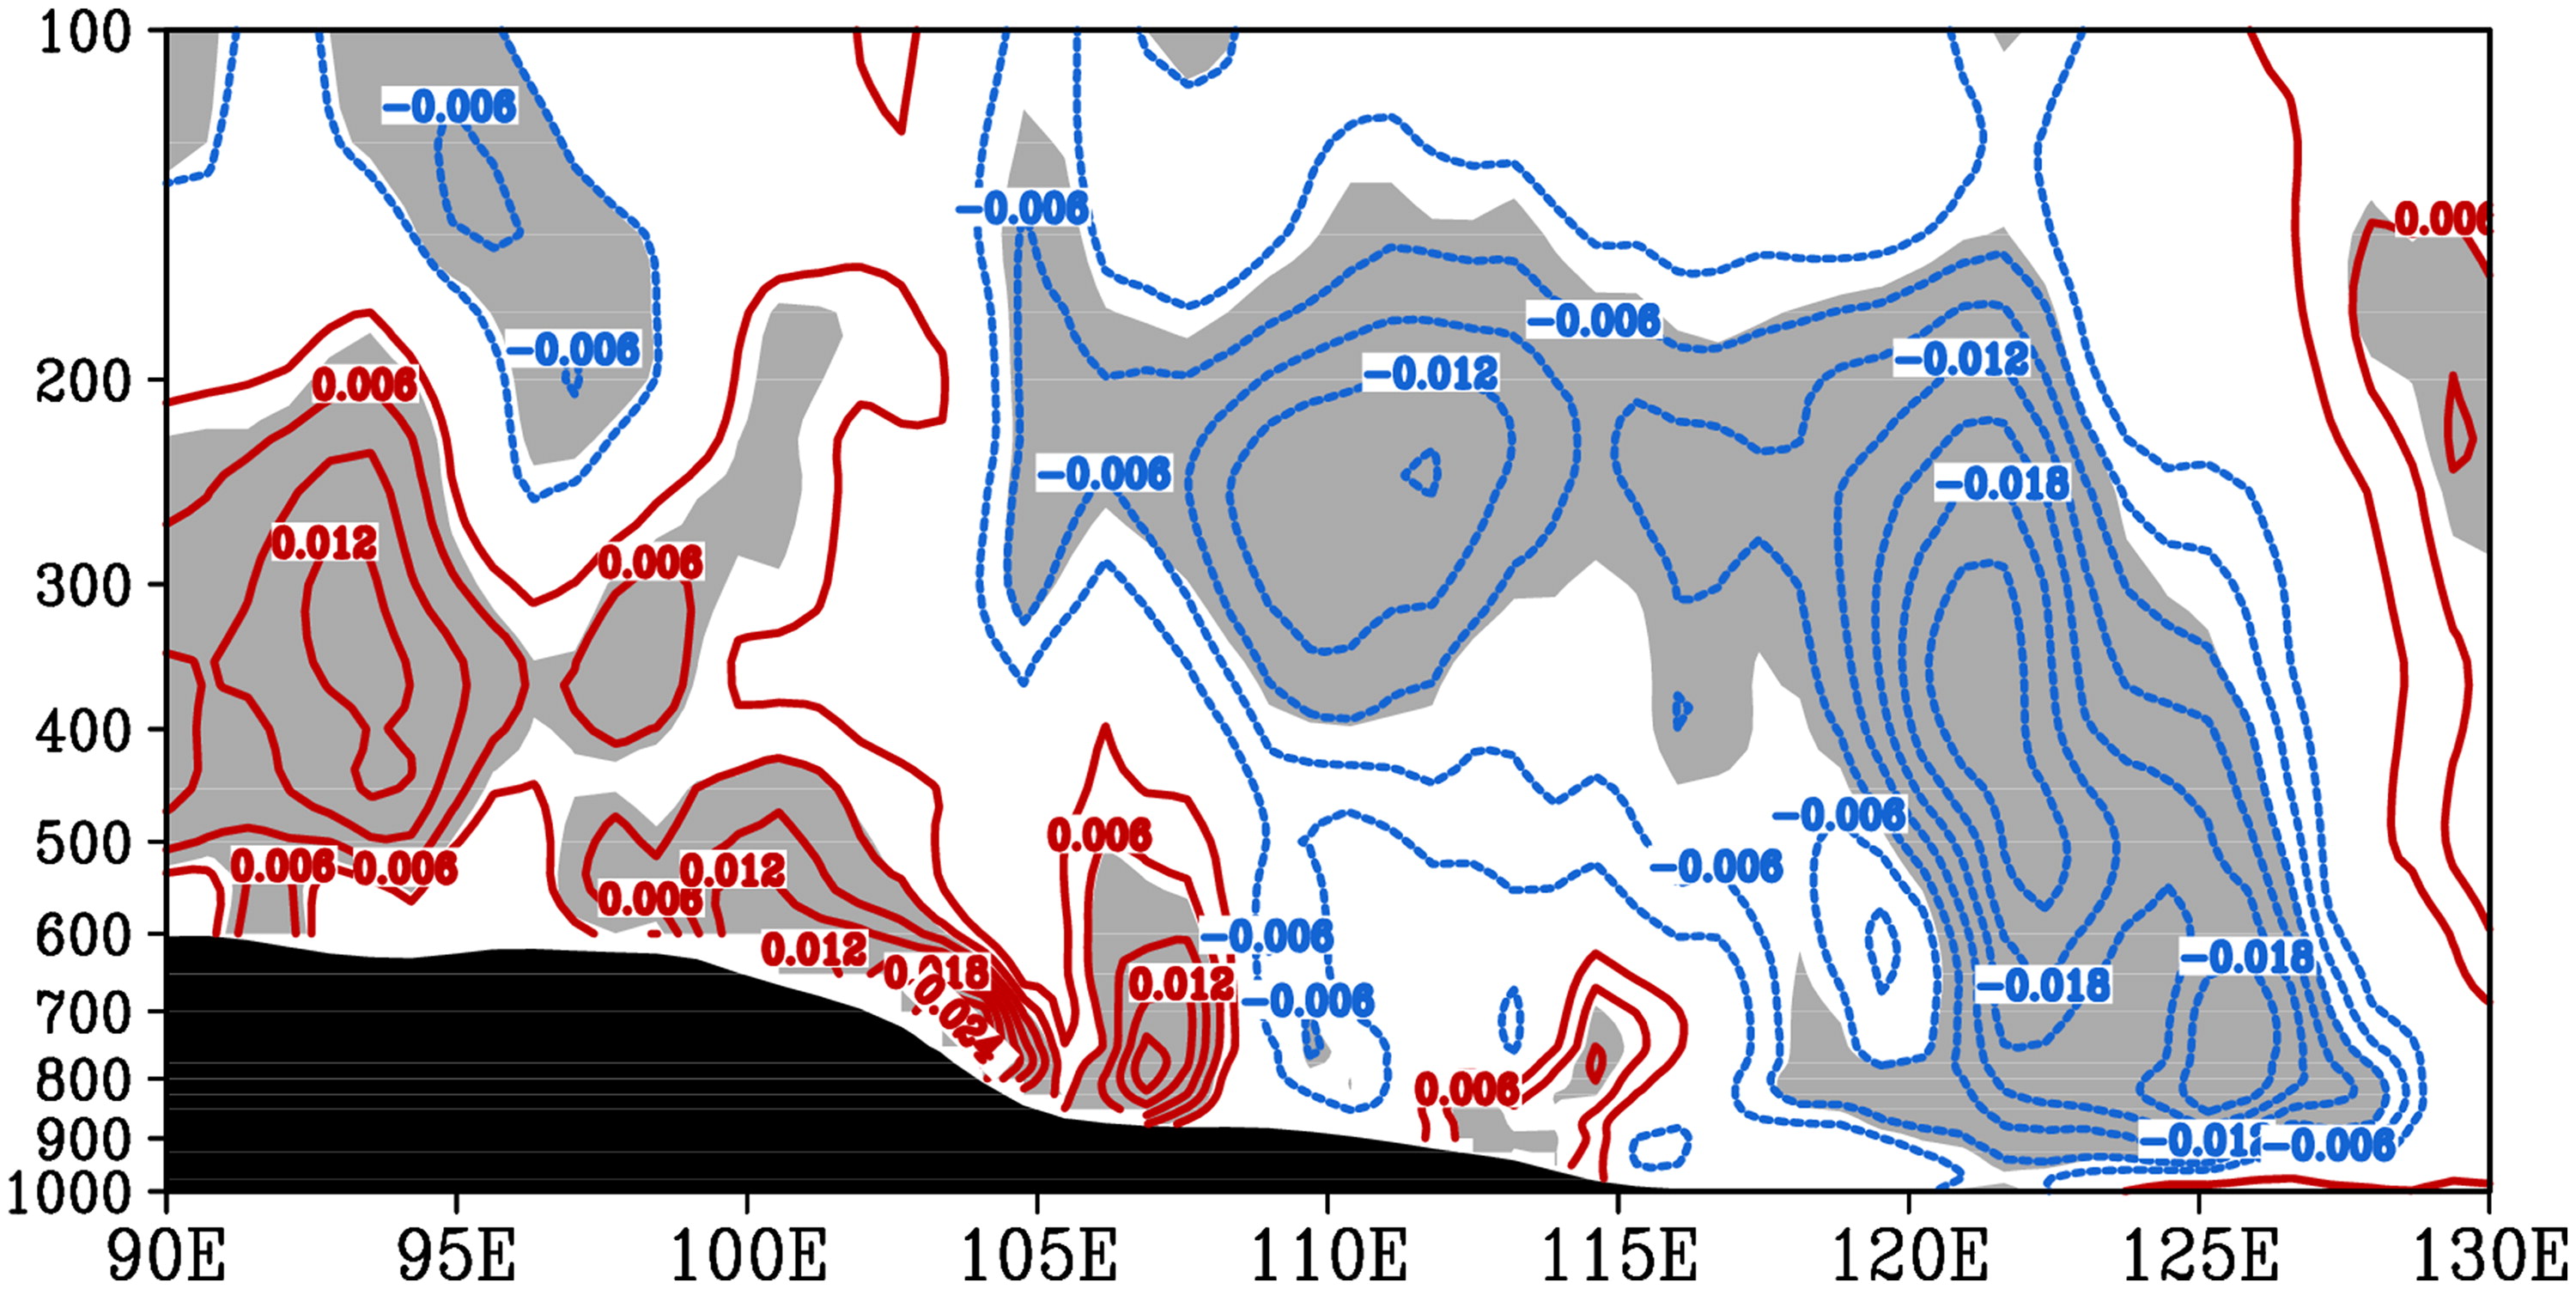
Fig. 8.
Height-longitudinal cross-sections of the difference in the anomalous vertical velocity averaged between 30°N and 40°N between situations E and W (contours; unit: pa s−1). The grey shadings represent the areas where the difference exceeds the 90% confidence level. Black shadings indicate the topography of the Tibetan Plateau.
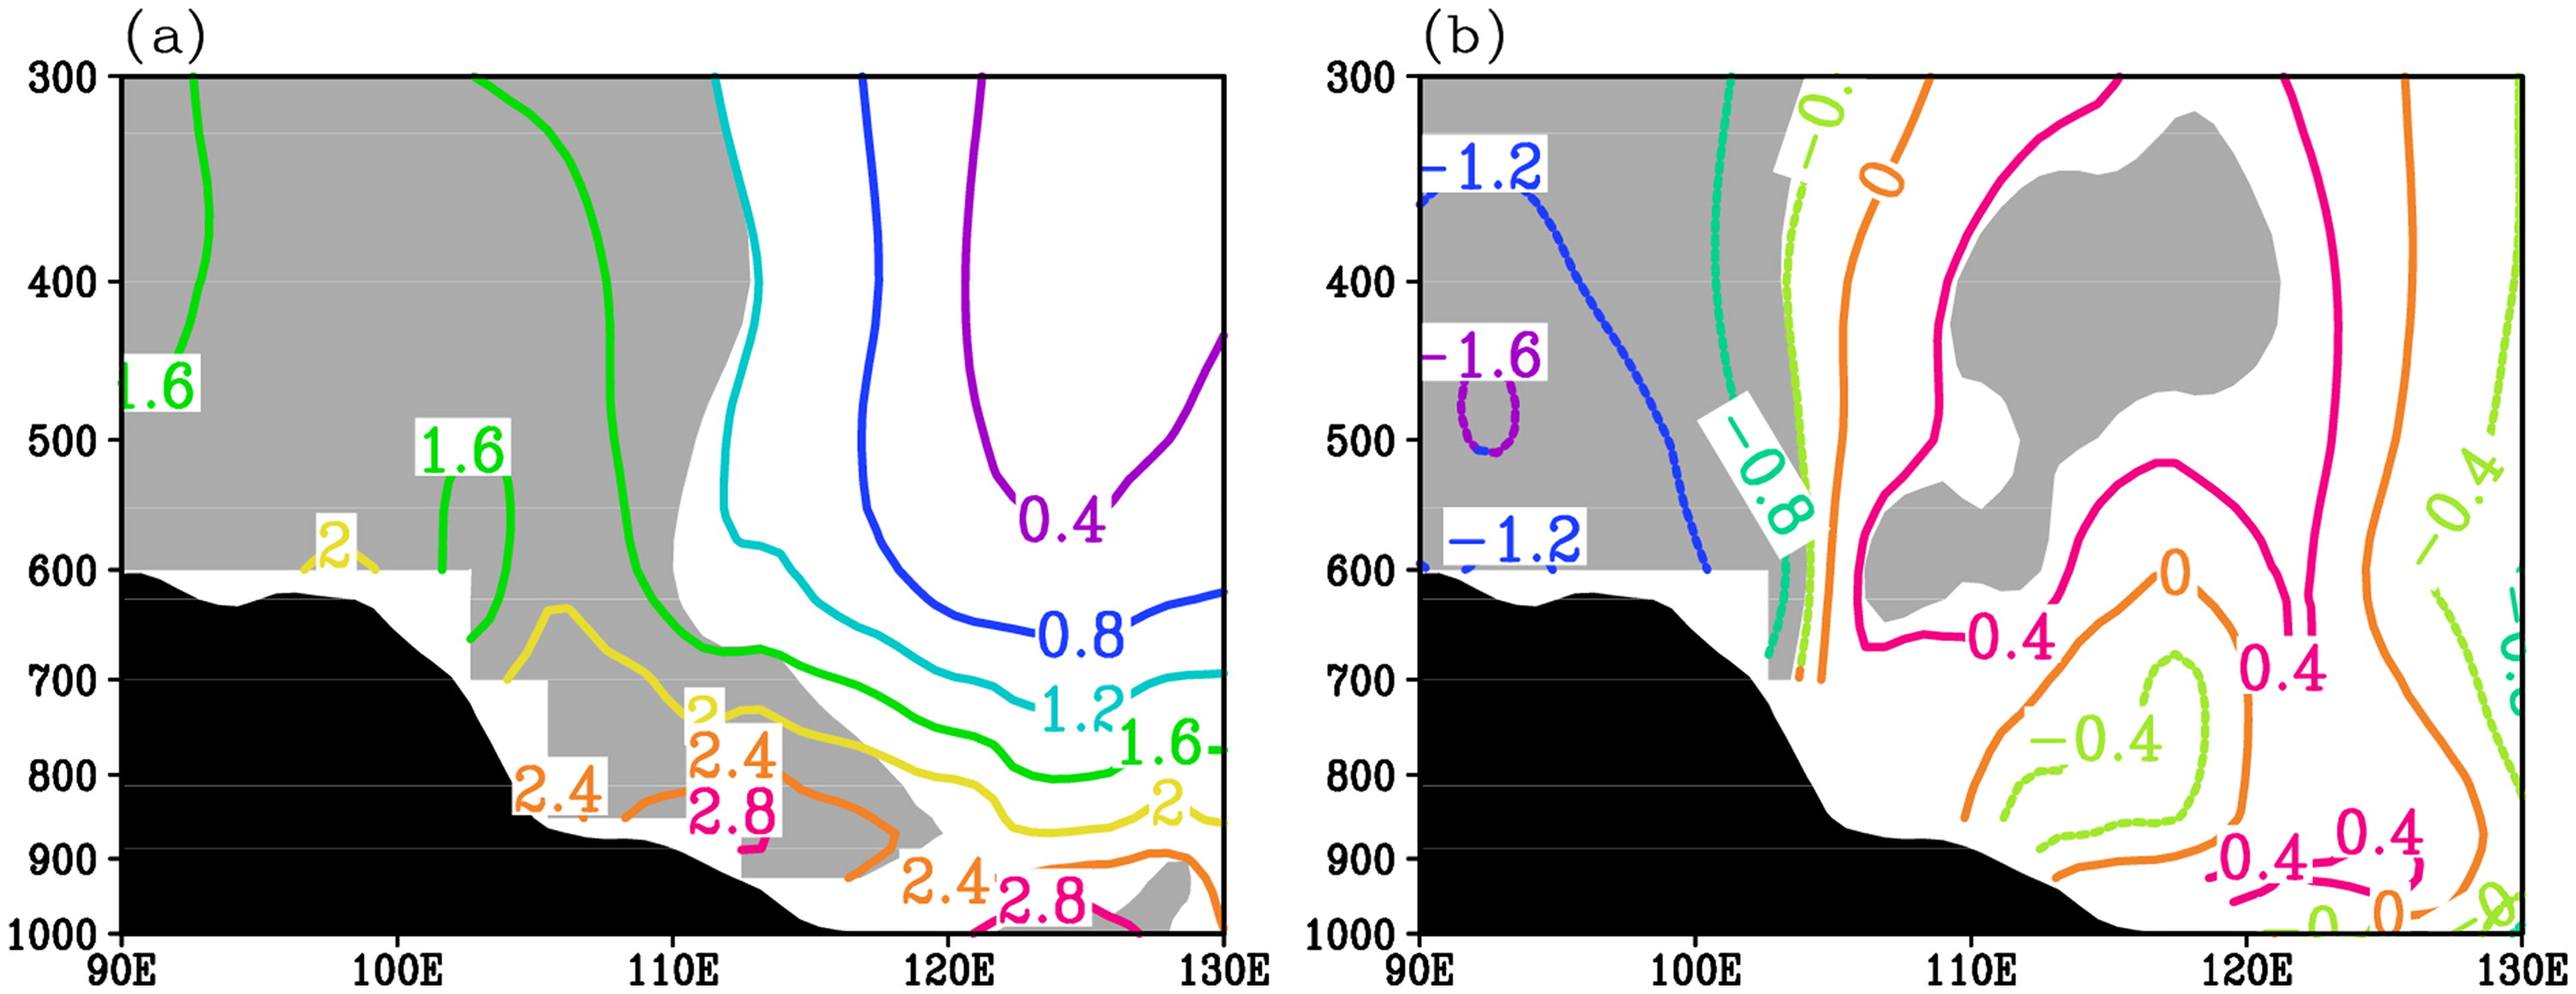
Fig. 9.
Same as Fig. 7 but for anomalous potential pseudo-equivalent temperature (θse) averaged between 30°N and 40°N (unit: K).
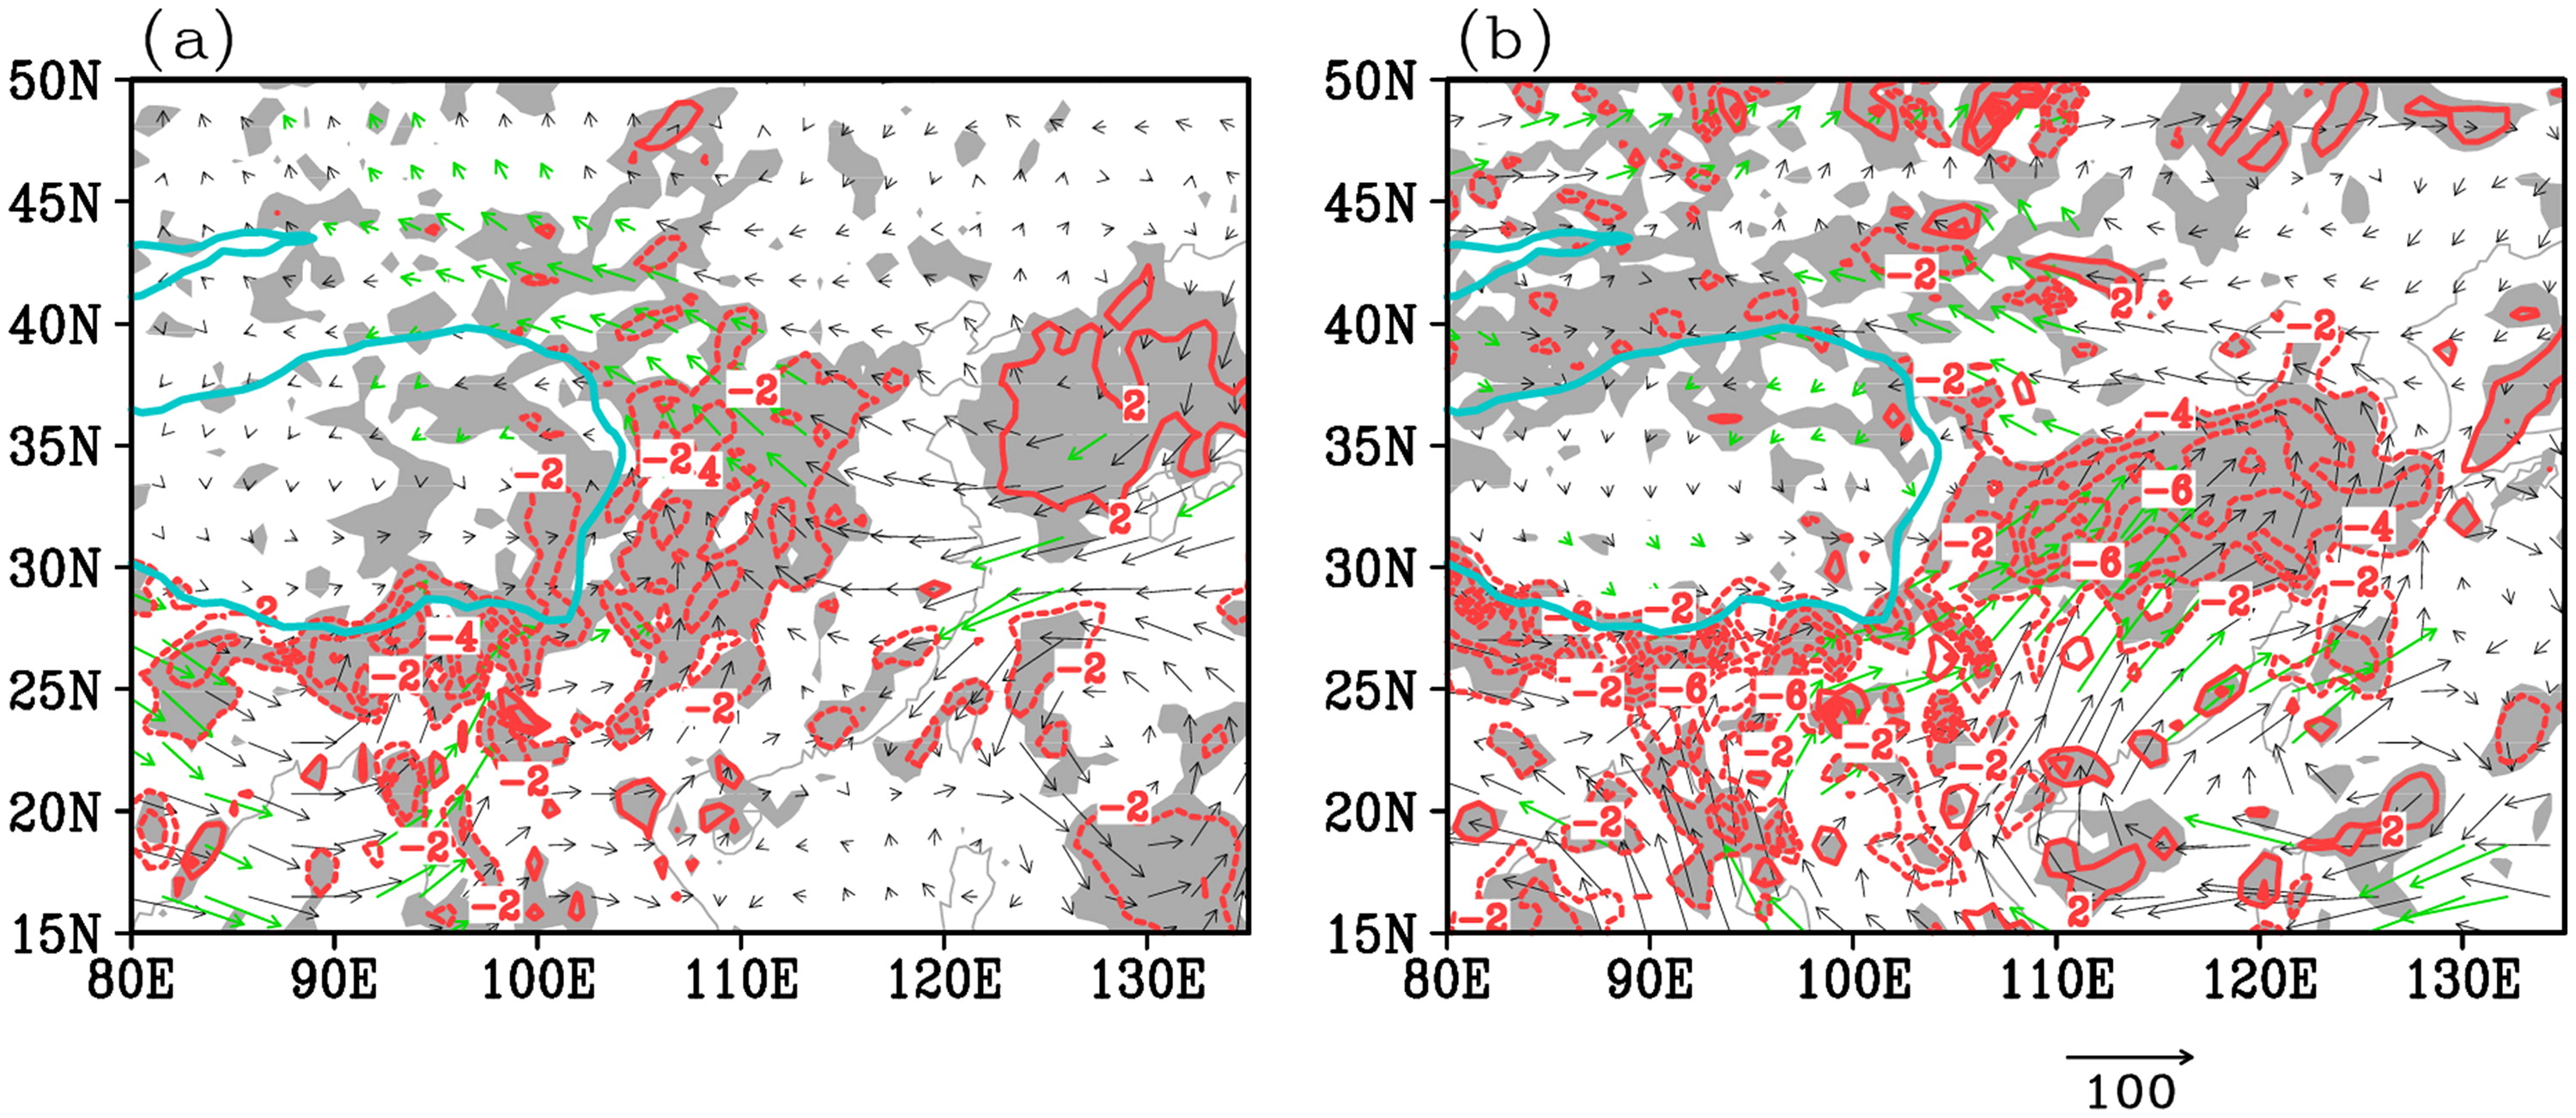
Fig. 10.
Same as Fig. 4 but for the anomalous vertically integrated water vapour flux (vectors; unit: kg m−1 s−1) and water vapour flux divergence (contours; unit: 10−5 kg m−2 s−1). Water vapour flux and water vapour flux divergence anomalies with statistical significance exceeding the 90% confidence level are expressed by green vectors and shadings, respectively.
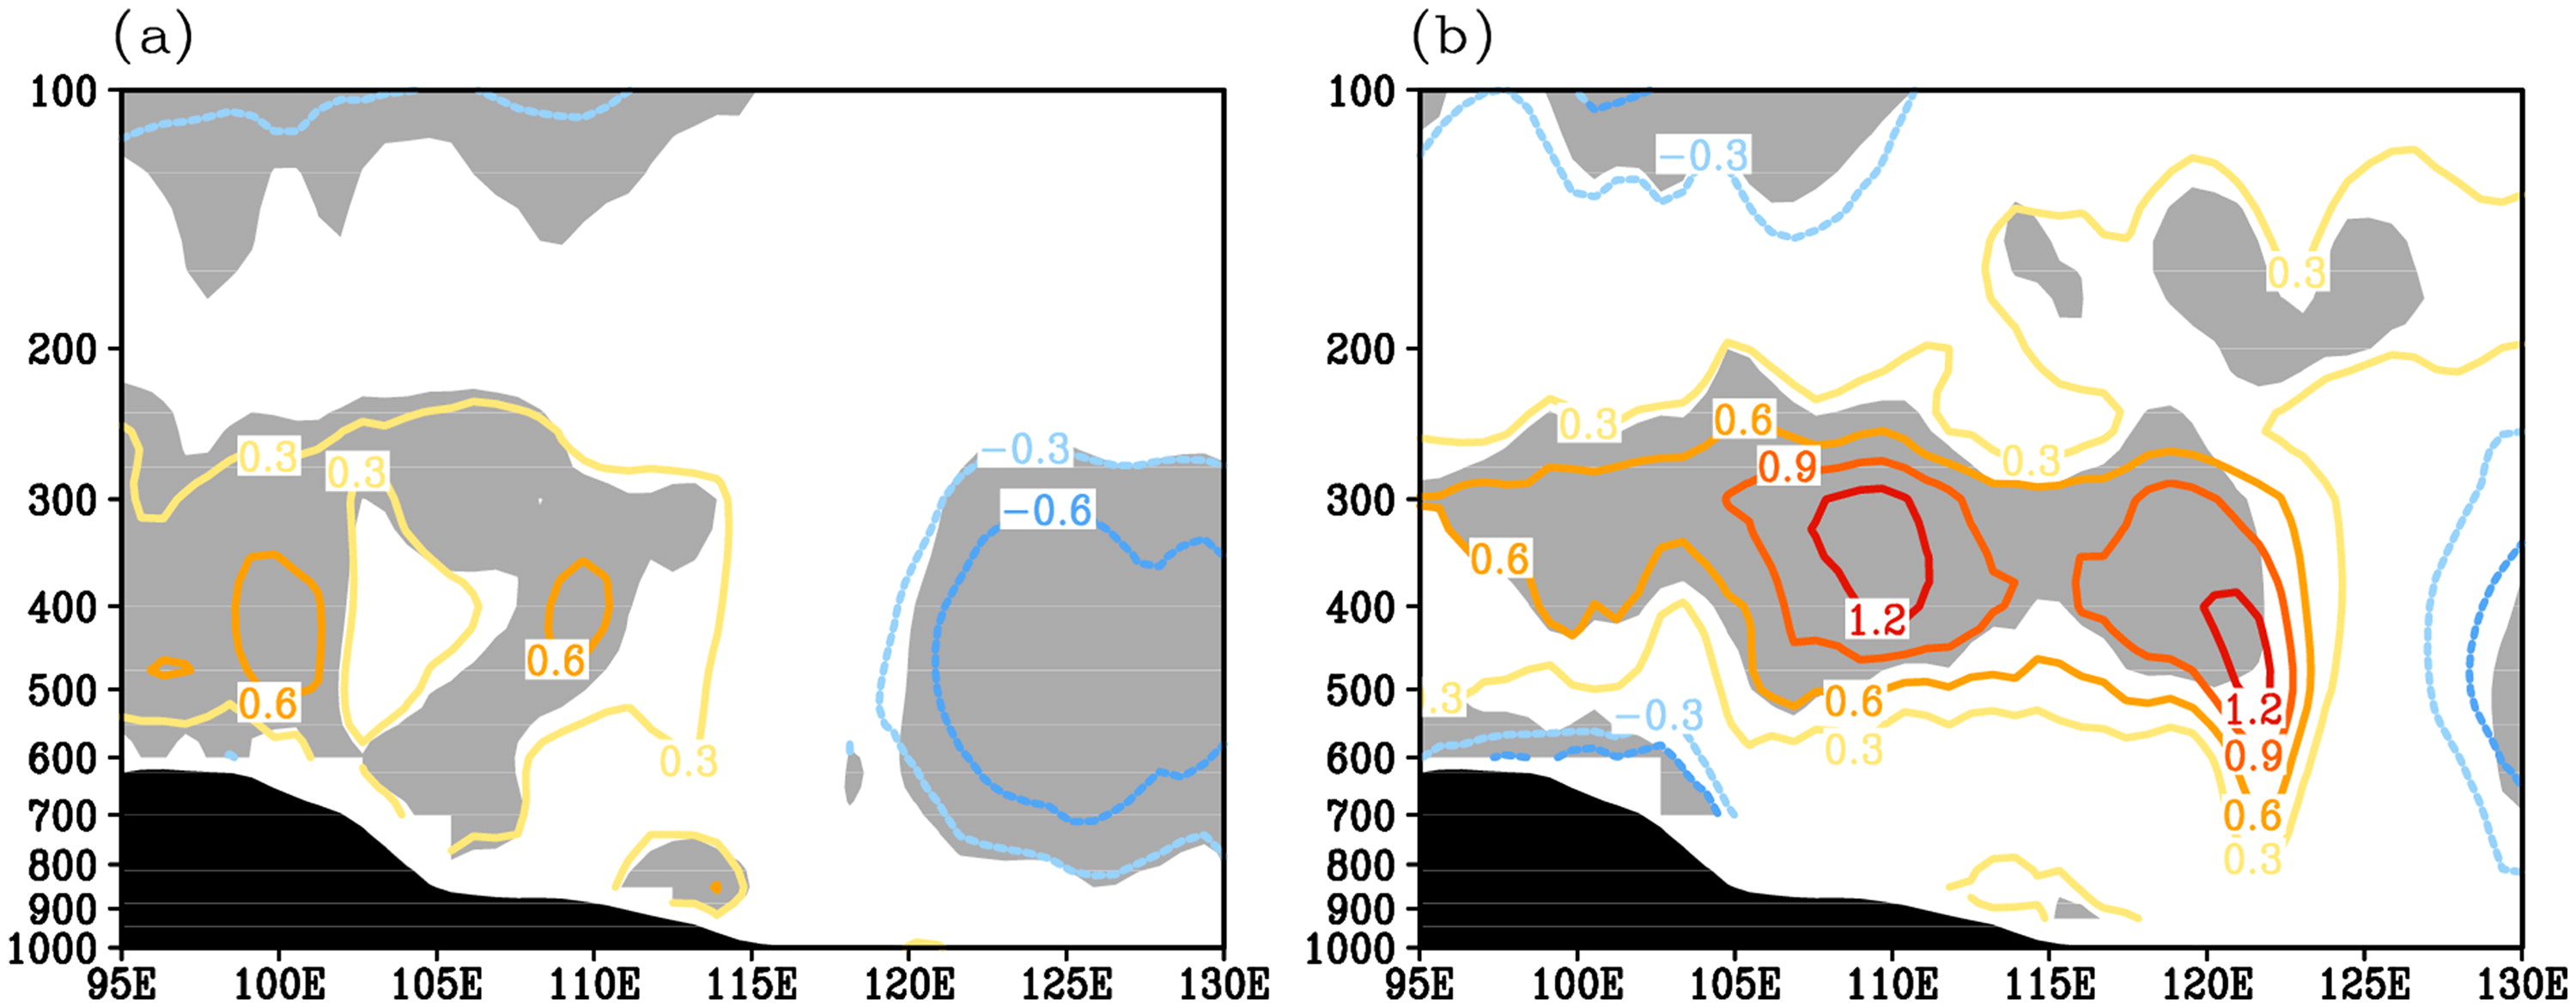
Fig. 11.
Same as Fig. 7 but for the anomalous atmospheric apparent heat source (Q1) averaged between 30°N and 40°N (unit: K d−1).
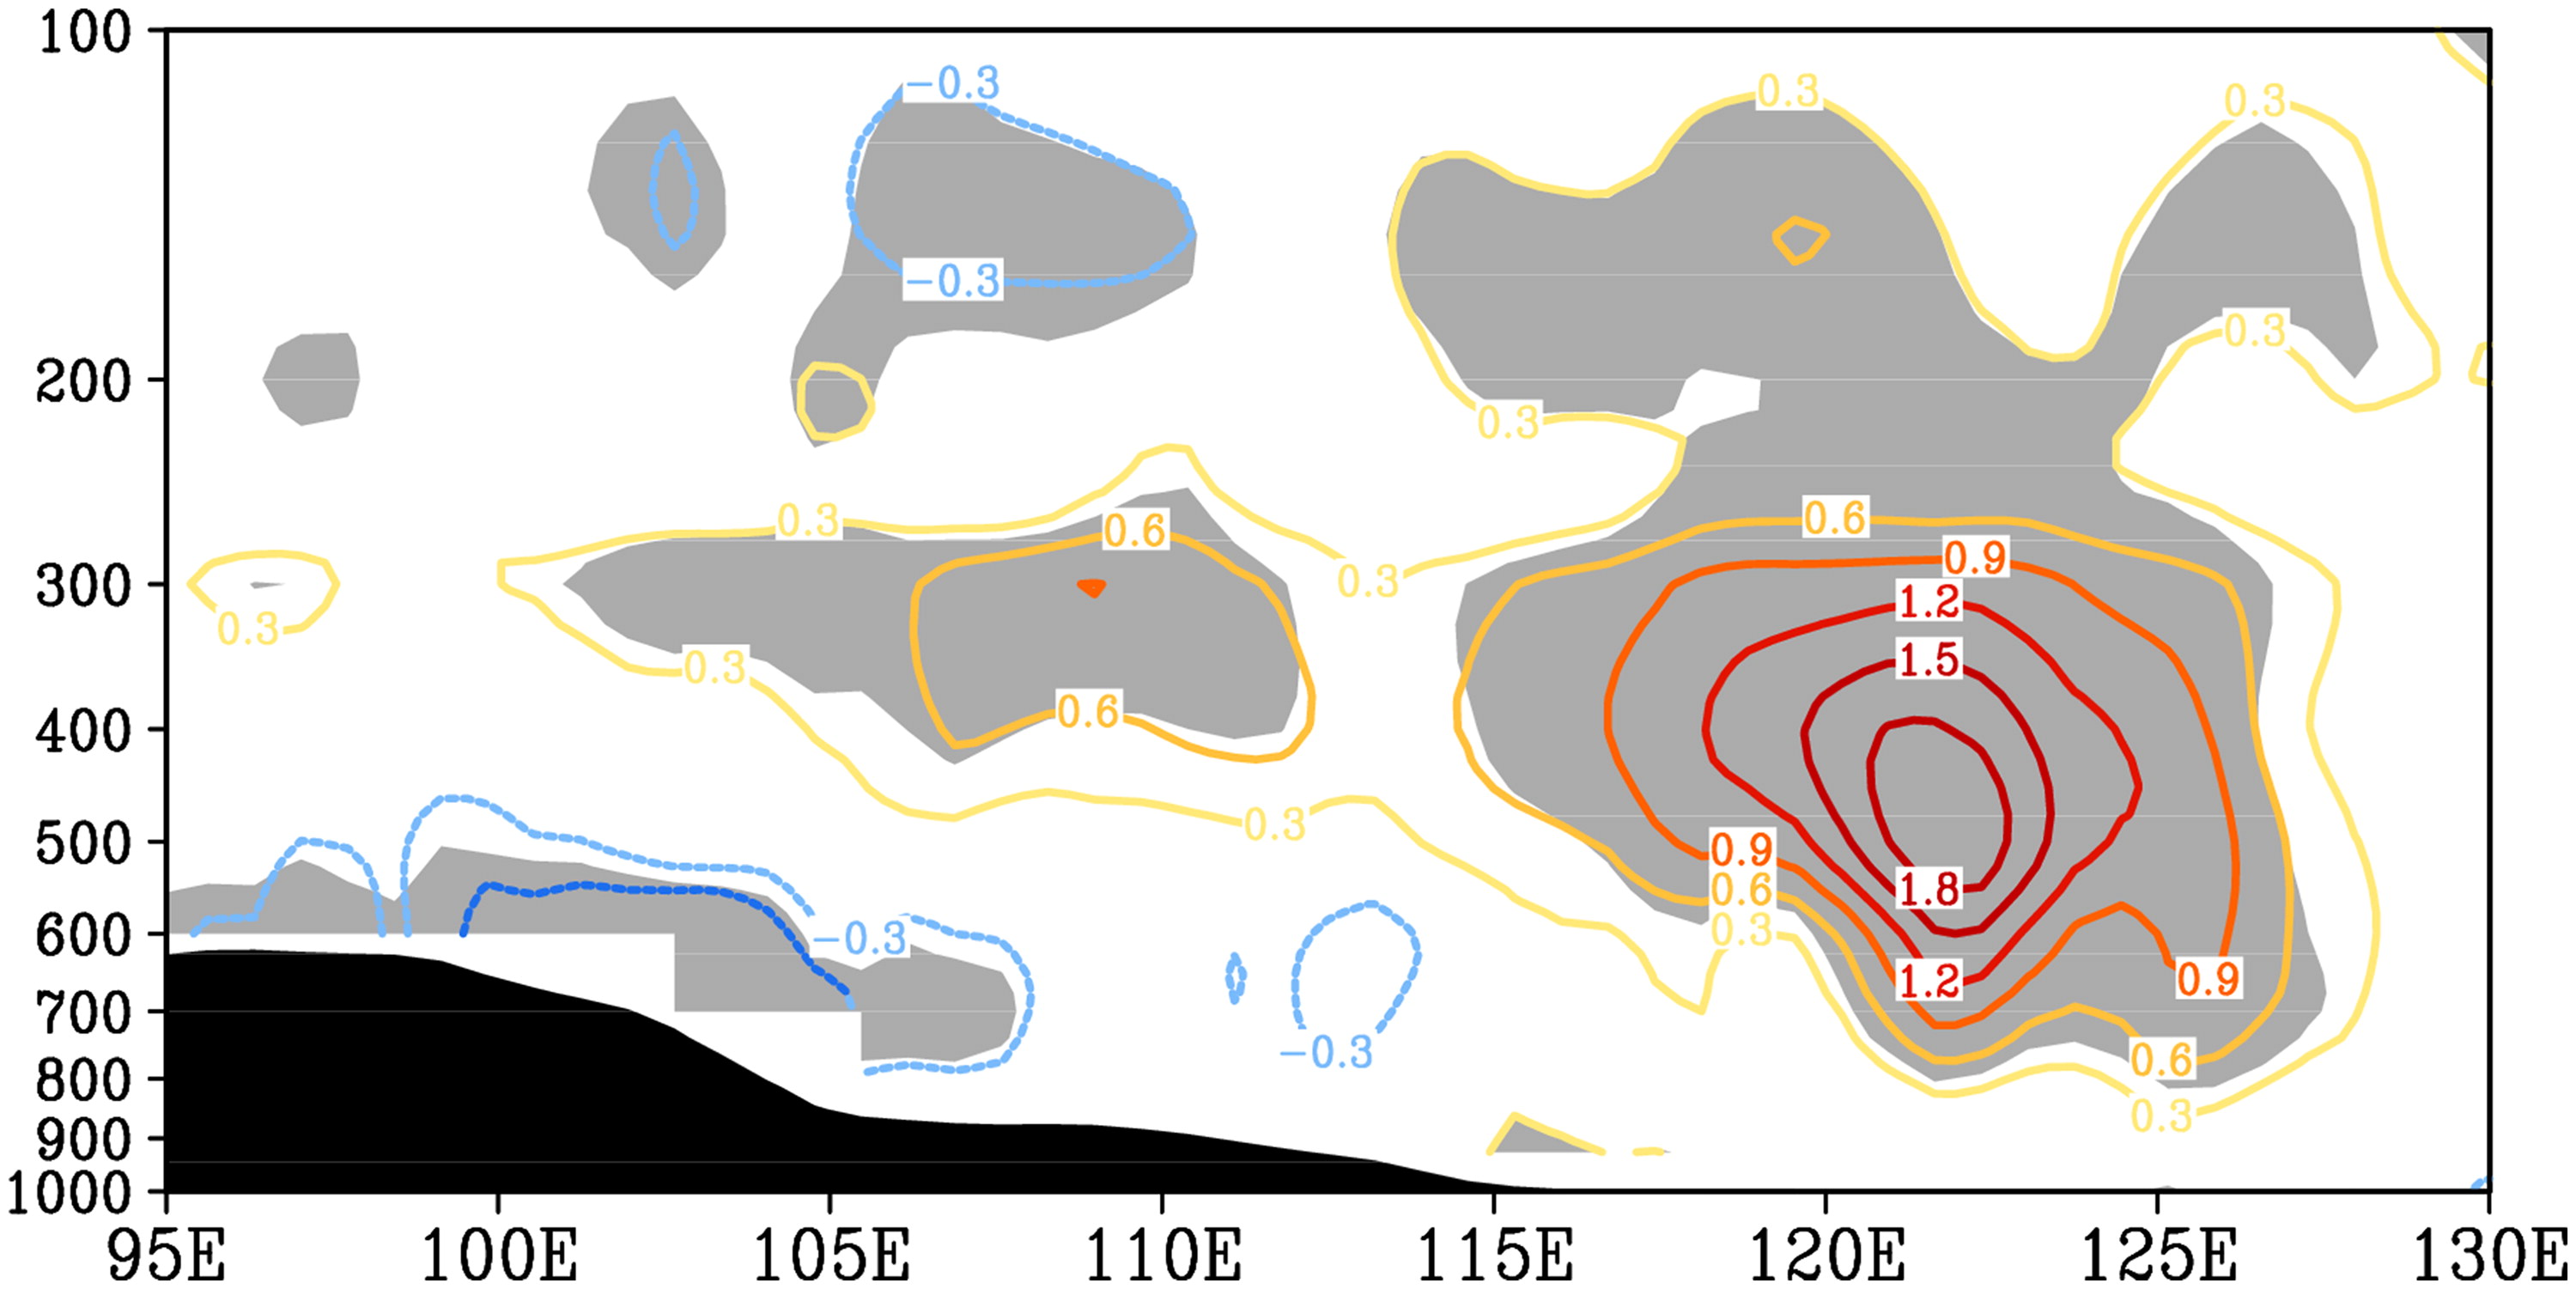
Fig. 12.
Same as Fig. 8 but for the anomalous atmospheric apparent heat source (Q1) averaged between 30°N and 40°N (unit: K d−1).